

Postoperative Nausea and Vomiting Prediction: Machine Learning Insights from a Comprehensive Analysis of Perioperative Data
 , ,
, ,
Abstract
:1. Introduction
2. Materials and Methods
2.1. Study Design
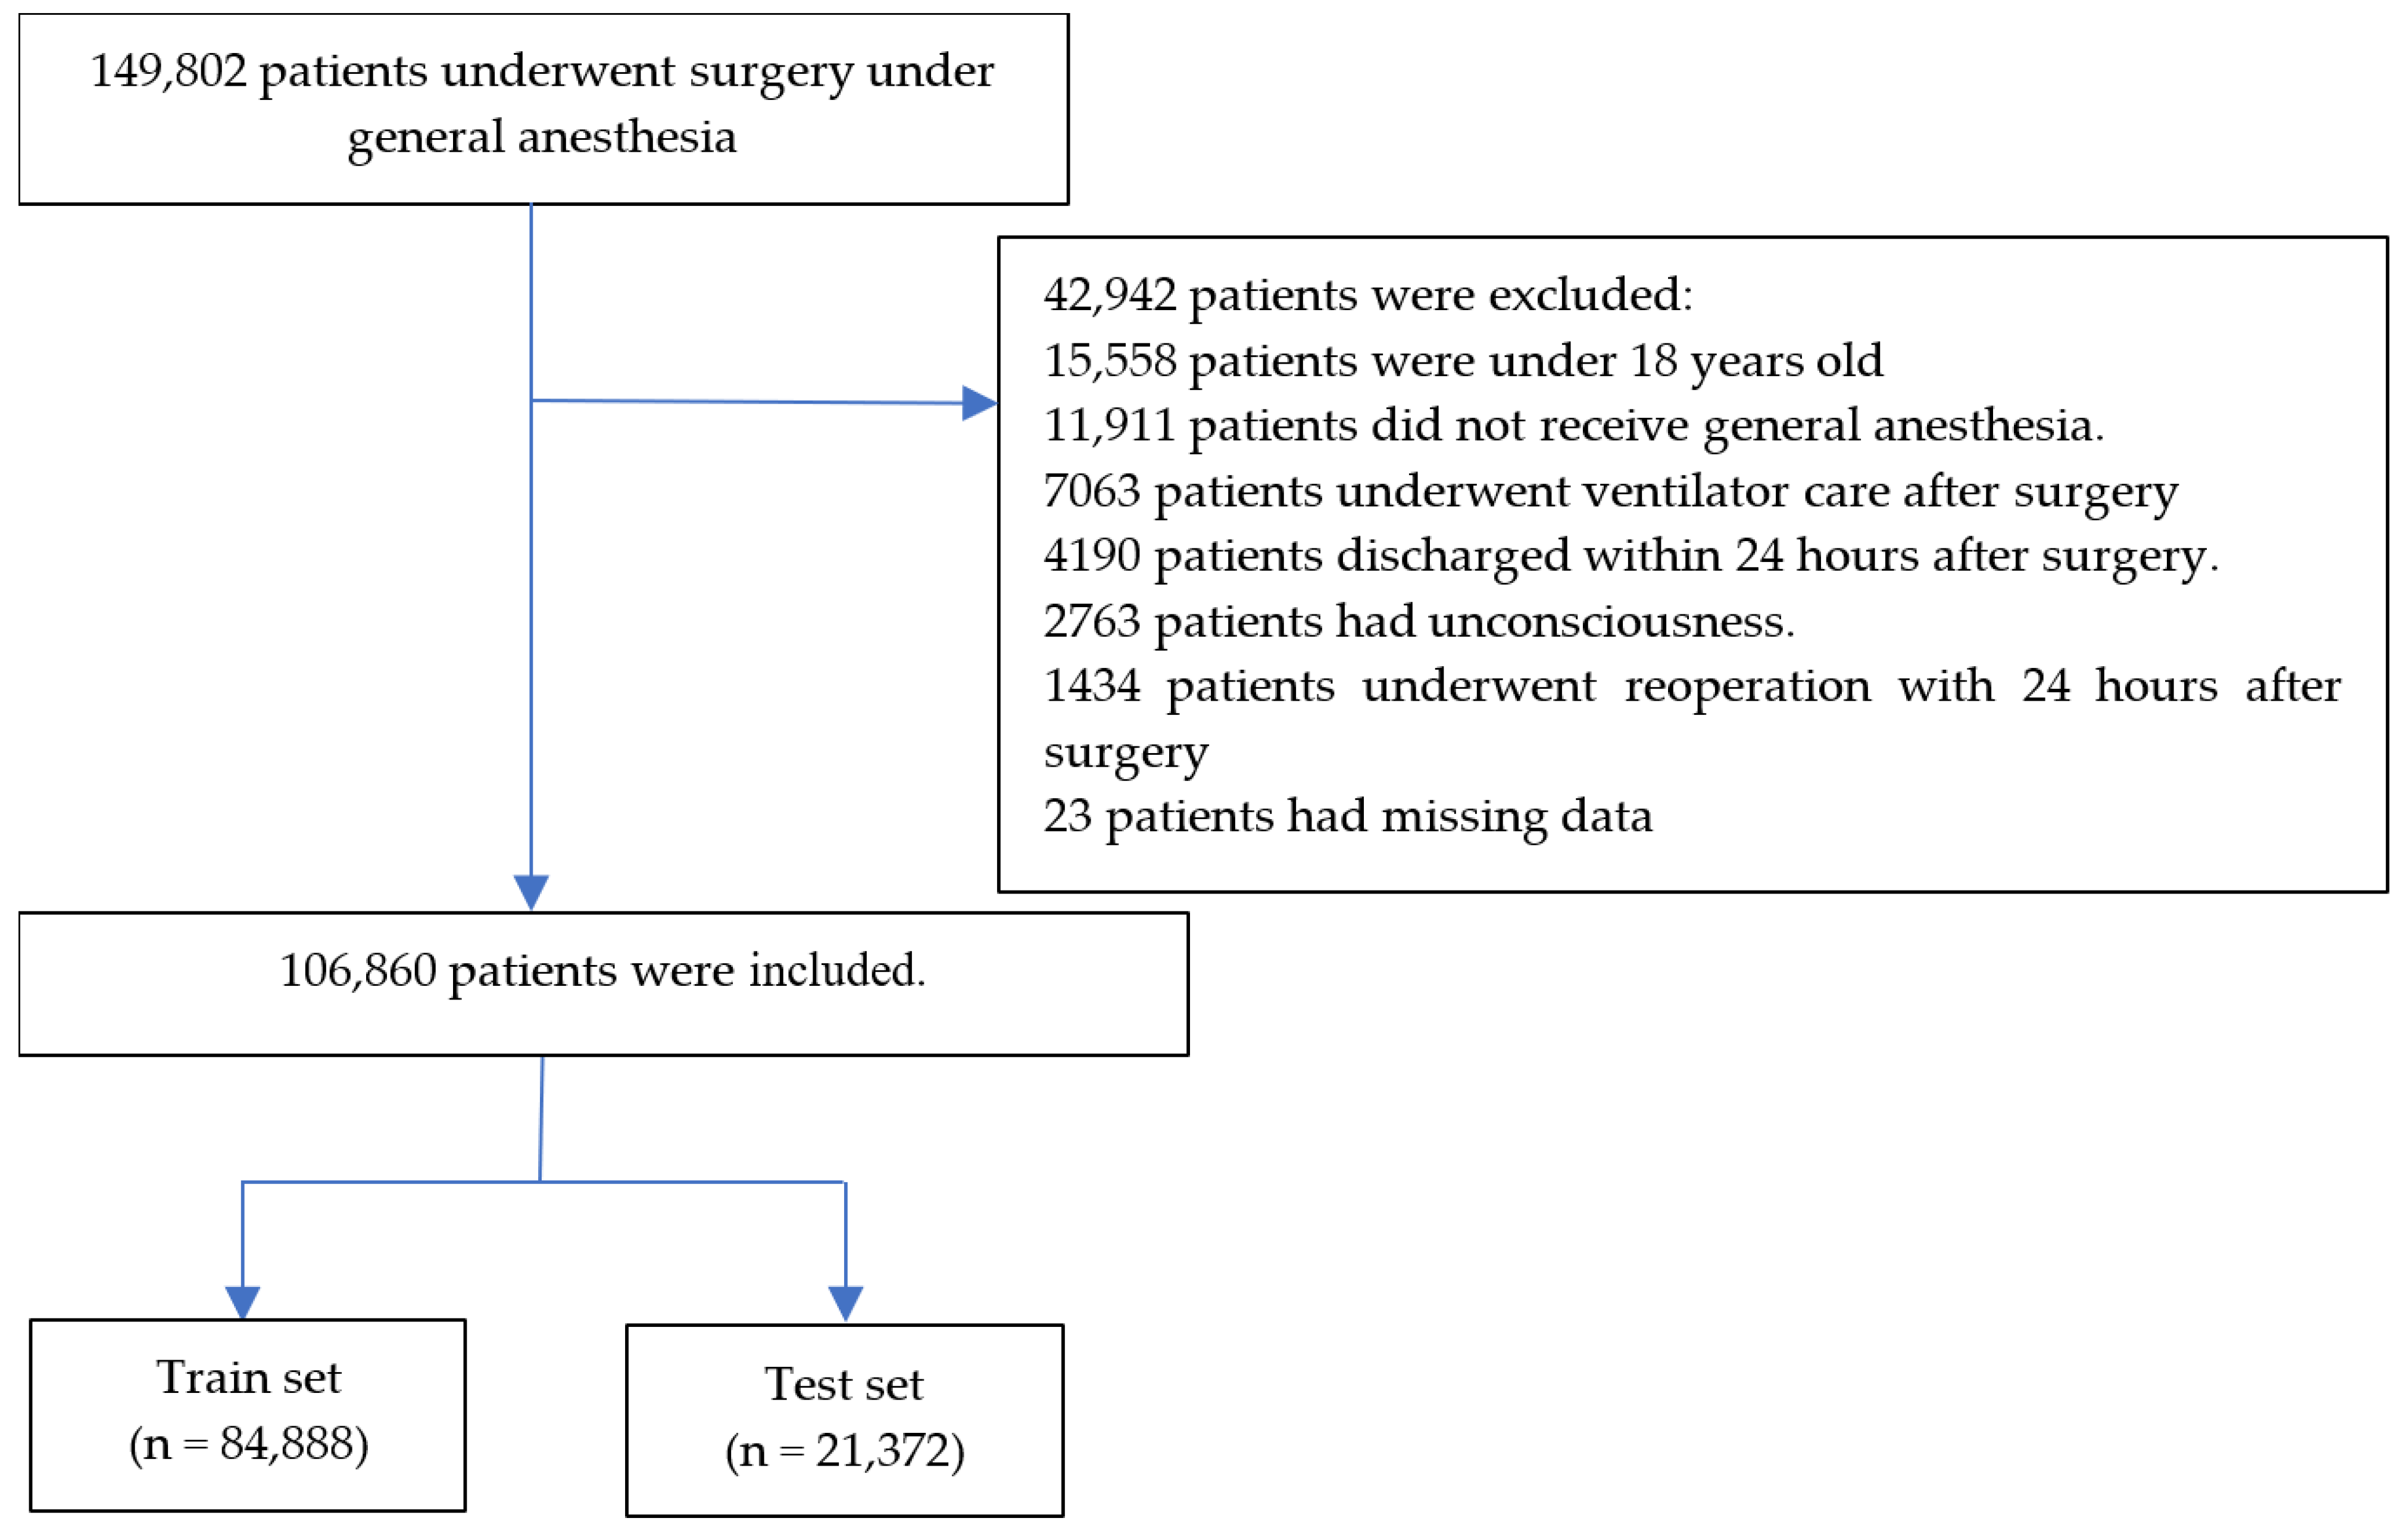
2.2. Participants
2.3. Postoperative Nausea and Vomiting
2.4. Other Features
2.5. Data Preprocessing
2.6. Machine Learning
2.7. Statistics
3. Results
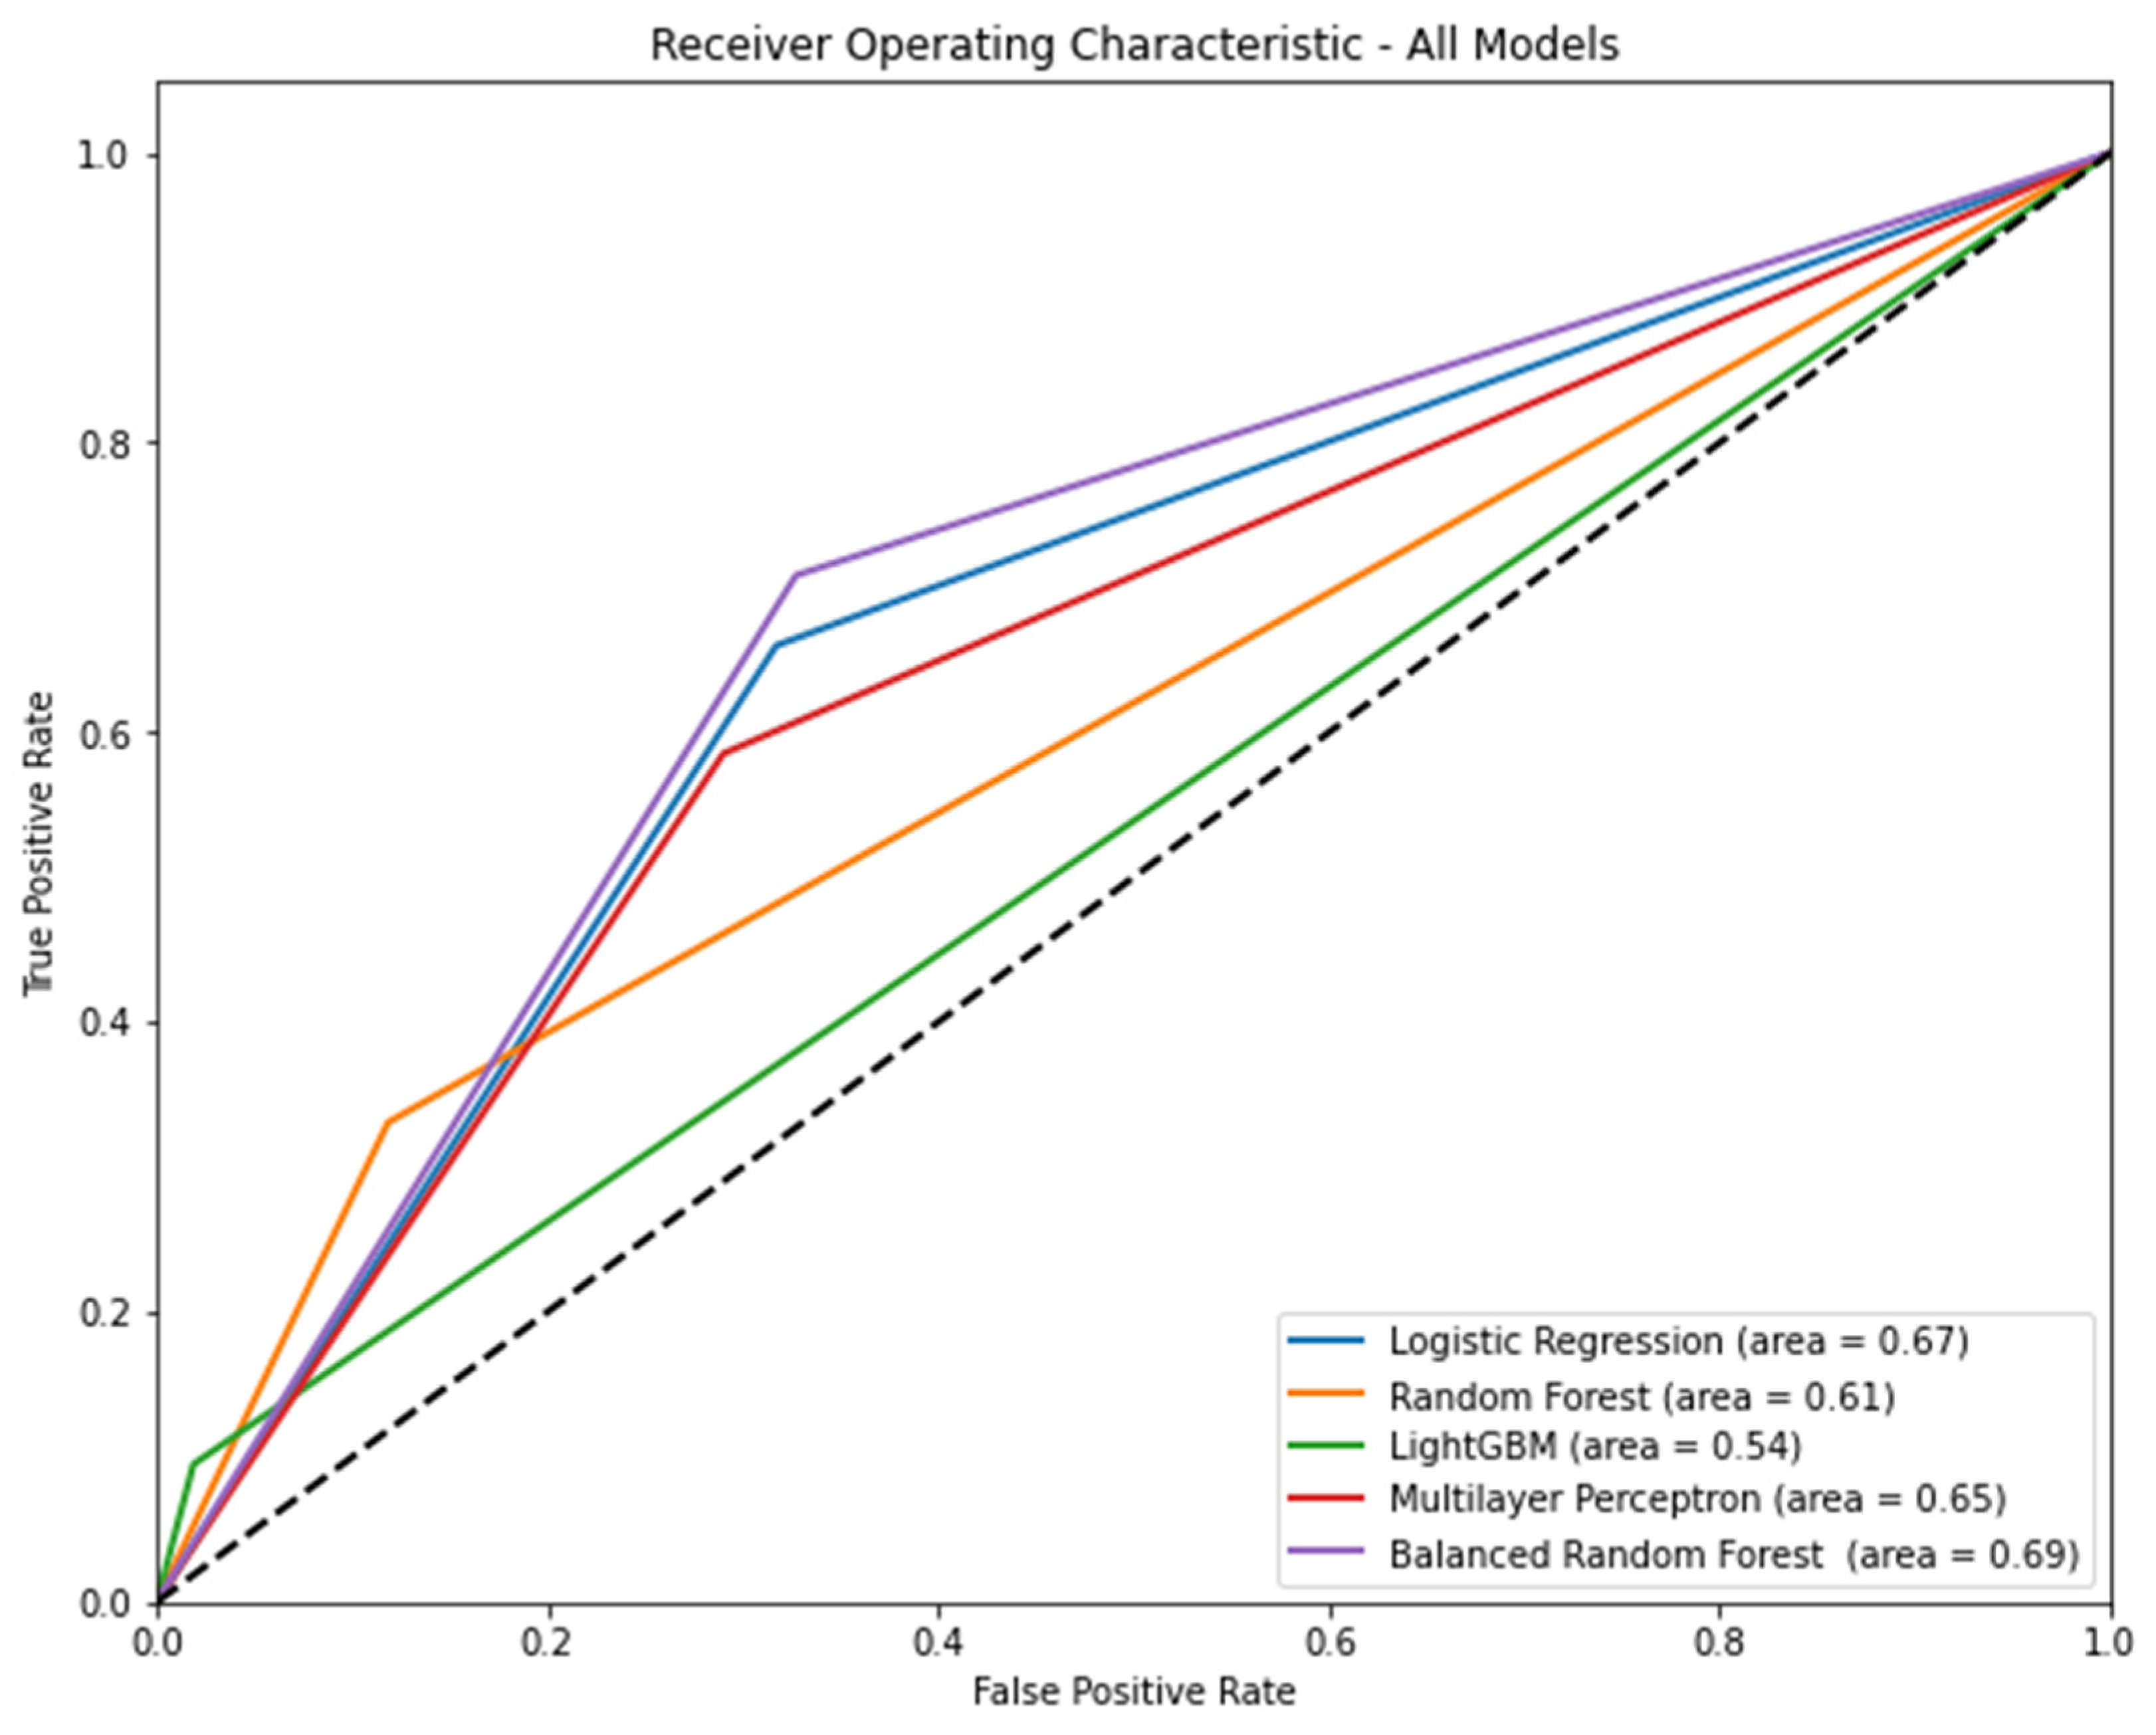
3.1. Performance of Models, including All Features
3.2. Performance of Models, including 10 Known Risks and Mitigating Factors
3.3. Feature Importance
- Our models acknowledged that including only known risk and mitigating factors did not exhibit strong performance and, in some cases, showed worse metrics than the models with all features. This limitation suggests that there may be unaccounted factors contributing to PONV that are not captured solely by known risks and mitigating factors.
- Although our study included a substantial number of patients, data were obtained from only two hospitals. This may raise questions regarding the diversity of patient populations and medical practices, potentially affecting the generalizability of the models to other healthcare settings.
- Some studies referenced for comparison had outdated data, which might not accurately reflect the current landscape of anesthesia and surgery. This emphasizes the importance of continuously updating the models based on recent data.
- This study highlighted the challenges of feature selection and the potential impacts of excluding informative features. However, further insight into the specific criteria and methods used for feature selection would enhance the transparency of the model development process.
4. Conclusions
Author Contributions
Funding
Institutional Review Board Statement
Informed Consent Statement
Data Availability Statement
Conflicts of Interest
Appendix A
| Listing A1. Definition of hyperparameter search space for each algorithm. |
| #Define the hyperparameter search space for each algorithm. param_dist_logreg = { ‘C’: [0.001, 0.01, 0.1, 1, 10, 100], ‘penalty’: [‘l1′, ‘l2′], ‘solver’: [‘liblinear’, ‘saga’], ‘max_iter’: [100, 200, 300, 500] } param_dist_rf = { ‘n_estimators’: [100, 200, 300, 500], ‘criterion’: [‘gini’, ‘entropy’], ‘max_depth’: [None, 5, 10, 20, 30], ‘min_samples_split’: [2, 5, 10], ‘min_samples_leaf’: [1, 2, 4], ‘class_weight’: [None, ‘balanced’, ‘balanced_subsample’] } param_dist_svm = { ‘C’: [0.001, 0.01, 0.1, 1, 10, 100], ‘kernel’: [‘linear,’ ‘poly, ‘ ‘rbf,’ ‘sigmoid’], ‘gamma’: [‘scale’, ‘auto’, 0.001, 0.01, 0.1, 1, 10, 100], } param_dist_lgbm = { ‘learning_rate’: [0.01, 0.1, 0.3], ‘n_estimators’: [100, 200, 300], ‘max_depth’: [3, 5, 7, −1], ‘num_leaves’: [31, 50, 100, 200], ‘subsample’: [0.8, 0.9, 1.0], ‘colsample_bytree’: [0.8, 0.9, 1.0], ‘reg_alpha’: [0, 0.01, 0.1], ‘reg_lambda’: [0, 0.01, 0.1] } param_dist_mlp = { ‘hidden_layer_sizes’: [(50,), (100,), (50, 50), (100, 50)], ‘activation’: [‘relu’, ‘logistic’], ‘solver’: [‘adam’, ‘sgd’], ‘learning_rate’: [‘constant, ‘ ‘invscaling, ‘ ‘adaptive’], ‘alpha’: [0.0001, 0.001, 0.01], ‘batch_size’: [16, 32, 64], ‘max_iter’: [100, 200, 300] }. |
Appendix B

| Logistic Regression | Random Forest | Light Gradient Boosting Machine | Multi-Layer Perceptron | Balanced Random Forest | |||||
|---|---|---|---|---|---|---|---|---|---|
| Feature | Score | Feature | Score | Feature | Score | Feature | Score | Feature | Score |
| Age, year | 0.014329 | Age, year | 0.014209 | Age, year | 0.010966 | Age, year | 0.011432 | Age, year | 0.035396 |
| Female | 0.150907 | Female | 0.133513 | Female | 0.09546 | Female | 0.057632 | Female | 0.109128 |
| Body mass index | 0.010811 | Body mass index | 0.006313 | Body mass index | 0 | Body mass index | 0.007466 | Body mass index | 0.004668 |
| Alcohol | 0.055069 | Alcohol | 0.039759 | Alcohol | 0.023542 | Alcohol | 0.019388 | Alcohol | 0.032532 |
| Smoking | 0.063328 | Smoking | 0.068043 | Smoking | 0.043676 | Smoking | 0.025659 | Smoking | 0.052161 |
| Congestive heart failure | 0.01305 | Congestive heart failure | 0.00061 | Congestive heart failure | 0.006554 | Congestive heart failure | 0.003448 | Congestive heart failure | 0.008212 |
| Cardiac arrhythmias | 0.013201 | Cardiac arrhythmias | 0 | Cardiac arrhythmias | 0.000727 | Cardiac arrhythmias | 0 | Cardiac arrhythmias | 0.004049 |
| Valvular disease | 0 | Valvular disease | 0 | Valvular disease | 0.000858 | Valvular disease | 0.004271 | Valvular disease | 0 |
| Pulmonary circulation disorders | 0.001711 | Pulmonary circulation disorders | 0 | Pulmonary circulation disorders | 0 | Pulmonary circulation disorders | 0 | Pulmonary circulation disorders | 0.001633 |
| Peripheral vascular disorders | 0.011444 | Peripheral vascular disorders | 0.002393 | Peripheral vascular disorders | 0.001461 | Peripheral vascular disorders | 0.002524 | Peripheral vascular disorders | 0 |
| Hypertension uncomplicated | 0.035809 | Hypertension uncomplicated | 0.003582 | Hypertension uncomplicated | 0 | Hypertension uncomplicated | 0.011136 | Hypertension uncomplicated | 0.004505 |
| Hypertension complicated | 0.022409 | Hypertension complicated | 0.010994 | Hypertension complicated | 0.004092 | Hypertension complicated | 0.004717 | Hypertension complicated | 0.004397 |
| Paralysis | 0.004824 | Paralysis | 0 | Paralysis | 0 | Paralysis | 0 | Paralysis | 0.00206 |
| Other neurological disorders | 0.007542 | Other neurological disorders | 0.00373 | Other neurological disorders | 7.43 × 10⁻⁵ | Other neurological disorders | 0 | Other neurological disorders | 0 |
| Chronic pulmonary disease | 0.036637 | Chronic pulmonary disease | 0.003064 | Chronic pulmonary disease | 0 | Chronic pulmonary disease | 0 | Chronic pulmonary disease | 0.001339 |
| Diabetes uncomplicated | 0.041356 | Diabetes uncomplicated | 0.009213 | Diabetes uncomplicated | 0.007142 | Diabetes uncomplicated | 0.001278 | Diabetes uncomplicated | 0.004796 |
| Diabetes complicated | 0.032078 | Diabetes complicated | 0.011004 | Diabetes complicated | 0.00391 | Diabetes complicated | 0.009505 | Diabetes complicated | 0 |
| Hypothyroidism | 0.002325 | Hypothyroidism | 0.005612 | Hypothyroidism | 0 | Hypothyroidism | 0.002583 | Hypothyroidism | 0.001331 |
| Renal failure | 0.026439 | Renal failure | 0.008957 | Renal failure | 0 | Renal failure | 0.0061 | Renal failure | 0.00426 |
| Liver disease | 0.022072 | Liver disease | 0.006019 | Liver disease | 0 | Liver disease | 0.002106 | Liver disease | 2.02 × 10⁻⁵ |
| Peptic ulcer disease excluding bleeding | 0.011524 | Peptic ulcer disease excluding bleeding | 0 | Peptic ulcer disease excluding bleeding | 0.000322 | Peptic ulcer disease excluding bleeding | 0.002732 | Peptic ulcer disease excluding bleeding | 0.004694 |
| AIDS/HIV | 0.004832 | AIDS/HIV | 0.004172 | AIDS/HIV | 0.004959 | AIDS/HIV | 0.002683 | AIDS/HIV | 0.00416 |
| Lymphoma | 0 | Lymphoma | 0.001566 | Lymphoma | 0 | Lymphoma | 0 | Lymphoma | 0.000138 |
| Metastatic cancer | 0.005225 | Metastatic cancer | 0 | Metastatic cancer | 0.002773 | Metastatic cancer | 0.000338 | Metastatic cancer | 0.012946 |
| Solid tumor without metastasis | 0.021974 | Solid tumor without metastasis | 0.01209 | Solid tumor without metastasis | 0.001404 | Solid tumor without metastasis | 0.001608 | Solid tumor without metastasis | 0.00237 |
| Rheumatoid arthritis/collagen vascular diseases | 0.00187 | Rheumatoid arthritis/collagen vascular diseases | 0 | Rheumatoid arthritis/collagen vascular diseases | 0 | Rheumatoid arthritis/collagen vascular diseases | 0 | Rheumatoid arthritis/collagen vascular diseases | 0.00218 |
| Coagulopathy | 0 | Coagulopathy | 0 | Coagulopathy | 0.007293 | Coagulopathy | 0 | Coagulopathy | 0 |
| Obesity | 0 | Obesity | 0 | Obesity | 0 | Obesity | 0 | Obesity | 0.000236 |
| Weight loss | 0.003957 | Weight loss | 0 | Weight loss | 0.008786 | Weight loss | 0.002254 | Weight loss | 0 |
| Fluid and electrolyte disorders | 0.00901 | Fluid and electrolyte disorders | 0.000449 | Fluid and electrolyte disorders | 0.004403 | Fluid and electrolyte disorders | 0.008499 | Fluid and electrolyte disorders | 0 |
| Blood loss anemia | 0.000666 | Blood loss anemia | 0 | Blood loss anemia | 0 | Blood loss anemia | 0 | Blood loss anemia | 0.011309 |
| Deficiency anemia | 0.016697 | Deficiency anemia | 0.004104 | Deficiency anemia | 0.00156 | Deficiency anemia | 0.009742 | Deficiency anemia | 0 |
| Alcohol abuse | 0.013662 | Alcohol abuse | 0.007081 | Alcohol abuse | 0.008237 | Alcohol abuse | 0.008525 | Alcohol abuse | 0.000989 |
| Drug abuse | 0.012531 | Drug abuse | 0 | Drug abuse | 0 | Drug abuse | 0.000605 | Drug abuse | 0.001179 |
| Psychoses | 0 | Psychoses | 0.00376 | Psychoses | 0.003083 | Psychoses | 0.001452 | Psychoses | 0 |
| Depression | 0.005406 | Depression | 0.005307 | Depression | 0.001237 | Depression | 0.001572 | Depression | 0 |
| GERD | 0.024686 | GERD | 0 | GERD | 0 | GERD | 0.007851 | GERD | 0.001501 |
| Migraine | 0.007358 | Migraine | 0 | Migraine | 0 | Migraine | 0.003449 | Migraine | 0.00197 |
| Preoperative nausea and vomiting | 0 | Preoperative nausea and vomiting | 0 | Preoperative nausea and vomiting | 0.003574 | Preoperative nausea and vomiting | 0.005058 | Preoperative nausea and vomiting | 0.002056 |
| Anesthesia time, hour | 0.008031 | Anesthesia time, hour | 0.038934 | Anesthesia time, hour | 0.030261 | Anesthesia time, hour | 0.000964 | Anesthesia time, hour | 0.072561 |
| Operation time, hour | 0.008312 | Operation time, hour | 0.041784 | Operation time, hour | 0.031438 | Operation time, hour | 0.006119 | Operation time, hour | 0.063561 |
| ASA PS | 0.029379 | ASA PS | 0.006369 | ASA PS | 0.007577 | ASA PS | 0.006162 | ASA PS | 0.026592 |
| Emergency | 0.011446 | Emergency | 0.014109 | Emergency | 0.00387 | Emergency | 0.002443 | Emergency | 0.016669 |
| Administered blood, mL | 0.007107 | Administered blood, mL | 0.01352 | Administered blood, mL | 0.001689 | Administered blood, mL | 0.004122 | Administered blood, mL | 0.018886 |
| Administered Fluid, mL | 0.00746 | Administered Fluid, mL | 0.038842 | Administered Fluid, mL | 0.017722 | Administered Fluid, mL | 0.003735 | Administered Fluid, mL | 0.081544 |
| Administered Urine, mL | 0.013733 | Administered Urine, mL | 0.045319 | Administered Urine, mL | 0.021812 | Administered Urine, mL | 0.002917 | Administered Urine, mL | 0.099572 |
| Estimated blood loss, mL | 0.020982 | Estimated blood loss, mL | 0.032045 | Estimated blood loss, mL | 0.00701 | Estimated blood loss, mL | 0.002474 | Estimated blood loss, mL | 0.081764 |
| Intraoperative PRC, unit | 0.002815 | Intraoperative PRC, unit | 0.008796 | Intraoperative PRC, unit | 0.009146 | Intraoperative PRC, unit | 0 | Intraoperative PRC, unit | 0.014102 |
| Intraoperative FFP, unit | 0 | Intraoperative FFP, unit | 0.001007 | Intraoperative FFP, unit | 0.000711 | Intraoperative FFP, unit | 0 | Intraoperative FFP, unit | 0.001156 |
| Intraoperative PC, unit | 0.005476 | Intraoperative PC, unit | 0 | Intraoperative PC, unit | 0.000244 | Intraoperative PC, unit | 0 | Intraoperative PC, unit | 0.000352 |
| A-line | 0.000496 | A-line | 0.019047 | A-line | 0.002371 | A-line | 0.005451 | A-line | 0.069996 |
| C-line | 0.005401 | C-line | 0.00958 | C-line | 0 | C-line | 0.003437 | C-line | 0.036275 |
| Foley | 0.008587 | Foley | 0.022761 | Foley | 0.002563 | Foley | 0.005108 | Foley | 0.059241 |
| Nasogastric tube | 0 | Nasogastric tube | 0.004042 | Nasogastric tube | 0.002305 | Nasogastric tube | 0.000118 | Nasogastric tube | 0 |
| Fasting time, hour | 0.005584 | Fasting time, hour | 0.003814 | Fasting time, hour | 0.00098 | Fasting time, hour | 0.002977 | Fasting time, hour | 0.012837 |
| Induction drug | 0 | Induction drug | 0.013387 | Induction drug | 0.000604 | Induction drug | 0.003543 | Induction drug | 0 |
| Maintenance agent | 0.007787 | Maintenance agent | 0.013547 | Maintenance agent | 0.008142 | Maintenance agent | 0.010943 | Maintenance agent | 0.010467 |
| N2O | 0.024304 | N2O | 0.011115 | N2O | 0.007055 | N2O | 0.001988 | N2O | 0.008418 |
| First intraoperative antiemetics | 0.016601 | First intraoperative antiemetics | 0.007223 | First intraoperative antiemetics | 0.00875 | First intraoperative antiemetics | 0.004457 | First intraoperative antiemetics | 0.014732 |
| Second intraoperative antiemetics | 0.004754 | Second intraoperative antiemetics | 0.0051 | Second intraoperative antiemetics | 0.002218 | Second intraoperative antiemetics | 0 | Second intraoperative antiemetics | 0.001557 |
| Type of PCA | 0.098404 | Type of PCA | 0.162091 | Type of PCA | 0.122345 | Type of PCA | 0.061605 | Type of PCA | 0.439285 |
| Total PCA dose, mg | 0.122888 | Total PCA dose, mg | 0.190948 | Total PCA dose, mg | 0.145924 | Total PCA dose, mg | 0.078757 | Total PCA dose, mg | 0.481962 |
| PCA flow (mg/h) | 0.114928 | PCA flow (mg/h) | 0.182959 | PCA flow (mg/h) | 0.145486 | PCA flow (mg/h) | 0.066347 | PCA flow (mg/h) | 0.480247 |
| Antiemetics of PCA | 0.092322 | Antiemetics of PCA | 0.167905 | Antiemetics of PCA | 0.130546 | Antiemetics of PCA | 0.061012 | Antiemetics of PCA | 0.434438 |
| Opioid dose at PACU, mg | 0 | Opioid dose at PACU, mg | 0.003604 | Opioid dose at PACU, mg | 0.011924 | Opioid dose at PACU, mg | 0 | Opioid dose at PACU, mg | 0.012209 |
| Preventive antiemetics in PACU | 0.028454 | Preventive antiemetics in PACU | 0.069763 | Preventive antiemetics in PACU | 0.091715 | Preventive antiemetics in PACU | 0.044332 | Preventive antiemetics in PACU | 0.117608 |
| O2 supply within 24 h after surgery | 0.011319 | O2 supply within 24 h after surgery | 0.014543 | O2 supply within 24 h after surgery | 0.000974 | O2 supply within 24 h after surgery | 0.00047 | O2 supply within 24 h after surgery | 0.041406 |
| Frequency of postoperative opioid rescue except for TDFP | 0.001584 | Frequency of postoperative opioid rescue except for TDFP | 0.011442 | Frequency of postoperative opioid rescue except for TDFP | 0.010494 | Frequency of postoperative opioid rescue except for TDFP | 0.008148 | Frequency of postoperative opioid rescue except for TDFP | 0.033191 |
| Dose of postoperative opioid rescue except for TDFP, mg | 0.006859 | Dose of postoperative opioid rescue except for TDFP, mg | 0.020091 | Dose of postoperative opioid rescue except for TDFP, mg | 0.00501 | Dose of postoperative opioid rescue except for TDFP, mg | 0 | Dose of postoperative opioid rescue except for TDFP, mg | 0.044087 |
| Postoperative TDFP within 24 h after surgery (μg/h) | 0 | Postoperative TDFP within 24 h after surgery (μg/h) | 0 | Postoperative TDFP within 24 h after surgery (μg/h) | 0.004694 | Postoperative TDFP within 24 h after surgery (μg/h) | 0.011601 | Postoperative TDFP within 24 h after surgery (μg/h) | 0.00893 |
| Intraoperative continuous infusion dose of propofol | 0.009027 | Intraoperative continuous infusion dose of propofol | 0.003551 | Intraoperative continuous infusion dose of propofol | 0.003871 | Intraoperative continuous infusion dose of propofol | 0.012563 | Intraoperative continuous infusion dose of propofol | 0.002748 |
| Intraoperative injection dose of propofol, mg | 0.031009 | Intraoperative injection dose of propofol, mg | 0.040009 | Intraoperative injection dose of propofol, mg | 0.035606 | Intraoperative injection dose of propofol, mg | 0.020658 | Intraoperative injection dose of propofol, mg | 0.042206 |
| Intraoperative dose of etomidate, mg | 0.003061 | Intraoperative dose of etomidate, mg | 0.012007 | Intraoperative dose of etomidate, mg | 0.001926 | Intraoperative dose of etomidate, mg | 0.001963 | Intraoperative dose of etomidate, mg | 0 |
| Intraoperative dose of ketamine, mg | 0 | Intraoperative dose of ketamine, mg | 0.012963 | Intraoperative dose of ketamine, mg | 0 | Intraoperative dose of ketamine, mg | 0.007965 | Intraoperative dose of ketamine, mg | 0 |
| Intraoperative dose of thiopental sodium, mg | 0 | Intraoperative dose of thiopental sodium, mg | 0.009748 | Intraoperative dose of thiopental sodium, mg | 0 | Intraoperative dose of thiopental sodium, mg | 0.00023 | Intraoperative dose of thiopental sodium, mg | 0 |
| Intraoperative dose of dexmedetomidine, mg | 0.003159 | Intraoperative dose of dexmedetomidine, mg | 0.001652 | Intraoperative dose of dexmedetomidine, mg | 0 | Intraoperative dose of dexmedetomidine, mg | 0 | Intraoperative dose of dexmedetomidine, mg | 0.010115 |
| Intraoperative dose of fentanyl, μg | 0.139895 | Intraoperative dose of fentanyl, μg | 0.206067 | Intraoperative dose of fentanyl, μg | 0.167898 | Intraoperative dose of fentanyl, μg | 0.080612 | Intraoperative dose of fentanyl, μg | 0.493458 |
| Intraoperative dose of alfentanil, mg | 0.007663 | Intraoperative dose of alfentanil, mg | 0.010001 | Intraoperative dose of alfentanil, mg | 0.011716 | Intraoperative dose of alfentanil, mg | 0 | Intraoperative dose of alfentanil, mg | 0.03767 |
| Intraoperative dose of sufentanil, mg | 0 | Intraoperative dose of sufentanil, mg | 0.004908 | Intraoperative dose of sufentanil, mg | 0.005716 | Intraoperative dose of sufentanil, mg | 0.00315 | Intraoperative dose of sufentanil, mg | 0.00679 |
| Intraoperative dose of pethidine, mg | 0.002121 | Intraoperative dose of pethidine, mg | 0 | Intraoperative dose of pethidine, mg | 0.001803 | Intraoperative dose of pethidine, mg | 0 | Intraoperative dose of pethidine, mg | 0.009948 |
| Intraoperative dose of morphine, mg | 0 | Intraoperative dose of morphine, mg | 0 | Intraoperative dose of morphine, mg | 0 | Intraoperative dose of morphine, mg | 0.000745 | Intraoperative dose of morphine, mg | 0 |
| Intraoperative dose of neostigmine, mg | 0.011668 | Intraoperative dose of neostigmine, mg | 0 | Intraoperative dose of neostigmine, mg | 0.005509 | Intraoperative dose of neostigmine, mg | 0.003925 | Intraoperative dose of neostigmine, mg | 0.006208 |
| Intraoperative dose of pyridostigmine, mg | 0.015152 | Intraoperative dose of pyridostigmine, mg | 0.007306 | Intraoperative dose of pyridostigmine, mg | 0.006987 | Intraoperative dose of pyridostigmine, mg | 0.007709 | Intraoperative dose of pyridostigmine, mg | 0.01198 |
| Intraoperative dose of sugammadex, mg | 0.004219 | Intraoperative dose of sugammadex, mg | 0.002466 | Intraoperative dose of sugammadex, mg | 0.007416 | Intraoperative dose of sugammadex, mg | 0.005625 | Intraoperative dose of sugammadex, mg | 0.006301 |
| Robotic surgery | 0.010594 | Robotic surgery | 0.009638 | Robotic surgery | 0.011253 | Robotic surgery | 0.002059 | Robotic surgery | 0.020797 |
| Laparoscopic surgery | 0.005243 | Laparoscopic surgery | 0.001475 | Laparoscopic surgery | 0.00509 | Laparoscopic surgery | 0.006372 | Laparoscopic surgery | 0.08291 |
| heart surgery | 0.001553 | heart surgery | 0 | heart surgery | 0.003475 | heart surgery | 0 | heart surgery | 0.002751 |
| Abdomen surgery | 0 | Abdomen surgery | 0.006568 | Abdomen surgery | 0.000849 | Abdomen surgery | 9.77 × 10⁻⁶ | Abdomen surgery | 0.064653 |
| Breast surgery | 0.015245 | Breast surgery | 0.008716 | Breast surgery | 0.00424 | Breast surgery | 0.003715 | Breast surgery | 0.026665 |
| Ear surgery | 0.000189 | Ear surgery | 0.003594 | Ear surgery | 0 | Ear surgery | 0 | Ear surgery | 0.014613 |
| Endocrinologic surgery | 0.007103 | Endocrinologic surgery | 0 | Endocrinologic surgery | 0.007086 | Endocrinologic surgery | 0.001702 | Endocrinologic surgery | 0.01862 |
| Eye surgery | 0.003236 | Eye surgery | 0 | Eye surgery | 0.002919 | Eye surgery | 0.001273 | Eye surgery | 0.003301 |
| Head and neck surgery | 0.032772 | Head and neck surgery | 0.028516 | Head and neck surgery | 0.028426 | Head and neck surgery | 0.018761 | Head and neck surgery | 0.088718 |
| Musculoskeletal surgery | 0.016588 | Musculoskeletal surgery | 0.022552 | Musculoskeletal surgery | 0.00291 | Musculoskeletal surgery | 0.00477 | Musculoskeletal surgery | 0.044453 |
| Neurosurgery | 0.004762 | Neurosurgery | 0.002645 | Neurosurgery | 0.002558 | Neurosurgery | 0 | Neurosurgery | 0.006022 |
| Obstetric and gynecologic surgery | 0.056 | Obstetric and gynecologic surgery | 0.038353 | Obstetric and gynecologic surgery | 0.037278 | Obstetric and gynecologic surgery | 0.025596 | Obstetric and gynecologic surgery | 0.094796 |
| Spine surgery | 0.001873 | Spine surgery | 0.008075 | Spine surgery | 0.00383 | Spine surgery | 0.001408 | Spine surgery | 0.001849 |
| Thoracic surgery | 0.006697 | Thoracic surgery | 0 | Thoracic surgery | 0.003808 | Thoracic surgery | 0 | Thoracic surgery | 0.004475 |
| Transplantation surgery | 0 | Transplantation surgery | 0 | Transplantation surgery | 0 | Transplantation surgery | 0.000324 | Transplantation surgery | 0.000534 |
| Urogenital surgery | 0.018391 | Urogenital surgery | 0.018924 | Urogenital surgery | 0.005083 | Urogenital surgery | 0.010378 | Urogenital surgery | 0.045068 |
| Vascular surgery | 0.010679 | Vascular surgery | 0.004212 | Vascular surgery | 0 | Vascular surgery | 0 | Vascular surgery | 0.000859 |
| Skin and soft tissue surgery | 0.010685 | Skin and soft tissue surgery | 0 | Skin and soft tissue surgery | 0.00063 | Skin and soft tissue surgery | 0.003378 | Skin and soft tissue surgery | 0.008169 |
| Other surgery | 0.00544 | Other surgery | 0.010513 | Other surgery | 0 | Other surgery | 0.006076 | Other surgery | 0 |
References
- Apipan, B.; Rummasak, D.; Wongsirichat, N. Postoperative nausea and vomiting after general anesthesia for oral and maxillofacial surgery. J. Dent. Anesth. Pain Med. 2016, 16, 273–281. [Google Scholar] [CrossRef] [PubMed]
- Pierre, S.; Whelan, R. Nausea and vomiting after surgery. Contin. Educ. Anaesth. Crit. Care Pain 2012, 13, 28–32. [Google Scholar] [CrossRef]
- Shaikh, S.I.; Nagarekha, D.; Hegade, G.; Marutheesh, M. Postoperative nausea and vomiting: A simple yet complex problem. Anesth. Essays Res. 2016, 10, 388–396. [Google Scholar] [CrossRef] [PubMed]
- Silva, A.C.; O’Ryan, F.; Poor, D.B. Postoperative nausea and vomiting (PONV) after orthognathic surgery: A retrospective study and literature review. J. Oral Maxillofac. Surg. 2006, 64, 1385–1397. [Google Scholar] [CrossRef] [PubMed]
- Chatterjee, S.; Rudra, A.; Sengupta, S. Current concepts in the management of postoperative nausea and vomiting. Anesthesiol. Res. Pract. 2011, 2011, 748031. [Google Scholar] [CrossRef] [PubMed]
- Sizemore, D.C.; Singh, A.; Dua, A.; Singh, K.; Grose, B.W. Postoperative Nausea. In StatPearls; StatPearls Publishing: Treasure Island, FL, USA, 2023. [Google Scholar]
- Elvir-Lazo, O.L.; White, P.F.; Yumul, R.; Cruz Eng, H. Management strategies for the treatment and prevention of postoperative/postdischarge nausea and vomiting: An updated review. F1000Research 2020, 9, 983. [Google Scholar] [CrossRef] [PubMed]
- Postoperative Nausea and Vomiting. Available online: https://www.uptodate.com/contents/postoperative-nausea-and-vomiting (accessed on 19 August 2023).
- Gan, T.J.; Belani, K.G.; Bergese, S.; Chung, F.; Diemunsch, P.; Habib, A.S.; Jin, Z.; Kovac, A.L.; Meyer, T.A.; Urman, R.D.; et al. Fourth Consensus Guidelines for the Management of Postoperative Nausea and Vomiting. Anesth. Analg. 2020, 131, 411–448. [Google Scholar] [CrossRef] [PubMed]
- Andrew, B.Y.; Habib, A.S.; Taicher, B.M. The Association of Guideline-Directed Prophylaxis with Postoperative Nausea and Vomiting in Pediatric Patients: A Single-Center, Retrospective Cohort Study. Anesth. Analg. 2023; in press. [Google Scholar]
- Habehh, H.; Gohel, S. Machine Learning in Healthcare. Curr. Genom. 2021, 22, 291–300. [Google Scholar] [CrossRef]
- Javaid, M.; Haleem, A.; Pratap Singh, R.; Suman, R.; Rab, S. Significance of machine learning in healthcare: Features, pillars and applications. Int. J. Intell. Netw. 2022, 3, 58–73. [Google Scholar] [CrossRef]
- El-Sherbini, A.H.; Hassan Virk, H.U.; Wang, Z.; Glicksberg, B.S.; Krittanawong, C. Machine-Learning-Based Prediction Modelling in Primary Care: State-of-the-Art Review. AI 2023, 4, 437–460. [Google Scholar] [CrossRef]
- Merath, K.; Hyer, J.M.; Mehta, R.; Farooq, A.; Bagante, F.; Sahara, K.; Tsilimigras, D.I.; Beal, E.; Paredes, A.Z.; Wu, L.; et al. Use of Machine Learning for Prediction of Patient Risk of Postoperative Complications After Liver, Pancreatic, and Colorectal Surgery. J. Gastrointest. Surg. 2020, 24, 1843–1851. [Google Scholar] [CrossRef] [PubMed]
- Sklearn Preprocessing Standard Scaler. Available online: https://scikit-learn.org/stable/modules/generated/sklearn.preprocessing.StandardScaler.html (accessed on 19 August 2023).
- Tyagi, S.; Mittal, S. Sampling approaches for imbalanced data classification problem in machine learning. In Proceedings of the ICRIC 2019: Recent Innovations in Computing, Jammu, India, 8–9 March 2020; pp. 209–221. [Google Scholar]
- Chawla, N.V.; Bowyer, K.W.; Hall, L.O.; Kegelmeyer, W.P. SMOTE: Synthetic minority over-sampling technique. J. Artif. Intell. Res. 2002, 16, 321–357. [Google Scholar] [CrossRef]
- Light GBM. Available online: https://lightgbm.readthedocs.io/en/v3.3.2/ (accessed on 30 January 2023).
- Sklearn Neural_Network MLP Classifier. Available online: https://scikit-learn.org/stable/modules/generated/sklearn.neural_network.MLPClassifier.html (accessed on 30 January 2023).
- sklearn.linear_model.LogisticRegression. Available online: https://scikit-learn.org/stable/modules/generated/sklearn.linear_model.LogisticRegression.html (accessed on 30 January 2023).
- Breiman, L. Random forests. Mach. Learn. 2001, 45, 5–32. [Google Scholar] [CrossRef]
- Yağcı, A.M.; Aytekin, T.; Gürgen, F.S. Balanced random forest for imbalanced data streams. In Proceedings of the 2016 24th Signal Processing and Communication Application Conference (SIU), Zonguldak, Turkey, 16–19 May 2016; pp. 1065–1068. [Google Scholar]
- BalancedRandomForestClassifier. Available online: https://imbalanced-learn.org/stable/references/generated/imblearn.ensemble.BalancedRandomForestClassifier.html (accessed on 19 August 2023).
- Putri, T.A.E.; Widiharih, T.; Santoso, R. Penerapan Tuning Hyperparameter Randomsearchcv Pada Adaptive Boosting Untuk Prediksi Kelangsungan Hidup Pasien Gagal Jantung. J. Gaussian 2023, 11, 397–406. [Google Scholar] [CrossRef]
- Barraza, N.; Moro, S.; Ferreyra, M.; de la Peña, A. Mutual information and sensitivity analysis for feature selection in customer targeting: A comparative study. J. Inf. Sci. 2019, 45, 53–67. [Google Scholar] [CrossRef]
- Shim, J.-G.; Ryu, K.-H.; Cho, E.-A.; Ahn, J.H.; Cha, Y.B.; Lim, G.; Lee, S.H. Machine learning for prediction of postoperative nausea and vomiting in patients with intravenous patient-controlled analgesia. PLoS ONE 2022, 17, e0277957. [Google Scholar] [CrossRef] [PubMed]
- Zhou, C.-M.; Wang, Y.; Xue, Q.; Yang, J.-J.; Zhu, Y. Predicting early postoperative PONV using multiple machine-learning- and deep-learning-algorithms. BMC Med. Res. Methodol. 2023, 23, 133. [Google Scholar] [CrossRef] [PubMed]
- Steyerberg, E.W.; Uno, H.; Ioannidis, J.P.A.; van Calster, B. Poor performance of clinical prediction models: The harm of commonly applied methods. J. Clin. Epidemiol. 2018, 98, 133–143. [Google Scholar] [CrossRef]
- Chandrashekar, G.; Sahin, F. A survey on feature selection methods. Comput. Electr. Eng. 2014, 40, 16–28. [Google Scholar] [CrossRef]
- Shorten, C.; Khoshgoftaar, T.M. A survey on Image Data Augmentation for Deep Learning. J. Big Data 2019, 6, 60. [Google Scholar] [CrossRef]
- Metha, S.; Chatterjee, A.N. An Investigation on the architecture of public health information system by using artificial intelligence. Seybold Rep. 2023, 18, 747–763. [Google Scholar]


| Features | Train Set | Test Set | ASD |
|---|---|---|---|
| Age, year | 53.0 (40.0, 66.0) | 54.0 (41.0, 65.0) | 0.002 |
| Female | 44,455 (52.0) | 11,087 (51.9) | 0.0013 |
| Body mass index | 24.2 (21.9, 26.7) | 24.2 (21.9, 26.7) | 0.003 |
| Alcohol | 25,679 (30.0) | 6429 (30.1) | 0.0008 |
| Smoking | 16,324 (19.1) | 4099 (19.2) | 0.0008 |
| Congestive heart failure | 3388 (4.0) | 841 (3.9) | 0.0003 |
| Cardiac arrhythmias | 3921 (4.6) | 954 (4.5) | 0.0012 |
| Valvular disease | 605 (0.7) | 156 (0.7) | 0.0002 |
| Pulmonary circulation disorders | 624 (0.7) | 170 (0.8) | 0.0007 |
| Peripheral vascular disorders | 1980 (2.3) | 511 (2.4) | 0.0007 |
| Hypertension uncomplicated | 10,440 (12.2) | 2631 (12.3) | 0.001 |
| Hypertension complicated | 4764 (5.6) | 1153 (5.4) | 0.0018 |
| Paralysis | 392 (0.5) | 96 (0.4) | 0.0001 |
| Other neurological disorders | 2874 (3.4) | 715 (3.3) | 0.0002 |
| Chronic pulmonary disease | 8823 (10.3) | 2157 (10.1) | 0.0023 |
| Diabetes uncomplicated | 6058 (7.1) | 1512 (7.1) | 0.0001 |
| Diabetes complicated | 6293 (7.4) | 1619 (7.6) | 0.0021 |
| Hypothyroidism | 2039 (2.4) | 492 (2.3) | 0.0008 |
| Renal failure | 3986 (4.7) | 1000 (4.7) | 0.0002 |
| Liver disease | 4276 (5.0) | 1137 (5.3) | 0.0032 |
| Peptic ulcer disease excluding bleeding | 1713 (2.0) | 438 (2.0) | 0.0005 |
| AIDS/HIV | 12 (0.0) | 8 (0.0) | 0.0002 |
| Lymphoma | 387 (0.5) | 102 (0.5) | 0.0002 |
| Metastatic cancer | 1173 (1.4) | 302 (1.4) | 0.0004 |
| Solid tumor without metastasis | 16,955 (19.8) | 4347 (20.3) | 0.0051 |
| Rheumatoid arthritis/collagen vascular diseases | 2219 (2.6) | 555 (2.6) | 0 |
| Coagulopathy | 764 (0.9) | 170 (0.8) | 0.001 |
| Obesity | 694 (0.8) | 187 (0.9) | 0.0006 |
| Weight loss | 319 (0.4) | 87 (0.4) | 0.0003 |
| Fluid and electrolyte disorders | 2842 (3.3) | 689 (3.2) | 0.001 |
| Blood loss anemia | 273 (0.3) | 67 (0.3) | 0.0001 |
| Deficiency anemia | 3008 (3.5) | 772 (3.6) | 0.0009 |
| Alcohol abuse | 1885 (2.2) | 459 (2.1) | 0.0006 |
| Drug abuse | 1419 (1.7) | 373 (1.7) | 0.0009 |
| Psychoses | 632 (0.7) | 163 (0.8) | 0.0002 |
| Depression | 4852 (5.7) | 1213 (5.7) | 0 |
| GERD | 13,123 (15.4) | 3231 (15.1) | 0.0023 |
| Migraine | 2436 (2.8) | 560 (2.6) | 0.0023 |
| Preoperative nausea and vomiting | 803 (0.9) | 197 (0.9) | 0.0002 |
| Features | Train Set | Test Set | ASD |
|---|---|---|---|
| ASA PS class 2 | 42,789 (50.4) | 10,852 (50.8) | 0.0072 |
| Emergency | 15,314 (17.9) | 3777 (17.7) | 0.0024 |
| Anesthesia time, hour | 1.8 (1.2, 2.8) | 1.8 (1.2, 2.8) | 0.0102 |
| Operation time, hour | 1.2 (0.7, 2.0) | 1.2 (0.7, 2.0) | 0.0085 |
| Administered blood, mL | 0.0 (0.0, 0.0) | 0.0 (0.0, 0.0) | 0.0023 |
| Administered Fluid, mL | 500.0 (300.0, 900.0) | 500.0 (300.0, 900.0) | 0.0085 |
| Administered Urine, mL | 0.0 (0.0, 60.0) | 0.0 (0.0, 60.0) | 0.0014 |
| Estimated blood loss, mL | 0.0 (0.0, 50.0) | 0.0 (0.0, 50.0) | 0.0097 |
| Intraoperative PRC, unit | 0.0 (0.0, 0.0) | 0.0 (0.0, 0.0) | 0.0034 |
| Intraoperative FFP, unit | 0.0 (0.0, 0.0) | 0.0 (0.0, 0.0) | 0.002 |
| Intraoperative PC, unit | 0.0 (0.0, 0.0) | 0.0 (0.0, 0.0) | 0.0096 |
| A-line | 29,009 (33.9) | 7289 (34.1) | 0.0017 |
| C-line | 7811 (9.1) | 2015 (9.4) | 0.0029 |
| Foley | 30,161 (35.3) | 7616 (35.6) | 0.0035 |
| Nasogastric tube | 1894 (2.2) | 491 (2.3) | 0.0008 |
| Fasting time, hour | 11.1 (8.8, 13.6) | 11.1 (8.8, 13.6) | 0.001 |
| Induction drug (propofol) | 80,760 (95.1) | 21,372 (94.4) | 0.0009 |
| Maintenance agent (Sevoflurane) | 51,110 (60.2) | 12,867 (60.2) | 0.0058 |
| N2O | 13,463 (15.7) | 3410 (16.0) | 0.0021 |
| First intraoperative antiemetics | 29,585 (34.6) | 7406 (34.7) | 0.0034 |
| Second intraoperative antiemetics | 26 (0.0) | 0 (0.0) | 0.0001 |
| Type of PCA | 42,635 (49.9) | 10,781 (50.4) | 0.0057 |
| Total PCA dose, mg | 0.0 (0.0, 100.0) | 50.0 (0.0, 100.0) | 0.0106 |
| PCA flow (mg/h) | 0.0 (0.0, 2.0) | 1.0 (0.0, 2.0) | 0.0124 |
| Antiemetics of PCA | 42,460 (49.7) | 10,734 (50.2) | 0.0056 |
| Opioid dose at PACU, mg | 0.0 (0.0, 0.0) | 0.0 (0.0, 0.0) | 0.0078 |
| Preventive antiemetics in PACU | 8164 (9.5) | 2085 (9.8) | 0.0026 |
| O2 supply within 24 h after surgery | 11,370 (13.3) | 2846 (13.3) | 0.0002 |
| Frequency of postoperative opioid rescue except for TDFP | 0.0 (0.0, 1.0) | 0.0 (0.0, 1.0) | 0.0037 |
| Dose of postoperative opioid rescue except for TDFP, mg | 0.0 (0.0, 5.0) | 0.0 (0.0, 5.0) | 0.0026 |
| Postoperative TDFP within 24 h after surgery (μg/h) | 0.0 (0.0, 0.0) | 0.0 (0.0, 0.0) | 0.0019 |
| Intraoperative continuous infusion dose of propofol | 0.0 (0.0, 0.0) | 0.0 (0.0, 0.0) | 0.0091 |
| Intraoperative injection dose of propofol, mg | 99.6 (79.2, 120.0) | 99.6 (79.2, 120.0) | 0.0012 |
| Intraoperative dose of etomidate, mg | 0.0 (0.0, 0.0) | 0.0 (0.0, 0.0) | 0.0009 |
| Intraoperative dose of ketamine, mg | 0.0 (0.0, 0.0) | 0.0 (0.0, 0.0) | 0.0071 |
| Intraoperative dose of thiopental sodium, mg | 0.0 (0.0, 0.0) | 0.0 (0.0, 0.0) | 0.0051 |
| Intraoperative dose of dexmedetomidine, mg | 0.0 (0.0, 0.0) | 0.0 (0.0, 0.0) | 0.0075 |
| Intraoperative dose of fentanyl, μg | 0.1 (0.0, 1.0) | 0.1 (0.0, 1.0) | 0.0052 |
| Intraoperative dose of alfentanil, mg | 0.0 (0.0, 0.2) | 0.0 (0.0, 0.2) | 0.0188 |
| Intraoperative dose of sufentanil, mg | 0.0 (0.0, 0.0) | 0.0 (0.0, 0.0) | 0.0038 |
| Intraoperative dose of pethidine, mg | 0.0 (0.0, 0.0) | 0.0 (0.0, 0.0) | 0.0054 |
| Intraoperative dose of morphine, mg | 0.0 (0.0, 0.0) | 0.0 (0.0, 0.0) | 0.0063 |
| Intraoperative dose of neostigmine, mg | 0.0 (0.0, 2.0) | 0.0 (0.0, 2.0) | 0.0034 |
| Intraoperative dose of pyridostigmine, mg | 0.0 (0.0, 15.0) | 0.0 (0.0, 15.0) | 0.0017 |
| Intraoperative dose of sugammadex, mg | 0.0 (0.0, 0.0) | 0.0 (0.0, 0.0) | 0.0029 |
| Robotic surgery | 2296 (2.7) | 603 (2.8) | 0.0014 |
| Laparoscopic surgery | 19,225 (22.5) | 4729 (22.1) | 0.0036 |
| heart surgery | 35 (0.0) | 11 (0.1) | 0.0001 |
| Abdomen surgery | 18,948 (22.2) | 4612 (21.6) | 0.0072 |
| Breast surgery | 3711 (4.3) | 969 (4.5) | 0.002 |
| Ear surgery | 2145 (2.5) | 496 (2.3) | 0.0019 |
| Endocrinologic surgery | 2596 (3.0) | 656 (3.1) | 0.0011 |
| Eye surgery | 1768 (2.1) | 448 (2.1) | 0.0003 |
| Head and neck surgery | 9690 (11.3) | 2383 (11.2) | 0.0019 |
| Musculoskeletal surgery | 23,069 (27.0) | 5867 (27.5) | 0.005 |
| Neurosurgery | 2341 (2.7) | 608 (2.8) | 0.0011 |
| Obstetric and gynecologic surgery | 8150 (9.5) | 2078 (9.7) | 0.0022 |
| Spine surgery | 4707 (5.5) | 1196 (5.6) | 0.0009 |
| Thoracic surgery | 1628 (1.9) | 373 (1.7) | 0.0016 |
| Transplantation surgery | 108 (0.1) | 24 (0.1) | 0.0002 |
| Urogenital surgery | 6416 (7.5) | 1615 (7.6) | 0.0009 |
| Vascular surgery | 531 (0.6) | 135 (0.6) | 0.0001 |
| Skin and soft tissue surgery | 3082 (3.6) | 762 (3.6) | 0.0007 |
| Other surgery | 3050 (3.6) | 785 (3.7) | 0.0011 |
| Precision (95% CI) | Recall (95% CI) | Accuracy (95% CI) | F1 Score (95% CI) | |
|---|---|---|---|---|
| Logistic regression | 0.29 (0.28–0.30) | 0.57 (0.55–0.59) | 0.74 (0.73–0.74) | 0.38 (0.37–0.39) |
| Random forest | 0.46 (0.44–0.48) | 0.31 (0.30–0.33) | 0.85 (0.84–0.85) | 0.37 (0.35–0.39) |
| Light gradient boosting machine | 0.60 (0.57–0.63) | 0.22 (0.20–0.23) | 0.87 (0.86–0.87) | 0.32 (0.30–0.33) |
| Multilayer perceptron | 0.32 (0.31–0.34) | 0.39 (0.37–0.41) | 0.80 (0.79–0.80) | 0.35 (0.34–0.37) |
| Balanced random forest | 0.39 (0.37–0.40) | 0.46 (0.45–0.48) | 0.82 (0.81–0.82) | 0.42 (0.41–0.44) |
| Precision (95% CI) | Recall (95% CI) | Accuracy (95% CI) | F1 Score (95% CI) | |
|---|---|---|---|---|
| Logistic regression | 0.26 (0.25–0.27) | 0.66 (0.64–0.68) | 0.68 (0.67–0.69) | 0.38 (0.37–0.39) |
| Random forest | 0.32 (0.30–0.34) | 0.33 (0.31–0.35) | 0.80 (0.80–0.81) | 0.32 (0.31–0.34) |
| Light gradient boosting machine | 0.46 (0.42–0.49) | 0.10 (0.08–0.11) | 0.85 (0.85–0.86) | 0.16 (0.14–0.17) |
| Multilayer perceptron | 0.25 (0.24–0.26) | 0.59 (0.57–0.60) | 0.69 (0.69–0.70) | 0.35 (0.34–0.37) |
| Balanced random forest | 0.27 (0.26–0.28) | 0.71 (0.69–0.72) | 0.68 (0.67–0.68) | 0.39 (0.38–0.40) |
| LR | RF | LGBM | MLP | BRF |
|---|---|---|---|---|
| Female | Intraoperative dose of fentanyl | Intraoperative dose of fentanyl | Intraoperative dose of fentanyl | Intraoperative dose of fentanyl |
| Intraoperative dose of fentanyl | Total PCA dose | Total PCA dose | Total PCA dose | Total PCA dose |
| Total PCA dose | PCA flow | PCA flow | PCA flow | PCA flow |
| PCA flow | Antiemetics of PCA | Antiemetics of PCA | Type of PCA | Type of PCA |
| Type of PCA | Type of PCA | Type of PCA | Antiemetics of PCA | Antiemetics of PCA |
| Antiemetics of PCA | Female | Female | Female | Preventive antiemetics in PACU |
| Smoking | Preventive antiemetics in PACU | Preventive antiemetics in PACU | Preventive antiemetics in PACU | Female |
| Obstetric and gynecologic surgery | Smoking | Smoking | Smoking | Urine output, mL |
| Alcohol | Urine output, mL | Obstetric and gynecologic surgery | Obstetric and gynecologic surgery | Obstetric and gynecologic surgery |
| Diabetes uncomplicated | Operation time | Intraoperative injection dose of propofol | Intraoperative injection dose of propofol | Head and neck surgery |
| Chronic pulmonary disease | Intraoperative injection dose of propofol | Operation time, hour | Alcohol | Laparoscopic surgery |
| Hypertension uncomplicated | Alcohol | Anesthesia time, hour | Head and neck surgery | Estimated blood loss, mL |
| Head and neck surgery | Anesthesia time, hour | Head and neck surgery | Intraoperative continuous infusion dose of propofol | Administered Fluid |
| Diabetes complicated | Administered Fluid, mL | Alcohol | Postoperative TDFP within 24 h after surgery | Anesthesia time, hour |
| Intraoperative injection dose of propofol | Obstetric and gynecologic surgery | Urine output, mL | Age | A-line |
| ASA PS | Estimated blood loss, mL | Administered Fluid, mL | Hypertension uncomplicated | Abdomen surgery |
| Preventive antiemetics in PACU | Head and neck surgery | Opioid dose at PACU, mg | Maintenance agent (Sevoflurane) | Operation time, hour |
| Renal failure | Foley | Intraoperative dose of alfentanil, mg | Urogenital surgery | Foley |
| GERD | Musculoskeletal surgery | Robotic surgery | Deficiency anemia | Smoking |
| N2O | Dose of postoperative opioid rescue except for TDFP, mg | Age | Diabetes complicated | Urogenital surgery |
| LR | RF | LGBM | MLP | BRF | |
|---|---|---|---|---|---|
| Female | 0.322 | 0.05 | 0.109 | 0.125 | 0.3 |
| Smoking | 0.084 | 0.018 | 0.046 | 0.072 | 0.069 |
| Age | 0.162 | 0.013 | 0.018 | 0.04 | 0.085 |
| Volatile anesthetics | 0.002 | 0.004 | 0.015 | 0.019 | 0.018 |
| Preoperative nausea and vomiting | 0.009 | 0 | 0.003 | 0 | 0 |
| Postoperative opioids | 0.259 | 0.062 | 0.092 | 0.162 | 0.25 |
| Anesthesia time | 0.068 | 0.028 | 0.027 | 0.044 | 0.096 |
| Laparoscopic surgery | 0.015 | 0.005 | 0.004 | 0.008 | 0.015 |
| Obstetric and gynecologic surgery | 0.112 | 0.022 | 0.034 | 0.056 | 0.111 |
| Preventive antiemetics | 0.037 | 0.005 | 0.007 | 0.005 | 0.024 |
Disclaimer/Publisher’s Note: The statements, opinions and data contained in all publications are solely those of the individual author(s) and contributor(s) and not of MDPI and/or the editor(s). MDPI and/or the editor(s) disclaim responsibility for any injury to people or property resulting from any ideas, methods, instructions or products referred to in the content. |
© 2023 by the authors. Licensee MDPI, Basel, Switzerland. This article is an open access article distributed under the terms and conditions of the Creative Commons Attribution (CC BY) license (https://creativecommons.org/licenses/by/4.0/).
Share and Cite
Kim, J.-H.; Cheon, B.-R.; Kim, M.-G.; Hwang, S.-M.; Lim, S.-Y.; Lee, J.-J.; Kwon, Y.-S. Postoperative Nausea and Vomiting Prediction: Machine Learning Insights from a Comprehensive Analysis of Perioperative Data. Bioengineering 2023, 10, 1152. https://doi.org/10.3390/bioengineering10101152
Kim J-H, Cheon B-R, Kim M-G, Hwang S-M, Lim S-Y, Lee J-J, Kwon Y-S. Postoperative Nausea and Vomiting Prediction: Machine Learning Insights from a Comprehensive Analysis of Perioperative Data. Bioengineering. 2023; 10(10):1152. https://doi.org/10.3390/bioengineering10101152
Chicago/Turabian StyleKim, Jong-Ho, Bo-Reum Cheon, Min-Guan Kim, Sung-Mi Hwang, So-Young Lim, Jae-Jun Lee, and Young-Suk Kwon. 2023. "Postoperative Nausea and Vomiting Prediction: Machine Learning Insights from a Comprehensive Analysis of Perioperative Data" Bioengineering 10, no. 10: 1152. https://doi.org/10.3390/bioengineering10101152
APA StyleKim, J.-H., Cheon, B.-R., Kim, M.-G., Hwang, S.-M., Lim, S.-Y., Lee, J.-J., & Kwon, Y.-S. (2023). Postoperative Nausea and Vomiting Prediction: Machine Learning Insights from a Comprehensive Analysis of Perioperative Data. Bioengineering, 10(10), 1152. https://doi.org/10.3390/bioengineering10101152