Abstract
Background: Colony morphology (size, color, edge, elevation, and texture), as observed on culture media, can be used to visually discriminate different microorganisms. Methods: This work introduces a hybrid method that combines standard pre-trained CNN keras models and classical machine-learning models for supporting colonies discrimination, developed in Petri-plates. In order to test and validate the system, images of three bacterial species (Escherichia coli, Pseudomonas aeruginosa, and Staphylococcus aureus) cultured in Petri plates were used. Results: The system demonstrated the following Accuracy discrimination rates between pairs of study groups: 92% for Pseudomonas aeruginosa vs. Staphylococcus aureus, 91% for Escherichia coli vs. Staphylococcus aureus and 84% Escherichia coli vs. Pseudomonas aeruginosa. Conclusions: These results show that combining deep-learning models with classical machine-learning models can help to discriminate bacteria colonies with good accuracy ratios.
1. Introduction
Evaluation of the number of viable microorganisms in a sample is a commonly used method in most microbiology laboratories. The method consists of counting visible colonies on agar plates and calculating the number of colony-forming units per mL (or gram) of the sample. For example, it is widely used for food, clinical, environmental, and drug safety testing. The counting of bacteria is usually carried out manually, and is, therefore, subjective and error-prone [1]. At present, automatic digital counters are common in laboratories and some have highly efficient automatic counting methods, which have replaced manual counting methods.
Although the counting of visible colonies on agar plates is the most commonly used method to assess bacterial populations, with the advantage of only considering the counts of viable cells [2], it is time-consuming, laborious and requires at least 24 h or more for visible colonies to form. This can be a considerable limitation in some situations, such as quality control of certain foods and in clinical settings, where fast results are required so that actions can rapidly be implemented.
One important factor in cell counting is the analyst’s ability to see colonies distinctly. Colony morphology is used to select bacteria as phenotypically different. This is normally carried out by visual inspection, and the selected parameters are often colony size, color, texture, edge, and elevation, according to the colony morphology protocol emitted by the American Society for Microbiology [3].
In a previous work, a software capable of semi-automatically quantifying the number of colonies in Petri plates from a digital image was developed [4]. This method did not, however, automatically distinguish different colony types. Thus, in the present work, we attempted to include this distinguishing characteristic. Therefore, three bacterial species (Escherichia coli, Pseudomonas aeruginosa, and Staphylococcus aureus) that represent the predominant pathogenic microorganisms in a variety of settings—food [5], clinical [6] and environmental [7]—were used to evaluate and develop our solution/software to support colony discrimination. Table 1 shows the the current state-of-art on colony-distinguishing methods based on machine-learning (ML) models.

Table 1.
State-of-the-art papers.
2. Methodology
In this section, all the procedures are described. The microbiological analysis and the image database are presented and, after that, the deep and classical machine-learning analysis of images is explained. Figure 1 presents a summary of the whole methodology procedure.
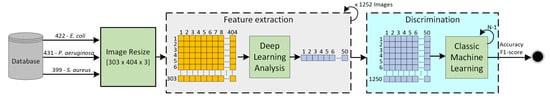
Figure 1.
Methodology workflow.
2.1. Microbiological Analysis and Image Database
Plates containing Escherichia coli, Pseudomonas aeruginosa and Staphylococcus aureus isolates from our center’s internal collection were cultivated aerobically at 37 °C, for 24 h, in Trypto-Casein Soy Agar™ (TSA, BIOKAR Diagnostics, Allonne, France) using the spread-plate technique (0.1 mL of the diluted samples). All experiments were carried out in triplicate. Colony enumeration was performed and the number of colonies was recorded and posteriorly attributed to each image of the database.
The final dataset [12] consists of about 1252 labeled Petri images with 422 colonies of Escherichia coli, 431 of Pseudomonas aeruginosa and 399 of Staphylococcus aureus. The color images were acquired by a smartphone camera with 12 megapixels [3024 × 4032 × 3]. For more details, consult the previous authors’ published paper [4].
2.2. The Deep and Classical Machine-Learning Analysis
To verify the suitability of the Image dataset for building deep-learning models that can obtain a total of 50 features from each colony for image-based microorganism recognition, we evaluated the performance of the following standard, pre-trained 31 CNN keras models [13]: Xception; VGG16; VGG19; ResNet50; ResNet50V2; ResNet101; ResNet101V2; ResNet152; ResNet152V2; InceptionV3; InceptionResNetV2; MobileNet; MobileNetV2; DenseNet121; DenseNet169; DenseNet201; EfficientNetB0; EfficientNetB1; EfficientNetB2; EfficientNetB3; EfficientNetB4; EfficientNetB5; EfficientNetB6; EfficientNetB7; EfficientNetV2B0; EfficientNetV2B1; EfficientNetV2B2; EfficientNetV2B3; EfficientNetV2S; EfficientNetV2M; EfficientNetV2L. For more details please check the Keras default models at https://keras.io/api/applications/, accessed on 20 November 2022.
Due to the relatively high resolution of all images, the samples were scaled down to [303 × 404 × 3] to reduce the computation time and guarantee proper aspect ratios. Thus, the patches of each neural network architecture were resized to match the default input layer size. The output layer of each used standard CNN keras models [13], and was also replaced by a dense layer with 50 units and softmax as the activation function to obtain, as output, in a blinding feature extraction process, 50 features from each colony to serve as vector inputs for several classical ML models: decision trees (DT), support-vector machines (SVM), K-nearest neighbors (KNN), multi-layer perceptron (MLP) and three ensemble classifiers (please check Table 2 for more details). The models’ performance was evaluated within a leave-one-out-cross-validation procedure, a well-known process that allows for the use of all datasets for testing, without leakage between train and test sets.
Table 2.
Used classical machine-learning classifiers and optimal parameters.
In this work, the feature extraction and the classification were carried out in a cloud-based service, the Google Colaboratory. The software code was developed in Python-Jupyter Notebook for machine-learning and deep-learning operations within a virtual machine with two Intel Xeon CPUs both at 2.20 GHz, 100 GB of storing, and 13 GB of Ram.
The evaluation metric for colony detection was based on the and F1-score [14]. shows how many cases were correctly labelled out of all the cases, and is defined as,
where a is an outcome in which the MP model correctly predicts a positive class, a is an outcome where the model correctly predicts the negative class, a is an outcome where the model incorrectly predicts the positive class and, finally, is an outcome where the model incorrectly predicts the negative class [14].
The F1-score is the harmonic mean of and and can be defined as,
where and are, respectively,
and
Thus, if the F1-score is high, both the precision and recall of the classifier indicate good results [14].
3. Results and Discussion
By analyzing Table 3, some considerations regarding the classification results between pairs of study groups are revealed. higher than 84% were obtained for all pairs, with at least one combination of deep and classical machine-learning methods. The combination of classifiers MobileNet-XGBoost provided the best results for all study pair classifications; in this way, it was shown to be a good candidate combination for differentiating colonies. The XGBoost was shown to be the most effective classical machine-learning classifier, as 81% (82 of 93) of the best combinations of deep and classical machine-learning have XGBoost as a classifier. The group pairs comparisons that involved Staphylococcus aureus achieved high and F1-score rates, above 91%. One of the explanations for these results is that Staphylococcus aureus produces yellow colonies [15] on a plate, which are very typical and differentiated from the Escherichia coli and Pseudomonas aeruginosa that produce beige colonies on a plate [16,17]. As Escherichia coli and Pseudomonas aeruginosa colonies are both beige on a plate, the problem of differentiating each becomes more difficult for the classifiers. Even so, the proposed methods achieved good ratios of and F1-score ≈ 84% on Escherichia coli vs. Pseudomonas aeruginosa discrimination. The graphic of Figure 2 shows the best discrimination results between the study groups. The results are in line with those found in the state-of-art literature (please check Table 1) and provides us with a good indication that, if we continue to improve and refine the algorithm, we can build an even more helpful, powerful, and robust tool for this purpose.
Table 3.
Summary of the best discrimination results between study group pairs.
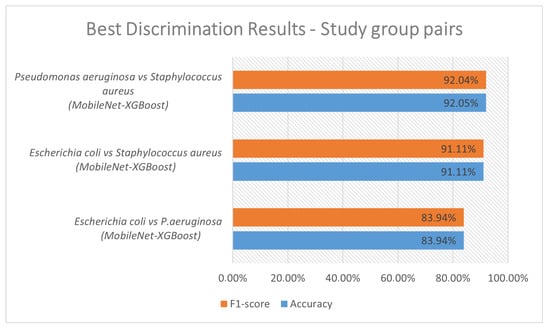
Figure 2.
Best discrimination results between study group pairs.
4. Conclusions
This work introduced a preliminary method that combines standard CNN keras models and classical machine-learning models to support colony discrimination, developed in Petri-plates. In order to test and validate the system, images of three bacterial species (Escherichia coli, Pseudomonas aeruginosa, and Staphylococcus aureus) cultured in Petri plates were presented to the CNN models’ entries to extract 50 image features to feed classical machine-learning models within a leave-one-out-cross validation procedure. The system demonstrated good discrimination rates between pairs of study groups: 92% for Pseudomonas aeruginosa vs. Staphylococcus aureus, 91% for Escherichia coli vs. Staphylococcus aureus and 84% Escherichia coli vs. Pseudomonas aeruginosa. The presented preliminary results showed that a combination of deep-learning models and classical machine-learning models can help to discriminate bacteria colonies in Petri-plates. Tools, such as the one developed in the present work, are really valuable in ascertaining different colony types in a single step, using a general, whole-purpose medium instead of several selective and/or differential media, rendering the process time-consuming, expensive, and prone to errors due to the increased manipulation steps required by the operator. Furthermore, differential colony counting is quite useful, since most analyzed samples in a microbiology setting are not pure-culture, but mixed cultures involving more than one bacterial species. In future work, the dataset should be extended to more bacteria colony types to evaluate the system’s ability to discriminate other species and should include a set of pictures containing a mixture of colonies to evaluate the of the method in a mixed/complex sample. Additionally, the deep and classical machine-learning models should be refined to improve the system’s performance.
Author Contributions
Conceptualization, P.M.R.; methodology, P.M.R. and P.R.; validation, P.M.R.; investigation, P.M.R. and P.R.; writing—original, P.M.R. and F.K.T.; writing—review and editing, P.M.R., P.R. and F.K.T.; supervision, P.M.R. and F.K.T.; funding acquisition, P.M.R. All authors have read and agreed to the published version of the manuscript.
Funding
This work was supported by National Funds from FCT—Fundação para a Ciência e a Tecnologia through project UIDB/50016/2020.
Institutional Review Board Statement
Not applicable.
Informed Consent Statement
Not applicable.
Data Availability Statement
The data presented in this study are openly available in FigShare at doi, reference number 10.6084/m9.figshare.20109377.v2.
Conflicts of Interest
The authors declare no conflict of interest.
References
- Zhu, G.; Yan, B.; Xing, M.; Tian, C. Automated counting of bacterial colonies on agar plates based on images captured at near-infrared light. J. Microbiol. Methods 2018, 153, 66–73. [Google Scholar] [CrossRef] [PubMed]
- Raju, S.; Aparna, H.G.; Krishnan, A.V.; Naryanan, D.; Gangadhran, V.; Paul, S.C. Automated counting of bacterial colonies by image analysis. J. Multidiscip. Dent. Res. 2020, 5, 19–21. [Google Scholar] [CrossRef]
- Breakwell, D.P.; Macdonald, B.; Woolverton, C.J.; Smith, K.C.; Robison, R.A. Colony Morphology Protocol. In Proceedings of the ASM Conference for Undergraduate Educators, San Diego, CA, USA, 16–19 February 2007. [Google Scholar]
- Rodrigues, P.M.; Luís, J.; Tavaria, F.K. Image Analysis Semi-Automatic System for Colony-Forming-Unit Counting. Bioengineering 2022, 9, 271. [Google Scholar] [CrossRef] [PubMed]
- Farooq, U. Inhibition of Escherichia coli, Pseudomonas aeruginosa, Staphylococcus aureus and Enterococcus feacalis through Malus DomesticaExtracts to Eliminate Food Borne Illness. Am. J. Biomed. Sci. Res. 2019, 3, 391–397. [Google Scholar] [CrossRef]
- Cleven, B.E.E.; Palka-Santini, M.; Gielen, J.; Meembor, S.; Krönke, M.; Krut, O. Identification and Characterization of Bacterial Pathogens Causing Bloodstream Infections by DNA Microarray. J. Clin. Microbiol. 2006, 44, 2389–2397. [Google Scholar] [CrossRef] [PubMed]
- Hedge, A. Survival of Escherichia coli, Pseudomona aeruginosa, Staphylococcus aureus on Wood and Plastic Surfaces. J. Microb. Biochem. Technol. 2015, 7, 4. [Google Scholar] [CrossRef]
- Kim, S.; Lee, M.H.; Wiwasuku, T.; Day, A.S.; Youngme, S.; Hwang, D.S.; Yoon, J.Y. Human sensor-inspired supervised machine learning of smartphone-based paper microfluidic analysis for bacterial species classification. Biosens. Bioelectron. 2021, 188, 113335. [Google Scholar] [CrossRef] [PubMed]
- Zieliński, B.; Plichta, A.; Misztal, K.; Spurek, P.; Brzychczy-Włoch, M.; Ochońska, D. Deep learning approach to bacterial colony classification. PLoS ONE 2017, 12, e0184554. [Google Scholar] [CrossRef] [PubMed]
- Khalifa, N.E.M.; Taha, M.H.N.; Hassanien, A.E.; Hemedan, A.A. Deep bacteria: Robust deep learning data augmentation design for limited bacterial colony dataset. Int. J. Reason.-Based Intell. Syst. 2019, 11, 256. [Google Scholar] [CrossRef]
- Li, Z.; Jiang, Y.; Tang, S.; Zou, H.; Wang, W.; Qi, G.; Zhang, H.; Jin, K.; Wang, Y.; Chen, H.; et al. 2D nanomaterial sensing array using machine learning for differential profiling of pathogenic microbial taxonomic identification. Microchim. Acta 2022, 189, 273. [Google Scholar] [CrossRef] [PubMed]
- Rodrigues, P.M.; Luis, J.; Tavaria, F.K. Petri Dishes Digital Images Dataset of E. coli, S. aureus and P. aeruginosa. 2022. Available online: https://figshare.com/articles/dataset/Dataset_bioengineering_17489364/20109377/2 (accessed on 20 November 2022).
- Chollet, F. Keras. 2015. Available online: https://github.com/fchollet/keras (accessed on 20 November 2022).
- Stehman, S.V. Selecting and interpreting measures of thematic classification accuracy. Remote. Sens. Environ. 1997, 62, 77–89. [Google Scholar] [CrossRef]
- Missiakas, D.M.; Schneewind, O. Growth and Laboratory Maintenance of Staphylococcus aureus. Curr. Protoc. Microbiol. 2013, 28. [Google Scholar] [CrossRef] [PubMed]
- Hossain, M.; Rahman, W.; Ali, M.; Sultana, T.; Hossain, K. Identification and Antibiogram Assay of Escherichia coli Isolated from Chicken Eggs. J. Bio-Sci. 2021, 29, 123–133. [Google Scholar] [CrossRef]
- Agarwal, G.; Kapil, A.; Kabra, S.K.; Das, B.K.; Dwivedi, S.N. Characterization of Pseudomonas aeruginosa isolated from chronically infected children with cystic fibrosis in India. BMC Microbiol. 2005, 5, 43. [Google Scholar] [CrossRef] [PubMed]


Disclaimer/Publisher’s Note: The statements, opinions and data contained in all publications are solely those of the individual author(s) and contributor(s) and not of MDPI and/or the editor(s). MDPI and/or the editor(s) disclaim responsibility for any injury to people or property resulting from any ideas, methods, instructions or products referred to in the content. |
© 2022 by the authors. Licensee MDPI, Basel, Switzerland. This article is an open access article distributed under the terms and conditions of the Creative Commons Attribution (CC BY) license (https://creativecommons.org/licenses/by/4.0/).