
- Article

BioRamanNet: A Neural Network Framework for Biological Raman Spectroscopy Classification
- Pengju Yin,
- Xin Li and
- Bo Hu
- + 3 authors
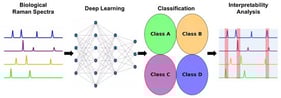
Raman spectroscopy has become an important tool for biomedical analysis due to its ability to provide label-free, non-destructive molecular fingerprints of biological samples. However, existing deep learning approaches for classifying biological Raman spectra often focus on specific datasets and lack generalizability and interpretability. In this study, BioRamanNet is presented, an interpretable and generalizable deep learning framework designed for classifying a wide range of biological Raman spectra. The model integrates adaptive one-dimensional convolutional layers and squeeze-and-excitation (SE) blocks within a residual network architecture to enhance feature extraction. BioRamanNet was evaluated using four representative Raman spectral datasets—breast cells, extracellular vesicles and particles (EVPs), viruses, and bacteria—achieving classification accuracies of 99.5%, 100%, 99.8%, and 85.3%, respectively. To improve model interpretability, a perturbation-based analysis using Voigt noise was introduced to identify key wavenumber regions influencing classification. These regions were found to correspond closely with known Raman biomarkers, validating their biological significance. The results of this work demonstrate that BioRamanNet is a powerful and interpretable tool for analyzing diverse biological Raman spectra and holds promise for advancing machine learning-assisted biomedical diagnostics.
18 November 2025
![Overview of the current workflow taking advantage of a recent graph-based force field generator [15] for routine conversion of 2D molecular diagrams to low-energy crystal structures.](https://mdpi-res.com/cdn-cgi/image/w=281,h=192/https://mdpi-res.com/aichem/aichem-01-00002/article_deploy/html/images/aichem-01-00002-g001-550.jpg)
![Evolution of descriptors across GAELLE generated conformation with a genetic algorithm. (Top) Electrophilicity index (in blue)
ω
[eV] plotted for each conformer ranked by increasing reactivity (i.e., decreasing
ω
). (Bottom) Global hardness
η
(in violet) [eV] for the same set of conformers, ranked in ascending order. Each point demonstrates the search for the lowest electrophilicity and higher hardness; hence, the algorithm will find the most reactive structure after 15 evolutions.](https://mdpi-res.com/cdn-cgi/image/w=281,h=192/https://mdpi-res.com/aichem/aichem-01-00001/article_deploy/html/images/aichem-01-00001-g001-550.jpg)


