


ISPRS Int. J. Geo-Inf. 2026, 15(8), 341; https://doi.org/10.3390/ijgi15080341 (registering DOI) - 25 Jul 2026
Abstract
►
Show Figures
This essay addresses the persistent understudying of negative spatial autocorrelation (SA) in spatial analysis, extending existing arguments that principal interpretations and geographic models have unduly prioritized positive dependence/correlation. It further reframes SA to explicitly recognize its negative nature as a legitimate and frequently
[...] Read more.
This essay addresses the persistent understudying of negative spatial autocorrelation (SA) in spatial analysis, extending existing arguments that principal interpretations and geographic models have unduly prioritized positive dependence/correlation. It further reframes SA to explicitly recognize its negative nature as a legitimate and frequently occurring georeferenced data property. Through empirical examples, scale-sensitive analysis, and a synthesized typology of negative SA facets, this paper advances a more balanced spatial dependence/correlation understanding. It challenges the superfluous model-induced artifact view about negative SA, demonstrating its real-world empirical and substantive emergence through heretofore unexamined empirical conditional territorial reshuffling and spatial competition, using historical Texas county subdivisions as a concrete exemplar. It translates the eight established canonical positive-SA-oriented interpretations to more negative-SA-friendly multivariate geospatial contexts, highlighting competing or compensatory dynamics among attributes. This paper emphasizes that negative SA can be a localized, scale-sensitive property, one often masked by dominant positive SA in any of its geographic extents, and encourages permutation/randomization-based inference to diagnose it in negative-SA-governed geographic landscapes. In addition, this paper explores the symmetry between positive and negative SA clusters across global, regional, and local scales, and examines negative SA roles with regard to spatial outliers, territorial management, and random contrasts, such as those earmarking early diffusion processes. This paper concludes that negative SA captures inverse locational relationships, is inherently delicate and transient, and responds sensitively to changes in geographic scale, resolution, and data aggregation, meriting more candid consideration in spatial statistics/econometric modeling.
Full article
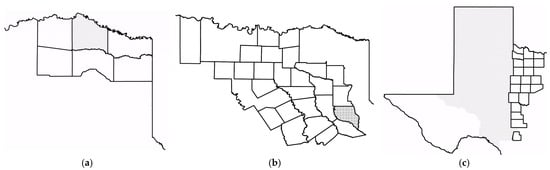
Figure 1


