

Atmosphere 2026, 17(6), 568; https://doi.org/10.3390/atmos17060568 (registering DOI) - 30 May 2026
Abstract
This study examines the evolution of thermal discomfort in Athens, Greece, using Thom’s Discomfort Index (TDI). The research commences from a historical reference period (1976–2005) and examines two future periods (2031–2060 and 2071–2100). TDI, which combines air temperature and relative humidity, was calculated
[...] Read more.
This study examines the evolution of thermal discomfort in Athens, Greece, using Thom’s Discomfort Index (TDI). The research commences from a historical reference period (1976–2005) and examines two future periods (2031–2060 and 2071–2100). TDI, which combines air temperature and relative humidity, was calculated based on three-hourly projections of five EURO-CORDEX regional climate models under the RCP4.5 and RCP8.5 emission scenarios. Model outputs were bias-corrected using observational data from the National Observatory of Athens for the reference period and subsequently applied to future projections. Results indicate a clear upward trend in high thermal discomfort days in the city center. Under RCP4.5, intense discomfort days increase by 21–39 days by mid-century and by approximately 1–2 months by the end of the century. Under the high-emission RCP8.5 scenario, the increase becomes dramatic, with intense discomfort conditions potentially extending by up to three months annually. Overall, projections reveal a clear deterioration of thermal conditions with a difference between RCP 4.5 and RCP 8.5, highlighting the critical importance of emission reduction strategies. The study of TDI shows that climate change does not merely raise temperatures, but drastically increases perceived discomfort and heat-related risk, transforming long parts of the year into thermally uncomfortable periods.
Full article
(This article belongs to the Special Issue The Drivers and Impacts of Climate Change Over the Eastern Mediterranean)
►
Show Figures
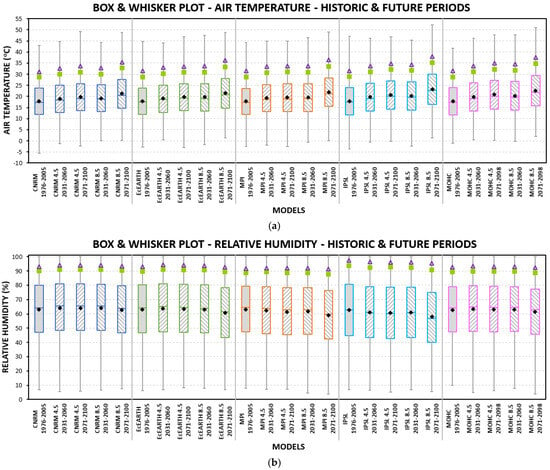
Figure 1


