Abstract
In the design stage of construction projects, determining the soil permeability coefficient is one of the most important steps in assessing groundwater, infiltration, runoff, and drainage. In this study, various kernel-function-based Gaussian process regression models were developed to estimate the soil permeability coefficient, based on six input parameters such as liquid limit, plastic limit, clay content, void ratio, natural water content, and specific density. In this study, a total of 84 soil samples data reported in the literature from the detailed design-stage investigations of the Da Nang–Quang Ngai national road project in Vietnam were used for developing and validating the models. The models’ performance was evaluated and compared using statistical error indicators such as root mean square error and mean absolute error, as well as the determination coefficient and correlation coefficient. The analysis of performance measures demonstrates that the Gaussian process regression model based on Pearson universal kernel achieved comparatively better and reliable results and, thus, should be encouraged in further research.
1. Introduction
One of the most essential variables governing soil’s fluid-flow characteristics is its permeability. The importance of determining the soil permeability coefficient is widely acknowledged, and is affected by a variety of parameters, including mineralogy, soil density, soil structures, water content, void ratio, and others [1]. Ganjidoost et al. [2] reported that three category factors remarkably affect the soil permeability coefficient, namely, permeable soil parameters (density, clay content, viscosity etc.), inherent soil parameters (Atterberg limits, particle size distribution, etc.), and compacted soil factors (porosity, water content, density, etc.). Most of these factors are closely related to each other. It was reported that the soil permeability coefficient was decreased by over 100 times when the percentage passing through sieve No. 100 increased by in the range of 0 to 7% [3]. Conducting several experiments with the difference in percentages of granular and low-plastic marine soils, Shakoor and Cook [4] concluded that the soil permeability coefficient noticeably increased by increasing the percentage of granular material. The coefficient of soil permeability is used to solve a variety of geotechnical issues, including slope stability, and structure collapse due to ground settlement, seepage, and leakage. As a result, several authors have attempted to establish empirical correlations between affecting factors and permeability coefficients [5,6].
Field or laboratory tests can be used to determine the soil permeability coefficient. It is shown that determining the soil permeability coefficient in the field is expensive, complicated, time-consuming, and tedious [7,8,9]. However, obtaining undisturbed samples for laboratory measurements of soil permeability coefficient is problematic. In particular, laboratory samples are frequently reconstituted to match those collected in the field. As a result of the devastation of soil fabric during sampling, laboratory test findings may not reflect the true value of soil permeability in the field [10]. Due to the specific advantages and disadvantages of each test, the soil permeability coefficient is calculated using a combination of field and laboratory data [7,10]. To assess soil permeability, several researchers proposed a regression that takes into account porosity, clay percentage, and sand particle size [11]. Several other researchers calculated soil permeability based on particle shape, grain size, and bulk density [12,13]. As previously stated, soil permeability is greatly influenced by particle size distribution; nevertheless, this is not true for all soils [9,14]. These empirical relationships include limitations and uncertainties, according to Pham et al. [1] study.
Machine-learning (ML) algorithms have recently been successful in solving real-world issues in a variety of fields, including civil and environmental engineering [15], and geotechnical engineering [16,17,18,19,20,21]. Several studies have used ML methods to predict the soil permeability coefficient, such as the adaptive neuro-fuzzy system (ANFIS), artificial neural network (ANN), and hybrid optimization model of genetic algorithm-ANFIS (GA-ANFIS) [2,9,22,23]. Sezer et al. [24] used an ANFIS to estimate granular soil permeability and found that the ANFIS algorithm is effective at estimating granular soil permeability when grain size distribution and particle shape are taken into account [22]. In comparison to single ANN, ANFIS model, and the hybrid GAANN model, the hybrid model GAANFIs outperformed in terms of prediction accuracy [2]. Soft computing-based models, in general, are excellent techniques for predicting soil parameters; for instance, random forest (RF) has been effectively used to predict soil properties including shear strength and permeability coefficient [25,26]. In geotechnical research, the permeability coefficient (k) of soil is an important component for designing civil-engineering structures on soil. Correlating other soil engineering parameters using an empirical equation to estimate “k” may not be correct [5,6,27]. Therefore, the aims of this study are (1) to develop new improved prediction models based on the Gaussian process regression (GPR) on Da Nang–Quang Ngai expressway development-project-site soil by using six soil parameters, such as liquid limit LL (%), plastic limit PL (%), clay content CC (%), void ratio e, natural water content w (%), and specific density γ (g/cm3) as inputs; (2) to divide data into training and testing datasets with due attention to statistical aspects such as the minimum, maximum, mean and standard deviation of the datasets. The splitting of the datasets is performed to find out the predictive ability and generalization performance of developed models and later helps in better evaluating them; (3) to compare the proposed models to the reference models used in the published literature; and (4) to investigate the importance and impact of each input parameter on the soil permeability coefficient.
2. Methodology
2.1. Data Catalog
The dataset comprises of 84 soil samples obtained from detailed design state investigations of the Da Nang-Quang Ngai expressway development project near Da Nang, central Vietnam (Figure 1) and is reported in the research work of Pham et al. [28] (see Appendix A for complete dataset). Further details about the collection, testing and type of soils can be found in the Pham et al. [28] reference. Previous studies show that the coefficient of soil permeability is a function of the liquid limit LL (%), plastic limit PL (%), clay content CC (%), void ratio e, natural water content w (%), and specific density γ (g/cm3) [1,28]. It has been widely accepted, among researchers, that the input factors selected by Pham et al. [1,28] constitute a complete and suitable set to estimate “k”. As a result, these input variables were used to create the GPR model in the current study. The same input parameters related to permeability were used to estimate the “k” (×10−9 cm/s) of soil. Researchers have used a different percentage of the available data as the training and testing sets for different problems. For instance, Pham et al. [29] used 60%; Liang et al. [30] used 70%; while Ahmad et al. [31] used 80% of the data for training. In this study, the data set was divided into training (70%) and testing (30%) based on statistically consistency. The statistical consistency of training and testing datasets was based on statistically consistency. The statistical consistency of training and testing datasets has a substantial impact on the results when using soft computing techniques, which improves the performance of the model and helps in evaluating them better. Figure 2 depicts the cumulative percentage and frequency distributions for all of the input and output parameters of the mentioned database utilized in the modeling of soil permeability coefficient. The data points of every input parameter are distributed over its range. The statistical analysis, i.e., minimum (Min), maximum (Max), mean, and standard deviation (Std. Dev) of the training and testing datasets is presented in Table 1.
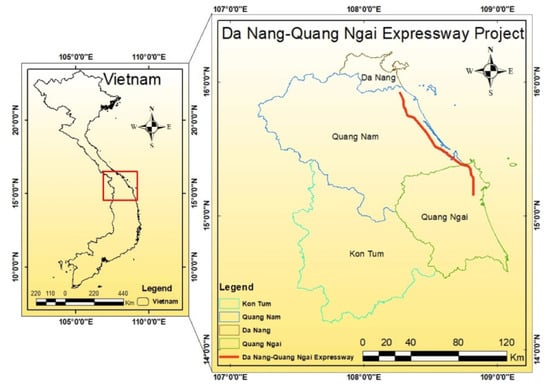
Figure 1.
Da Nang-Quang Ngai expressway project location map.
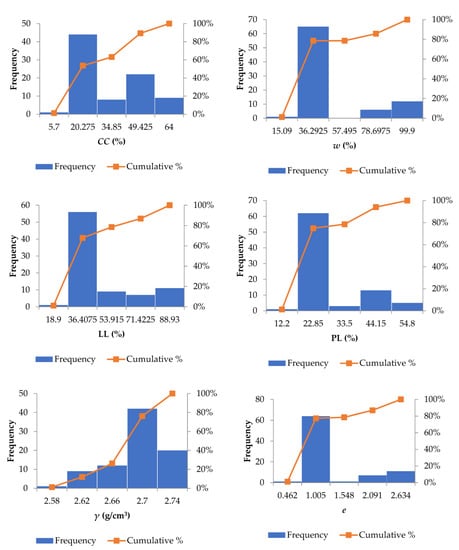
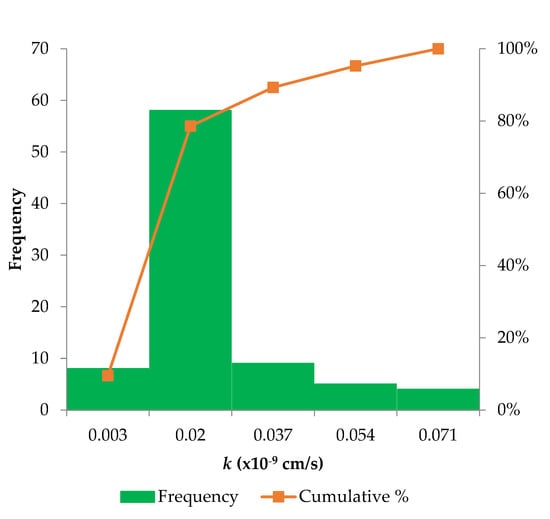
Figure 2.
Frequency distribution histogram of inputs (in blue) and output (in green) parameter.

Table 1.
Statistical analysis of the study’s inputs and output.
2.2. Gaussian Process Regression
Gaussian process regression (GPR) is a probabilistic, non-parametric supervised learning method for generalizing nonlinear and complicated function mapping hidden in data sets. The GPR model is based on Rasmussen and Williams’ [32] assumption that adjacent observations should communicate information about each other; it is a means of describing a prior directly over function space. The mean and covariance of a Gaussian distribution are vectors and matrices, respectively, whereas the Gaussian process is an over function. The GPR model can recognize a prediction distribution that is similar to the test input. A GPR is a set of random variables with a joint multivariate Gaussian distribution for any finite number. Let M × N denote the input and output domains, respectively, from which n pairings (Mi, Ni) are distributed independently and identically. For regression, let N⊆ ℜ; then, a GPR on 𝜒 is defined by a mean function μ: 𝜒→ℜ and a covariance function k:𝜒 × 𝜒→ℜ. Kuss [33] is recommended for more information on GPR and other covariance functions.
Details of Kernel Functions
The kernel function is used in the GPR design process. In the literature, several kernels have been discussed [34,35,36]. The following three kernel functions are used in this study:
- Polynomial (Poly)
- 2.
- Radial basis function (RBF)
- 3.
- Pearson universal kernel (PUK)
The kernel width () in RBF kernel, and parameters, σ (controls Pearson width) and ω (tailing factor of the peak) in PUK need to be established based on the precision in prediction.
2.3. Performance Metrics and Evaluation
To examine the performance of GPR modeling, the coefficient of determination (R2), correlation coefficient (R), mean absolute error (MAE), and root mean square error (RMSE) were utilized. The following formula can be used to compute these parameters:
where and represent the actual and estimated coefficient of soil permeability values, respectively; is the average of the reference samples’ values; and is the defined number of data points.
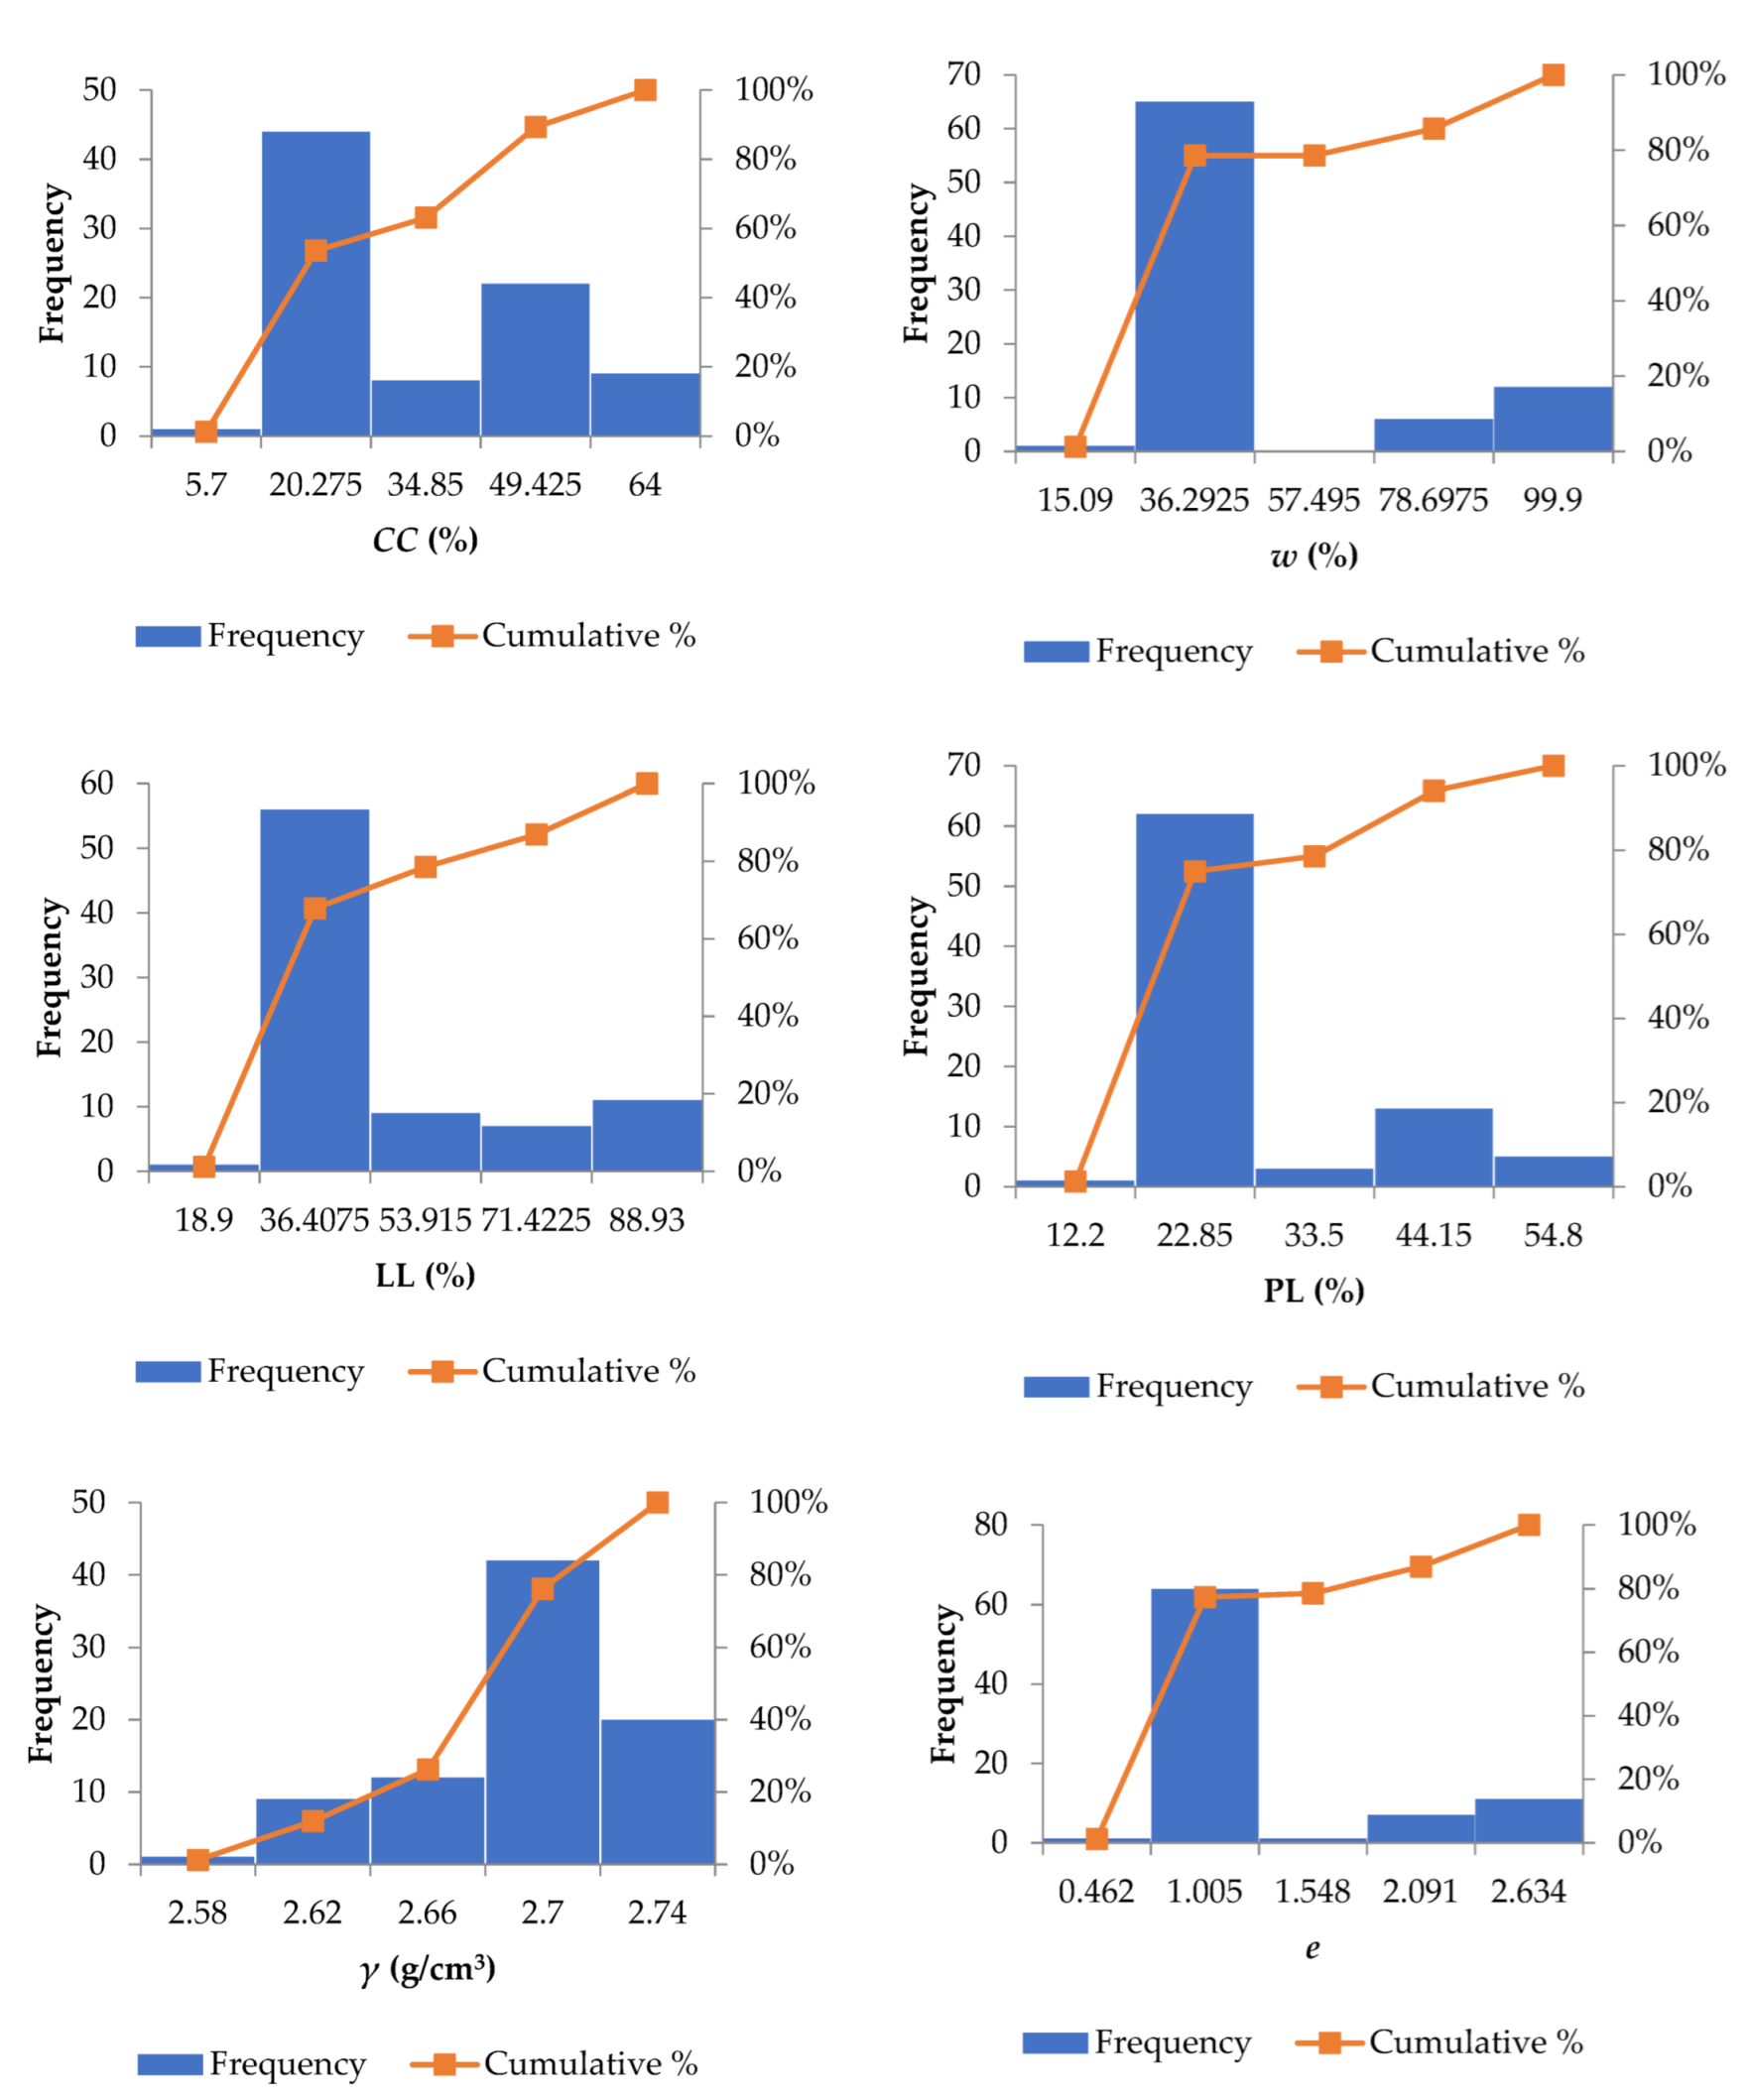
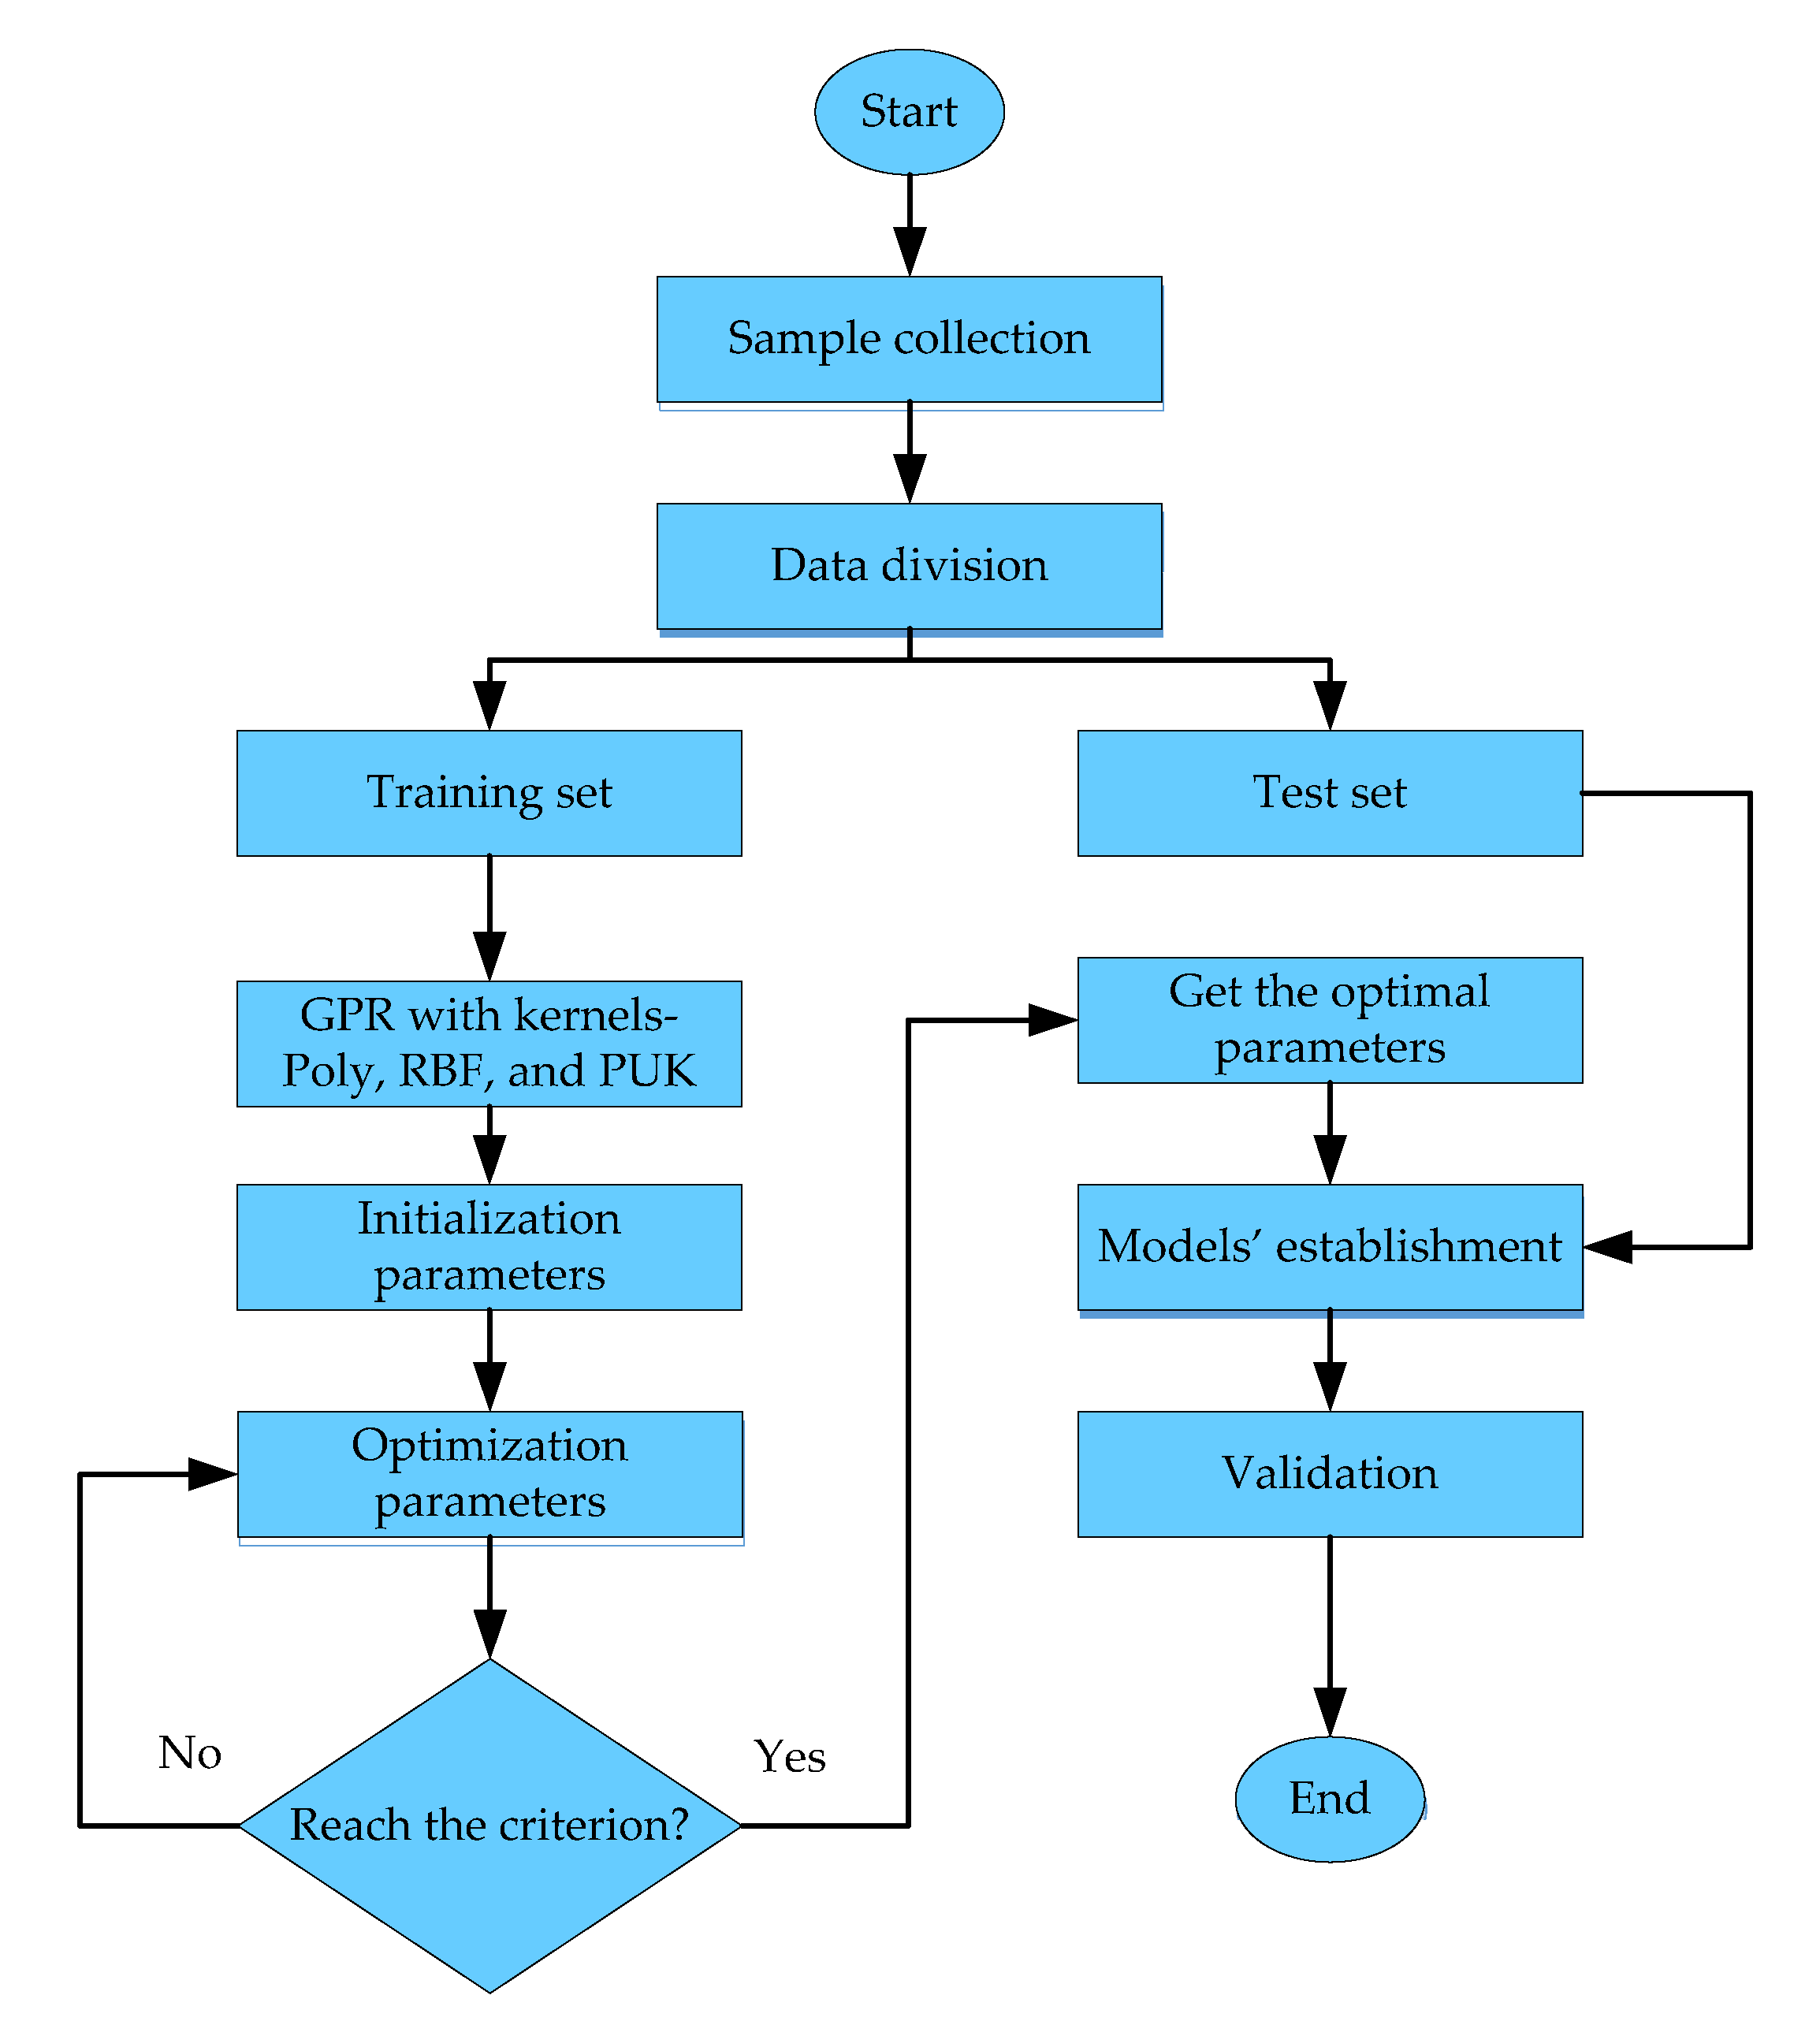
The R2 and R are used to express the degree of collinearity between estimated and actual data. The correlation coefficient, which ranges from 1 to −1, indicates how closely actual and estimated data are related. If R is equal to 0, there is no linear relationship. If R = 1 or −1, there is a perfect positive or negative linear relationship. R2 indicates how much percentage of variance in estimated data the model can explain. R2 is a number that ranges from 0 to 1, with higher values indicating less error variation and values over 0.5 considered acceptable [37,38]. The MAE indicates the mean of the estimated and actual values. The adjustment has a better effect when the MAE is close to 0, meaning that the prediction model more accurately describes the set of training data [39]. The RMSE is the average magnitudes of the errors in predictions for all observations in a single measure of predictive power. The RMSE is larger than or equal to 0, with 0 signifying that the observed data is statistically perfectly fit. As a result, the lesser the values of MAE and RMSE criteria are, the better the model. Visual representations such as scatter plots were also employed to compare the performance of the established models. The flowchart of the methodology of the present study is shown in Figure 3.

Figure 3.
Flowchart of the proposed methodology.
3. Results and Discussion
To estimate the soil permeability coefficient, GPR models must be analyzed once they have been developed. The outcomes of the evaluation show if the models have practical value, that is, whether they can accurately estimate the soil permeability coefficient. As previously stated, 70% and 30% of total dataset records were used as training and testing sets, respectively, for modeling using the GRP approach.
The Waikato Environment for Knowledge Analysis (WEKA) software was used to implement a number of kernel-function-based Gaussian process regressions in this paper. The WEKA is a collection of machine-learning algorithms for data-mining jobs that is available as open-source software. Hyperparameters must be adjusted in most machine-learning algorithms. Table 2 depicts how the GPR-RBF, GPR-Poly, and GPR-PUK models’ essential hyperparameters were adjusted in this study. First, the models’ tuning parameters were set, and then the trials were repeated until the best fitness measures in Table 2 were obtained.
Table 2.
The optimal tuning parameters for various regression models.
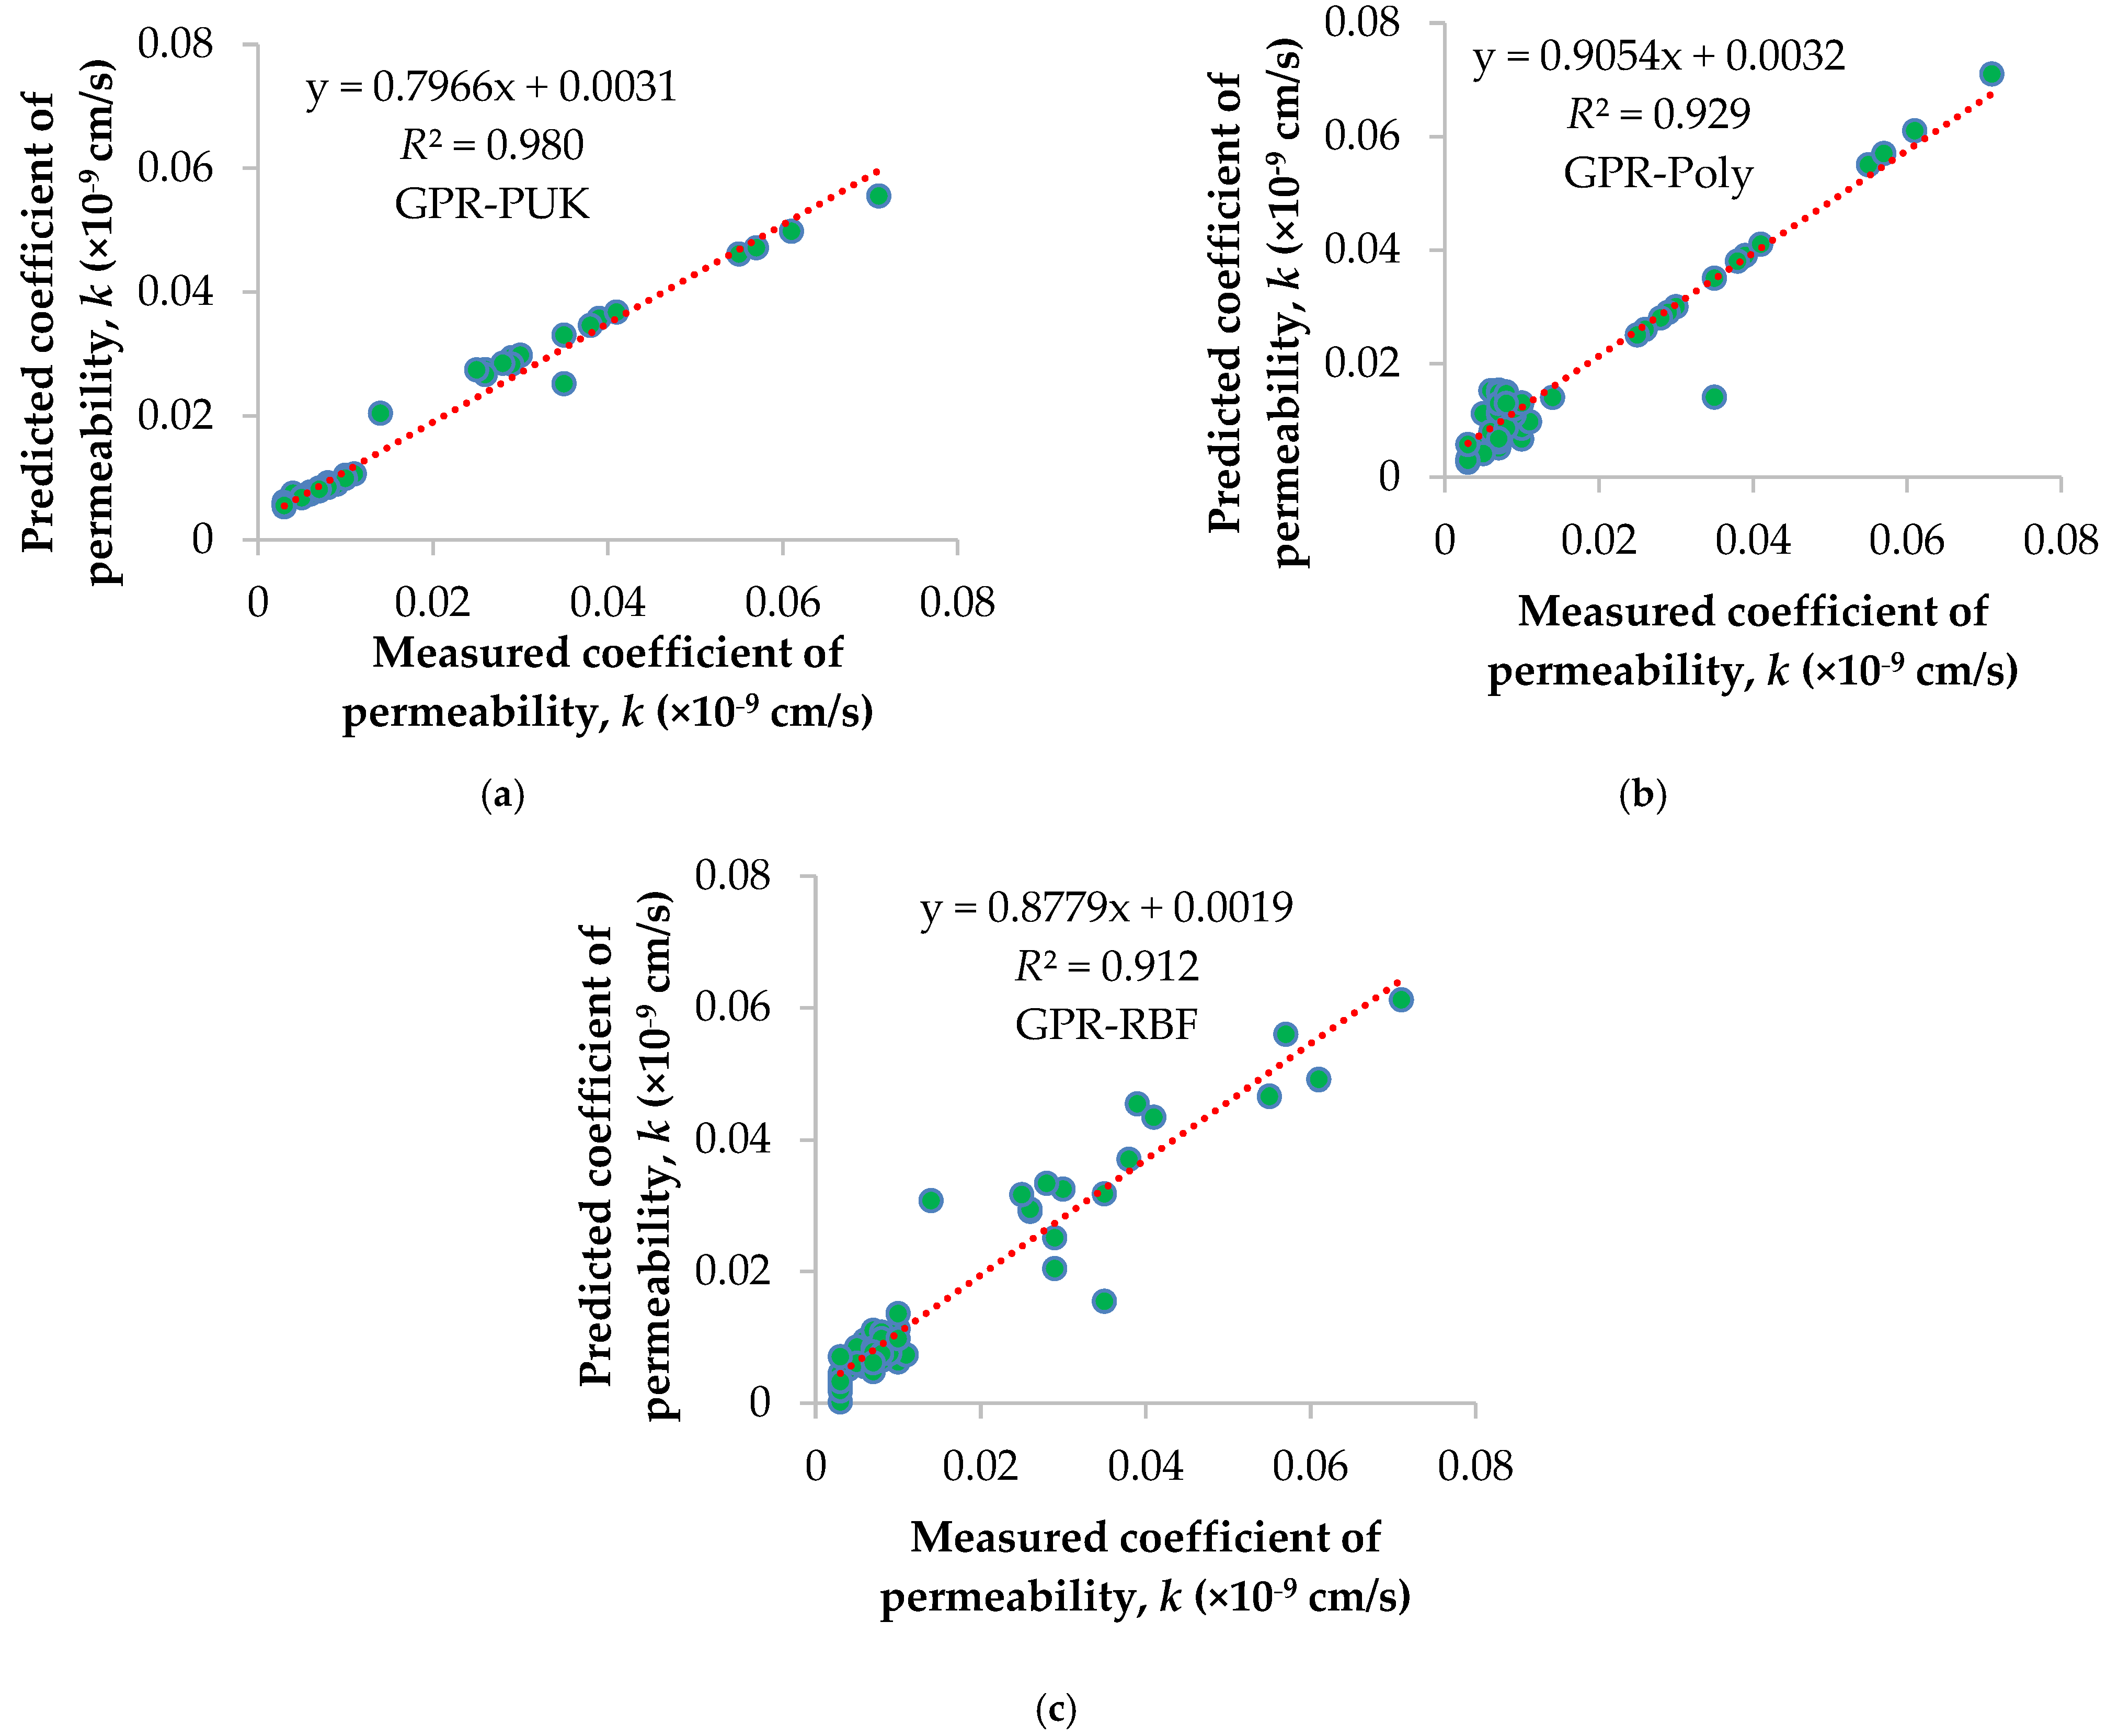
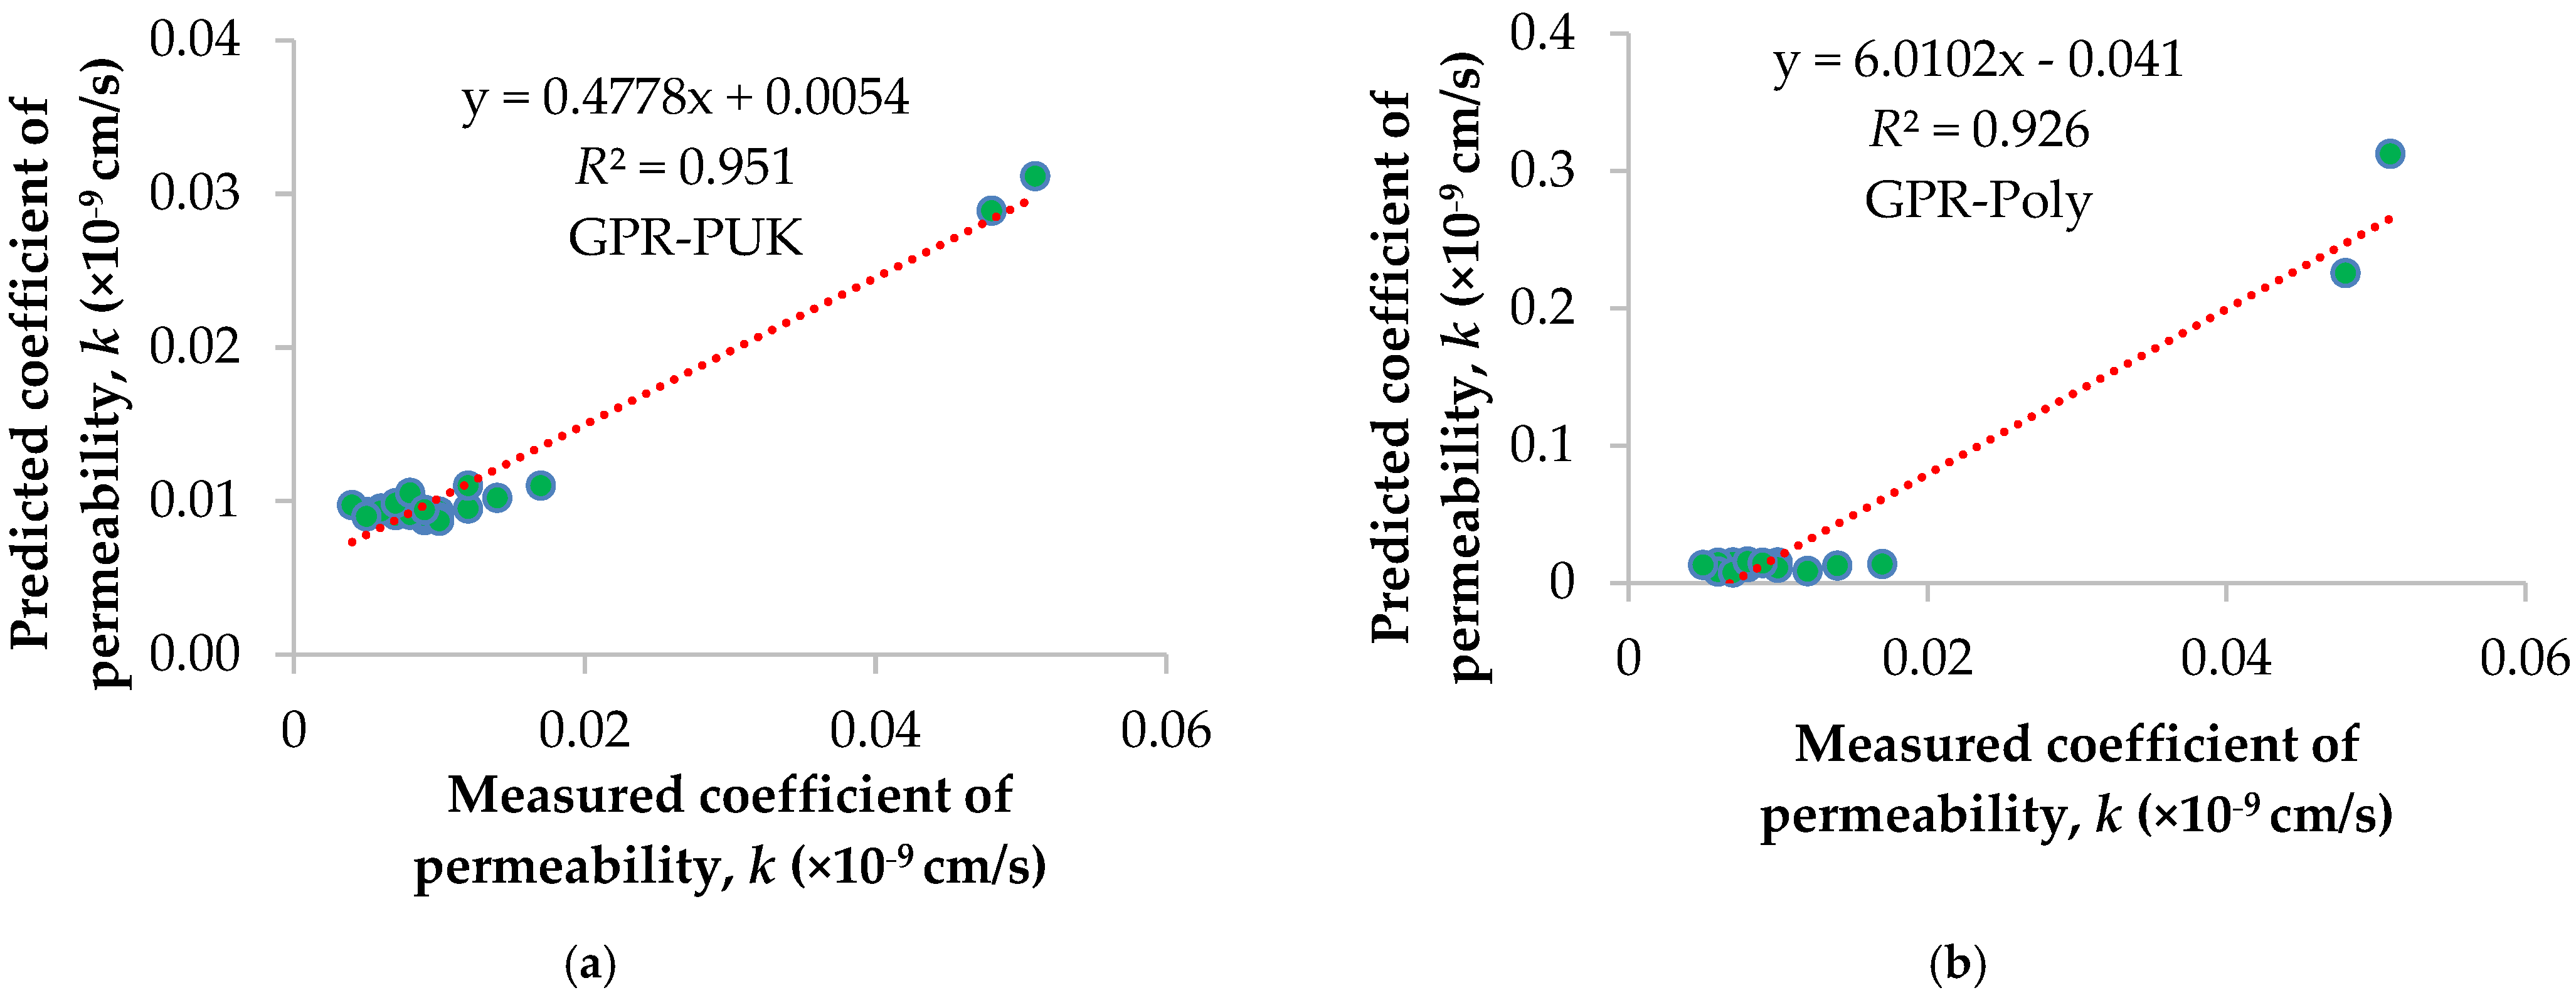
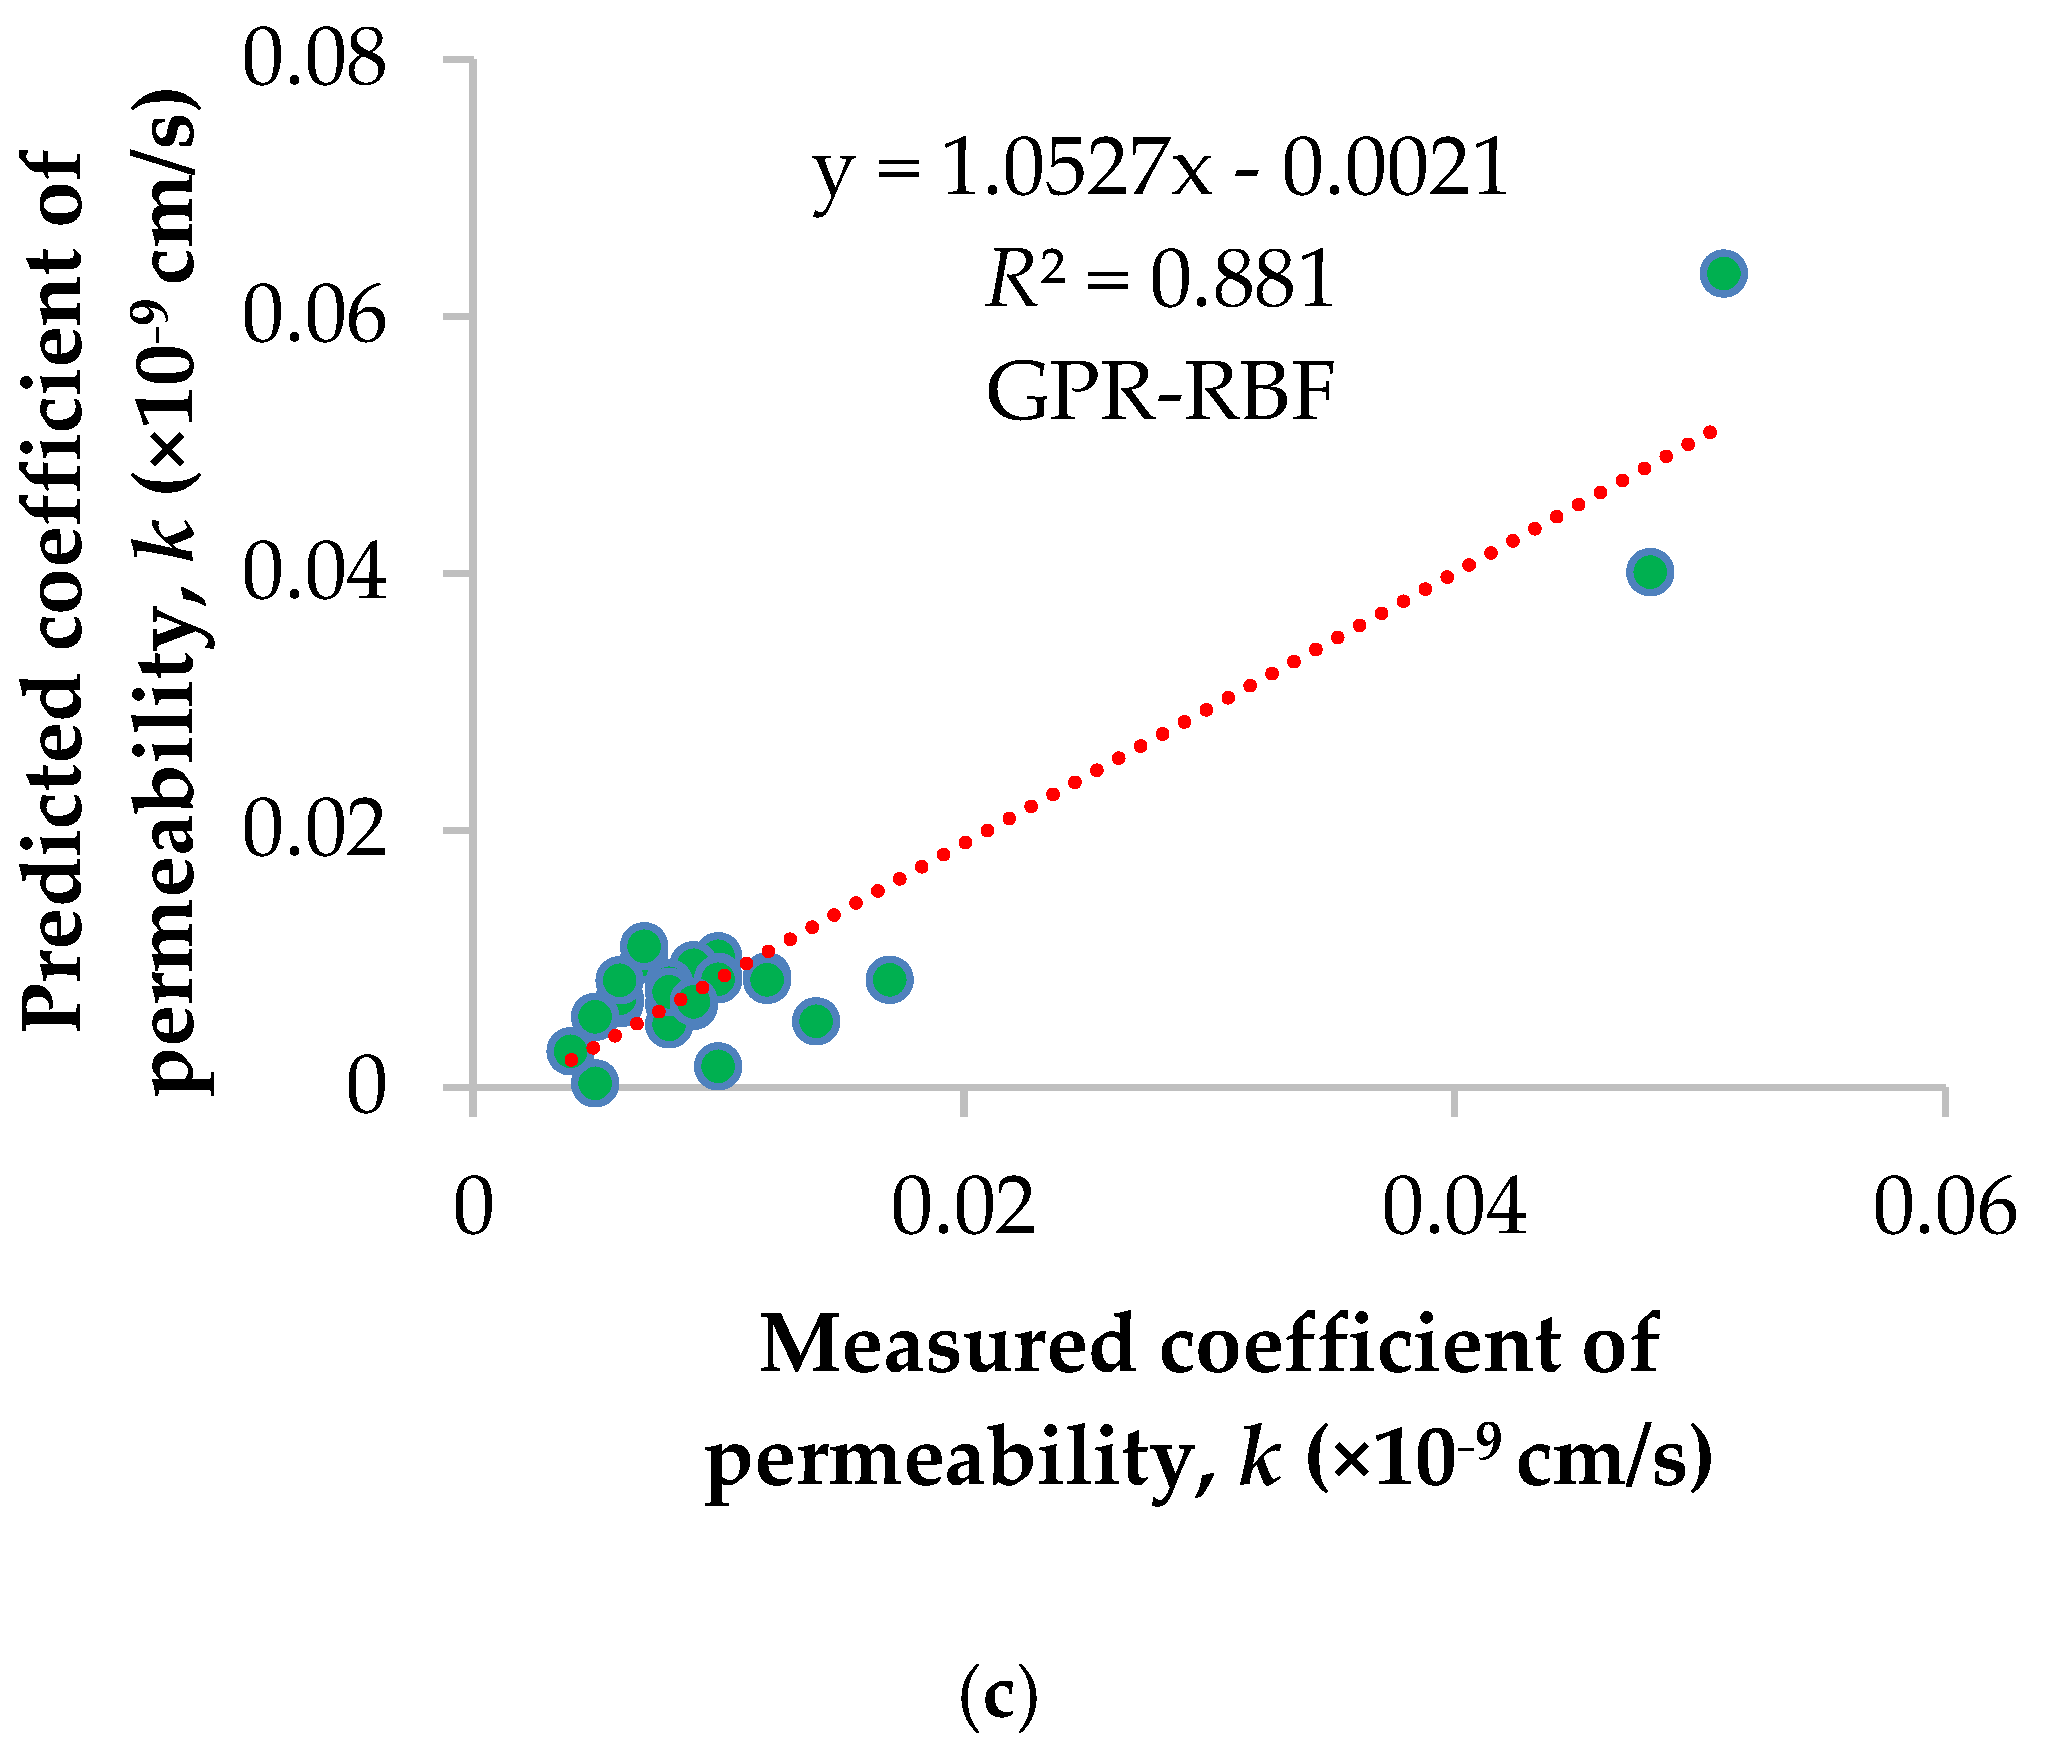
Table 3 lists the developed models’ results and their comparative performance results with other models reported in the literature. The top-ranked model was GPR-PUK, according to the results. Based on the training results, the R were 0.9901, 0.964, 0.9548; R2 0.980, 0.929, and 0.912; MAE 0.0023, 0.0028, and 0.0031; and RMSE 0.0038, 0.0047, and 0.0048 for GPR-PUK, GPR-Poly, and GPR-RBF models, respectively, the GPR-PUK outputs were verified to be the most compatible with actual coefficient of soil permeability values. Following that, GPR-Poly confirmed a high level of accuracy. Similarly, the GPR-PUK has the highest value of R (0.9754) and R2 (0.951), then comes the GPR-Poly (R = 0.9624; R2 = 0.926) and the GPR-RBF (R = 0.9387; R2 = 0.881) in the test dataset. The GPR-Poly, on the other hand, has the lowest values of MAE (0.0034), followed by the GPR-PUK (0.0037) and the GPR-RBF (0.0223), and the GPR-RBF has the lowest value of RMSE (0.0047), followed by the GPR-PUK (0.0062) and the GPR-Poly (0.0634).
Table 3.
Comparative performance of the GRP method and previously existing models.
Figure 4a–c and Figure 5a–c show the graphical correlation between measured (x-axis) and estimated (y-axis) coefficients of soil permeability for the training and testing datasets, respectively. The estimated values by GPR-PUK in the training and test sets have a high consistency with the actual/experimental values but fewer error points, as illustrated in Figure 4a and Figure 5a. The trend line for GPR-PUK was drawn by comparing the observed regression in Figure 4 and Figure 5, and the GPR-PUK findings have the maximum inclination to the line (see Figure 3a and Figure 4a) in the training phase (R2 = 0.980) and testing phase (R2 = 0.951), respectively. As a result, the GPR-PUK model proposed in this study can be utilized to calculate the soil permeability coefficient, as the predicted value agrees well with the actual value, indicating that this approach can accurately and effectively estimate the coefficient of soil permeability.
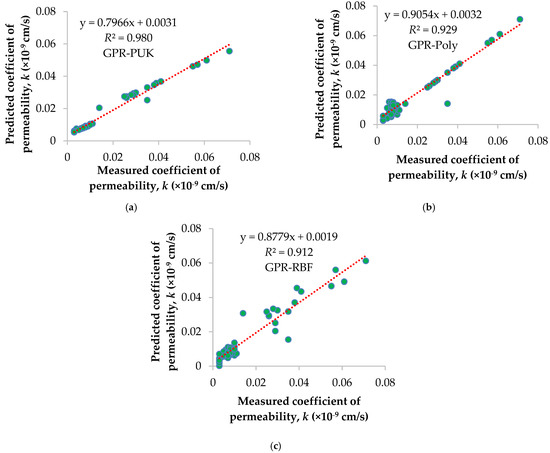
Figure 4.
Comparison of the predicted and actual results of various kernel-function-based GPR models in the training dataset: (a) GPR-PUK, (b) GPR-Poly, and (c) GPR-RBF.
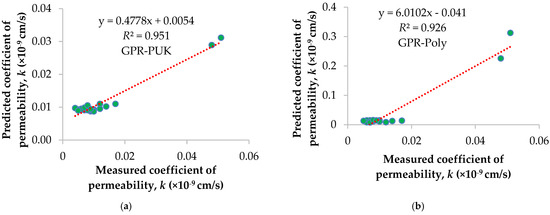
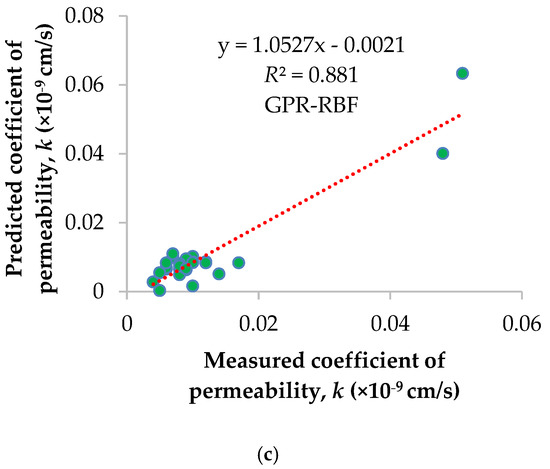
Figure 5.
Comparison of the predicted and actual results of various kernel-function-based GPR models in the testing dataset: (a) GPR-PUK, (b) GPR-Poly, and (c) GPR-RBF.
4. Comparison of Performance with Other Methods
In this section, the proposed GPR models were compared with other prediction models, i.e., RF, ANN, SVM, and M5P or M5Prime, reported in the literature and the CatBoost regression model, which is implemented in Orange software. The established values of user-defined parameters identified from various runs are the number of trees (100), maximum depth for CatBoost (10), and learning rate (0.042). In comparison to the findings of previous research published in the literature by Pham et al. [1] and compared with the CatBoost model, in the training dataset, the GPR (PUK) has the highest value of R (0.9901), followed by the GPR (Poly kernel) (0.964), CatBoost (0.960), GPR (RBF) (0.9548), RF (0.972), artificial neural network (ANN) (0.948) and the support vector machine (SVM) (0.861). The GPR (PUK) and RF has the lowest MAE (0.0023), followed by the ANN (0.0027), GPR (Poly) (0.0028), GPR (RBF) and CatBoost (0.0031), M5P (0.004) and the SVM (0.0056), respectively. In contrast, RF has the lowest RMSE (0.0035) value in comparison to the GPR (PUK) (0.0038). Similarly, in the testing dataset, the GPR (PUK) has the highest R value (0.9754), followed by the GPR (Poly) (0.9624), CatBoost (0.958), GPR (RBF) (0.9387), RF (0.851), ANN (0.845) and SVM (0.844). The ANN, on the other hand, has the lowest RMSE (0.001), and the CatBoost has the lowest MAE (0.0013). The M5P model reported by Pham et al. [28] has the R2 of 0.766, RMSE of 0.0064 and MAE of 0.004, in the case of the training dataset. Whereas, in the testing dataset, there is good agreement between actual and estimated values in the testing dataset, the M5P models’ error values are RMSE = 0.0081 and MAE = 0.0045 and the determination coefficient is high (R2 = 0.766) in the testing dataset. In general, the proposed GPR-PUK (R2 = 0.9754) has better prediction ability and has the highest goodness of fit with the data used in the training and testing datasets when compared to other models in this study.
5. Sensitivity Analysis
The developed models were evaluated using Yang and Zang’s [40] sensitivity analysis for measuring the influence of input factors on the coefficient of soil permeability. This approach [31,34,41,42,43,44] has been employed in a number of research investigations.
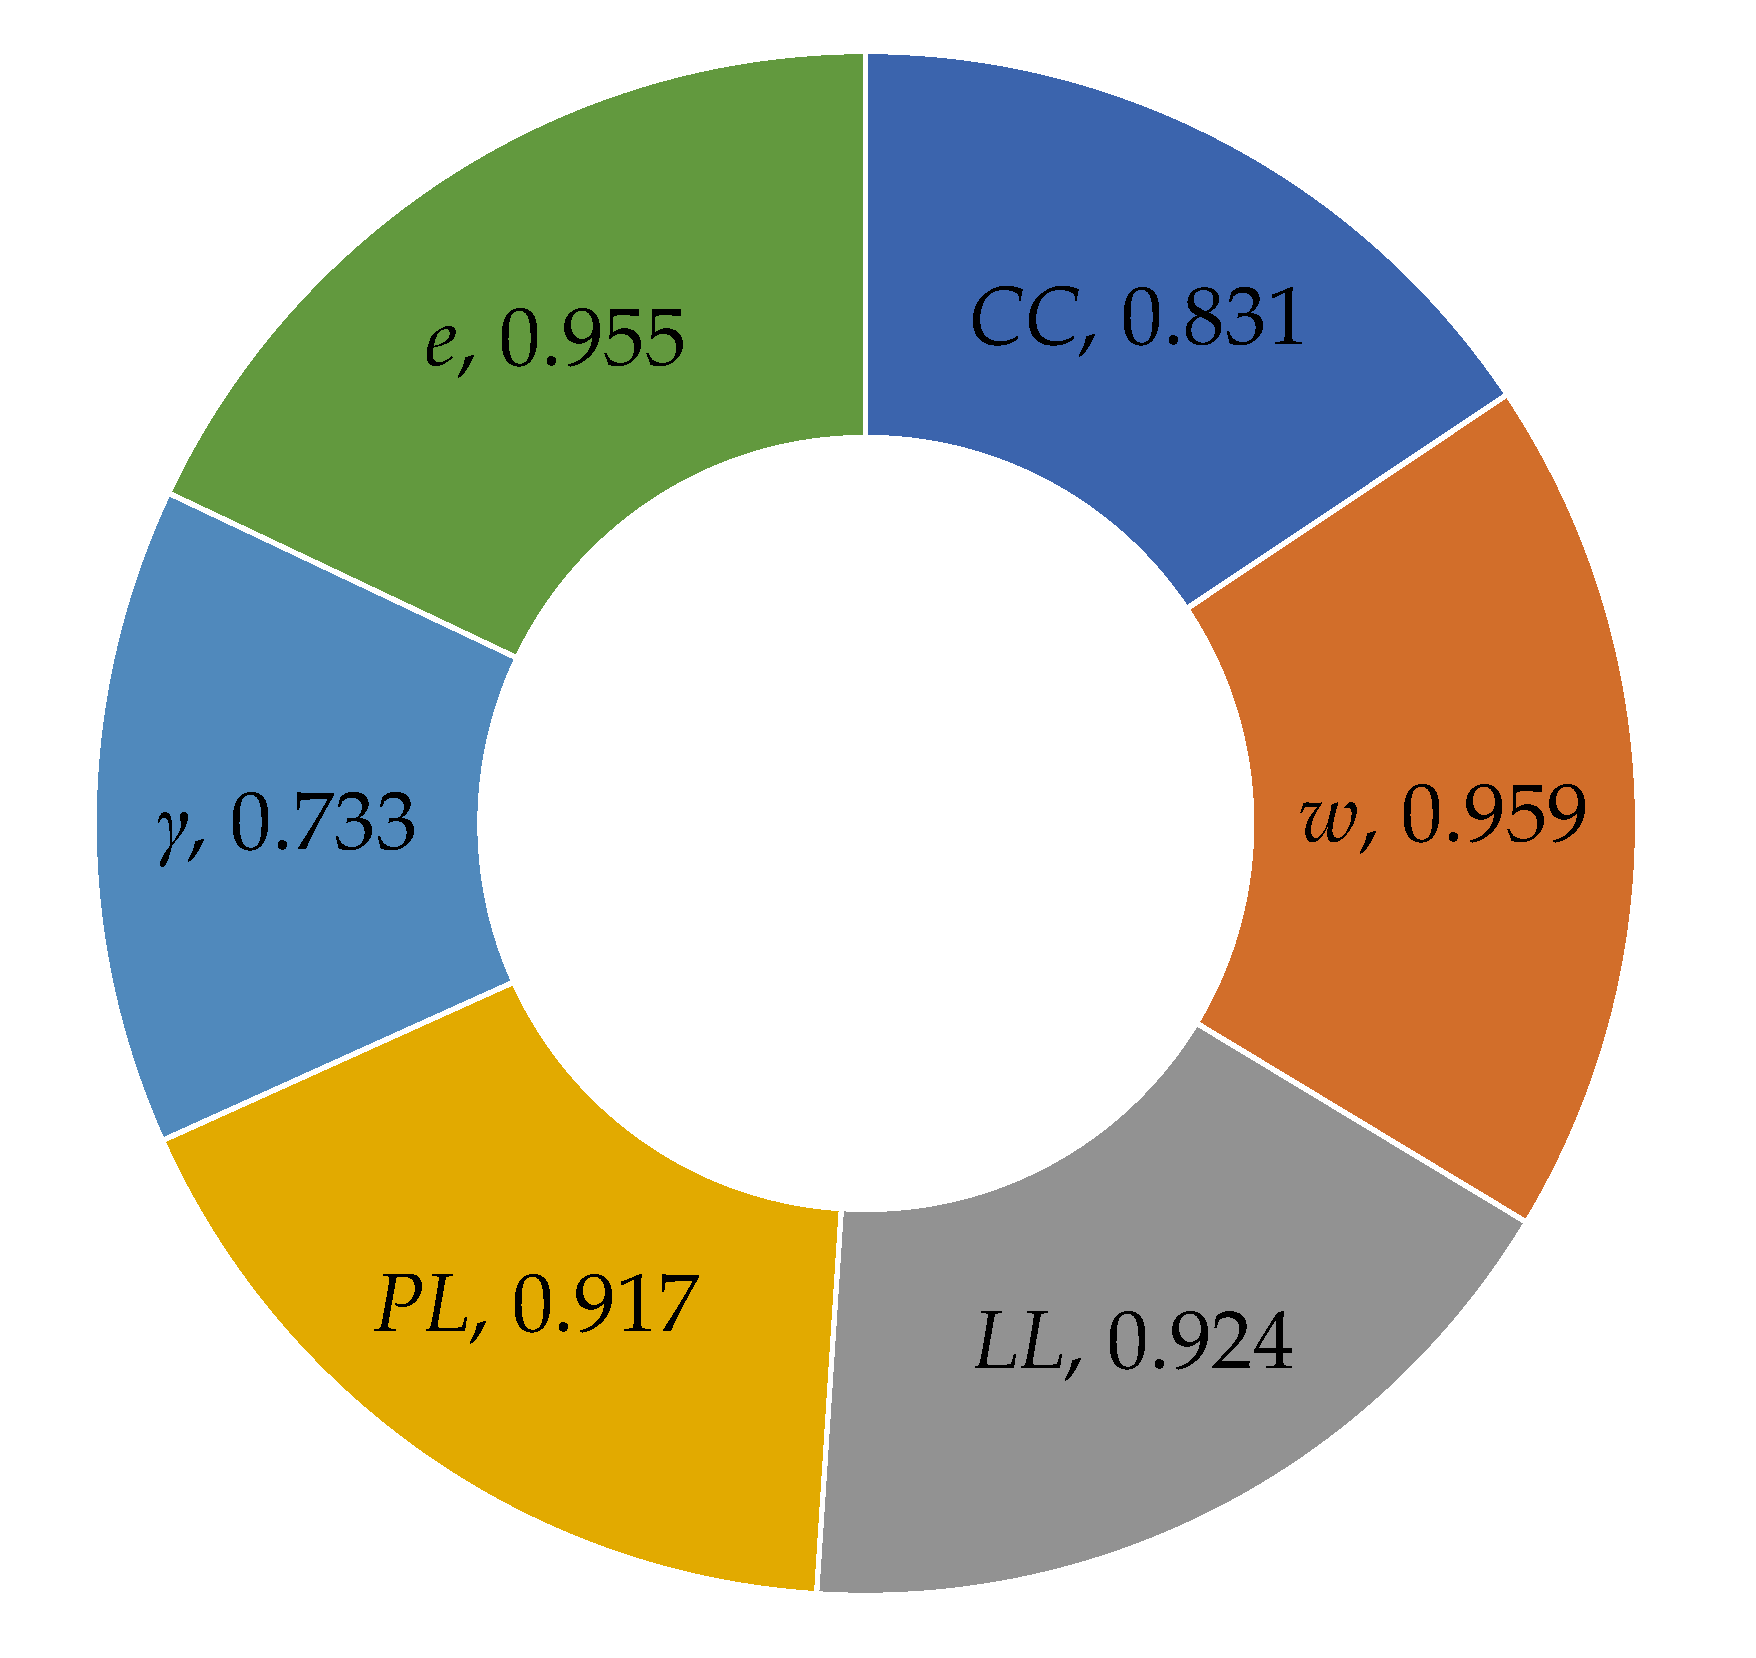
where is the number of data values, and are the input and output parameters. For each input parameter, the value varied from zero to one, with the highest values indicating the most efficient output parameter (which was k, in this study). The value of rij must be close to 1 in order to assess the relationship between input and output variables. Figure 6 depicts the relative importance of input factors based on experimental actual and predicted coefficient of permeability values. As can be seen, the relative importance of various parameters can be displayed as follows: w > e > LL > PL > CC > γ. In other words, the w is the most significant factor for estimating the coefficient of soil permeability, while γ is the least important parameter.

Figure 6.
Sensitivity analysis of the input parameters.
6. Conclusions
In this study, the GPR modeling method was used to estimate the coefficient of the permeability of soil with six input parameters: liquid limit LL (%), plastic limit PL (%), clay content CC (%), void ratio e, natural water content w (%), and specific density γ (g/cm3). The available data is divided into two parts: training set (70%) and testing set (30%). The following is a summary of the findings of this study:
- Comparing GPR models’ performance reveals that the GPR-PUK model gives more accurate prediction results with the coefficient of determination being 0.951, achieved from the correlation between experimental and estimated values of k.
- The GPR-PUK model’s estimation of the soil permeability coefficient was found to be more reliable than that of the ANN, SVM, RF, and M5P models reported in the literature.
- The findings of the sensitivity analysis demonstrate that different input factors have varying degrees of significance on the coefficient of soil permeability as w > e > LL > PL > CC > γ.
Development and improvement of the performance of models are a continuous process. The GPR-PUK model can accurately estimate the permeability coefficient of the soil using limited soil parameters, according to the findings of this study, but more research at different sites is needed to prove its wider application. It is evident that the proposed models are open to further modification, and that more data will result in much improved prediction capacity.
Author Contributions
Conceptualization, M.A., S.K.; methodology, M.A., K.R.K. and M.M.S.S.; software, M.A. and S.K.; validation, M.A., M.W. and M.R.B.I.; formal analysis, M.R.B.I. and M.A.; investigation, M.A., K.R.K., M.M.S.S. and M.W.; resources, M.M.S.S.; data curation, M.W.; writing—original draft preparation, M.A. and K.R.K.; writing—review and editing, M.A., M.R.B.I. and M.W.; visualization—review and editing, M.M.S.S.; supervision, M.A., M.R.B.I. and S.K.; project administration, M.M.S.S.; funding acquisition, M.M.S.S. All authors have read and agreed to the published version of the manuscript.
Funding
The research is partially funded by the Ministry of Science and Higher Education of the Russian Federation under the strategic academic leadership program ‘Priority 2030’ (Agreement 075-15-2021-1333 dated 30 September 2021).
Institutional Review Board Statement
Not applicable.
Informed Consent Statement
Not applicable.
Data Availability Statement
The data used to support the findings of this study are included within the article.
Acknowledgments
This paper was supported by the RUDN University Strategic Academic Leadership Program (recipient K. Reza Kashyzadeh: methodology, investigation, and writing—original draft preparation).
Conflicts of Interest
The authors declare no conflict of interest.
Notation
| ANN | Artificial neural network |
| RF | Random forest |
| SVM | Support vector machine |
| GPR | Gaussian process regression |
| MAE | Mean absolute error |
| M5P | M5Prime algorithm |
| RMSE | Root mean square error |
| PUK | Pearson universal kernel |
| RBF | Radial basis function |
| XGBoost | Extreme gradient boosting |
| R2 | Coefficient of determination |
| R | Correlation coefficient |
| k | Soil permeability coefficient (×10−9 cm/s) |
| LL | Liquid limit (%) |
| PL | Plastic limit (%) |
| CC | Clay content (%) |
| e | Void ratio |
| w | Natural water content (%) |
| γ | Specific density (g/cm3) |
Appendix A
Table A1.
Dataset used in the present research.
Table A1.
Dataset used in the present research.
| S. No. | CC (%) | w (%) | LL (%) | PL (%) | γ (g/cm3) | e | k (×10−9 cm/s) |
|---|---|---|---|---|---|---|---|
| 1 | 44 | 93.73 | 75.62 | 46.8 | 2.59 | 2.453 | 0.029 |
| 2 | 21.7 | 20.71 | 24.58 | 13.5 | 2.72 | 0.639 | 0.01 |
| 3 | 51.8 | 20.98 | 38.17 | 20.2 | 2.73 | 0.625 | 0.003 |
| 4 | 9.7 | 18.02 | 20.51 | 14.2 | 2.68 | 0.605 | 0.007 |
| 5 | 46.9 | 95.58 | 82.25 | 53 | 2.6 | 2.514 | 0.026 |
| 6 | 12.7 | 22.71 | 28.5 | 17.8 | 2.69 | 0.671 | 0.01 |
| 7 | 47.5 | 85.35 | 71.24 | 40.5 | 2.62 | 2.275 | 0.014 |
| 8 | 59.4 | 24.95 | 41.87 | 22.3 | 2.74 | 0.713 | 0.003 |
| 9 | 9.2 | 23.97 | 26.52 | 19.8 | 2.67 | 0.723 | 0.008 |
| 10 | 55.3 | 98.01 | 73.63 | 40.1 | 2.59 | 2.597 | 0.035 |
| 11 | 44.8 | 79.96 | 75.45 | 43.6 | 2.59 | 2.083 | 0.039 |
| 12 | 51.1 | 73.75 | 66.96 | 35.8 | 2.61 | 1.966 | 0.061 |
| 13 | 46.1 | 25.78 | 38.03 | 17.5 | 2.73 | 0.808 | 0.003 |
| 14 | 56.1 | 83.25 | 78.23 | 41.9 | 2.62 | 2.235 | 0.055 |
| 15 | 16.1 | 17.52 | 25.85 | 12.2 | 2.69 | 0.546 | 0.01 |
| 16 | 49 | 25.45 | 48.24 | 24.8 | 2.72 | 0.711 | 0.003 |
| 17 | 10.7 | 24.53 | 27.22 | 19.6 | 2.69 | 0.713 | 0.007 |
| 18 | 64 | 78.72 | 75.53 | 39.5 | 2.64 | 2.106 | 0.03 |
| 19 | 5.7 | 17.35 | 20.34 | 14.25 | 2.66 | 0.494 | 0.006 |
| 20 | 41.9 | 69.26 | 66.42 | 48.5 | 2.64 | 1.87 | 0.029 |
| 21 | 9.5 | 18.12 | 21.2 | 14.5 | 2.68 | 0.567 | 0.008 |
| 22 | 7.6 | 20.23 | 23.62 | 16.8 | 2.69 | 0.64 | 0.007 |
| 23 | 11 | 20.14 | 22.78 | 16.1 | 2.67 | 0.608 | 0.008 |
| 24 | 45 | 35.53 | 53.56 | 28.6 | 2.74 | 1.015 | 0.004 |
| 25 | 8.5 | 20.81 | 25.31 | 18.53 | 2.68 | 0.576 | 0.005 |
| 26 | 8.6 | 20.12 | 20.82 | 14.8 | 2.67 | 0.599 | 0.007 |
| 27 | 10.7 | 17.25 | 19.5 | 13.5 | 2.68 | 0.558 | 0.008 |
| 28 | 8.9 | 21.79 | 24.98 | 19 | 2.68 | 0.654 | 0.007 |
| 29 | 46.4 | 99.9 | 82.11 | 43.6 | 2.58 | 2.634 | 0.041 |
| 30 | 9.7 | 17.34 | 20.49 | 14.3 | 2.66 | 0.486 | 0.007 |
| 31 | 25.9 | 21.23 | 31.18 | 13.2 | 2.72 | 0.609 | 0.005 |
| 32 | 12.5 | 19.25 | 23.46 | 14.67 | 2.67 | 0.628 | 0.008 |
| 33 | 8.4 | 19.46 | 22.97 | 17.43 | 2.68 | 0.605 | 0.007 |
| 34 | 8.1 | 23.28 | 26.8 | 20.36 | 2.68 | 0.707 | 0.011 |
| 35 | 23.6 | 18.84 | 27.48 | 13.8 | 2.71 | 0.604 | 0.006 |
| 36 | 63.4 | 73.1 | 68.47 | 35 | 2.61 | 1.933 | 0.028 |
| 37 | 19 | 18.35 | 23.61 | 13.35 | 2.7 | 0.579 | 0.007 |
| 38 | 42.5 | 27.28 | 39.99 | 21.74 | 2.72 | 0.789 | 0.003 |
| 39 | 49.4 | 62.2 | 59.99 | 38.5 | 2.63 | 1.657 | 0.026 |
| 40 | 23.5 | 21.32 | 32.23 | 16.4 | 2.71 | 0.604 | 0.005 |
| 41 | 6.1 | 16.97 | 21.01 | 15.87 | 2.66 | 0.556 | 0.007 |
| 42 | 7.7 | 21.23 | 25.3 | 18.5 | 2.68 | 0.654 | 0.009 |
| 43 | 9.7 | 18.01 | 20.3 | 14.2 | 2.67 | 0.599 | 0.007 |
| 44 | 8.5 | 25.49 | 27.49 | 21.32 | 2.67 | 0.723 | 0.008 |
| 45 | 60.2 | 95.09 | 84.05 | 54.8 | 2.63 | 2.507 | 0.038 |
| 46 | 40.3 | 20.75 | 40.77 | 18.64 | 2.72 | 0.591 | 0.003 |
| 47 | 8.4 | 18.25 | 21.08 | 14.5 | 2.69 | 0.592 | 0.008 |
| 48 | 50.7 | 28.97 | 46.04 | 25.2 | 2.72 | 0.889 | 0.003 |
| 49 | 8.8 | 17.19 | 19.81 | 14.3 | 2.68 | 0.549 | 0.007 |
| 50 | 46.6 | 76.77 | 64.83 | 38.17 | 2.63 | 2.023 | 0.025 |
| 51 | 9.6 | 17.99 | 20.42 | 15 | 2.67 | 0.571 | 0.008 |
| 52 | 8.6 | 19.9 | 23 | 16.9 | 2.68 | 0.586 | 0.009 |
| 53 | 9.2 | 17.81 | 21 | 14.3 | 2.68 | 0.506 | 0.01 |
| 54 | 11.7 | 19.77 | 23.91 | 13.5 | 2.68 | 0.567 | 0.035 |
| 55 | 9.4 | 17.85 | 20.48 | 14.8 | 2.68 | 0.558 | 0.008 |
| 56 | 45.1 | 93.19 | 88.93 | 48 | 2.62 | 2.447 | 0.057 |
| 57 | 46.1 | 70.21 | 65.46 | 33.6 | 2.64 | 1.87 | 0.071 |
| 58 | 37.4 | 21.13 | 32.44 | 14.2 | 2.71 | 0.642 | 0.003 |
| 59 | 45.3 | 19.6 | 30.92 | 13.2 | 2.73 | 0.569 | 0.007 |
| 60 | 19 | 24.55 | 29.08 | 19.6 | 2.68 | 0.707 | 0.017 |
| 61 | 37.6 | 87.71 | 75.34 | 40.5 | 2.63 | 2.329 | 0.048 |
| 62 | 8 | 18.05 | 20.99 | 14.3 | 2.68 | 0.595 | 0.01 |
| 63 | 8.5 | 19.85 | 23.67 | 17.58 | 2.67 | 0.599 | 0.008 |
| 64 | 9.6 | 18.18 | 22.58 | 16 | 2.68 | 0.567 | 0.006 |
| 65 | 8.6 | 18.02 | 20.51 | 14.6 | 2.69 | 0.592 | 0.012 |
| 66 | 8.3 | 18.01 | 21 | 14.2 | 2.67 | 0.599 | 0.007 |
| 67 | 10.2 | 18.15 | 22.14 | 15.6 | 2.67 | 0.517 | 0.006 |
| 68 | 8.6 | 24.84 | 29.32 | 22 | 2.68 | 0.752 | 0.012 |
| 69 | 45.8 | 89.51 | 85.86 | 42.7 | 2.63 | 2.372 | 0.051 |
| 70 | 38.6 | 22.79 | 35.83 | 15.2 | 2.72 | 0.689 | 0.009 |
| 71 | 8.2 | 17.12 | 19.7 | 13.8 | 2.67 | 0.571 | 0.01 |
| 72 | 26.5 | 21.89 | 30.98 | 17.4 | 2.72 | 0.619 | 0.005 |
| 73 | 24.5 | 18.28 | 28.11 | 12.5 | 2.71 | 0.522 | 0.006 |
| 74 | 21 | 20.62 | 28.62 | 17.4 | 2.69 | 0.592 | 0.014 |
| 75 | 9.3 | 21.14 | 23.89 | 18.53 | 2.68 | 0.686 | 0.008 |
| 76 | 8.4 | 18.02 | 21.1 | 14.5 | 2.67 | 0.552 | 0.009 |
| 77 | 9.8 | 18.07 | 20.62 | 14.5 | 2.68 | 0.567 | 0.01 |
| 78 | 30.4 | 22.23 | 39.53 | 18.64 | 2.72 | 0.648 | 0.004 |
| 79 | 9.8 | 22.03 | 23.92 | 17.8 | 2.68 | 0.644 | 0.008 |
| 80 | 6.7 | 18.91 | 21.49 | 15 | 2.69 | 0.582 | 0.007 |
| 81 | 43.4 | 25.6 | 34.5 | 15.6 | 2.73 | 0.717 | 0.005 |
| 82 | 40.1 | 25.53 | 36.11 | 19.2 | 2.72 | 0.755 | 0.01 |
| 83 | 8.7 | 15.09 | 18.9 | 12.63 | 2.66 | 0.462 | 0.008 |
| 84 | 9.4 | 19.64 | 23.8 | 17.2 | 2.67 | 0.648 | 0.009 |
References
- Pham, B.T.; Nguyen, M.D.; Al-Ansari, N.; Tran, Q.A.; Ho, L.S.; Le, H.V.; Prakash, I. A Comparative Study of Soft Computing Models for Prediction of Permeability Coefficient of Soil. Math. Probl. Eng. 2021, 2021, 7631493. [Google Scholar] [CrossRef]
- Ganjidoost, H.; Mousavi, S.J.; Soroush, A. Adaptive network-based fuzzy inference systems coupled with genetic algorithms for predicting soil permeability coefficient. Neural Process. Lett. 2016, 44, 53–79. [Google Scholar] [CrossRef]
- Cedergren, H.R. Seepage, Drainage, and Flow Nets; Wiley: London, UK, 1988; Volume 3. [Google Scholar]
- Shakoor, A.; Cook, B.D. The effect of stone content, size, and shape on the engineering properties of a compacted silty clay. Bull. Assoc. Eng. Geol. 1990, 27, 245–253. [Google Scholar] [CrossRef]
- Mitchell, J.K.; Hooper, D.R.; Campenella, R.G. Permeability of compacted clay. J. Soil Mech. Found. Div. 1965, 91, 41–65. [Google Scholar] [CrossRef]
- Olson, R.E. Effective stress theory of soil compaction. J. Soil Mech. Found. Div. 1963, 89, 27–45. [Google Scholar] [CrossRef]
- Vienken, T.; Dietrich, P. Field evaluation of methods for determining hydraulic conductivity from grain size data. J. Hydrol. 2011, 400, 58–71. [Google Scholar] [CrossRef]
- Rehfeldt, K.R.; Boggs, J.M.; Gelhar, L.W. Field study of dispersion in a heterogeneous aquifer: 3. Geostatistical analysis of hydraulic conductivity. Water Resour. Res. 1992, 28, 3309–3324. [Google Scholar] [CrossRef]
- Sinha, S.K.; Wang, M.C. Artificial neural network prediction models for soil compaction and permeability. Geotech. Geol. Eng. 2008, 26, 47–64. [Google Scholar] [CrossRef]
- Elhakim, A.F. Estimation of soil permeability. Alex. Eng. J. 2016, 55, 2631–2638. [Google Scholar] [CrossRef] [Green Version]
- Rawls, W.; Brakensiek, D. Estimation of soil water retention and hydraulic properties. In Unsaturated Flow in Hydrologic Modeling; Springer: Berlin/Heidelberg, Germany, 1989; pp. 275–300. [Google Scholar]
- Sperry, J.M.; Peirce, J.J. A model for estimating the hydraulic conductivity of granular material based on grain shape, grain size, and porosity. Groundwater 1995, 33, 892–898. [Google Scholar] [CrossRef]
- Lebron, I.; Schaap, M.; Suarez, D. Saturated hydraulic conductivity prediction from microscopic pore geometry measurements and neural network analysis. Water Resour. Res. 1999, 35, 3149–3158. [Google Scholar] [CrossRef]
- Hauser, V.L. Seepage control by particle size selection. Trans. ASAE 1978, 21, 691–0695. [Google Scholar] [CrossRef]
- Froemelt, A.; Dürrenmatt, D.J.; Hellweg, S. Using data mining to assess environmental impacts of household consumption behaviors. Environ. Sci. Technol. 2018, 52, 8467–8478. [Google Scholar] [CrossRef] [PubMed]
- Ahmad, M.; Tang, X.-W.; Qiu, J.-N.; Gu, W.-J.; Ahmad, F. A hybrid approach for evaluating CPT-based seismic soil liquefaction potential using Bayesian belief networks. J. Cent. South Univ. 2020, 27, 500–516. [Google Scholar]
- Ahmad, M.; Tang, X.-W.; Qiu, J.-N.; Ahmad, F. Evaluating Seismic Soil Liquefaction Potential Using Bayesian Belief Network and C4. 5 Decision Tree Approaches. Appl. Sci. 2019, 9, 4226. [Google Scholar] [CrossRef] [Green Version]
- Ahmad, M.; Tang, X.; Qiu, J.; Ahmad, F.; Gu, W. LLDV-a Comprehensive Framework for Assessing the Effects of Liquefaction Land Damage Potential. In Proceedings of the 2019 IEEE 14th International Conference on Intelligent Systems and Knowledge Engineering (ISKE), Dalian, China, 14–16 November 2019; pp. 527–533. [Google Scholar]
- Ahmad, M.; Tang, X.-W.; Qiu, J.-N.; Ahmad, F.; Gu, W.-J. A step forward towards a comprehensive framework for assessing liquefaction land damage vulnerability: Exploration from historical data. Front. Struct. Civ. Eng. 2020, 14, 1476–1491. [Google Scholar] [CrossRef]
- Ahmad, M.; Tang, X.; Ahmad, F. Evaluation of Liquefaction-Induced Settlement Using Random Forest and REP Tree Models: Taking Pohang Earthquake as a Case of Illustration. In Natural Hazards-Impacts, Adjustments & Resilience; IntechOpen: London, UK, 2020. [Google Scholar]
- Ahmad, M.; Al-Shayea, N.A.; Tang, X.-W.; Jamal, A.; Al-Ahmadi, H.M.; Ahmad, F. Predicting the Pillar Stability of Underground Mines with Random Trees and C4. 5 Decision Trees. Appl. Sci. 2020, 10, 6486. [Google Scholar] [CrossRef]
- Yilmaz, I.; Marschalko, M.; Bednarik, M.; Kaynar, O.; Fojtova, L. Neural computing models for prediction of permeability coefficient of coarse-grained soils. Neural Comput. Appl. 2012, 21, 957–968. [Google Scholar] [CrossRef]
- Park, H. Development of neural network model to estimate the permeability coefficient of soils. Mar. Georesources Geotechnol. 2011, 29, 267–278. [Google Scholar] [CrossRef]
- Sezer, A.; Göktepe, A.B.; Altun, S. Estimation of the Permeability of Granular Soils Using Neuro-fuzzy System. In Proceedings of the AIAI Workshops, Thessaloniki, Greece, 23–25 April 2009; pp. 333–342. [Google Scholar]
- Pham, B.T.; Qi, C.; Ho, L.S.; Nguyen-Thoi, T.; Al-Ansari, N.; Nguyen, M.D.; Nguyen, H.D.; Ly, H.-B.; Le, H.V.; Prakash, I. A novel hybrid soft computing model using random forest and particle swarm optimization for estimation of undrained shear strength of soil. Sustainability 2020, 12, 2218. [Google Scholar] [CrossRef] [Green Version]
- Singh, V.K.; Kumar, D.; Kashyap, P.; Singh, P.K.; Kumar, A.; Singh, S.K. Modelling of soil permeability using different data driven algorithms based on physical properties of soil. J. Hydrol. 2020, 580, 124223. [Google Scholar] [CrossRef]
- Garcia-Bengochea, I.; Altschaeffl, A.G.; Lovell, C.W. Pore distribution and permeability of silty clays. J. Geotech. Eng. Div. 1979, 105, 839–856. [Google Scholar] [CrossRef]
- Pham, B.T.; Ly, H.-B.; Al-Ansari, N.; Ho, L.S. A Comparison of Gaussian Process and M5P for Prediction of Soil Permeability Coefficient. Sci. Program. 2021, 2021, 3625289. [Google Scholar] [CrossRef]
- Pham, T.A.; Tran, V.Q.; Vu, H.-L.T.; Ly, H.-B. Design deep neural network architecture using a genetic algorithm for estimation of pile bearing capacity. PLoS ONE 2020, 15, e0243030. [Google Scholar] [CrossRef] [PubMed]
- Liang, W.; Luo, S.; Zhao, G.; Wu, H. Predicting hard rock pillar stability using GBDT, XGBoost, and LightGBM algorithms. Mathematics 2020, 8, 765. [Google Scholar] [CrossRef]
- Ahmad, M.H.; Hu, J.-L.; Ahmad, F.; Tang, X.-W.; Amjad, M.; Iqbal, M.J.; Asim, M.; Farooq, A. Supervised Learning Methods for Modeling Concrete Compressive Strength Prediction at High Temperature. Materials 2021, 14, 1983. [Google Scholar] [CrossRef] [PubMed]
- Rasmussen, C.; Williams, C. Gaussian Processes for Machine Learning; The MIT Press: Cambridge, MA, USA, 2006; Volume 38, pp. 715–719. [Google Scholar]
- Kuss, M. Gaussian Process Models for Robust Regression, Classification, and Reinforcement Learning. Ph.D. Thesis, Echnische Universität Darmstadt Darmstadt, Darmstadt, Germany, 2006. [Google Scholar]
- Ahmad, M.; Amjad, M.; Al-Mansob, R.A.; Kamiński, P.; Olczak, P.; Khan, B.J.; Alguno, A.C. Prediction of Liquefaction-Induced Lateral Displacements Using Gaussian Process Regression. Appl. Sci. 2022, 12, 1977. [Google Scholar] [CrossRef]
- Sihag, P.; Tiwari, N.; Ranjan, S. Modelling of infiltration of sandy soil using gaussian process regression. Modeling Earth Syst. Environ. 2017, 3, 1091–1100. [Google Scholar] [CrossRef]
- Elbeltagi, A.; Azad, N.; Arshad, A.; Mohammed, S.; Mokhtar, A.; Pande, C.; Etedali, H.R.; Bhat, S.A.; Islam, A.R.M.T.; Deng, J. Applications of Gaussian process regression for predicting blue water footprint: Case study in Ad Daqahliyah, Egypt. Agric. Water Manag. 2021, 255, 107052. [Google Scholar] [CrossRef]
- Santhi, C.; Arnold, J.G.; Williams, J.R.; Dugas, W.A.; Srinivasan, R.; Hauck, L.M. Validation of the swat model on a large rwer basin with point and nonpoint sources 1. JAWRA J. Am. Water Resour. Assoc. 2001, 37, 1169–1188. [Google Scholar] [CrossRef]
- Van Liew, M.; Arnold, J.; Garbrecht, J. Hydrologic simulation on agricultural watersheds: Choosing between two models. Trans. ASAE 2003, 46, 1539. [Google Scholar] [CrossRef]
- Lin, S.; Zheng, H.; Han, C.; Han, B.; Li, W. Evaluation and prediction of slope stability using machine learning approaches. Front. Struct. Civ. Eng. 2021, 15, 821–833. [Google Scholar] [CrossRef]
- Yang, Y.; Zhang, Q. A hierarchical analysis for rock engineering using artificial neural networks. Rock Mech. Rock Eng. 1997, 30, 207–222. [Google Scholar] [CrossRef]
- Faradonbeh, R.S.; Armaghani, D.J.; Abd Majid, M.; Tahir, M.M.; Murlidhar, B.R.; Monjezi, M.; Wong, H. Prediction of ground vibration due to quarry blasting based on gene expression programming: A new model for peak particle velocity prediction. Int. J. Environ. Sci. Technol. 2016, 13, 1453–1464. [Google Scholar] [CrossRef] [Green Version]
- Chen, W.; Hasanipanah, M.; Rad, H.N.; Armaghani, D.J.; Tahir, M. A new design of evolutionary hybrid optimization of SVR model in predicting the blast-induced ground vibration. Eng. Comput. 2019, 37, 1455–1471. [Google Scholar] [CrossRef]
- Rad, H.N.; Bakhshayeshi, I.; Jusoh, W.A.W.; Tahir, M.; Foong, L.K. Prediction of flyrock in mine blasting: A new computational intelligence approach. Nat. Resour. Res. 2020, 29, 609–623. [Google Scholar]
- Amjad, M.; Ahmad, I.; Ahmad, M.; Wróblewski, P.; Kamiński, P.; Amjad, U. Prediction of pile bearing capacity using XGBoost algorithm: Modeling and performance evaluation. Appl. Sci. 2022, 12, 2126. [Google Scholar] [CrossRef]


Publisher’s Note: MDPI stays neutral with regard to jurisdictional claims in published maps and institutional affiliations. |
© 2022 by the authors. Licensee MDPI, Basel, Switzerland. This article is an open access article distributed under the terms and conditions of the Creative Commons Attribution (CC BY) license (https://creativecommons.org/licenses/by/4.0/).