Article

A Novel Solution for Optimized Energy Management Systems Comprising an AC/DC Hybrid Microgrid System for Industries

1
School of Information Management, Nanjing University, Nanjing 210023, China
2
Department of Energy Systems Engineering, University of Agriculture, Faisalabad 38000, Pakistan
3
Agriculture and Life Sciences Research Institute, Kangwon National University, Chuncheon 24341, Korea
4
Green Energy Technology Research Center, Kongju National University, Cheonan 31080, Korea
5
Department of Architectural Engineering, Kongju National University, Cheonan 31080, Korea
*
Authors to whom correspondence should be addressed.
Sustainability 2022, 14(14), 8788; https://doi.org/10.3390/su14148788
Submission received: 13 June 2022 / Revised: 9 July 2022 / Accepted: 15 July 2022 / Published: 18 July 2022

Abstract

:
A novel solution for optimized energy management comprising a microgrid system for industries in Pakistan is proposed. The proposed study considered microgrids based on photovoltaics, wind turbines, power storage systems, and dual-fuel (DF) generators as backup. A heuristic methodology with a cuckoo search algorithm (CSA) is presented for efficient power trading by scheduling machines. The study was conducted to prove that CSA is adaptable and flexible for self-governing choices for the efficient management and scheduling of machines and power trade between the microgrid and commercial grid. A mixed integer linear programming algorithm is introduced to optimize the system design problems that control decision making for the ideal operation management. A real-time pricing scheme is utilized for electricity price figures. The simulation results show the efficient performance of the proposed scheme to maximize profitability, reduction in electricity cost, and peak to average ratio. Furthermore, the proposed optimization technique was compared with a highly in-use strawberry algorithm to prove the supremacy of the proposed technique. The proposed efficient and robust energy management system was implemented in Shafi Dyeing Industry, Faisalabad, to validate the simulated model.

1. Introduction

The rapid increase in energy demand is one of the main causes behind the depletion of conventional fossil fuels and the abrupt increase in greenhouse gas (GHG) emissions. As indicated by the recent report of the EUJRC (European Union Joint Research Center), approximately 90% of worldwide CO2 discharge is the byproduct of petroleum fuel combustion [1]. Furthermore, various studies show that longer transmission lines in-between power generation and distribution systems are one of the major reasons behind high power losses due to the line losses [2]. In Pakistan, high transmission and distribution losses are faced due to the imperfect power flow system, i.e., 17% and 18% respectively [3], which creates a considerable load demand-and-supply gap, low power quality, low efficiency and reliability, and high economic losses. A high percentage of the generated energy is utilized by the industrial sector of Pakistan, which, in the case of low power supply, adversely affects the overall economy of the country. Furthermore, the per-unit cost of electricity for the industrial sector is quite high due to the peak hours usage, power connection type, and maximum demand indicator (MDI) charges. These issues have a significant impact on the overall profit of investors and, as a result, the country’s economy. Keeping these losses in view, load rescheduling can be used as a potential solution by designing the smart grid system. In this way, renewable energy resources (such as solar, wind, biomass, tidal, and hydro)-based microgrids are looked at as key options to solve energy crises by producing non-polluting energy and reducing GHG emissions [4,5]. These microgrids use renewable energy sources that are spread out across the site and do not need long transmission lines to obtain power to the load end [6,7]. These microgrids provide highly reliable and low-cost power in comparison to conventional power systems [8,9]. A microgrid usually comprises small-scale generation systems, energy storage systems, and a set of loads, also known as the medium-level distribution system. Energy storage systems are used to increase the overall reliability of the system and to complement the intermittency of solar and wind sources [10,11,12]. Moreover, in microgrids, the maintenance of power supply–demand is deemed for stability as the intermittent nature of renewables is difficult to predict. This problem becomes more severe in the case of microgrids functioning in islanded mode. A lot of research is being carried out for the design of efficient energy management systems [13,14]. Several authors have presented solutions for energy management using various techniques to optimize the operation of the microgrid. However, highly efficient strategies are required for these techniques due to the introduction of EVs, storage components, and distributed renewables-based generation [15]. In [16], the authors presented a solution to perform active/reactive power-sharing for the regulation of frequency and voltage. In [17], the authors worked on reducing the cost of electricity for industries by rescheduling smart machines from on-peak hours to off-peak hours. Likewise, the trading issues of electricity with microgrids have been discussed in [18,19]. The power cost improvement issue has been solved using the time of use (ToU) technique. The idea presented in this work is to integrate the microgrid setup with the industry.
In [20], demand-side management has been carried out to mitigate energy problems during peak hours by managing shiftable loads, and this has further led to a reduction in consumer bills. The conditioning time for the operation of switchable loads is a drawback of this technique. Multiagent system-based distributed intelligent techniques to reduce consumer bills have been presented in [21,22,23,24,25]. Power-sharing between microgrids and main grids can be carried out using these techniques. These techniques achieved reduced outages, low unit costs, and shortened scheduling time. In [26], a system has been introduced for energy management to decrease electrical power costs and RES integration. The essential motivation behind RES coordination was to reduce the import of electricity from the commercial grid. Solar PV systems and the power from wind turbines with power storage systems (PSS) are recognized as renewable energy sources. In renewable integration, power storage components play a vital role in efficient energy management as they can store energy at a time of excess generation and discharge it when required to meet the load demand. According to [27], a mathematical optimization along with TOU layout reenacts electricity charges and electrical power demand for the whole procedure of machining. In [28], the authors considered MILP for the design and planning of a smart grid to optimize the grid design problem by considering an ideal operation scheme. Moreover, they categorized the total electricity load into three categories: interruptible load, shift-able load, and base load.
Depending on the deficiencies of the above-mentioned studies, the proposed system presents an efficient and economical load management strategy for industries in Pakistan. The proposed study presents CSA for the scheduling of motor load during peak hours using two scenarios, i.e., with and without a microgrid for efficient energy management and power trading in-between industry and the commercial grid. Furthermore, the proposed technique was compared with the in-use strawberry algorithm (SA) for the validity of the efficient proposed system. The study shows that CSA is more flexible in handling self-governing choices for the efficient scheduling of machines and power sales to the external grid for economic interests.

2. Proposed System Designing

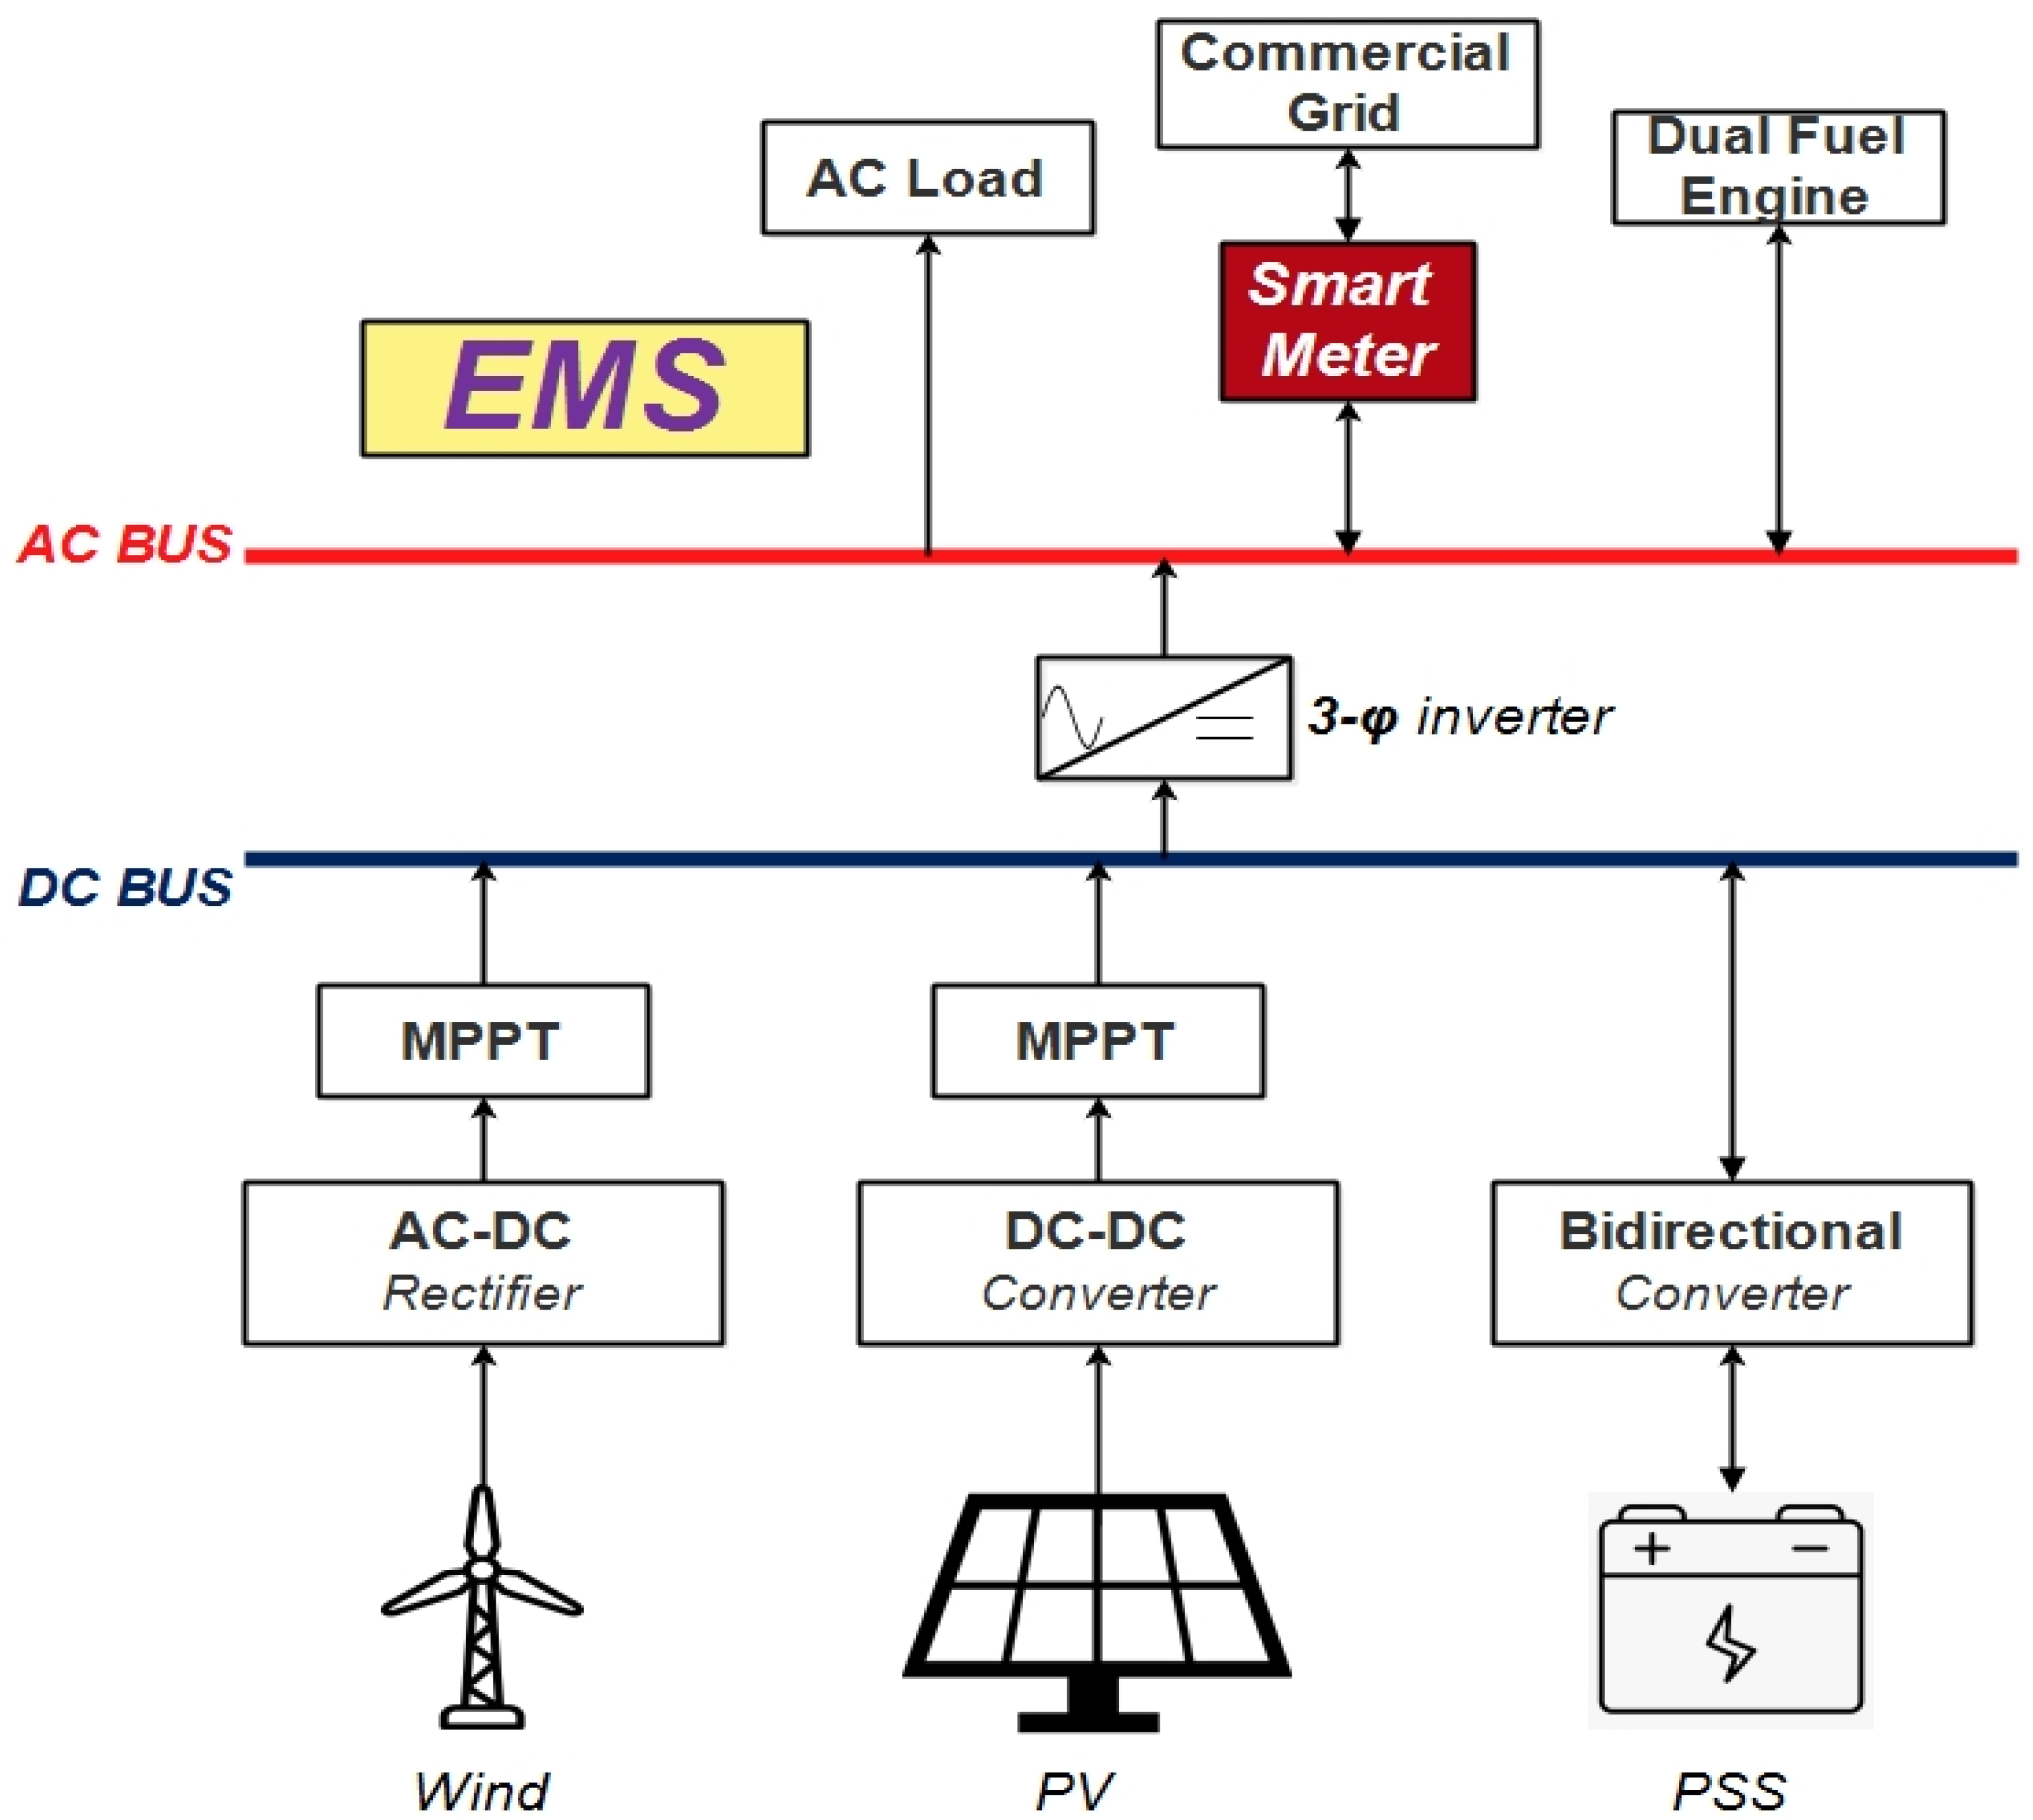
2.1. Microgrid Architecture

In the proposed system, the microgrid comprises RESs (PV modules (150 kW), wind turbines (50 kW), power storage system (100 kW), and dual-fuel engines (crude oil and gas) as a backup source for unavoidable circumstances, as can be seen in Figure 1. The total energy in time   t   T from all renewable energy sources r R can be calculated using Equation (1).
E t = r R   ε r   ( t )
where ε r defines the power generation from a single RES. The total generated power in a day from the microgrid can be determined by Equation (2).
E T = t = 1 T r ϵ R ε r   ( t )
Moreover, the generation of electricity from RESs is infrequent. Hence, an artificial neural network (ANN) was executed for the day-ahead prediction of energy generation from renewable energy sources by considering all relevant parameters affecting the generation (temperature, irradiance, wind speed, wind direction, etc.).
In the case of wind turbines, the intermittent nature of wind highly affects the overall generation. Equations (3)–(5) represent the relationship between wind speed and generated power.
V c i   V t   V c o
0 = V t   V c o t   ϵ   T
0 = V t   V c i t   ϵ   T
where V t ,   V c i ,   and   V c o represents wind speed, cut-in wind speed, and cut-out wind speed, respectively. The relationship curve between wind speed and generated power can be seen in Figure 2.
Similarly, the incremental conductance (IC)-based MPPT method was implemented for the maximum possible power extraction from a photovoltaic system. The V–I graphs with respect to MPPT can be seen in Figure 3.
To overcome the intermittent nature of these renewable sources, a power storage system (PSS) was included in the microgrid design to ensure the stability of the overall system. In the proposed scenario, the PSS capacity was set to 10% of the total power in any situation. Minimum and maximum levels of charging are represented by PSSmin and PSSmax, respectively. The storage of power in the PSS can be extracted using Equations (6)–(9).
P S ( t ) = P S ( t 1 ) + k . η P S S .   P S c h ( t ) k . P S d i s ( t ) / η P S S
P S S c h t P S ( max )
P S S c h t < P S ( u p l )
P S S d i s t P S ( min )
In Equations (6)–(9), PS represents the stored power (kWh) in the time interval ‘t’; η P S S is PSS efficiency; and P S S c h t and P S S d i s t represent the charging and discharging level of PSS at a time ‘t’, respectively. Moreover, as shown in Figure 4, dual-fuel engines (crude oil and LNG/Natural Gas) are considered as emergency backup systems to ensure the uninterrupted, efficient, and reliable operation of the system. In dual-fuel engines, liquid fuel (crude oil) and LNG/natural gas were used as their input sources with varying working conditions, such as liquid fuel to acquire the desired RPM at the start and then shift to the gas source for economic profitability.

2.2. Industrial Load

In the proposed system, the microgrid comprises RESs (PV modules, wind turbines, and power storage systems) and dual-fuel engines as a backup source for uninterrupted power supply. The industrial load of the selected dying industry was elaborated and categorized into three types [29]. Every customer u   U represents a set of smart industries. The total load of the smart industry is represented as   L . Each load section or machine performs according to its time slot (hour). The total load was classified into three categories: a shiftable load, non-shiftable, and base load, represented by s , n s ,   and   b respectively. Each motor load is connected with the energy management system (EMS) via networking for dual communication. Moreover, EMS controls all types of loads based on the fitness function designed to change the load on the machine, etc.

2.2.1. Shiftable Load

A shiftable load is a supportive motor load that is effectively planned from a significant costly price to a low-price hour, as shown in Table 1, Table 2 and Table 3. Table 1, Table 2 and Table 3 depict the shiftable load in different sections of the industry under consideration, such as the dying unit, printing unit, and finishing unit, respectively. The load of various machines was considered in the study as these machines perform different tasks for the preparation of the final product. These tables comprise various parameters, such as motor ratings, quantity, and consumption. In this, the total shiftable load per day is 522.98 kWh, represented by L s ,   and = L determines all loads in this category. In Equation (10), ϕ s represents the power rating for shiftable load and λ s expresses the consumption of electrical power against the shiftable load from the commercial/main grid station in a 24-hour time frame and can be determined by the following equation, where α   represents the available earliest time of starting for every machine load and β represents the available ending time of every machine.
λ s = t = 1 T (   s L s ϕ s   β s ( t ) )  
The cost of electrical power on an hourly and daily basis paid to the commercial/main grid against the shiftable load can be calculated as follow.
ξ L s t = s   A s ϕ s ρ ( t ) β s ( t )
ξ L s T = t = 1 T ( s   L s ( ϕ s ρ ( t ) β s ( t ) ) )
The on–off status of the shiftable load in an hourly time frame can be calculated as follows:
β s ( t ) = { 1   if   a s   is   on 0   if   a s   is   off

2.2.2. Non-Shiftable Load

This type of load cannot be shifted once the operation execution has been performed. However, before the execution of the whole cycle, this load can be shifted to any time slot. Moreover, it is recommended to schedule non-shiftable loads in between the earliest available starting time and the last available ending time frame. In this proposed study, the non-shiftable load (Table 4, Table 5 and Table 6) is represented by n s   L n s . Table 4, Table 5 and Table 6 depict the non-shiftable load in different sections of the industry under consideration, such as the dying unit, printing unit, and finishing unit, respectively. The load of various machines was considered in the study as these machines perform different tasks for the preparation of the final product. These tables comprise the various parameters, such as motor ratings, quantity, and consumption. Moreover, power consumption by the non-shiftable load with its rating is represented by β n s   and ϕ n s , respectively. However, the electrical energy consumed against these types of electrical loads on daily basis is determined by the equation below.
λ n s = t = 1 T (   n s L n s ( ϕ n s   β n s ( t ) ) )  
Furthermore, the total electricity charges on an hourly and daily basis against the non-shiftable load can be calculated by these equations, respectively.
ξ n s t = n s L n s ϕ n s ρ ( t ) β n s ( t )
ξ n s T = t = 1 T ( n s   L n s ( ϕ n s ρ ( t ) β n s ( t ) ) )
The on–off status of the non-shiftable load in an hourly time frame can be calculated as follows:
β n s ( t ) = { 1   if   n s   is   on 0   if   n s   is   off

2.2.3. Base Load

In the proposed study, the base load is represented by L b and cannot be shifted or interrupted in-between the operations. The base load is a type of load that is used all the time, i.e., the supporting machines required to operate the main machine. In this paper, b   L b represents a single supportive motor from the category of base load. The total generated power and motor rating on a daily basis is represented and calculated by λ b   and ϕ b , respectively.
λ b = t = 1 T (   b L b ( ϕ b   β b ( t ) ) )  
Furthermore, the total electricity charges on an hourly and daily basis against the base load can be calculated by these equations, respectively.
ξ b t = b L b ( ϕ b ρ ( t ) β b ( t )
ξ b T = t = 1 T ( b   L b ( ϕ b ρ ( t ) β b ( t ) ) )
The on–off status of the base load in an hourly time frame can be calculated as follows:
β b ( t ) = { 1   if   b   is   on 0   if   b   is   off

3. Problem Formulation and Proposed Optimization Techniques

This section briefly discussed the problem formulation and the proposed optimization technique for said task. Furthermore, the cost of electricity consumption after scheduling, without including the microgrid and with the microgrid, is thoroughly explained.

3.1. Problem Formulation

To efficiently optimize the energy management system by considering the lowest power charge scenario and generating energy import to the commercial grid, the following problem formulation was made.
t = 1 T ( γ s h t + γ n s t E m t E S t o t a l D F t )   E C t
E m t = P S + P W
γ n s t + γ s h t = ( E m t + E S t o t a l + D F t + ϖ t
a = 1 n = L O T ( α )
a = 1 n       β
ϖ t K l
N c i N t w   N c o ,   t T  
  0 < S I t < K c ,   t   T
0 < E S S m i n < E S S m a x ,   t   T
A MILP model that comprises various decision-making linear and integral variables [29] was formulated for the proposed system. The proposed system decides the ideal time for switching/shifting load according to the power generation by the microgrid, which eventually reduces the overall electricity consumption during peak hours.

3.2. Electricity Consumption without a Microgrid

Electricity prices in Pakistan vary according to user (industrial connection type) and time interval “t”. In the proposed study, the electricity rate of one unit is represented as E C t . The total cost was reduced if the system load shifts from peak hours to off-peak hours. In the proposed scenario, the management of electricity by industrial users is as follow: Initially, electricity is taken from the microgrid and the excess energy is stored in power storage components. In the next step, external/commercial grid integration is considered along with dual fuel engines in emergency to fulfil peak demand load requirements. The electricity consumption cost per hour without connecting the microgrid is shown below.
ψ T = [ γ n s t + γ s h t ] E C t
where   γ n s t   and γ s h t   express the electrical energy demands against the non-shiftable and shiftable loads, respectively. The total electrical energy charges for a day were determined using the equation below.
ψ T = t = 1 T [ γ n s t + γ s h t ]   E C t
Moreover, the electricity imported from main grid was determined by Equations (32)–(34).
ϖ t = [ ( γ n s t + γ s h t ) ( E m t + E S t o t a l . σ e s s + D F t . α D F ) ]
ϖ t = { ϖ t i f ϕ t > 0 0 o t h e r w i s e
The amount of total electrical power imported in 24 h can be calculated as follows.
ϖ t = t = 1 T ϖ t
The electricity cost to be paid in the case of a commercial grid on an hourly and daily basis was determined using the equations below, respectively.
ξ t = [ ϖ t × E C t ]
ξ t = t = 1 T [ ϖ t × E C t ]

3.3. Electricity Consumption with a Microgrid

In the proposed study, the electricity tariff for the industrial user is of key importance. Power supply companies offer various packages to attract users keeping in view the efficient energy management of the whole setup. The proposed study used RTP signals for the measurement of the consumed electricity. In this section, two different rates were considered in the timeframe (hours in terms of t); one was the user purchasing from the commercial grid E p u r and second was the user selling the microgrid-based generated energy to the commercial grid E s e l l . However, the selling rate was considered 95% of the rate of purchase of electricity from the commercial grid in every hour “t” and can be seen in Equation (38).
E s e l l = E p u r × 0.95
The electricity cost in case of the off-grid and grid-tied modes in timeframe t can be calculated as follows, respectively.
ξ t = a n ( ϕ n × ρ ( t ) × α ( t ) )
ξ t = ( ( n ( ϕ n × α ( t ) ) E ( t ) ) × E p u r ( t )
Similarly, the total cost per day in both cases can be calculated as follows.
ξ T = t = 1 24 ( n ( ϕ n × ρ ( t ) × α ( t ) ) )
ξ T = t = 1 24 ( ( n ( ϕ a n × α ( t ) ) E ( t ) ) × E p u r ( t )
Keeping in view the importance of the load, the proposed optimized energy management system takes decisions regarding energy consumption, usage time, trading to the grid, etc. The surplus amount of energy traded to the commercial grid can be calculated as follows.
s e l l ( t ) = ( n ( ϕ L n × α ( t ) ) ) [ E ( t ) + P S S ]
s e l l ( t ) = { 0 , o t h e r w i s e . s e l l ( t ) , I f s e l l ( t ) < 0 ,
T = t = 1 T [ s e l l ( t ) ]
Equation (45) represents the total electricity that was exported to the commercial grid. Earnings on an hourly and daily basis are represented by the Equations (46) and (47), respectively.
Υ ( t ) = s e l l ( t ) × E s e l l ( t ) ,
Υ = t = 1 T [ s e l l ( t ) × E s e l l ( t ) . ]

3.4. Proposed Optimization Technique

In the proposed system, a smart meter was connected to each of the machines in a shrewd lattice condition. Furthermore, this smart meter was connected to the EMS for bidirectional communication between consumers and suppliers. The cuckoo search algorithm (CSA) was proposed for cost and PAR minimization alongside an overall profit boost and further compared with the strawberry algorithm (SA) for the validation of the proposed technique. The proposed algorithm settles on choices keeping in view the power generation from the microgrid, load consumption, and cost factor in each hour. CSA and SA for the trading and scheduling purposes are briefly discussed in the subsections.

3.4.1. Cuckoo Search Algorithm (CSA)

Cuckoo search algorithms [30] work on the principle of nature’s relevant excited meta-heuristic calculations based on close group. It deals with the issues based on the behavior of the cuckoo species. Initially, each cuckoo lays an egg in a randomly selected nest. Later on, the outstanding eggs and top-quality nests are nominated and mediated for the coming generations. After that, the total number of host nests is fixed, and the host can find this outside egg with a probability of P a [ 0 , 1 ] , which may lead to the abandonment of the nest by the host or the throwing away of this outsider egg. Based on these three points, the code for the cuckoo search algorithm was designed as shown in Appendix A.
Similarly, every egg that cuckoos lay shows the potential plan and design of the machine’s operational status, i.e., on/off in every timeslot ‘t’ individually. A certain potential plan represented by each egg is appraised to the extent in reference to the fitness function, peak to average ratio, and price mitigation with the highest profit. CSA plays out a rebirth stride by consequently searching for neighborhood arrangements (arrangement on an hourly basis) that are executed based on egg quality (better local arrangements of power consumption in relevance to the microgrid). The considered parameters of the CSA for the proposed system are presented in Table 7. The exploring possibility rate of levy flight for the cuckoos’ new arrangement at X (t + 1) is 0.30 and scanning for the best universal arrangement.
X i t + 1 = X i t + α   L e v y ( λ )
where α represents the step size and represents the entry wise multiplication. These flights provide random walk, whereas their random steps are drawn for a relatively large step, i.e.,
l e v y ~ u = t λ ,                 ( 1 < λ 3 )

3.4.2. Strawberry Algorithm (SA)

This algorithm is inspired by the nature-based meta-heuristic algorithm [31] also known as the plant propagation algorithm. As plants are exceptionally shrewd species and need nutrients, water, toxic substances, and light for survival, they are spread as sprinters. The population’s reproduction capacity in SA can be calculated as follows.
r 2 = [ r 1 + d . r u n n e r ( r a n d ( m , N ) 0.5 ) r 1 + d . r o o t ( r a n d ( m , N ) 0.5 ) ]
r 1 = [ u l + ( u h u l ) . r a n d ( m , N ) ]
The SA parameters for the proposed system are mentioned in Table 8.

4. Results and Discussion

Keeping in view the smart industry and commercial grid consumers, three cases were discussed in the proposed study. In the first case, traditional trade of electricity between industry and the grid was analyzed without any efficient energy optimization or scheduling mechanism. The second case comprised industries with efficient energy management without microgrid integration, whereas the third case dealt with industries with intelligent energy management and microgrid configuration. Table 9 highlights the generation from renewable sources per hour, where N c i and N c o represents cut-in and cut-out speed, respectively.

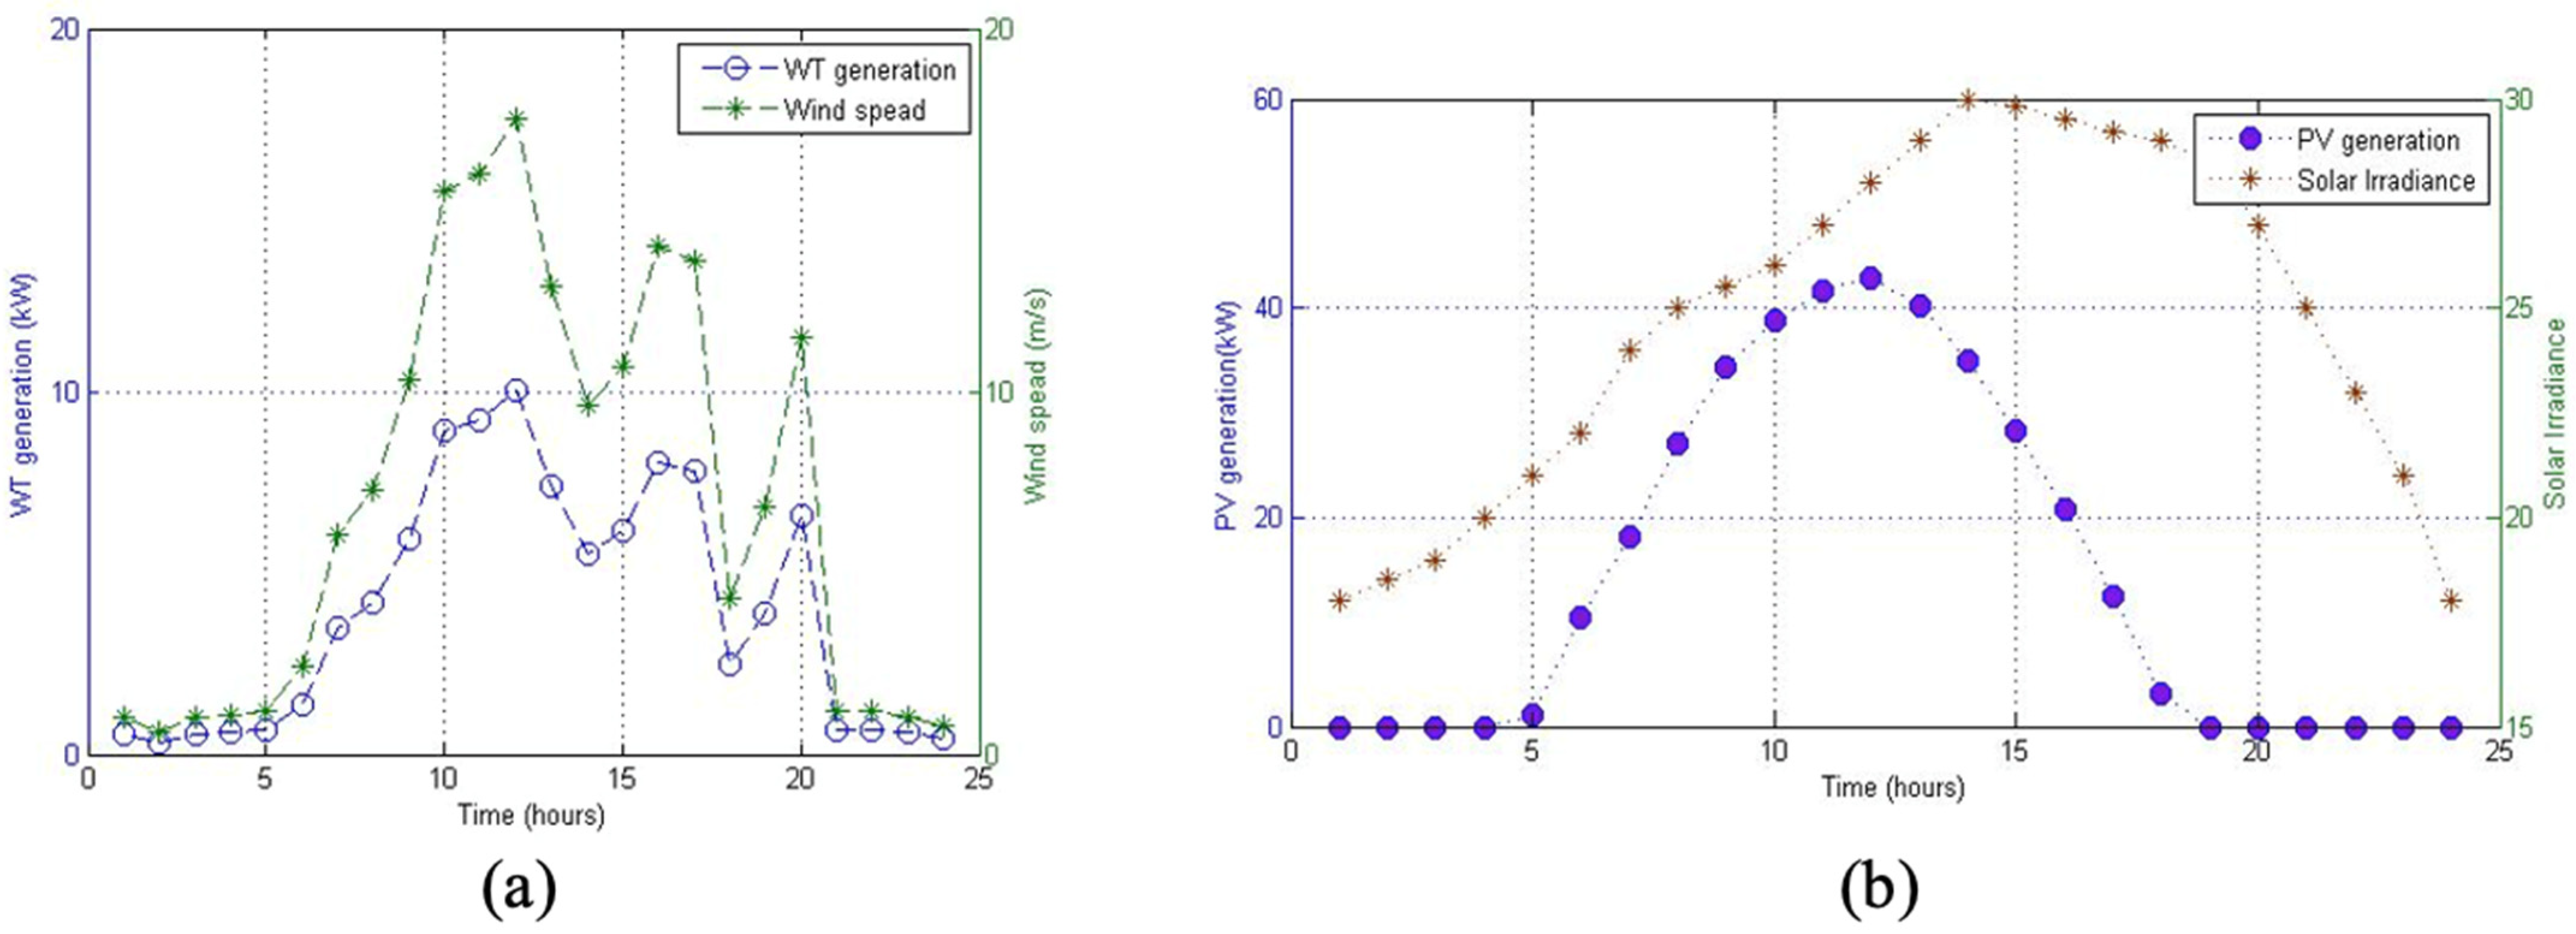
4.1. Industrial Energy Management with Power Trading, Real Time Pricing, and Weather Forecasting

The proposed system simulation was carried out for the intelligent scheduling of machines in the textile industry to prove its validity and supremacy in relevance to electricity cost minimization, PAR, and electricity utilization time. Furthermore, mixed integer linear programming was carried out for the analysis to validate the designed objectives of the proposed study. The considered system comprises twelve smart machines from the textile industry integrated with EMS. EMS performs the decision making and scheduling of energy with respect to the electricity tariff. Each machine as discussed in Table 1, Table 2, Table 3, Table 4, Table 5 and Table 6 has different LOT and power ratings. The time of operation of machines was considered two complete labor shifts of 24 h (08:00 am–08:00 pm–08:00 am). Real time pricing (RTP) signals were used for the calculation of electricity costs in the proposed study. All three cases along with the comparative study are discussed in the below sections.

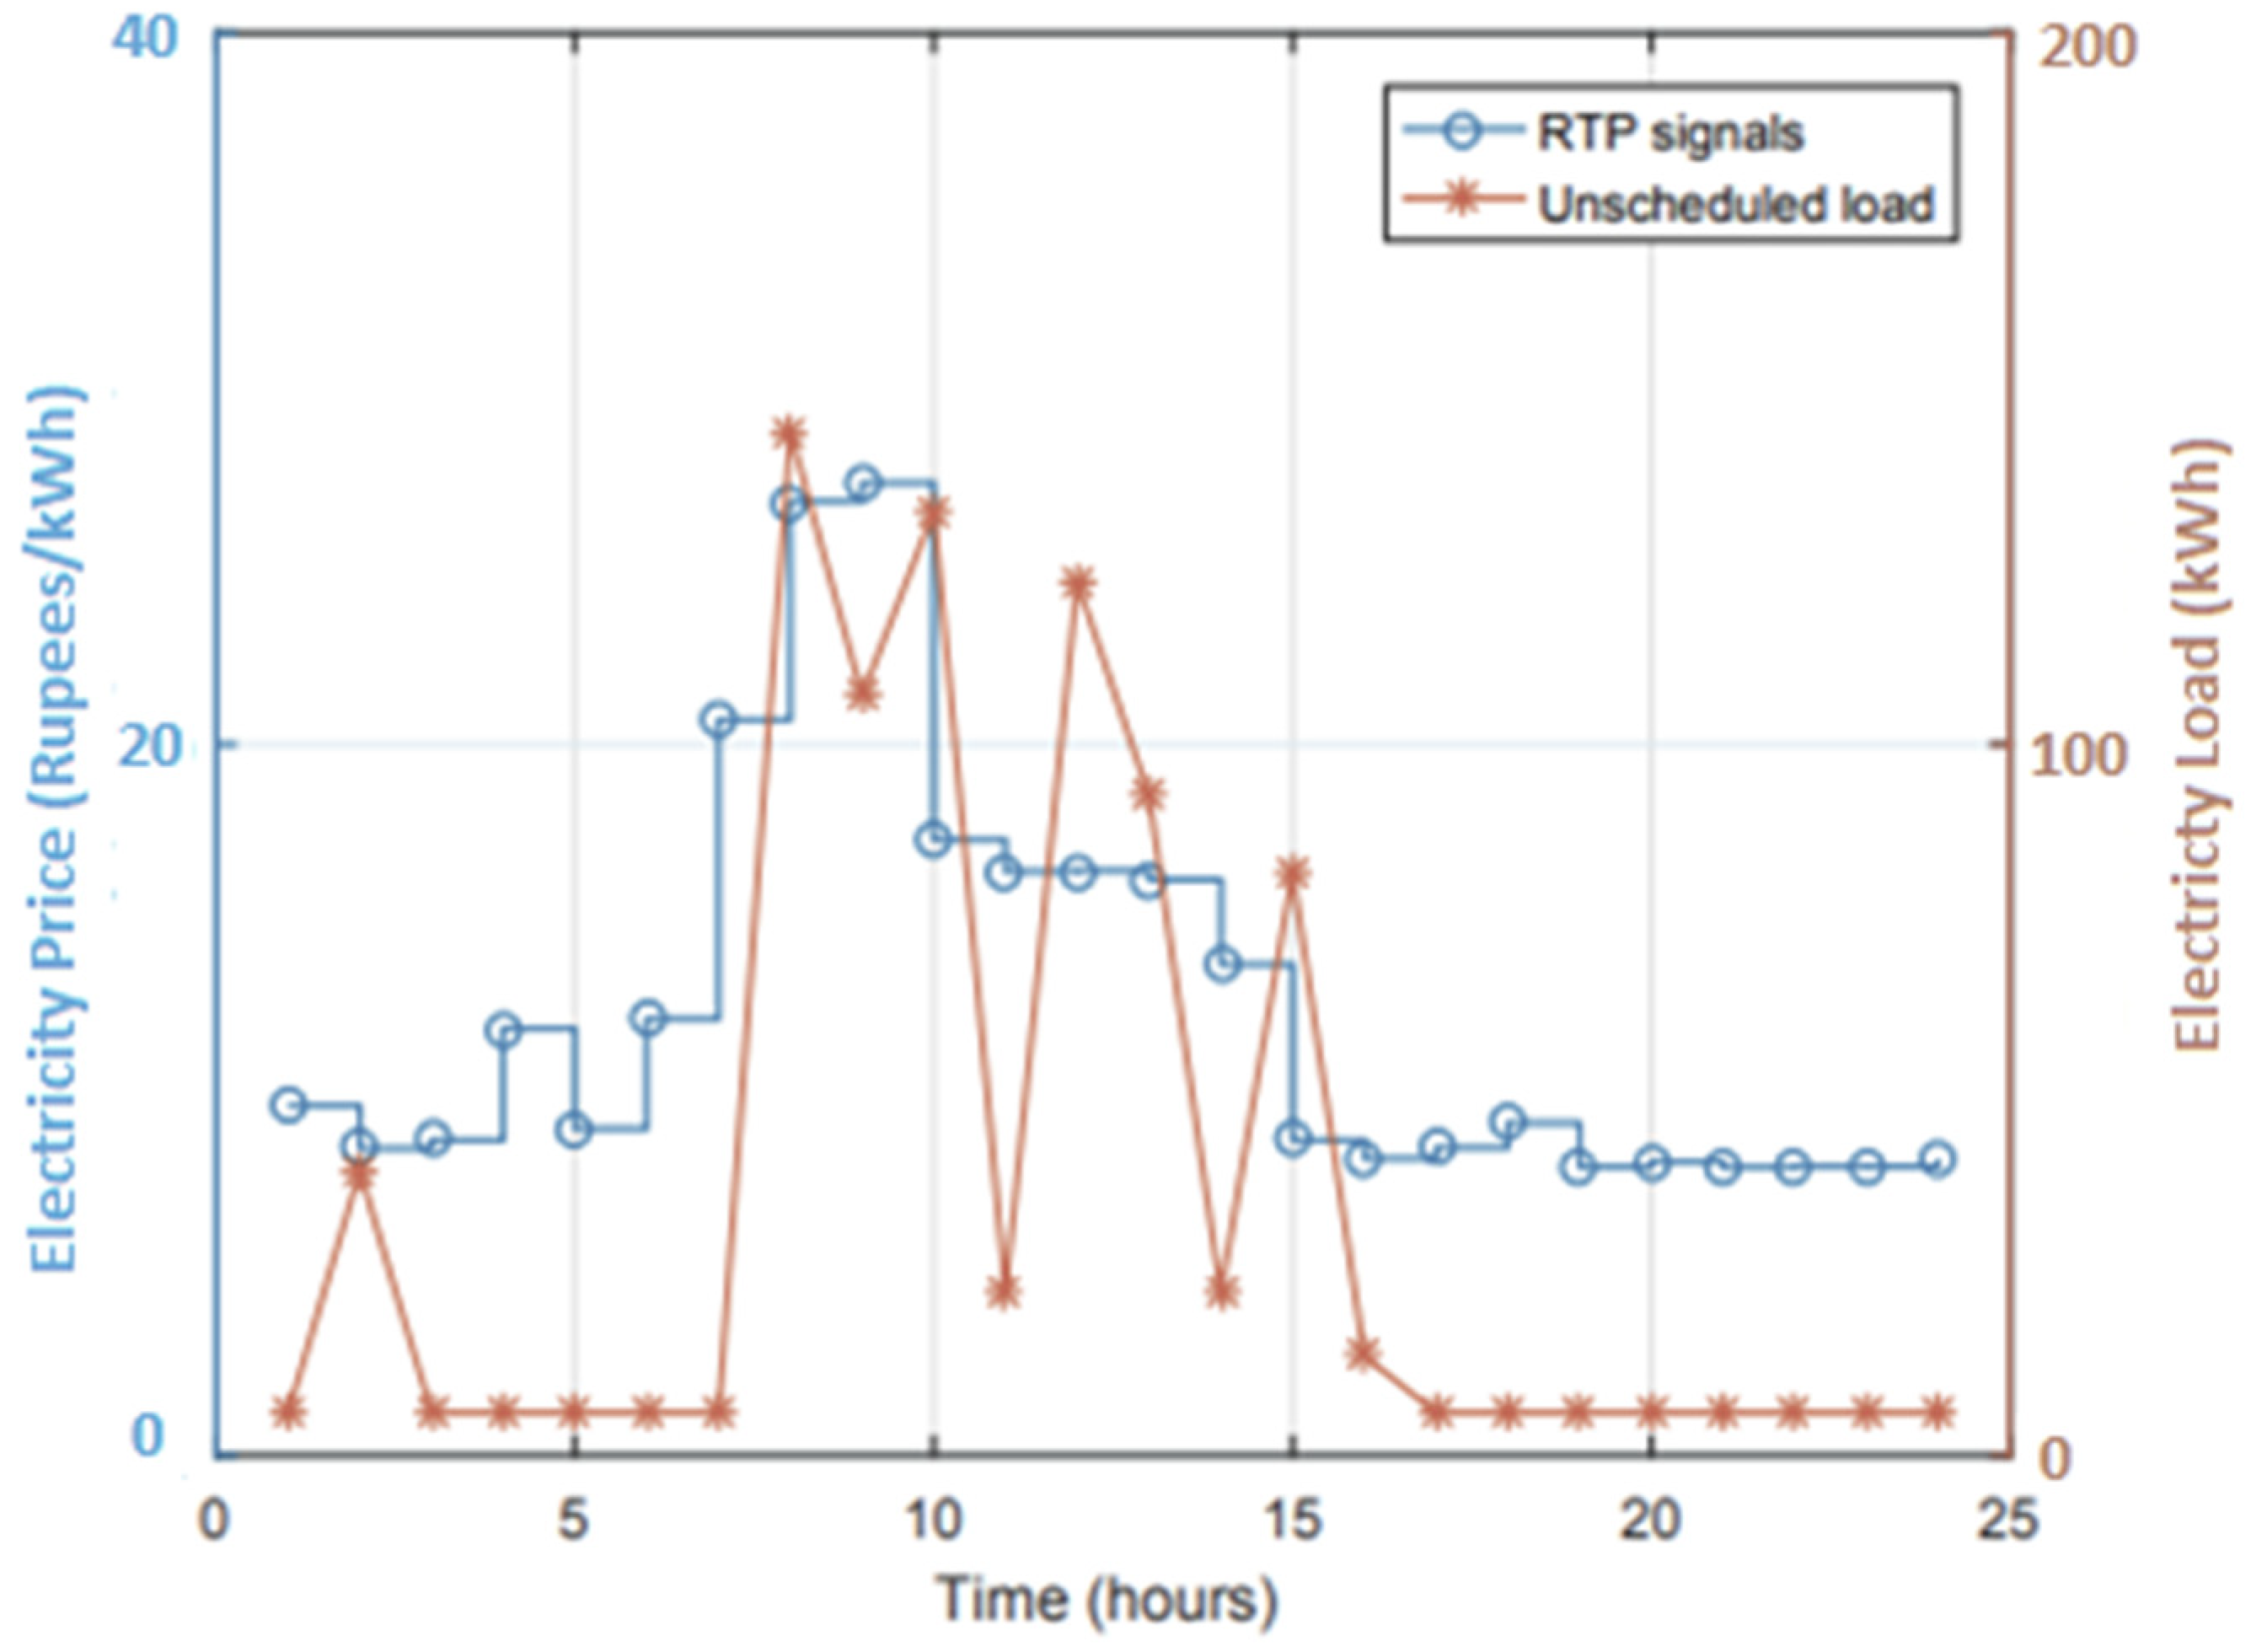
4.1.1. Traditional Industry Operation without a Microgrid and EMS

These industries operate in the traditional way by consuming energy from the commercial grid without any storage elements or microgrid configuration. Furthermore, this type of industry does not have any scheduling or energy optimization systems for efficient operation. Figure 5 shows the electricity consumption and RTP signaling for this type of industry. Electricity was purchased from the commercial grid without any differentiation of peak and off-peak hours.

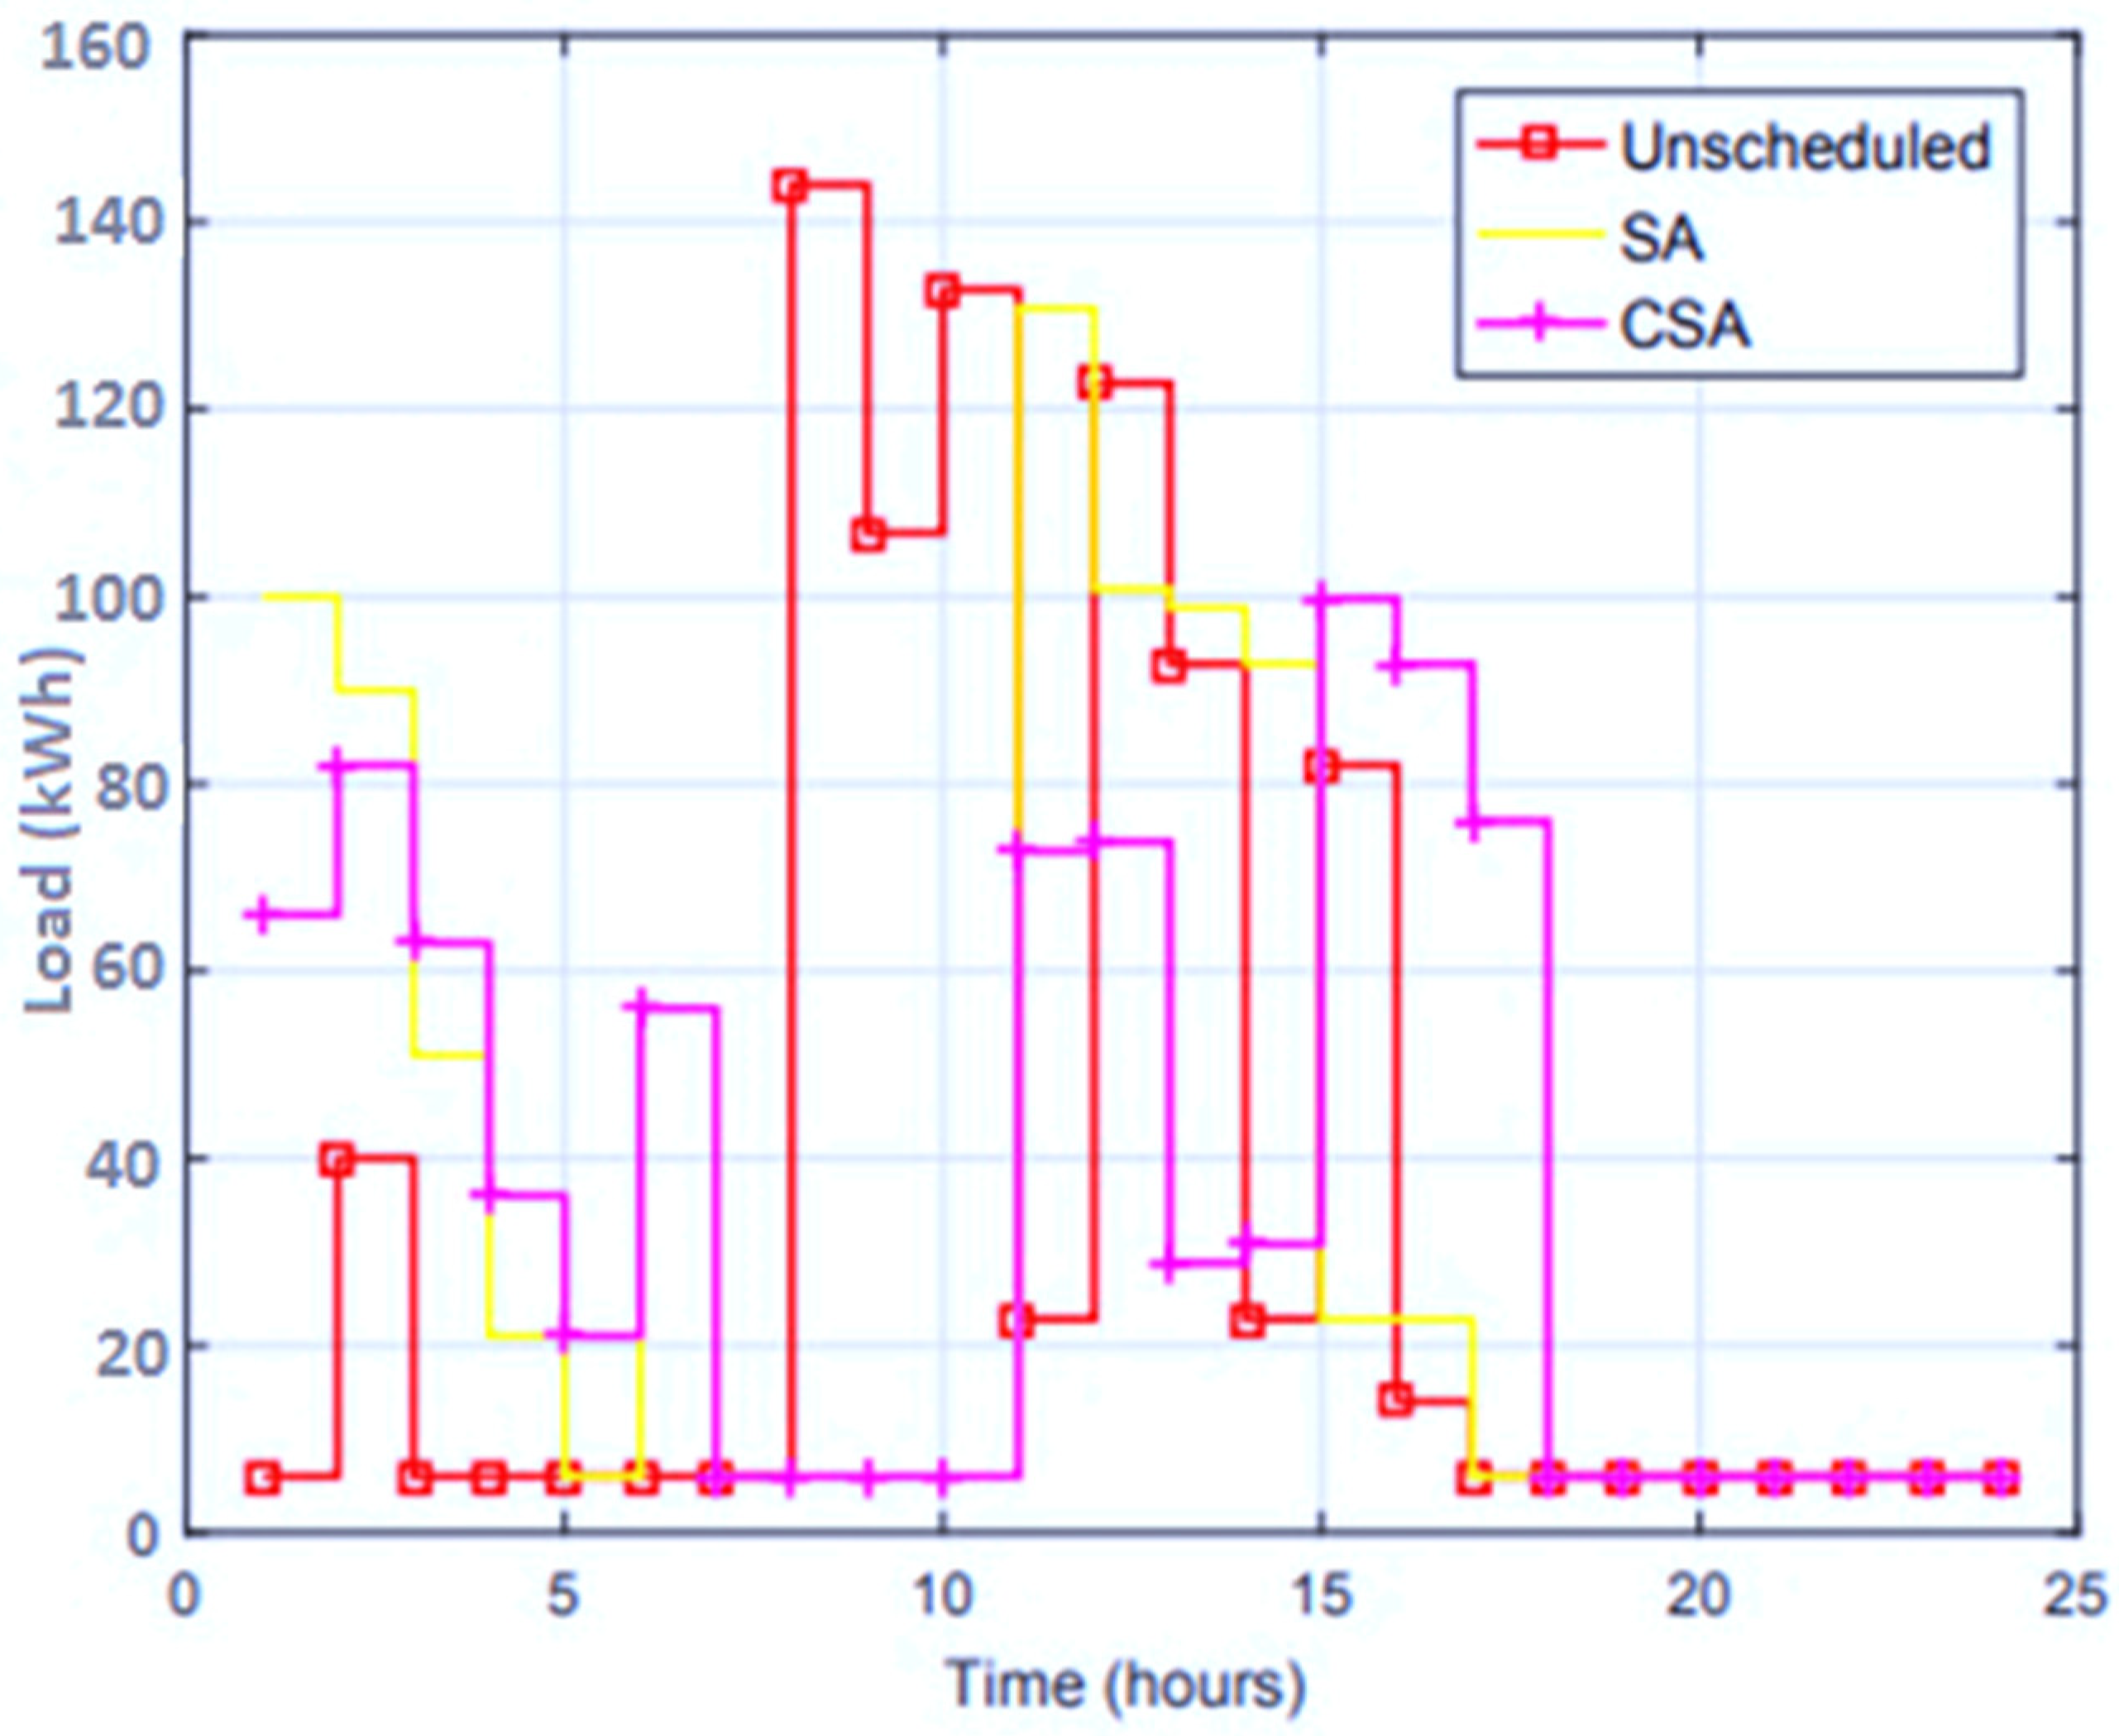
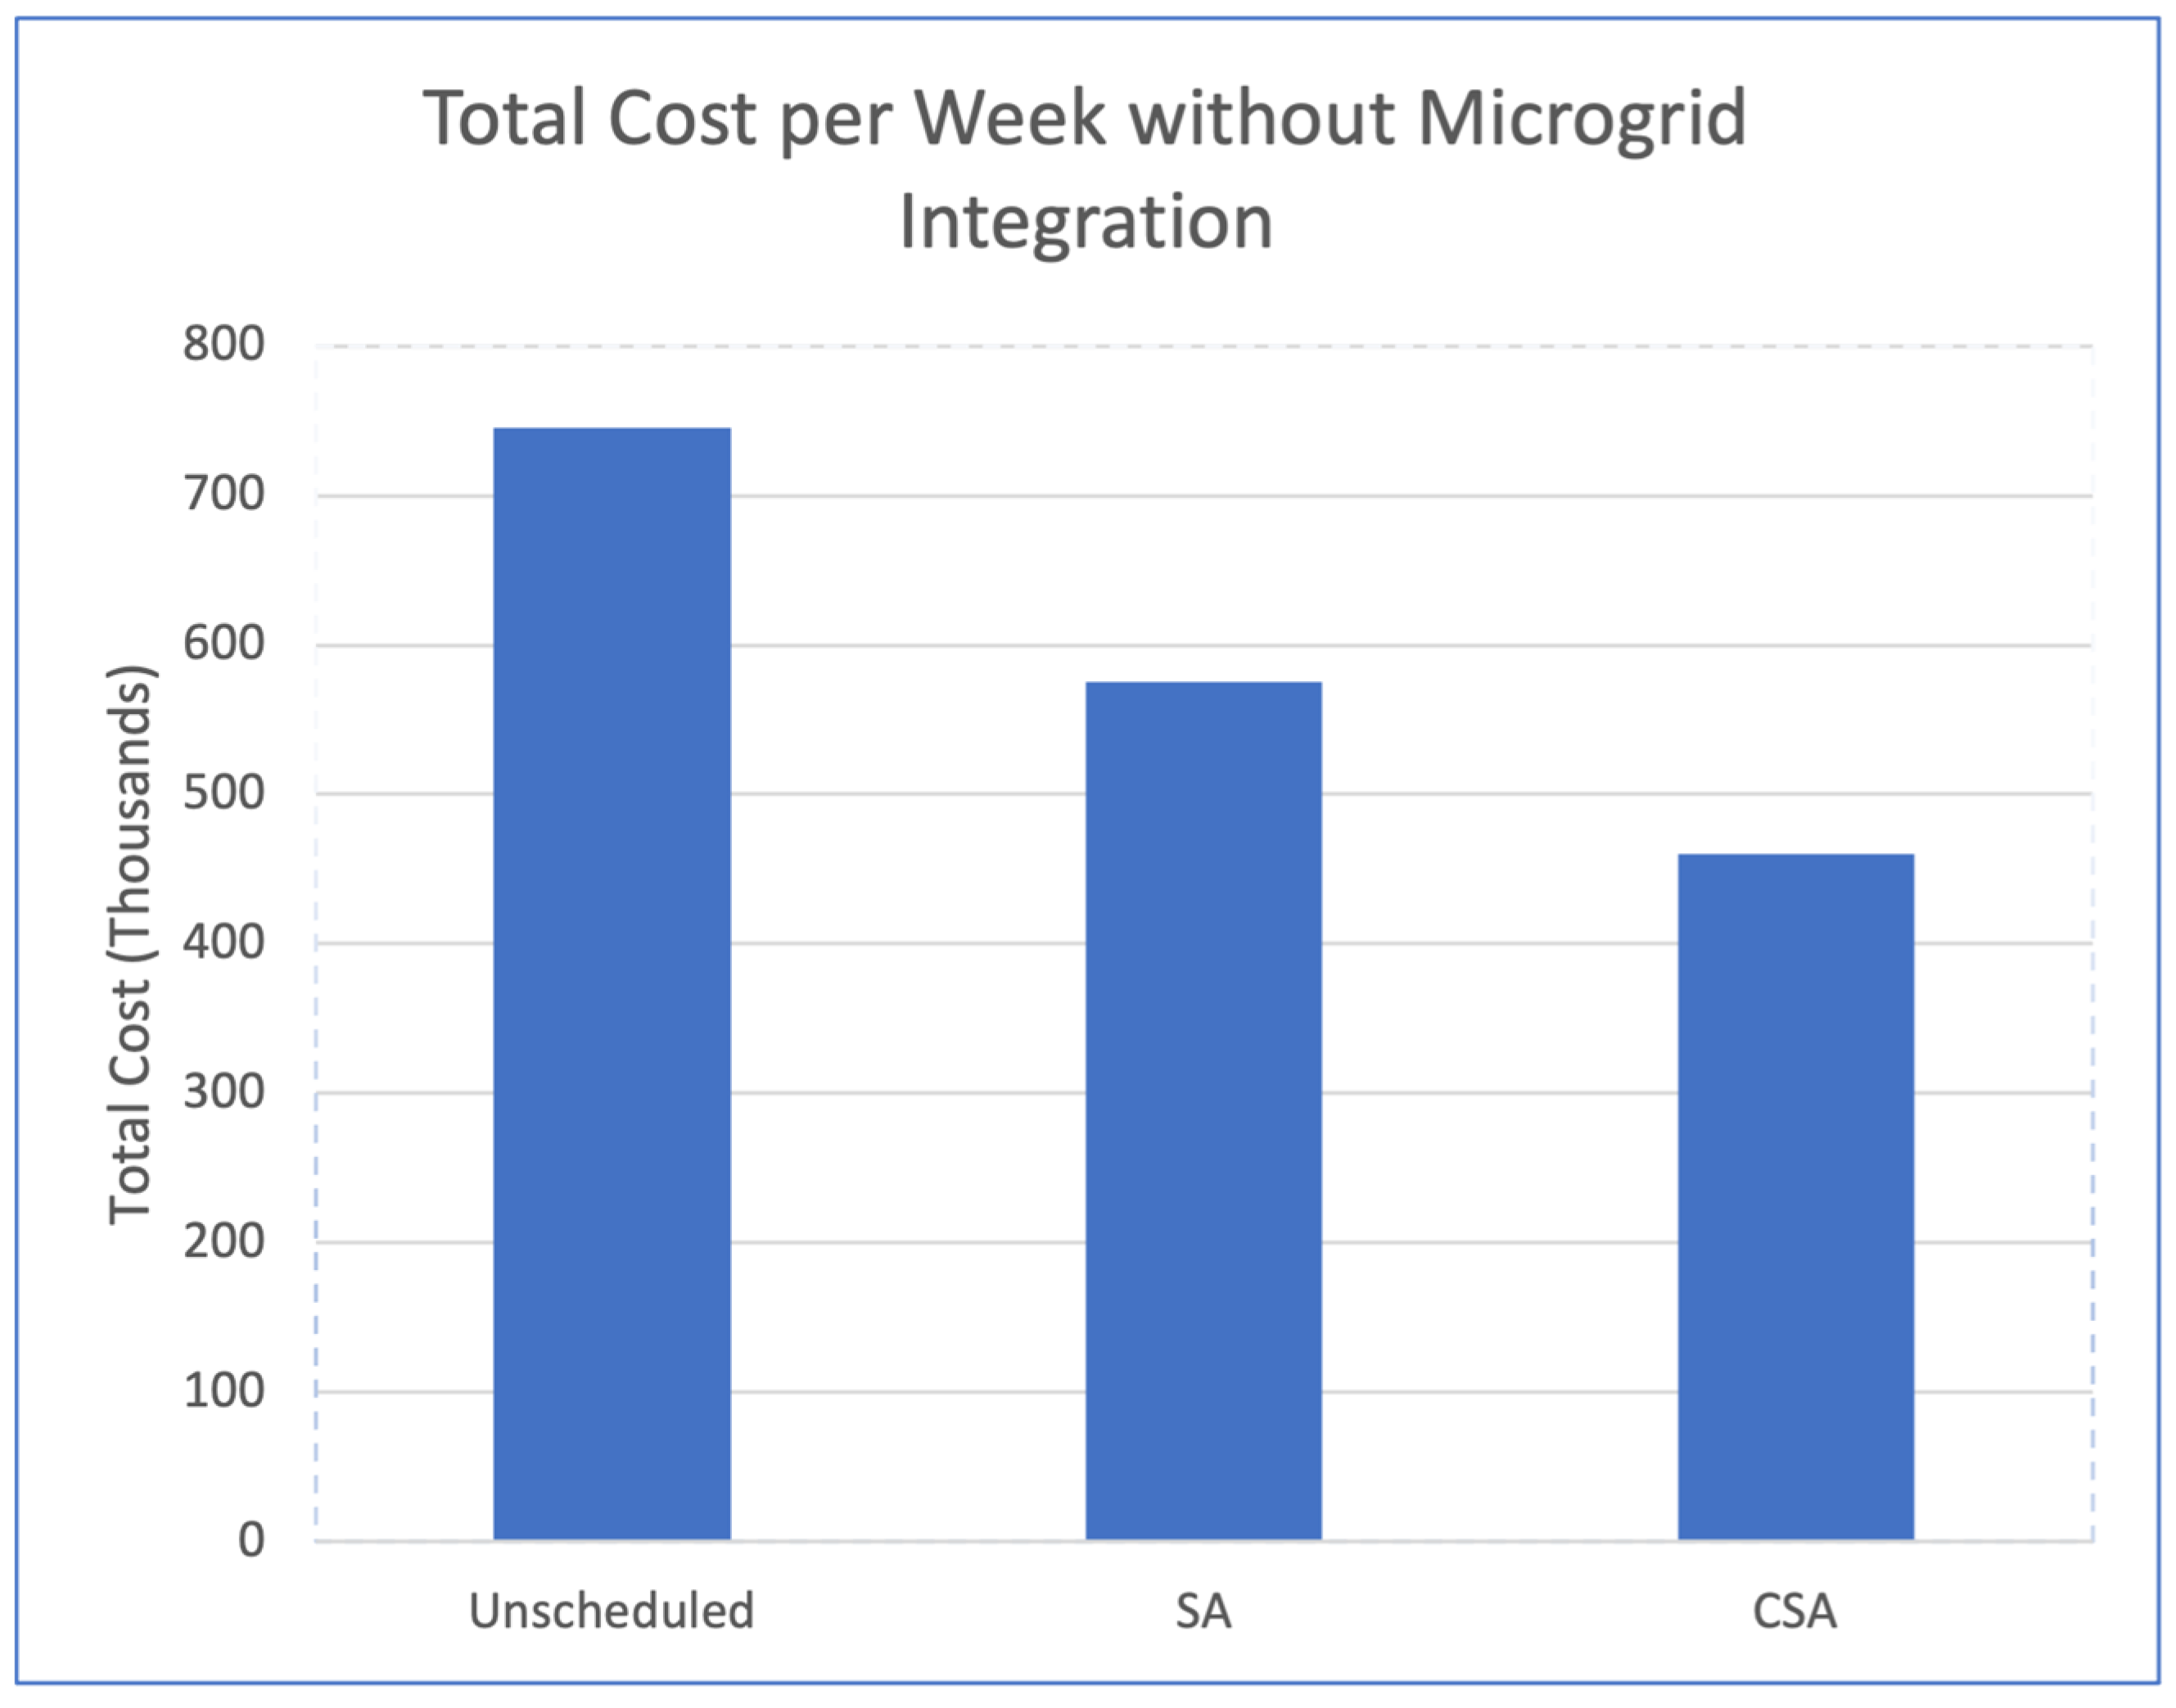
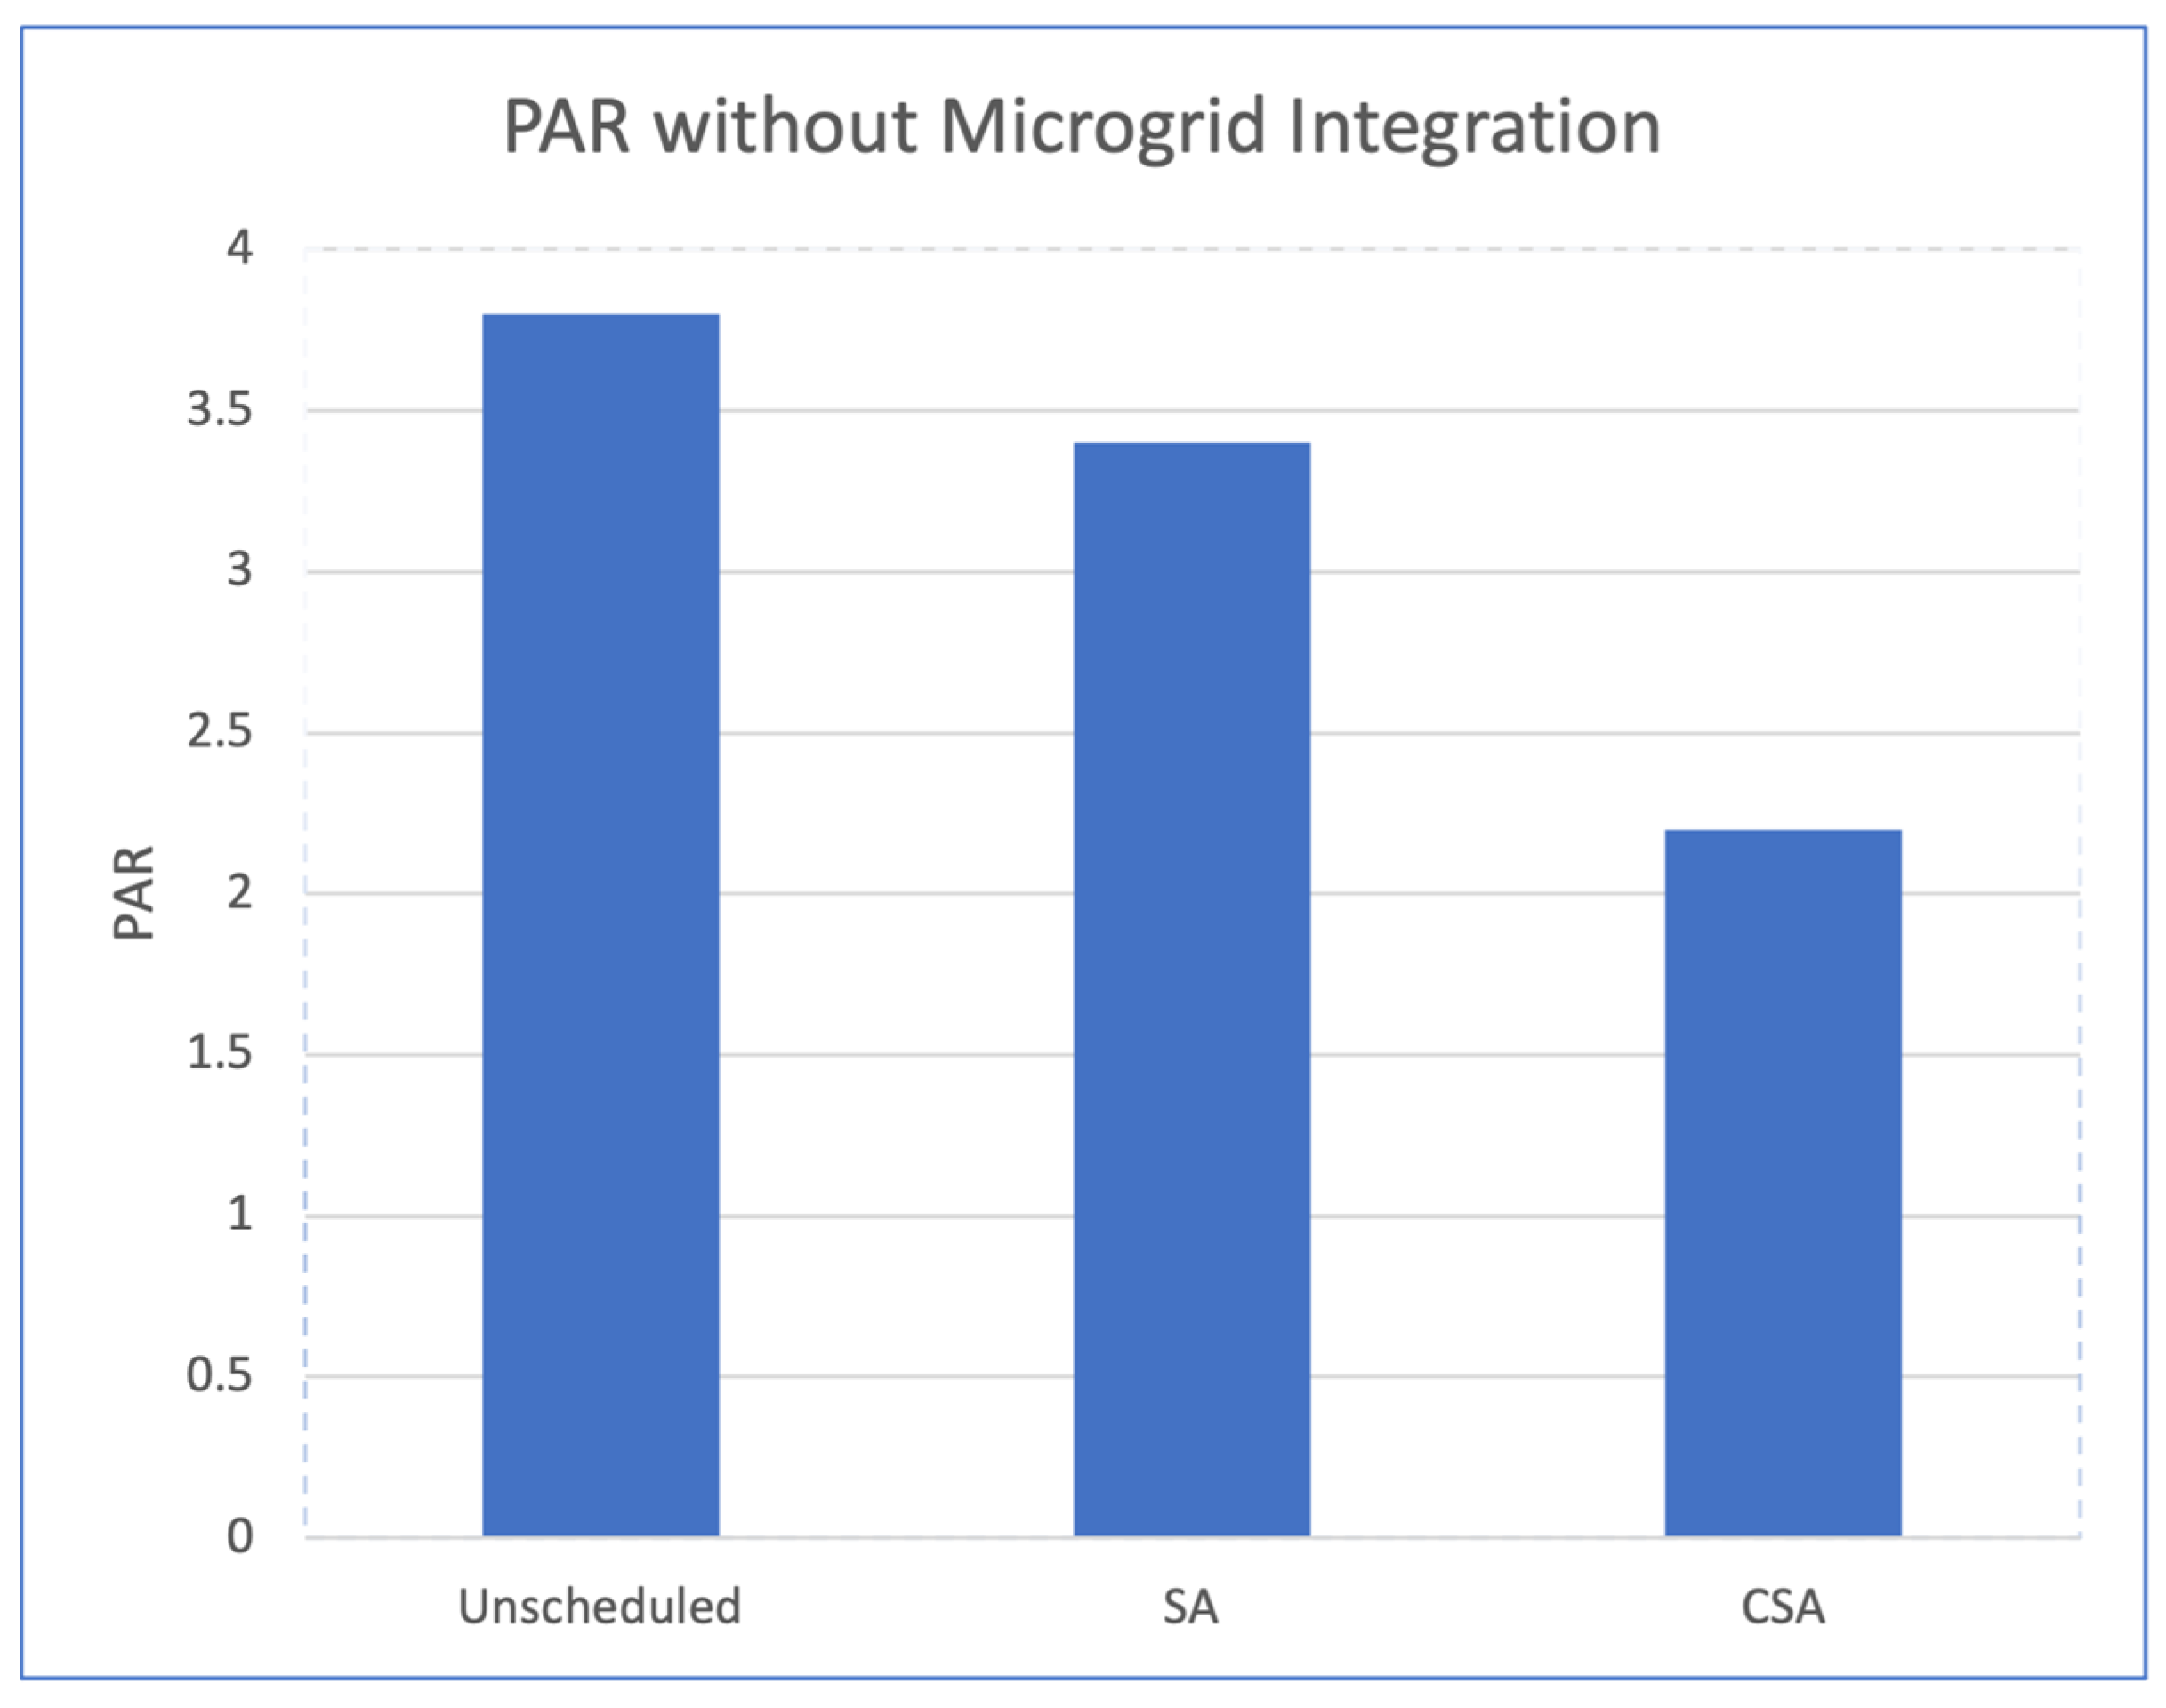
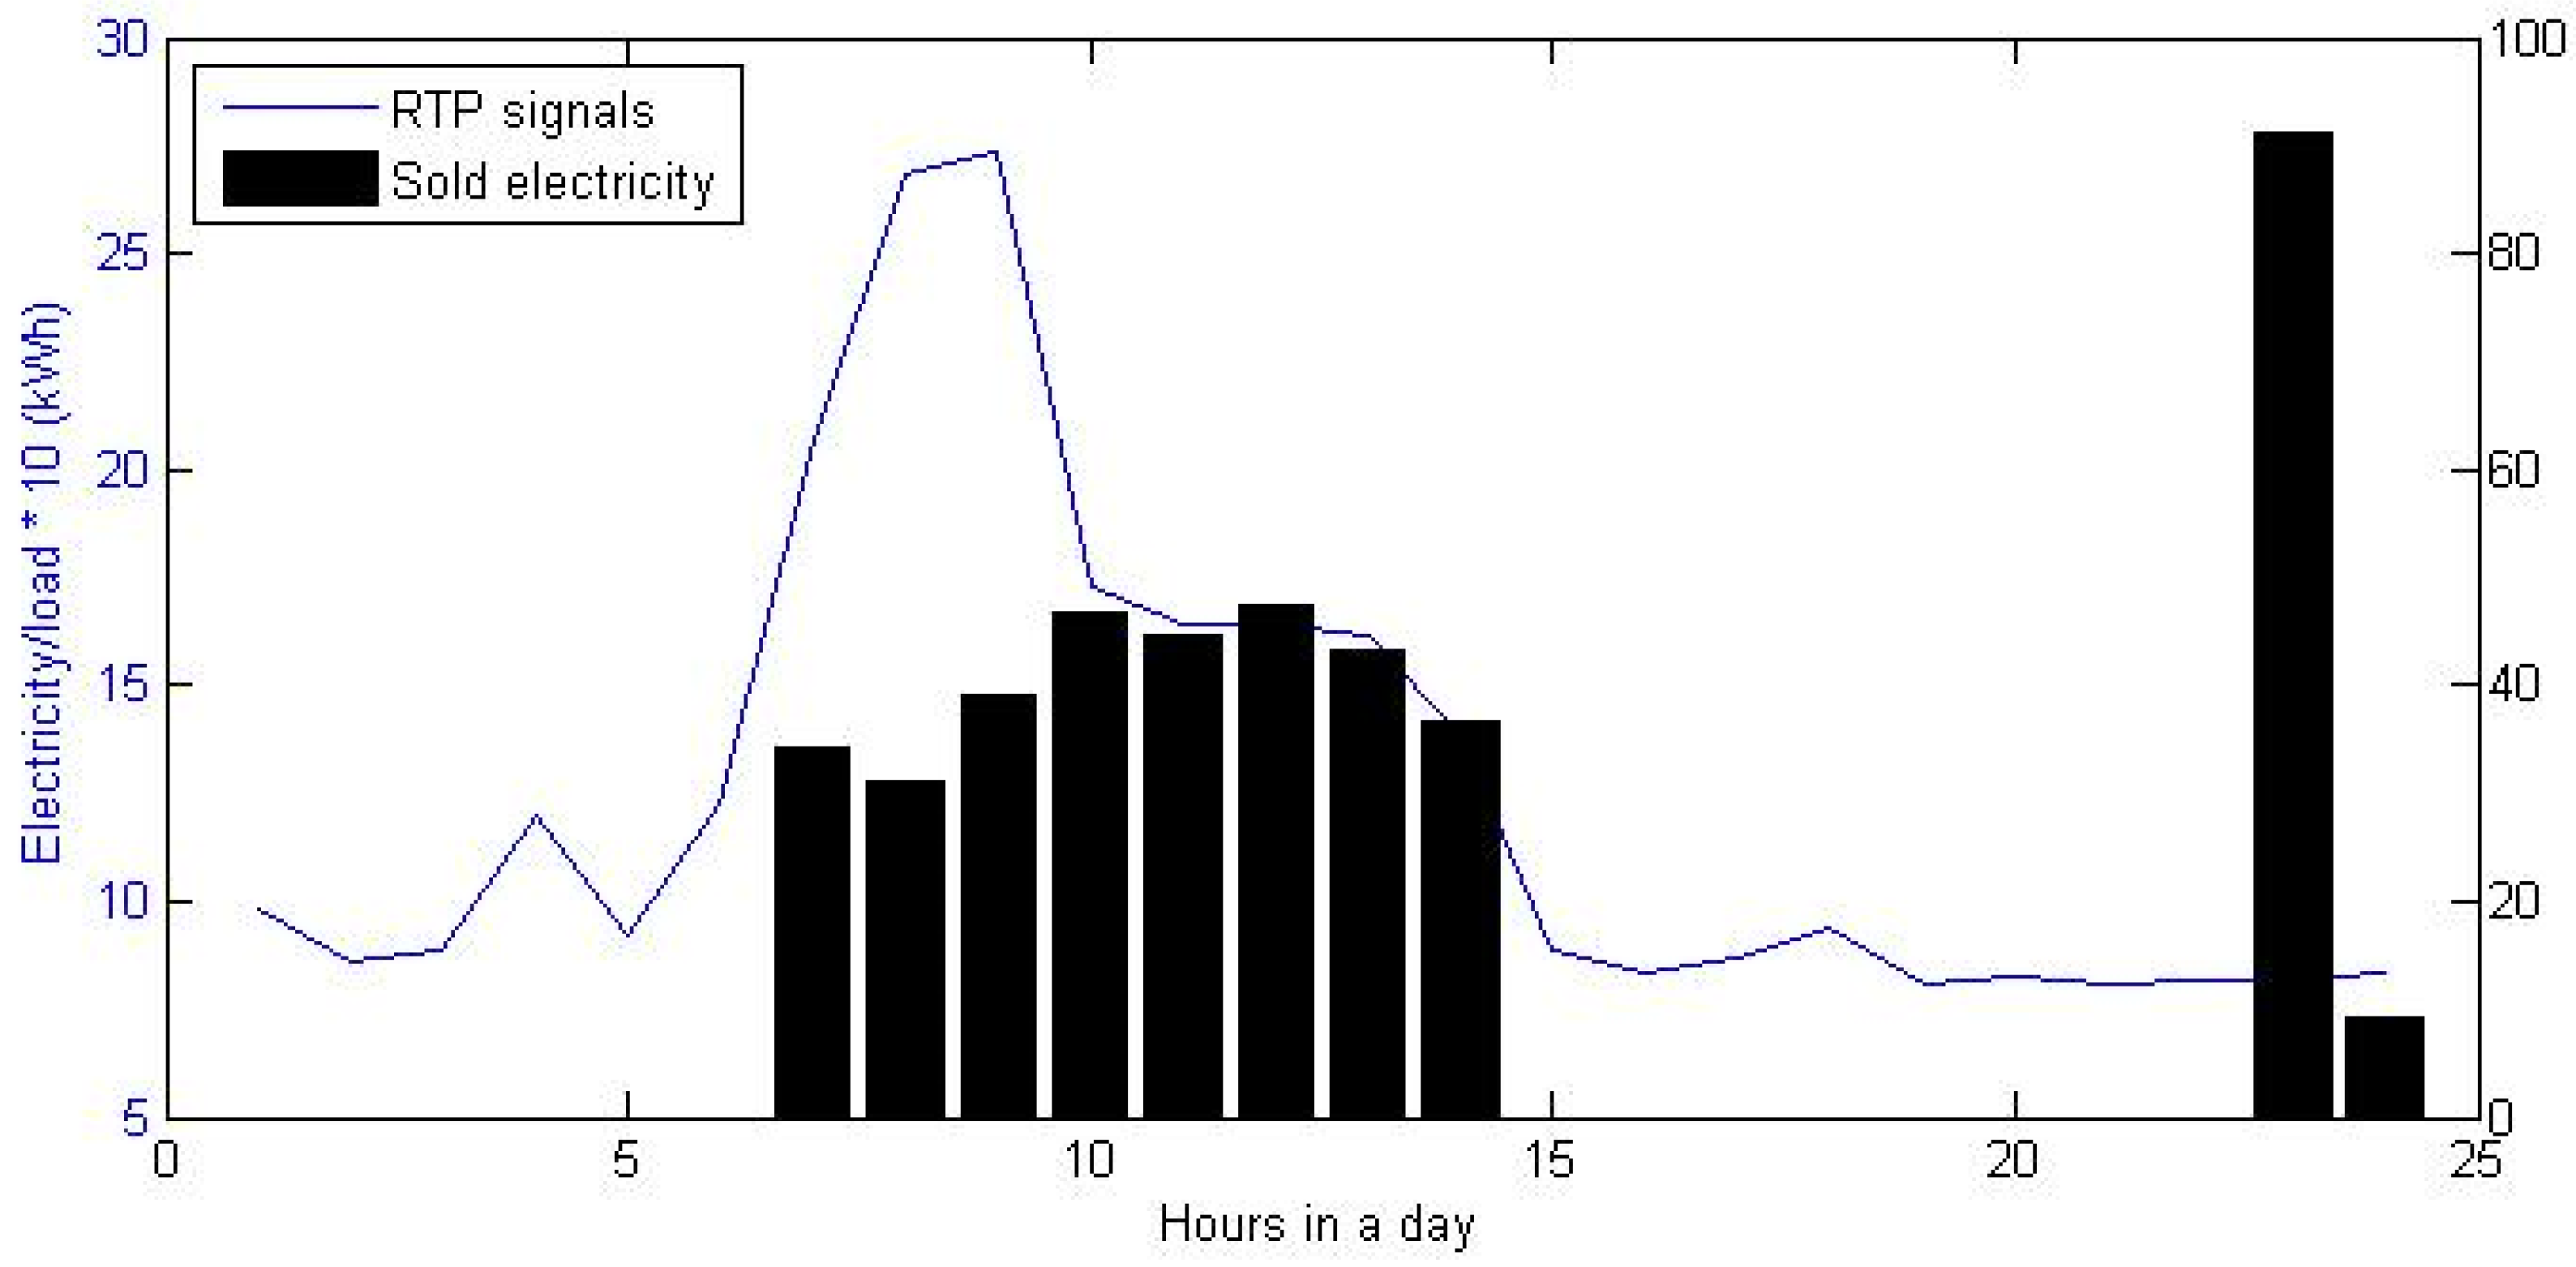
4.1.2. Industry Operation with EMS and without a Microgrid

In this case, the industrial load was connected with the EMS that efficiently manages the usage and consumption of electricity. The shiftable load can be shifted from peak to off-peak hours in accordance with the low electricity cost time using an efficient energy optimization technique. Figure 6, Figure 7 and Figure 8 represent the electricity consumption per hour, total cost of electricity per week, and peak to average ratio (PAR), respectively, between case 1 and case (SA and CSA). It can be observed that CSA is more favorable in comparison to SA as the cost reduction using SA and CSA in comparison to unscheduled load is 25% and 43%, respectively, whereas PAR reduction in a similar scenario lies at 13% in the case of SA and 40% in the case of CSA.

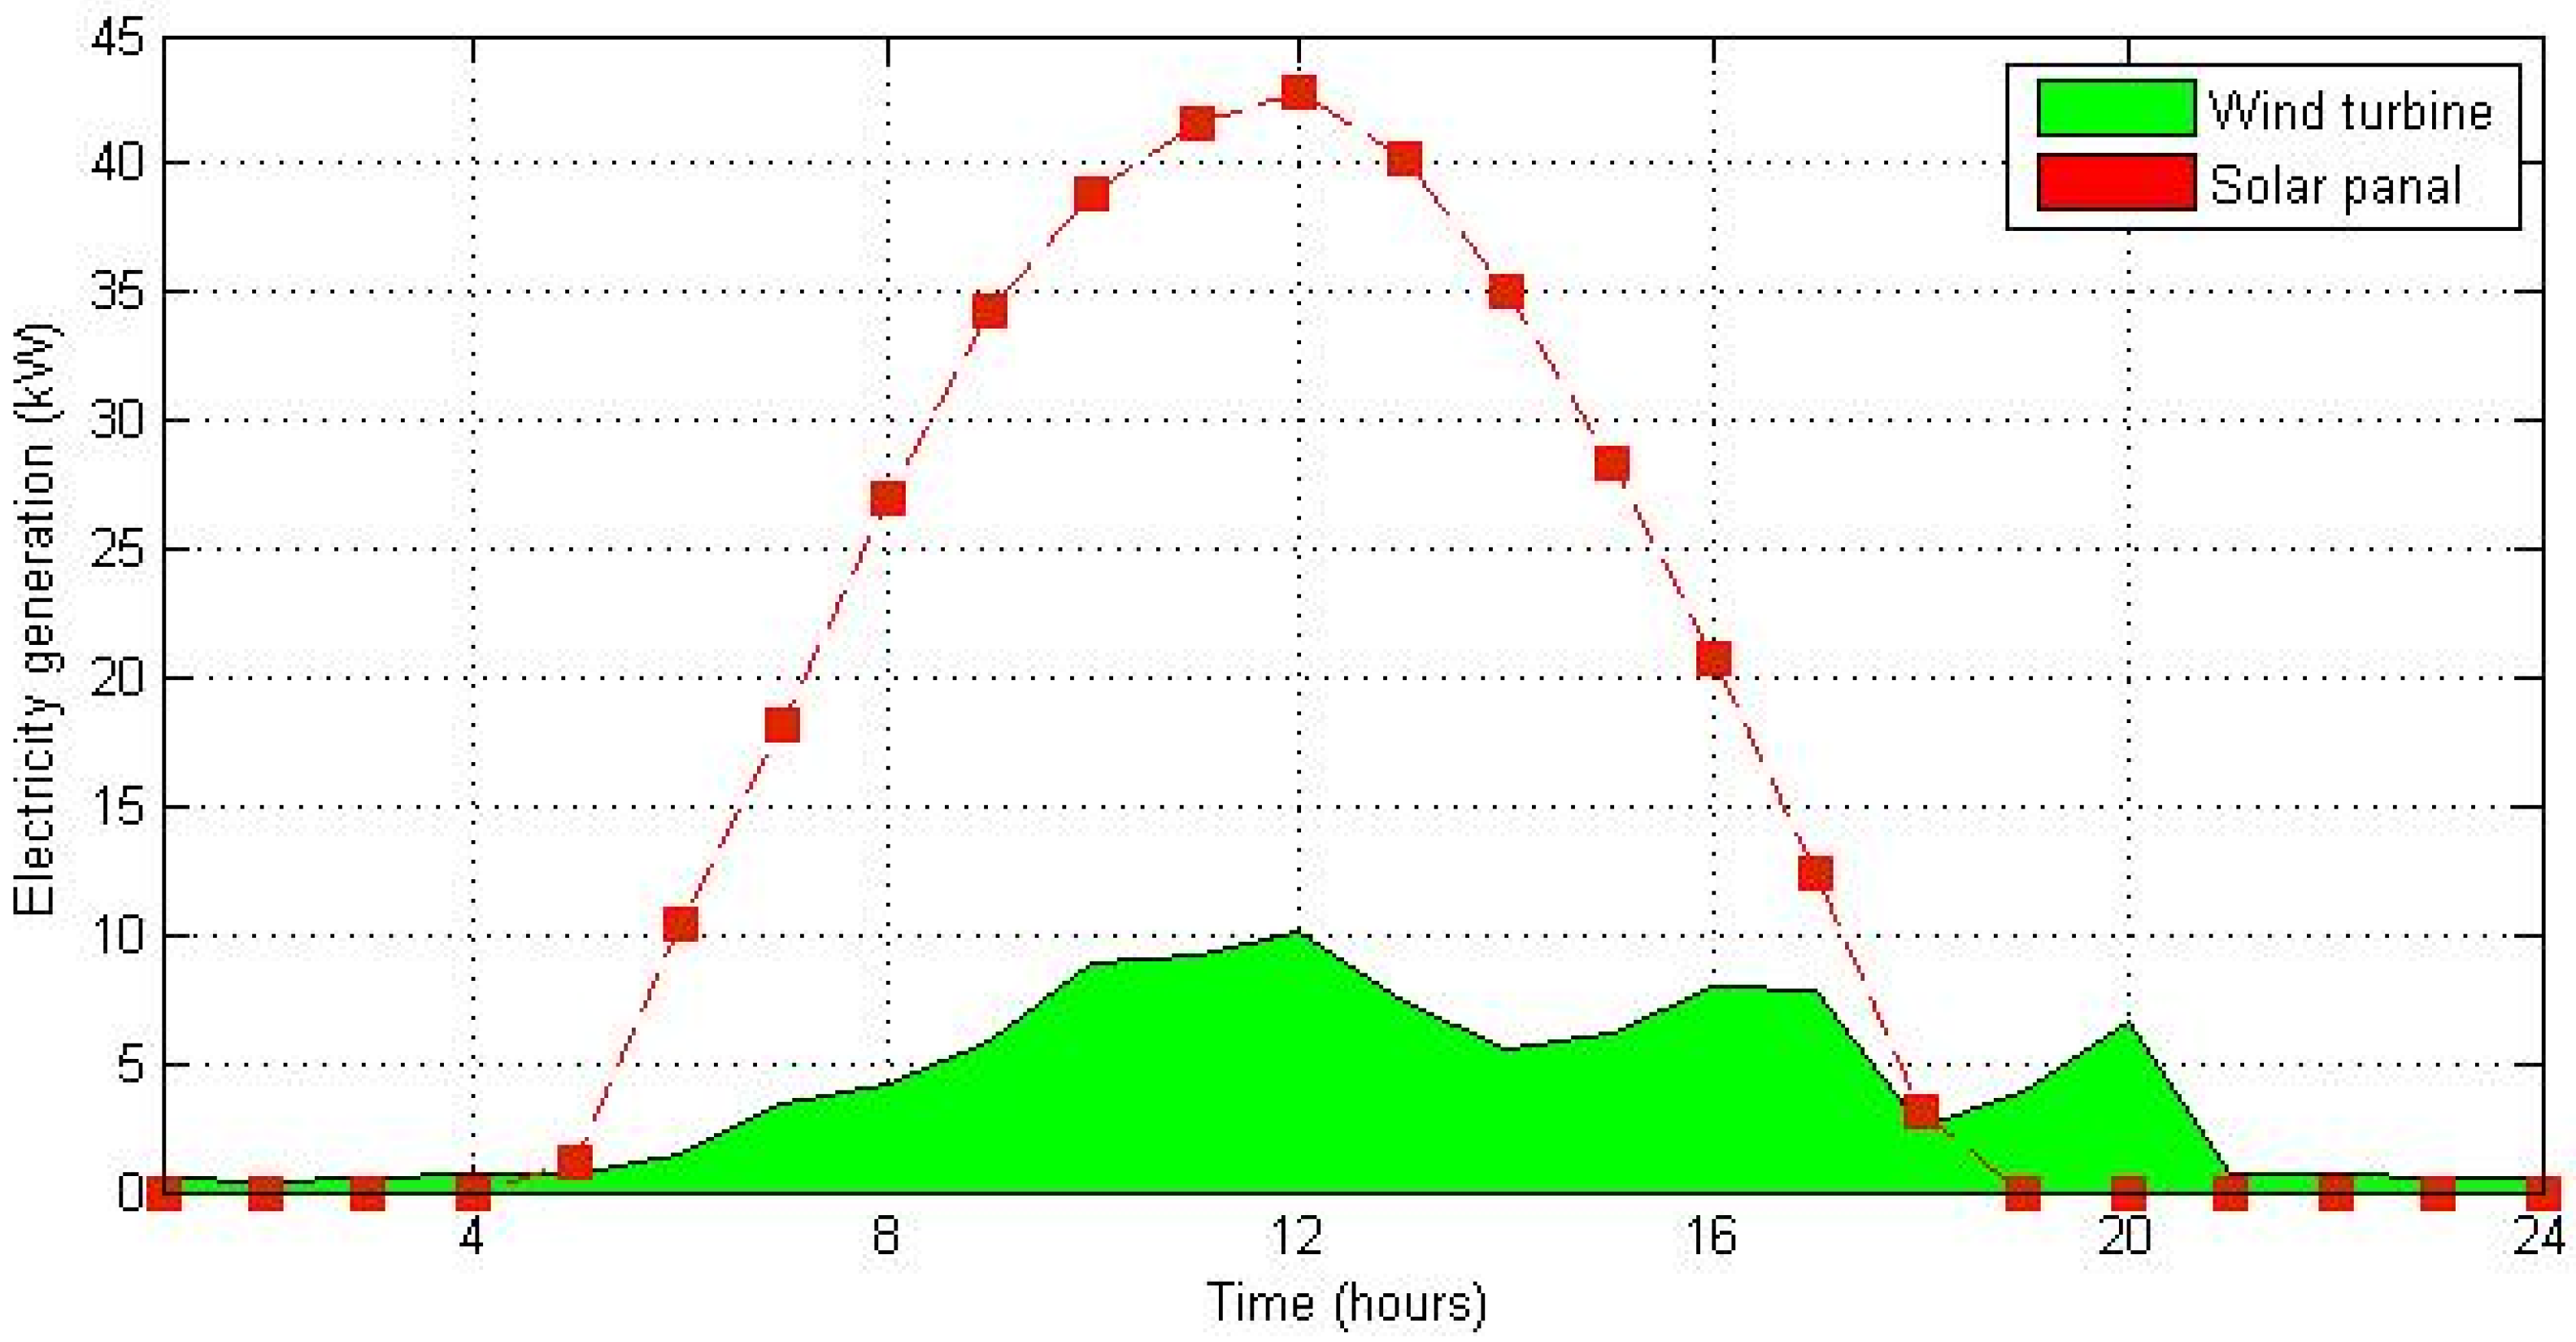
4.1.3. Industry Operation with EMS and Microgrid Integration

In this case, the industrial load was connected with the EMS and renewable energy-based microgrid along with power storage systems that efficiently perform the decision-making regarding purchase, sale, storage, and shifting of the load according to time slots in each hour. Using efficient energy optimization technique, the shiftable load can be shifted from peak to off-peak hours in accordance with the low electricity cost time. Moreover, in this type, the industry load relies on the distributed generation from microgrids and purchases energy from the commercial grid in off-peak hours or in severe scenarios. Figure 9 depicts the relationship between the input and output of renewable resources and the generation of the energy from solar and wind. These figures explain the relationship between wind speed and wind turbine generation, and the PV system’s dependence on solar irradiance for power generation throughout the day. These figures show that power generation through renewable resources is at a maximum efficiency because the wind speed and solar irradiance are high from 09:00 am to 05:00 pm on a clear sunny day. Figure 10 shows the share of renewable sources (wind and solar) in the total generation throughout the day.
Figure 11 shows that the CSA’s efficient algorithm waits for the peak hours to export electricity to grid to obtain the highest possible revenue from the excess-generated electricity. It can be observed from Figure 12 and Table 10 that electricity consumption using energy management by CSA is lower in comparison to other approaches, whereas the profit from energy sales is higher, which proves that CSA is more favorable for smart energy management and eventually power trading in comparison to SA.

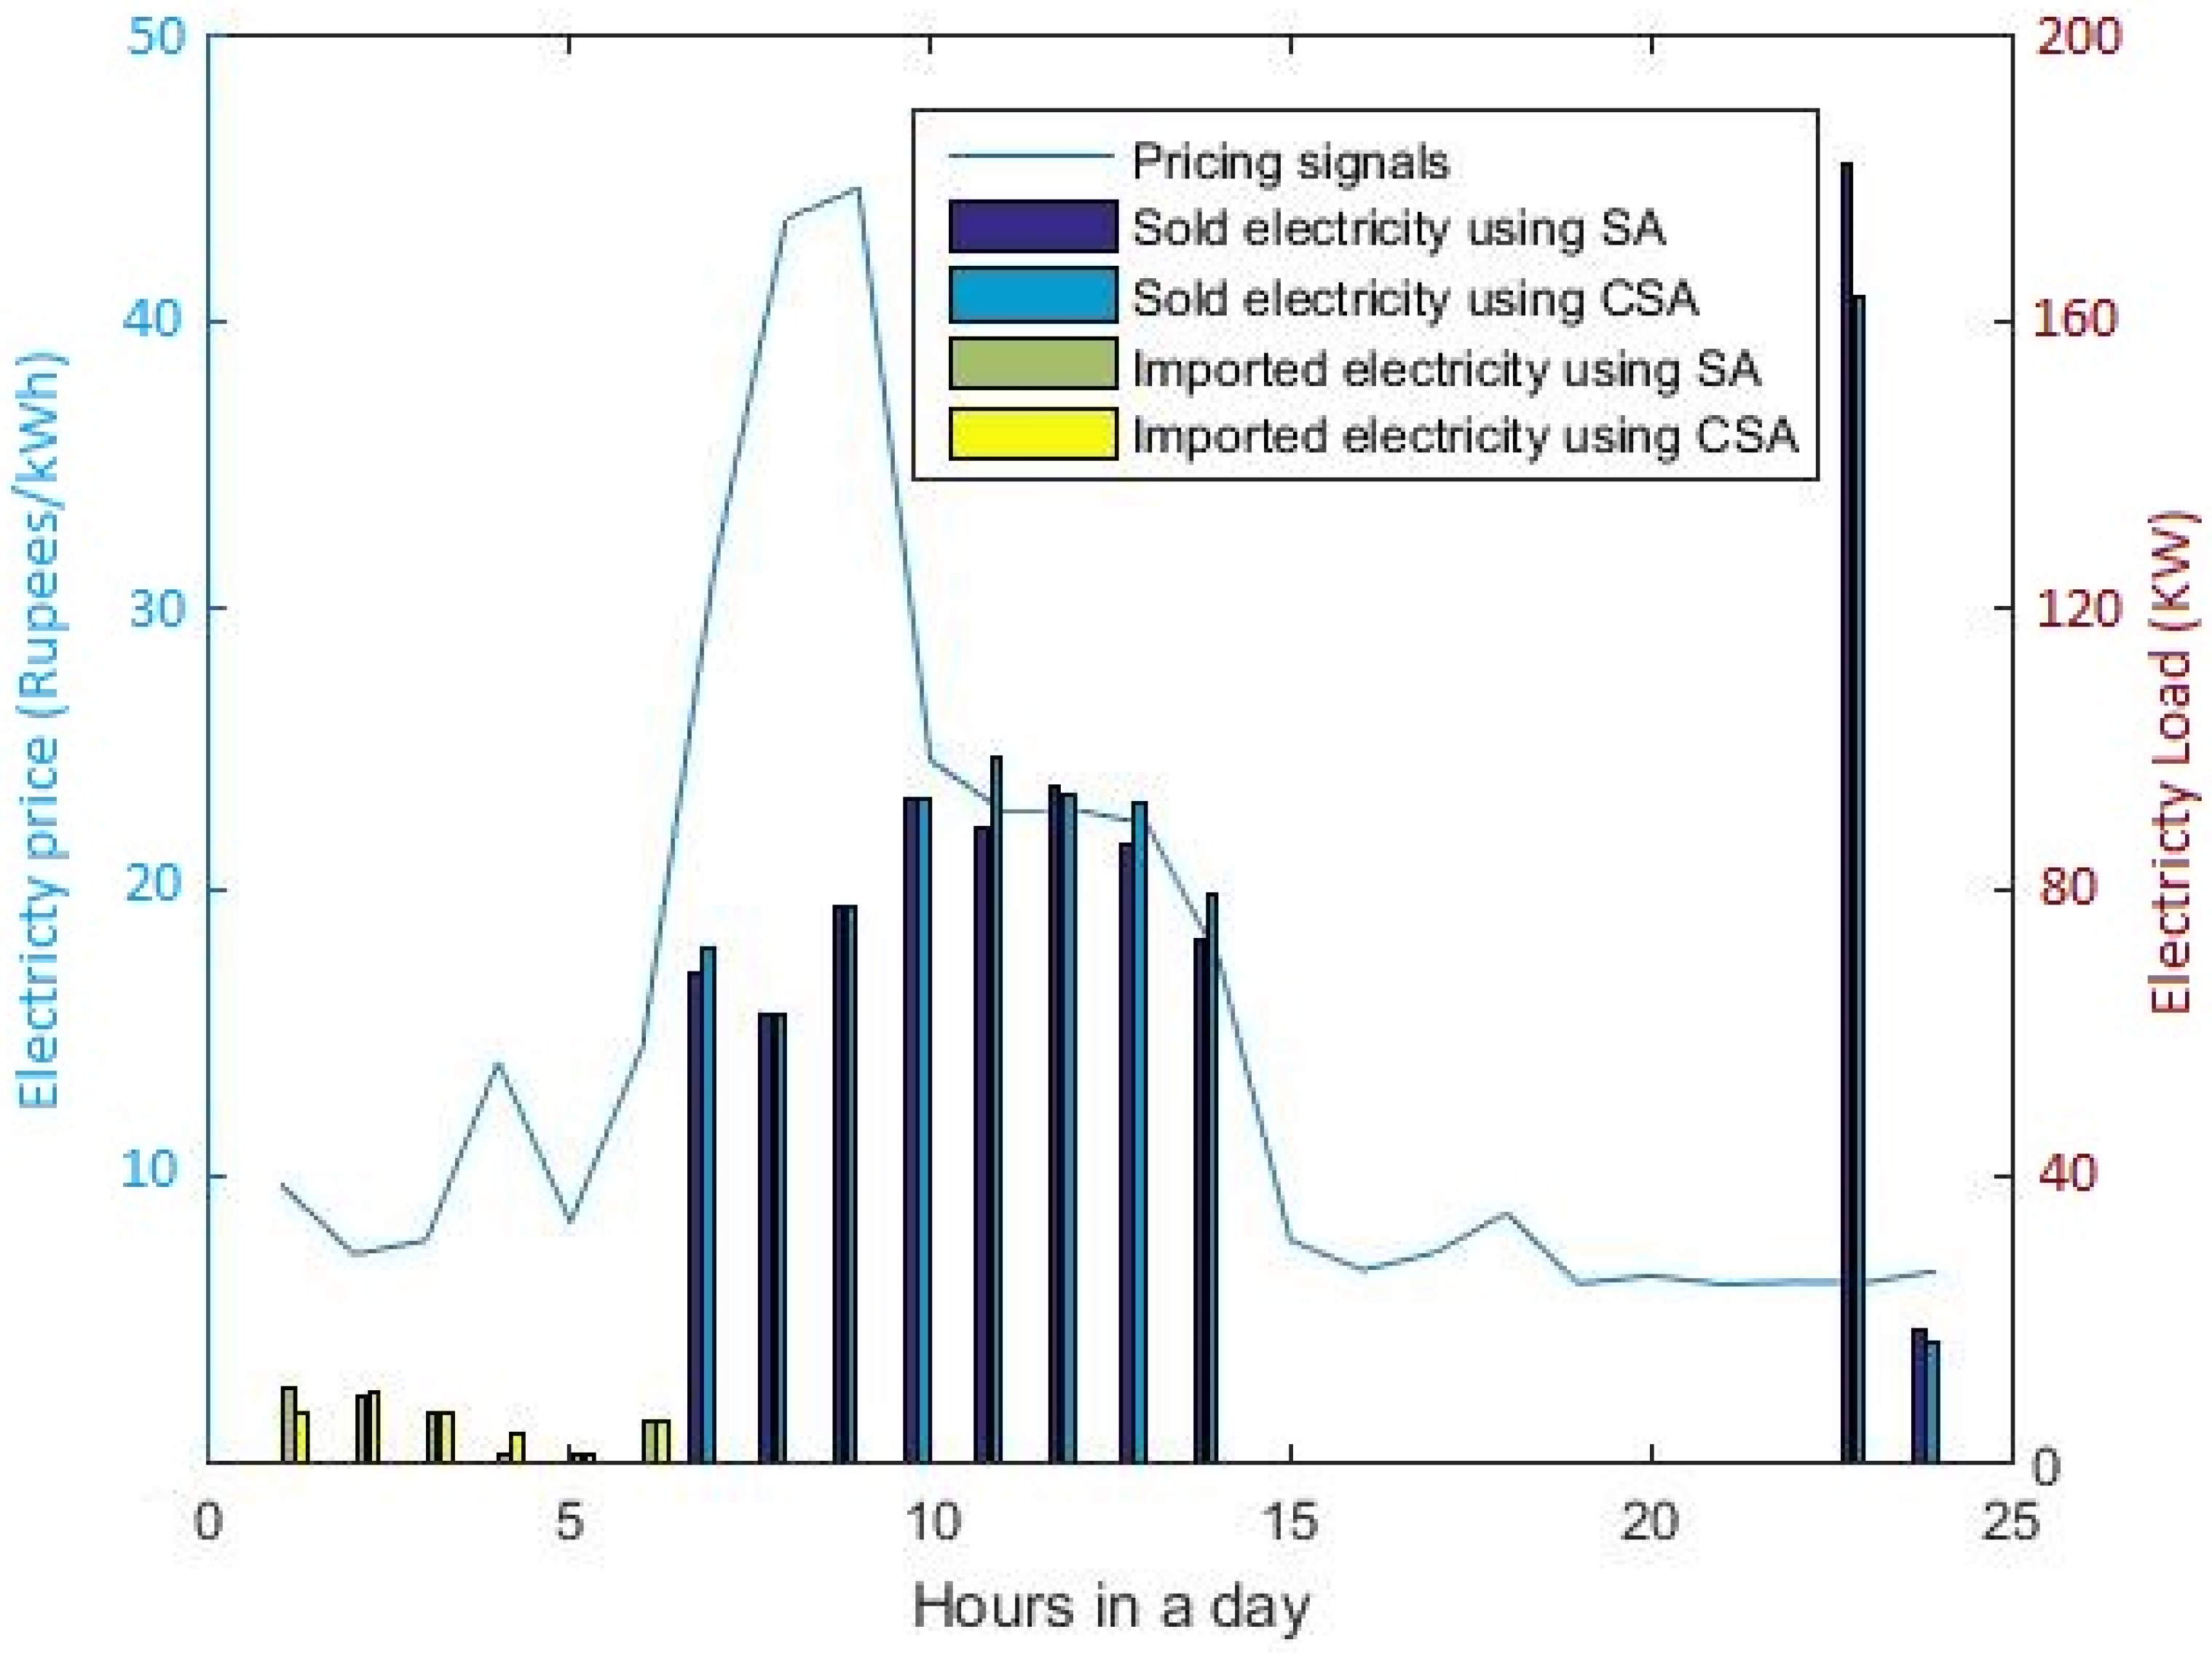
4.2. Comparative Studies

For all three cases discussed above, a comparison study was carried out between the unscheduled load, the strawberry algorithm (SA), and the cuckoo search algorithm (CSA). It can be seen from the comparative study that the proposed system with energy management and microgrid integration performs efficiently. It can be observed that electricity consumption using energy management as well as peak to average ratio (PAR) by CSA is lowest in comparison to other approaches, whereas the profit from energy sales is higher. However, power trading is only possible in the third case and the total revenue generated through this scheme can be seen in Table 10. This proves that CSA is more favorable for smart energy management and, eventually, power trading in comparison to SA.
Table 10 shows the outcomes of the comparative study regarding PAR, cost-saving, and earnings, etc.

5. Conclusions

An efficient solution for the optimization of the energy management comprising microgrid systems for the industries in Pakistan was proposed. A microgrid based on photovoltaic, wind turbine, power storage system, and dual-fuel (DF) generators as backup was considered for the proposed study. A heuristic methodology with the cuckoo search algorithm was proposed for machine load scheduling for the effective power trading of electricity. Weather forecasting for efficient energy management was carried out using the ANN mechanism. The MILP algorithm was implemented to optimize the system design problems that control decision making for the ideal operation management. Moreover, the CSA with the RTP technique was implemented for the efficient management of load (shifting of low priority/secondary load from peak hours to off-peak hours) and power trading between industry and commercial grids. The industry’s smart energy management system makes autonomous decisions regarding scheduling, purchasing, selling, and storing excess electricity. The analysis of the proposed technique was carried out in three different scenarios regarding power purchase from the commercial grid, PAR, savings, and earning by power trading. Furthermore, comparative studies were carried out by implementing the strawberry algorithm (SA) in a similar environment. Due to the global search mechanism of CSA in comparison to the local search algorithm of SA, CSA proves to be more flexible and efficient for settling on self-governing choices for the efficient scheduling of machines and the trading of power with an external grid station by spending more time on a global search in comparison to the local search of SA.
In future, EV integration can be carried out to perform mobile storage. Furthermore, a mathematical model will be designed for residential and commercial sectors according to their load variations.

Author Contributions

Conceptualization, A.Z.; Data curation, F.A. (Faran Asghar); Formal analysis, A.Z.; Funding acquisition, J.-T.K.; Investigation, F.A. (Faran Asghar); Methodology, F.A. (Faran Asghar) and A.Z.; Project administration, F.A. (Furqan Asghar) and W.A.; Resources, M.I.H.; Software, F.A. (Faran Asghar); Supervision, F.A. (Furqan Asghar) and J.-T.K.; Visualization, W.A.; Writing—original draft, F.A. (Furqan Asghar); Writing—review and editing, M.I.H. All authors have read and agreed to the published version of the manuscript.

Funding

This work was supported by the National Research Foundation of Korea (NRF) grant funded by the Korean government (MSIT) (No. NRF-2021R1A2C2092760).

Acknowledgments

The authors acknowledge the support of the Department of Energy Systems Engineering, and Punjab Bioenergy Institute (PBI), University of Agriculture, Faisalabad, for providing the research and testing facility.

Conflicts of Interest

The authors declare no conflict of interest.

Appendix A

Algorithm A1 Basic working of the cuckoo search 7algorithm.
Objective function f ( x ) ,   x = ( x 1 , . , x d ) T ;
Initial a population of n host nests x i   ( i = 1 , 2 , , n ) ;
While (t<MaxGeneration) or (stop criterion);
 Get a cuckoo (say i) randomly by Lévy flights;
 Evaluate its quality/fitness F i ;
 Choose a nest among n (say j) randomly;
If   ( F i > F j ) ,
  Replace j by the new solution;
end
Abandon a fraction ( ρ a ) of worse nests
  [and build new ones at new locations via Lévy flights];
Keep the best solutions (or nests with quality solutions);
Rank the solutions and find the current best;
end while
postprocess results and visualization;

References

  1. Bölük, G.; Mert, M. Fossil & renewable energy consumption, GHGs (greenhouse gases) and economic growth: Evidence from a panel of EU (European Union) countries. Energy 2014, 74, 439–446. [Google Scholar] [CrossRef]
  2. Gungor, V.C.; Sahin Kocak, D.; Ergut, S.; Buccella, C.; Cecati, C.; Hancke, G.P. Smart grid and smart homes: Key players and pilot projects. IEEE Ind. Electron. Mag. 2012, 6, 18–34. [Google Scholar] [CrossRef]
  3. Evangelisti, S.; Lettieri, P.; Clift, R.; Borello, D. Distributed Generation by Energy from Waste Technology: A Life Cycle Perspective. Process Saf. Environ. Prot. 2015, 93, 161–172. [Google Scholar] [CrossRef]
  4. Wu, J.; Yan, J.; Jia, H.; Hatziargyriou, N.; Djilali, N.; Sun, H. Integrated Energy Systems. Appl. Energy 2016, 167, 155–157. [Google Scholar] [CrossRef]
  5. Hu, H.; Xie, N.; Fang, D.; Zhang, X. The role of renewable energy consumption and commercial services trade in carbon dioxide reduction: Evidence from 25 developing countries. Appl. Energy 2018, 211, 1229–1244. [Google Scholar] [CrossRef]
  6. Akram, F.; Asghar, F.; Majeed, M.A.; Amjad, W.; Manzoor, M.O.; Munir, A. Techno-economic optimization analysis of stand-alone renewable energy system for remote areas. Sustain. Energy Technol. Assess. 2020, 38, 100673. [Google Scholar] [CrossRef]
  7. Asghar, F.; Talha, M.; Kim, S.H. Fuzzy logic-based intelligent frequency and voltage stability control system for standalone microgrid. Int. Trans. Electr. Energy Syst. 2017, 28, e2510. [Google Scholar] [CrossRef]
  8. Lujano, R.; Análisis, J.M. Gestión Óptima de la Demanda en Sistemas Eléctricos Conectados a la red y en Sistemas Aislados Basados en Fuentes Renovables. Ph.D. Thesis, Univesity of Zaragoza, Zaragoza, Spain, 2012. [Google Scholar]
  9. Cristóbal, M.; Dufo, I.R.; López, R. Optimization of photovoltaic-diesel-battery stand-alone systems minimizing system weight. Energy Convers. Manag. 2016, 119, 279–288. [Google Scholar] [CrossRef]
  10. Thirugnanam, K.; Kerk, S.K.; Yuen, C.; Liu, N.; Zhang, M. Energy Management for Renewable Microgrid in Reducing Diesel Generators Usage with Multiple Types of Battery. IEEE Trans. Ind. Electron. 2018, 65, 6772–6786. [Google Scholar] [CrossRef]
  11. Asghar, F.; Talha, M.; Kim, S.H. Robust Frequency and Voltage Stability Control Strategy for Standalone AC/DC Hybrid Microgrid. Energies 2017, 10, 760. [Google Scholar] [CrossRef] [Green Version]
  12. Majeed, M.A.; Asghar, F.; Hussain, M.I.; Amjad, W.; Munir, A.; Armghan, H.; Kim, J.T. Adaptive Dynamic Control Based Optimization of Renewable Energy Resources for Grid-Tied Microgrids. Sustainability 2022, 14, 1877. [Google Scholar] [CrossRef]
  13. Shi, W.; Lee, E.K.; Yao, D.; Huang, R.; Chu, C.C.; Gadh, R. Evaluating microgrid management and control with an implementable energy management system. In Proceedings of the 2014 IEEE International Conference on Smart Grid Communications, Venice, Italy, 15 January 2015. [Google Scholar]
  14. Shi, W.; Li, N.; Chu, C.C.; Gadh, R. Real-Time Energy Management in Microgrids. IEEE Trans. Smart Grid 2015, 8, 228–238. [Google Scholar] [CrossRef]
  15. Majeed, M.A.; Khan, M.G.; Asghar, F. Nonlinear control of hybrid energy storage system for hybrid electric vehicles. Int. Trans. Electr. Energy Syst. 2019, 30, e12268. [Google Scholar] [CrossRef]
  16. Guerrero, J.M.; Chandorkar, M.; Lee, T.L.; Loh, P.C. Advanced Control Architectures for Intelligent Microgrids—Part I: Decentralized and Hierarchical Control. IEEE Trans. Ind. Electron. 2013, 60, 1254–1262. [Google Scholar] [CrossRef] [Green Version]
  17. Velik, R.; Nicolay, P. Grid-price-dependent energy management in microgrids using a modified simulated annealing triple-optimizer. Appl. Energy 2014, 130, 384–395. [Google Scholar] [CrossRef]
  18. Jin, M.; Feng, W.; Liu, P.; Marnay, C.; Spanos, C. MOD-DR: Microgrid optimal dispatch with demand response. Appl. Energy 2017, 187, 758–776. [Google Scholar] [CrossRef] [Green Version]
  19. Zame, K.K.; Brehm, C.A.; Nitica, A.T.; Richard, C.L.; Iii, G.D.S. Smart grid and energy storage: Policy recommendations. Renew. Sustain. Energy Rev. 2018, 82, 1646–1654. [Google Scholar] [CrossRef]
  20. Johnson, M. Controlling and optimizing resilient distributed energy resources and microgrids with a demand-side operation platform. Electr. J. 2017, 30, 12–15. [Google Scholar] [CrossRef]
  21. Golmohamadi, H.; Keypour, R.; Bak-Jensen, B.; Pillai, J.R. A multi-agent based optimization of residential and industrial demand response aggregators. Int. J. Electr. Power Energy Syst. 2018, 107, 472–485. [Google Scholar] [CrossRef]
  22. Karfopoulos, E.; Tena, L.; Torres, A.; Salas, P.; Gil Jorda, J.; Dimeas, A.; Hatziargyriou, N. A multi-agent system providing demand response services from residential consumers. Electr. Power Syst. Res. 2015, 120, 163–176. [Google Scholar] [CrossRef]
  23. Mocci, S.; Natale, N.; Pilo, F.; Ruggeri, S. Demand side integration in LV smart grids with multi-agent control system. Electr. Power Syst. Res. 2015, 125, 23–33. [Google Scholar] [CrossRef]
  24. Li, W.; Logenthiran, T.; Phan, V.T.; Woo, W.L. Intelligent Multi-Agent System for Power Grid Communication. In Proceedings of the IEEE Region 10 Conference, Singapore, 22–25 November 2016; pp. 3386–3389. [Google Scholar]
  25. Wang, Y.; Wu, J.; Mao, X. Research on intelligent dispatching strategy of power grid using multi-agent and knowledge discovery algorithm. J. Eng. 2018, 2018, 1503–1508. [Google Scholar] [CrossRef]
  26. Luna, A.C.; Diaz, N.L.; Graells, M.; Vasquez, J.C.; Guerrero, J.M. Mixed integer linear programming-based energy management system for hybrid PV-wind-battery microgrids: Modeling, design, and experimental verification. IEEE Trans. Power Electron. 2016, 32, 2769–2783. [Google Scholar] [CrossRef] [Green Version]
  27. Akhil, A.A.; Huff, G.; Currier, A.H.; Kaun, B.C.; Rastler, D.M.; Chen, S.B.; Cotter, A.L.; Bradshaw, D.T.; Gauntlett, W.T. DOE/EPRI Electricity Storage Handbook in Collaboration with NRECA; Sandia National Laboratories: Albuquerque, NM, USA, 2015. [Google Scholar]
  28. Nemati, M.; Braun, M.; Tenbohlen, S. Optimization of unit commitment and economic dispatch in microgrids based on genetic algorithm and mixed integer linear programming. Appl. Energy 2018, 210, 944–963. [Google Scholar] [CrossRef]
  29. Aslam, S.; Javaid, N.; Khan, F.A.; Alamri, A.; Almogren, A.; Abdul, W. Towards Efficient Energy Management and Power Trading in a Residential Area via Integrating a Grid-Connected Microgrid. Sustainability 2018, 10, 1245. [Google Scholar] [CrossRef] [Green Version]
  30. Yang, X.S.; Deb, S. Cuckoo Search via Levy Flights. In Proceedings of the World Congress on Nature and Biologically Inspired Computing, Coimbatore, India, 9–11 December 2009. [Google Scholar]
  31. Merrikh-Bayat, F. A numerical optimization algorithm inspired by the strawberry plant. arXiv 2014, arXiv:1407.7399. [Google Scholar]
Figure 1. Proposed hybrid microgrid system block diagram.
Sustainability 14 08788 g001
Figure 2. Relationship curve of wind speed vs. power generation.
Sustainability 14 08788 g002
Figure 3. V–I characteristic curve for IC MPPT.
Sustainability 14 08788 g003
Figure 4. Dual fuel generator.
Sustainability 14 08788 g004
Figure 5. RTP-based pricing signals and electricity consumption.
Sustainability 14 08788 g005
Figure 6. Electricity consumption per hour without microgrid integration.
Sustainability 14 08788 g006
Figure 7. Electricity cost per week without microgrid integration.
Sustainability 14 08788 g007
Figure 8. Peak to average ratio (PAR) without microgrid integration.
Sustainability 14 08788 g008
Figure 9. (a) Relationship between wind speed–power; (b) relationship between solar irradiance–power generation.
Sustainability 14 08788 g009
Figure 10. Power generation from PV and wind turbine system.
Sustainability 14 08788 g010
Figure 11. Time management by CSA for electricity export w.r.t. RTP.
Sustainability 14 08788 g011
Figure 12. Power trading between the industry and the commercial grid.
Sustainability 14 08788 g012
Table 1. Shiftable load (dying unit).
LoadMachine Type (Load)Rating (Motor)Motors QuantityTotal
(kW)
TOU/
h
Total kWhStarter Type
Shiftable Load Singging Machine02 HP11.492.33.427
Jet Type Machine 03 HP920.143.9479.35
Standard Machine04 HP (heat sucking from exhaust)38.954.6541.612.2 kW Inverter
7.5 HP (Gas Burner)316.78583.97.5–15 kW Inverter
Table 2. Shiftable load (printing unit).
Shiftable
Load
Calendar Machine05 HP414.922.131.332.2–5 kW Inverter
Comfort
Machine
04 HP25.9317.7-
Table 3. Shiftable load (finishing unit).
Shiftable LoadCare
Machine
03 HP823.874.197.68DOL
Dryer03 HP24.4763.616.11DOL
Boozer
Machine
01 HP64.476417.9042.2 kW
Inverter
Ager
Machine
02 HP11.49245.9682.2 kW
Inverter
Marsrise
Machine
2.94 HP12.26.313.86DOL
03 HP12.2384.910.96DOL
Rotary
Machine
03 HP86.7145.3435.85DOL
Pre-Printing
Process Machine
02 HP 11.4925.88.652.2 kW
Inverter
1.5 HP811.195.2358.522.2
kW Inverter
Table 4. Non-shiftable load (dying unit).
LoadMachine Type (Load)Rating (Motor)Motors QuantityTotal (kW)TOU/
h
Total kWhStarter
Type
Non-shift-able
Load
Singging
Machine
10 HP214.98119.367.5–15 kW Inverter
Jet Machine 05 HP933.58268.56-
Standard Type Machine10 HP322.388179.047.5–15 kW Inverter
15 HP333.578268.515–25 kW Inverter
Table 5. Non-shiftable load (printing unit).
Non-Shift-able
Load
Calendar
Machine
40 HP4119.368954.845–55 kW Inverter
Comfort
Machine
07 HP210.4883.557.5–15 kW Inverter
Table 6. Non-shiftable load (finishing unit).
Non-Shift-able
Load
Care Machine15 HP222.388179.4Star/Delta
Dryer15 HP222.388179.0415 kW Inverter
Washing Machine20 HP459.6808 to 10477.44/596.87.5–15 kW Inverter
Boozer
Machine
Magnet
(56 V, 0.8 A)
321.43645.744-
7.5 HP15.595422.387.5 kW Inverter
Marsrise
Machine
10 HP874.68596.87.5–15 kW Inverter
15 HP333.578268.56Star/Delta
Rotary
Machine
25 HP.
D.C Motor
118.658149.2D.C Starter
7.5 HP15.595844.76D.C Starter
20 HP459.688477.4422 kW Inverter
Pre-Printing
Process Machine
14.74 HP2228176Operated withServo Drive
1 kW Heater Rod1010880-
7.5 HP 422.388179.04DOL
7.0 HP15.22215.222DOL
Agar Machine4 HP12.984411.9367 kW inverter
7.5 HP15.595422.387 kW inverter
Super Machine7.5 HP 316.785467.14-
5 HP13.73414.927.5 kW Inverter
15 HP111.19444.762.2 kW Inverter
Table 7. CSA parameters.
Sr. No.ParametersValues
1Discovery Rate0.30
2Host Nest60
3Iteration1800
4Number of Eggs (n)13
Table 8. SA parameters.
Sr. No.ParametersValues
1Population Size115
2Runner55
3Root12
4Iteration1800
5N13
Table 9. Input parameters of the proposed study.
Sr. No.ParametersValues
1 W i n d p o w 50 kW
2 S o l a r p o w 150 kW
3 N c i 5 m/s
4 N c o 25 m/s
5 P S S c a p 100 kW
6 η P S S 95%
7SOC90%
Table 10. Comparative study for all three scenarios.
ParametersFirst TypeSecond TypeThird Type
TechniquesUnscheduledSACSASACSA
Electricity Purchase Cost (Millions/PKR)1.20.9830.7850.6590.432
PAR3.823.392.983.092.43
Cost Saving by EMS/Microgrid018.08%34.583%45.08%64%
Earnings (millions/PKR)0000.1700.987
Publisher’s Note: MDPI stays neutral with regard to jurisdictional claims in published maps and institutional affiliations.

