Abstract
The Claus process is one of the promising technologies for acid gas processing and sulfur recovery. Hydrogen sulfide primarily exists as a byproduct in the gas processing unit. It must be removed from natural gas. The Environmental Protection Agency (EPA) notices that increasing SO2 and CO2 in the air harms the environment. Sulfur generally has an elemental content of 0.1–6 wt % in crude oil, but the value could be higher than 14% for some crude oils and asphalts. It produces SO2 and CO2 gases, which damage the environment and atmosphere of the earth, called primary pollutants. When SO2 gas is reacted with water in the atmosphere, it causes sulphur and nitric acid, called a secondary pollutant. The world countries started desulphurization in 1962 to reduce the amount of sulfur in petroleum products. In this research, the Claus process was modeled in Aspen Plus software (AspenTech, Bedford, MA, USA) and industrial data validated it. The Peng–Robinson method is used for the simulation of hydrocarbon components. The influence of oxygen gas concentration, furnace temperature, the temperature of the first catalytic reactor, and temperature of the second catalytic reactor on the Claus process were studied. The first objective of the research is process modeling and simulation of a chemical process. The second objective is optimizing the process. The optimization tool in the Aspen Plus is used to obtain the best operating parameters. The optimization results show that sulfur recovery increased to 18%. Parametric analysis is studied regarding operating parameters and design parameters for increased production of sulfur. Due to pinch analysis on the Claus process, the operating cost of the heat exchangers is reduced to 40%. The third objective is the cost analysis of the process. Before optimization, it is shown that the production of sulfur recovery increased. In addition, the recovery of sulfur from hydrogen sulfide gas also increased. After optimizing the process, it is shown that the cost of heating and cooling utilities is reduced. In addition, the size of equipment is reduced. The optimization causes 2.5% of the profit on cost analysis.
1. Introduction
Different sour gases contain different impurities such as hydrogen sulfide gas, ammonia, carbon dioxide gas, and other waste materials, including nitrogen gas. There is a high quantity of sulfur content in the petroleum product and other contaminants that must be removed for environmental pollution. The elimination of sulfur is an essential objective in petroleum products such as petrol, diesel, and LPG ETC. The removal of sulfur is a rule of the Environmental Protection Agency (EPA) because it causes environmental pollution. H2S is found in the environment and causes harmful effects on human skin and eyes, as well as breathing problems. The H2S gas is the raw of dangerous gases such as SO2, CO2, and NH3 gases. Methane gas is the primary resource of H2S gas. When natural gases are burned in a combustion engine, it causes SO2 gases and CO2 gases. Almost all the refineries in the world use the Claus process to remove sulfur, and many refineries produce sulfur at 10 tons per day. Sulfur is the raw material of sulfuric acid [1,2]. An oxygen-based modification was used in the Claus process; there was a modification reported on this process by (1) upgrading the existing systems and introducing a new system; and (2) reducing the equipment size [3,4]. The Claus process is popular engineering for retrieving sulfur and energy from gases. It is conventionally split into thermal and catalytic stages to obtain a very high conversion of acid gas. In 1993, Lurgi Company conducted an experiment on the Claus process with a capacity of 10 tons per day and an efficiency of 99.8%. According to Iranian petroleum research, the incinerator process is still used, which exhausts SO2 into the environment for the Sulfur recovery process.
Many refineries tire out several thousand ppm of air pollution day after day, attributable to the transformation of the sulfur element to SO2. A super Claus catalyst was introduced, whereby the reactor operates at a low temperature. A temperature reduced to 255 °C to 200 °C and saved utility decreased tail gas [5]. Researchers worked on the sulfur recovery Claus process to enhance the sulfur recovery level from the natural refinery [6]. They worked on the reaction mechanism occurring in sulfur recovery units, the reaction between H2S, SO2, and CO2, and side reactions, such as hydrolysis of COS and CS2, and sulfation of catalyst [7,8,9]. A simulation was performed on MATLAB in which all physical conditions and chemical characteristics were considered. The amount of sulfur entering the first bed was assumed to be 0.1 kmol/h and the amount of Sulfur present in the furnace was also assumed [10,11]. In 2015 a researcher, Nabikandi, worked on simulation of the Claus process with the kinetic and equilibrium method, and kinetic model can predict the composition, temperature, and pressure of the reactor. The reactions mechanism of this Claus process is complex rather than other processes. The modification of the Claus process to increase sulfur recovery by reduced cost is also reported in the literature [12,13]. This modification is a combination of oxygen enrichment and recycled streams. In 2016, Gupta has indicated a comparative kinetic model that can capture the consumption chemistry of H2S gas and its along with sulfur impurities. It can be improved by changing the chemistry of chemical reactions. In 2016, Mahdipoor worked on the effect of impurities such as mercaptan on the Claus process. The author has built a reaction mechanism of sour gas by using CFD simulation of the furnace reactor and sulfur recovery process [14]. Several studies focused on the integration and simulation of Aspen Plus. The sensitivity of different processes was studied [15,16,17].
Analysis and thermal efficiency were attained at 45% and corresponding CO2 and SOx emissions were 698 kg/MWh and 0.15 g/MWh. The optimum analysis of gasification cycles was according to pinch analysis [18]. In 2018, the new design of the Claus process, in which H2S absorber is desorbed, and SO2 absorption, the Claus reaction, separation, and recycling in which H2S and flue gas are absorbed in MDEA. The absorbent of MDEA and sodium citrate are regenerated to reduce the cost of a process [19,20]. In 2018, the solid package of Aspen Plus was used for simulation and optimization of the Claus reactor. Variation in the change in temperature and pressure to observe the H2S conversion into sulfur. Furthermore, to observe H2S conversion and sulfur production, Aspen Plus model results calculated and compared the design data [21].
Another study focused on improving the performance of sulfur recovery by using an Aspen Hysys modified three-stage simulation model to study the behavior of sulfur recovery and consider a based case. The performance of the base case is 93.89%. In base case optimization, controlling air demand percent and adjusting the sulfur dew point margin. This margin changes Claus’s performance to 98.60% [22]. The effectiveness of each Claus component would depend on this Claus unit’s reactor stages. The two reactors must remove sulfur from sour gas capable of 90–96%, or Method Three must perform the same from sour gas capable of 95–98%. The clause process is unable to recover a 100% entered sulfur. Therefore, the total sulfur is not possible to remove from sour gases [23]. Aspen Plus takes advantage of exact fashions intended for prediction belonging to the practice performance through the proper group thermodynamic fashions and assumes an excellent design and style from a process [24,25]. These data may be provided in the iterative type to improve the design. Several studies have been reported on the increased efficiency of sulfur recovery by using numerical analysis [26]. Researchers worked on simulation and optimization of pure oxygen processes in which pure oxygen is used instead of air. It has increased the efficiency of sulfur recovery substantially [27,28]. In recent years, it has been published that the use of a catalyst increases the production efficiency. In these studies, several mechanisms have been used to multi-objective optimization of chemical reaction conditions based on a kinetic model. In multi-objective optimization, the objective function is based on the kinetic model of chemical reactions. The NSGA-II algorithm is applied on multi-objective optimization to optimize this parameter. The purpose of modeling any process is to obtain the optimal point of the process. Any optimal reaction condition is based on the kinetic model of the reactions [29]. In 2021, Anna Dell discussed the feasibility study of acid gases and economic analysis of the process [30].
In general, prior work is limited to process modeling and simulation of the Claus process. Studies on pinch and cost analysis are lacking in the literature. The main objective of this study is process modeling and simulation of the Claus process by using the Aspen Plus simulator to remove sulfur from H2S gas. The second objective is to optimize the Claus process by using parametric and topological methods. The third objective is to use pinch analysis for the Claus process. Finally, the fourth objective is to perform an economic analysis of the Claus process. Several questions regarding pinch analysis remain to be addressed in the literature. This paper investigates several questions related to pinch and cost analysis of the Claus process. This study can be considered a significant step forward in the process modeling and simulation of the Claus process. The proposed method provides a substantial increase in sulfur recovery compared to the methods available in the literature.
2. Process Methodology
In this Claus process flow diagram, three inlet streams are entering into the process. In the first inlet stream, the temperature is 32 °C and the pressure is 10 bars. In the first stream, pure oxygen gas enters the process at 90 kmol/h, and some unwanted ammonia is also entering the process at 4.7 kmol/h. The second inlet stream enters the process at a temperature of 120 °C and the pressure is 2.4 bar. The flow rate of H2S is 23.9 kmol/h, a flow rate of CO2 is 16.9 kmol/h, a flow rate of CO is 2.1 kmol/h, a flow rate of H2 is 10.2 kmol/h, and final ammonia flow rate is 31.6 kmol/h. In the third inlet stream, the temperature is 50 °C and the pressure is 2.1 bars. The flow rate of H2S gas is 159.1 kmol/h, CO2 is 174.1 kmol/h, and N2 flow rate is 31.3 kmol/h. These three streams enter the flame zone section of the furnace. At the flame zone, there are two primary combustion reactions taking place.
H2S + 3/2 O2 → SO2 + H2O
NH3 + ¾ O2 → ½ N2 + 3/2 H2O
These highly exothermic reactions increase the temperature substantially. Several side reactions take place. The side reaction destroys any ammonia not combusted in Reaction (2).
H2S ⇌ ½ SO2 +H2
CO2 + H2 ⇌ CO +H2O
NH3 + ¾ SO2 ⇌ ½ N2 +3/2 H2O + 3/8 S2
The flame zone temperature is 345 °C, and its pressure is 1.2 bars at anoxic section. S2 is formed, sulfur is condensed in the condenser, and a separator separates the sulfur. Thus, in the first furnace section, 16.2 kmol/h sulfur is produced. After sulfur production, two heat exchangers are installed to decrease the temperature of the sulfur product to 195 °C, and pressure is 1.6 bars. After the separator is installed, the unreacted H2S gas is further reheated and moved toward the reactor. In this reactor, the reaction is taking place. After the anoxic section, S2 is formed, sulfur is condensed in the condenser, and a separator separates the sulfur. Thus, in the first furnace section, 16.2 kmol/h sulfur is produced. After sulfur production, two heat exchangers are installed to decrease the temperature of the sulfur product to 195 °C and pressure is 1.6 bars. After the separator is installed, the unreacted H2S gas is further reheated and moved toward the reactor. In this reactor, the reaction is taking place.
After the reactor, sulfur is formed. The feed is moved toward the separator. Sulfur is separated from the bottom and other un-reacted H2S gas is moved toward the second reactor the same reaction is taking place.
After the 2-reactor, feed is moved toward the separator and other sulfur is separated through the separator. Sulfur is a separator from the bottom and unreacted gases moved from the top of the separator.
2.1. First Stage Reaction
Figure 1 shows that hydrogen sulfide gas is reacted with oxygen at high temperatures and pressure to form sulfur dioxide and water. In the second phase, the ammonia gases containing impurities and contaminants are reacted with oxygen to form nitrogen and water.
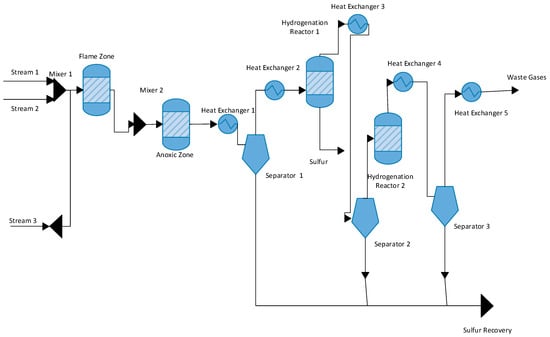
Figure 1.
Block Flow diagram of the Claus process.
2.2. Second Stage Reaction
The second phase reactions consist of four different reactions taking place in the reactor. First, the hydrogen sulfide, sulfur dioxide, and hydrogen react to form sulfur and water. The second reaction is an equilibrium reaction in which hydrogen sulfide gas is converted into sulfur and hydrogen. In the third phase reaction, the CO2 and hydrogen react to form carbon monoxide and water. Finally, in the fourth phase reaction, ammonia and sulfur dioxide react to form nitrogen, water, and sulfur.
Di-sulfur is converted into octal-sulfur at the same pressure and exact temperature in these equilibrium phase reactions. In the second stage, hydrogen sulfide gas is reacted with SO2 to form octal-sulfur and water.
S2 ⇌ ¼ S8
H2S + 1/2 SO2 ⇌ 3/16 S8 +H2O
There is a flame zone in the Claus process in which plug flow reactors are used. Different reactions take place in the plug flow reactor. There is an exothermic reaction that takes place in the reaction furnace. Furnace reactions cause some technical problems. Due to increased reaction, the formation of ammonia gas causes corrosion in the chemical equipment. Now, the objective is to minimize the production of ammonia gas in furnace reaction because ammonia has decreased the performance of the Claus process. The exhaust gases of the furnace are sulfur dioxide gas (SO2) and nitrogen gas (N2), and its outlet temperature is 345 °C and 1.8 bars pressure. After the furnace reaction, these gases are cooled with waste heat boiler (WHB).
There are two catalytic reactors used in the Claus process. The two catalysts, titanium and alumina, increase the reaction rate in a plug flow reactor. In the first reactor, the reaction occurs at 330 °C, and the pressure is 10 bars. In the first reactor, the conversion of H2S gas into sulfur is about 70%. In the first reaction, the catalyst is installed in a different layer. In the second reactor, the H2S gas conversion to sulfur is about 92%. In the second reactor, the reaction occurs at 234 °C temperature and the pressure is 8 bars. At the final stage, the reaction conversion is 92%.
Table 1 shows the inlet composition of gas feed. Ten gases are entered into the feed composition for the sulfur recovery unit. In addition, three inlet feeds enter at the same time for chemical reactions. The oxygen flow rate is 90 kmol/h in the first stream and zero in the second and third streams. Finally, in the third stream, H2S gas is entered into the reactor.

Table 1.
Inlet composition of feed for three different inlet streams.
2.3. Reactions Kinetic of Claus Process
The modeling of a flame reactor consists of two zones, including the oxygen richer zone in which exothermic reactions occur. The second reactor is slower and endothermic reactions take place.
The rate equations are:
where i is the equation number.
Whereas ri is kmol/s/m3, pi is atm and Koi unit varies depending upon temperature and pressure.
The rate of reaction is:
Whereas ri is kmol/s/m3 and pi is pressure in atm and Ci are kmol/m3.
In the reactor, there are two different catalysts used in each reactor. In the first reactor, alumina is used, and, in the second reactor, titanium catalysts are used. In addition, there are highly exothermic reactions in the reactor, where the coolant is used to control the reactor’s temperature. Otherwise, catalyst deactivation takes place and sulfur deposits on the catalyst.
The values used in Equations (9)–(15) are given in Table 2.
Table 2.
Reaction kinetic values of the Claus process.
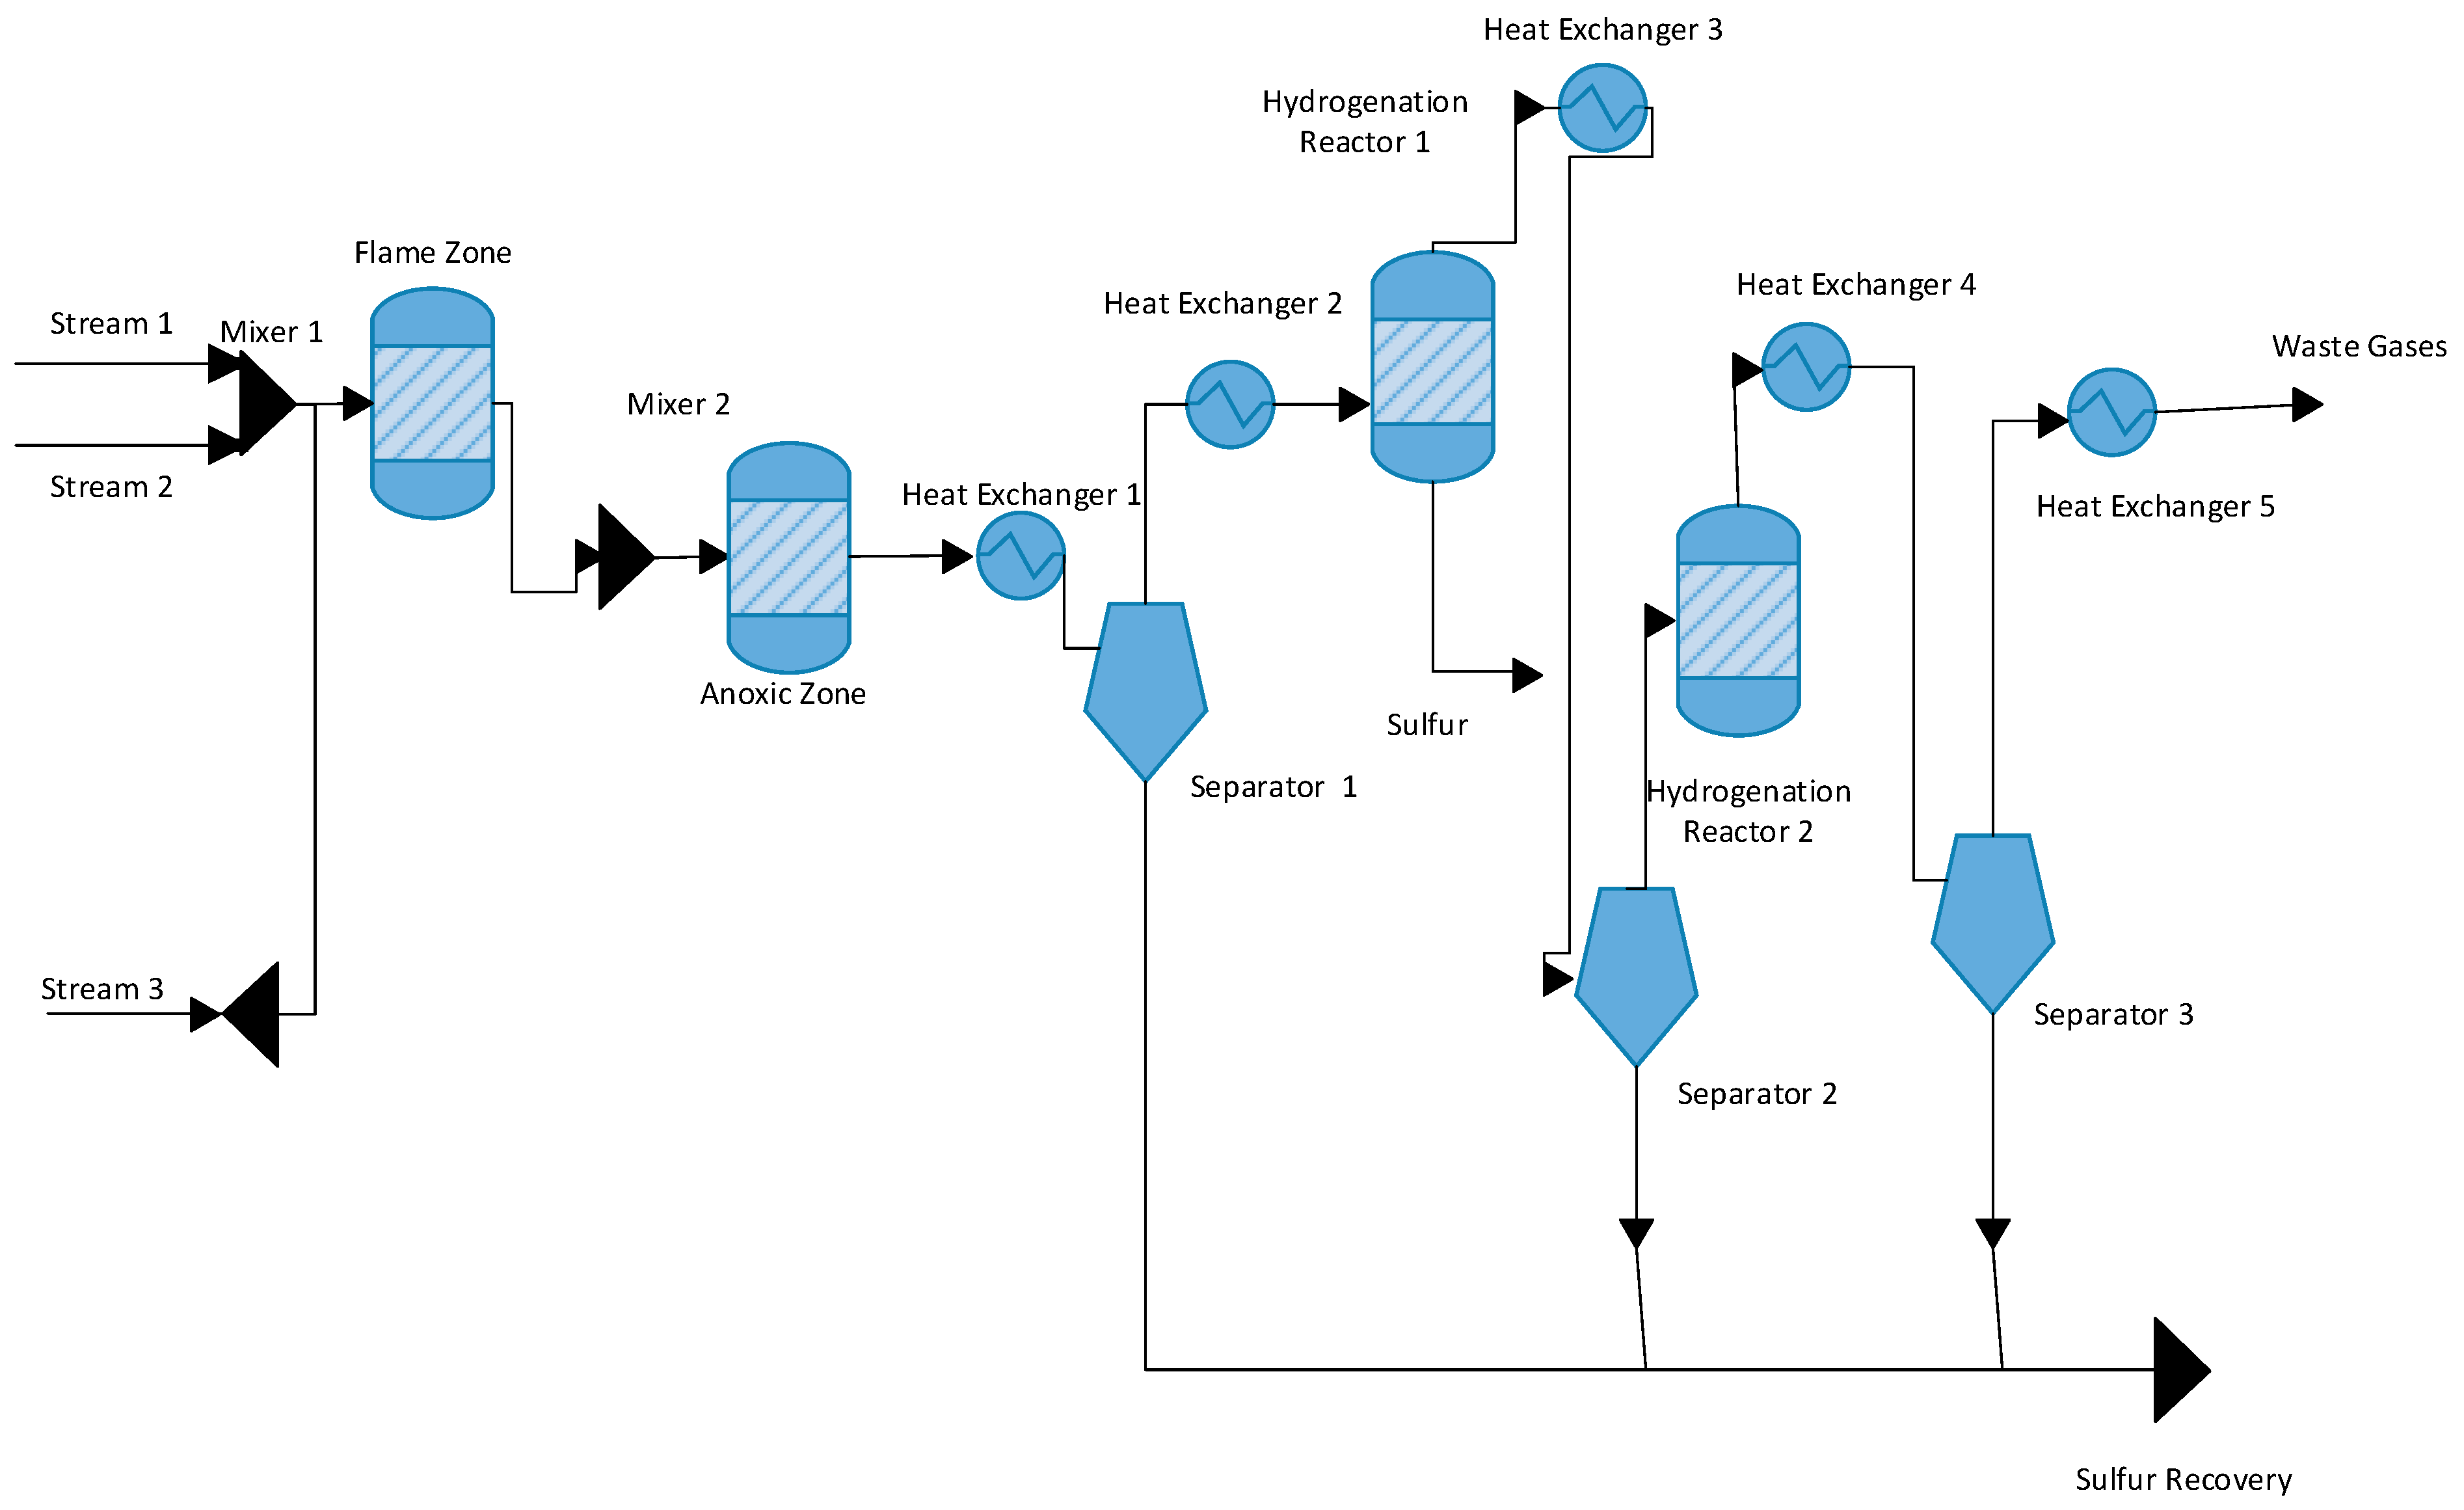
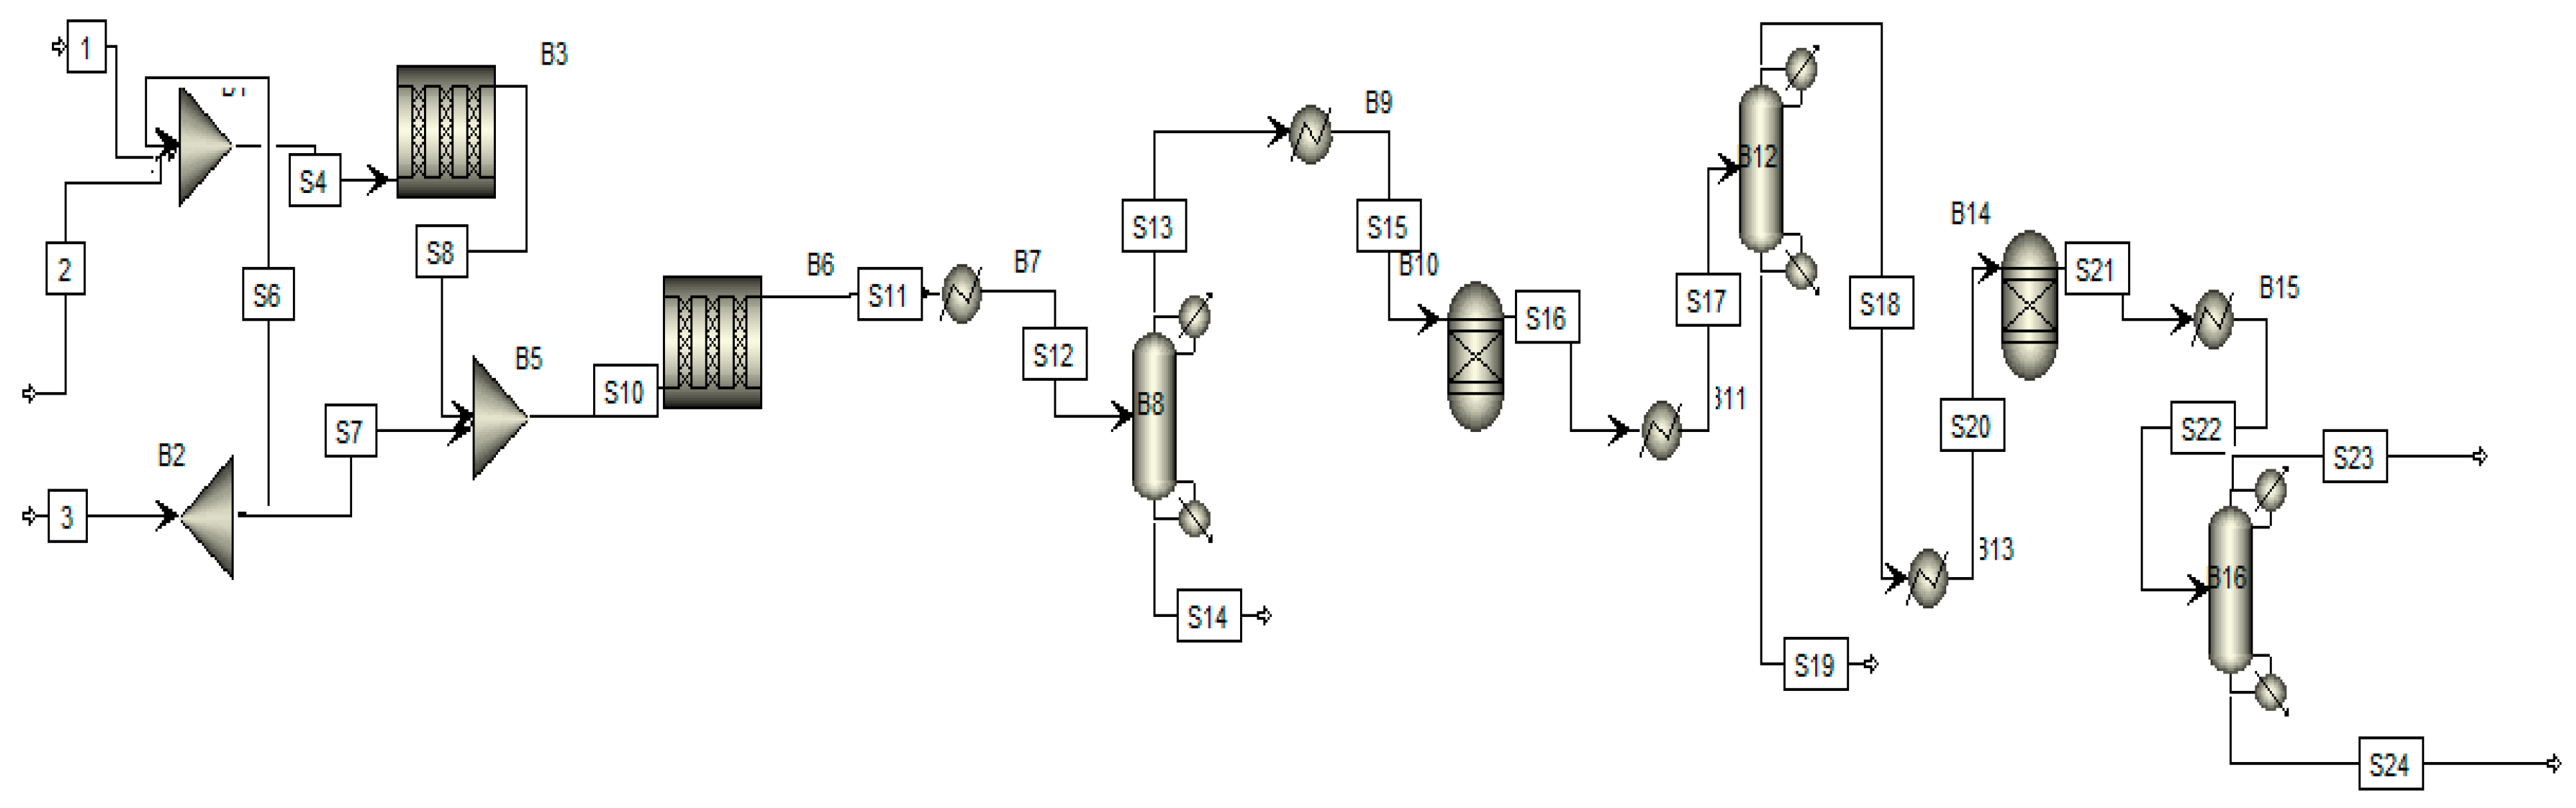
Figure 2 shows the process flow diagram of the Claus process in which sulfur recovered varies from this unit. Feed is entering into the process in three inlets. The first and second streams are mixed in a mixer and they enter the flame zone. The third stream is entering into an anoxic section for chemical reaction. After the flaming zone, some sulfur is formed that is separated at the bottom of the separator. The other unreacted gases moving toward the heat exchanger again increased the temperature at 314 °C after the heat exchanger. It is moved toward the hydrogenation reactor, in which reaction occurs at 314 °C at 1.6 atm. After passing through the hydrogenation reaction, about 10.5 kmol/h of sulfur is formed. These sulfurs are extracted separately at the bottom of the separator. After that, more unreacted gases are further moved toward another hydrogenation reactor. The reaction takes place at the same temperature and pressure, at 315 °C and 1.6 atm, respectively. After the second reactor, more sulfur is formed at a flow rate of 10.5 kmol/h. After that, all the sulfur streams are mixed at the mixer to reach the final flow rate of 25.805 kmol/h.
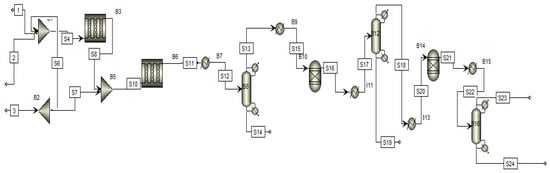
Figure 2.
Process flow diagram of the Claus process.
3. Results and Discussion
3.1. Sensitivity Analysis
This parametric optimization deals with the operating variables of chemical plants, such as temperature, concentration, and the pressure of chemical equipment. The parameter is selected based on the process’s nature. The critical parameters of this process are a temperature of a reactor, pressure of reaction, the composition of inlet feed, diameter, and length of the furnace. In this parametric analysis, the result shows that changing the parameter causes a significant effect on the efficiency of a chemical plant. There are four different types of parametric optimization. First, in the plug flow reactor, diameter is changed from 10 inches to 70 inches. Second, the length and diameter of the furnace are changed from 35 inches and 30 inches to 50 inches and 55 inches, respectively. Third, the oxygen flow rate changes from 90 lb/h to 170 lb/h to optimize the process. Finally, the temperature of the reactor has increased from 280 °C to 370 °C.
3.2. Effect of Changing Furnace Diameter and Length
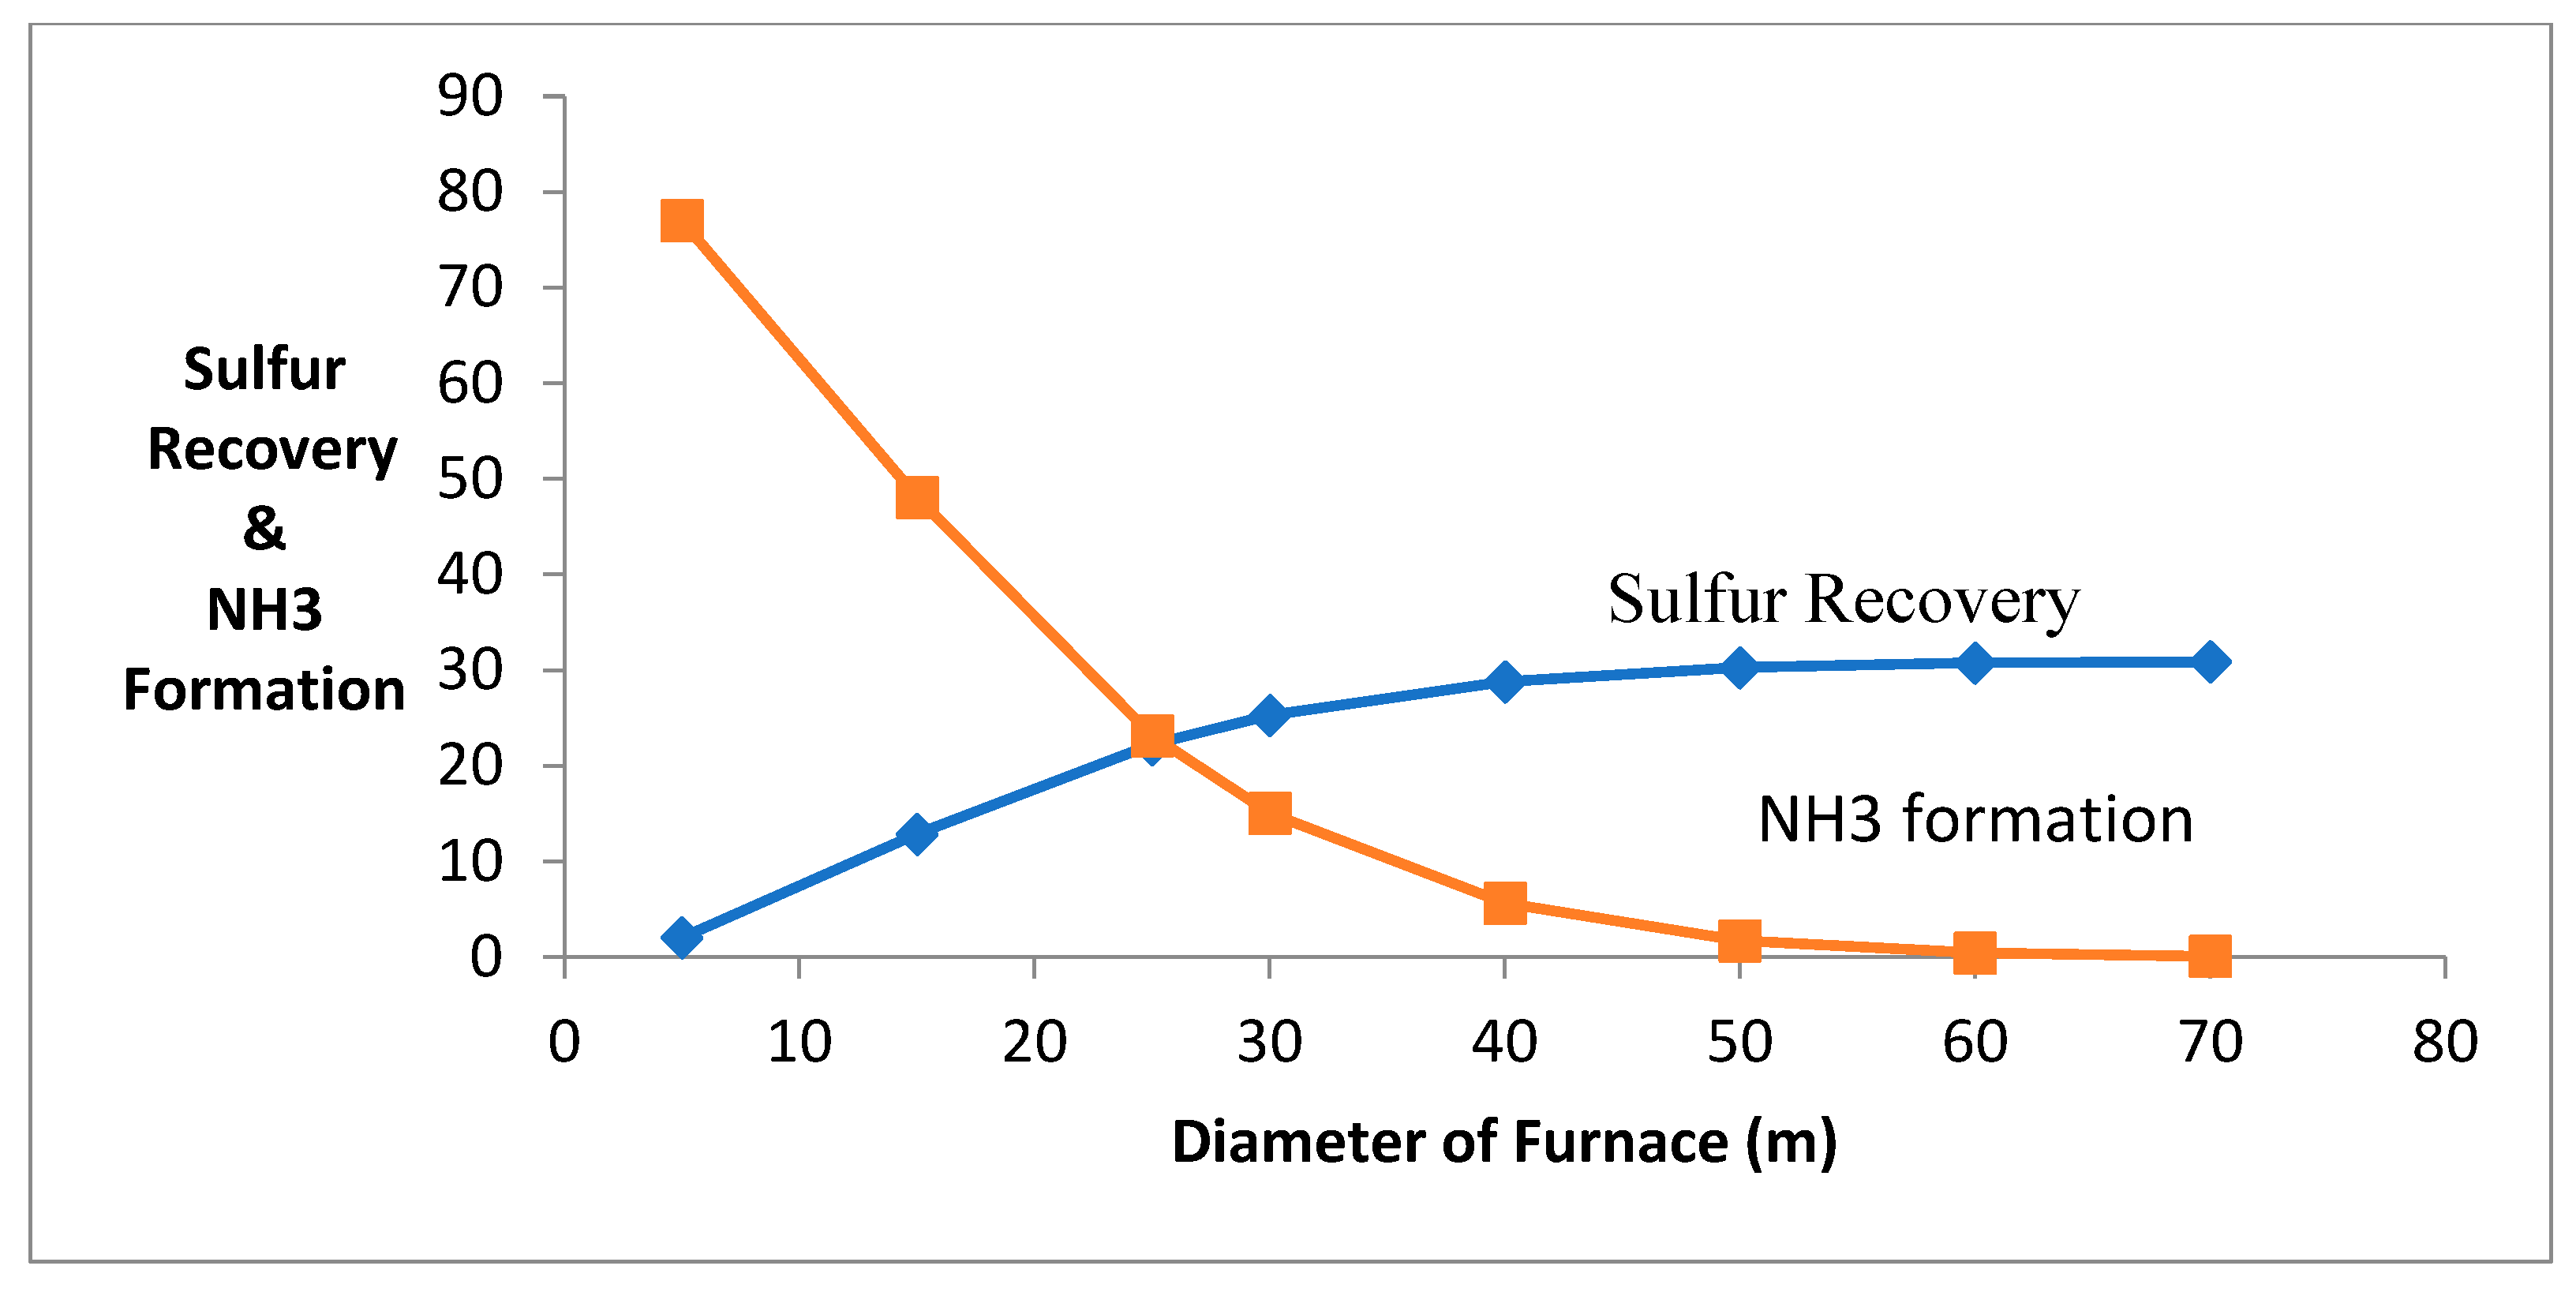
When the length of the reactor is increased, it causes an increase in residence time of the process and has the destruction of ammonia production in a furnace (using t = V/V0, t = residence time, V = volume of furnace, V0 = flowrate of the gases). The deactivation of catalyst causes ammonia containment, and it is causes corrosion on the chemical equipment. Figure 3 shows that when the reactor’s length increases, the ammonia production decreases, and the production of sulfur increases. The destruction of ammonia is decreasing due to the conversion of NO and N2 along the length.
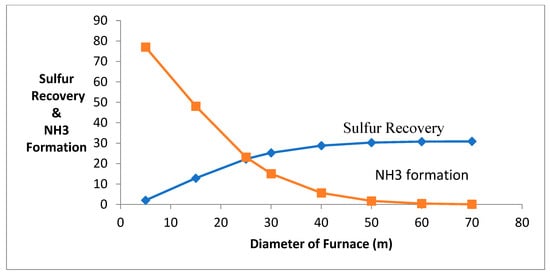
Figure 3.
Effect of change in furnace diameter and length.
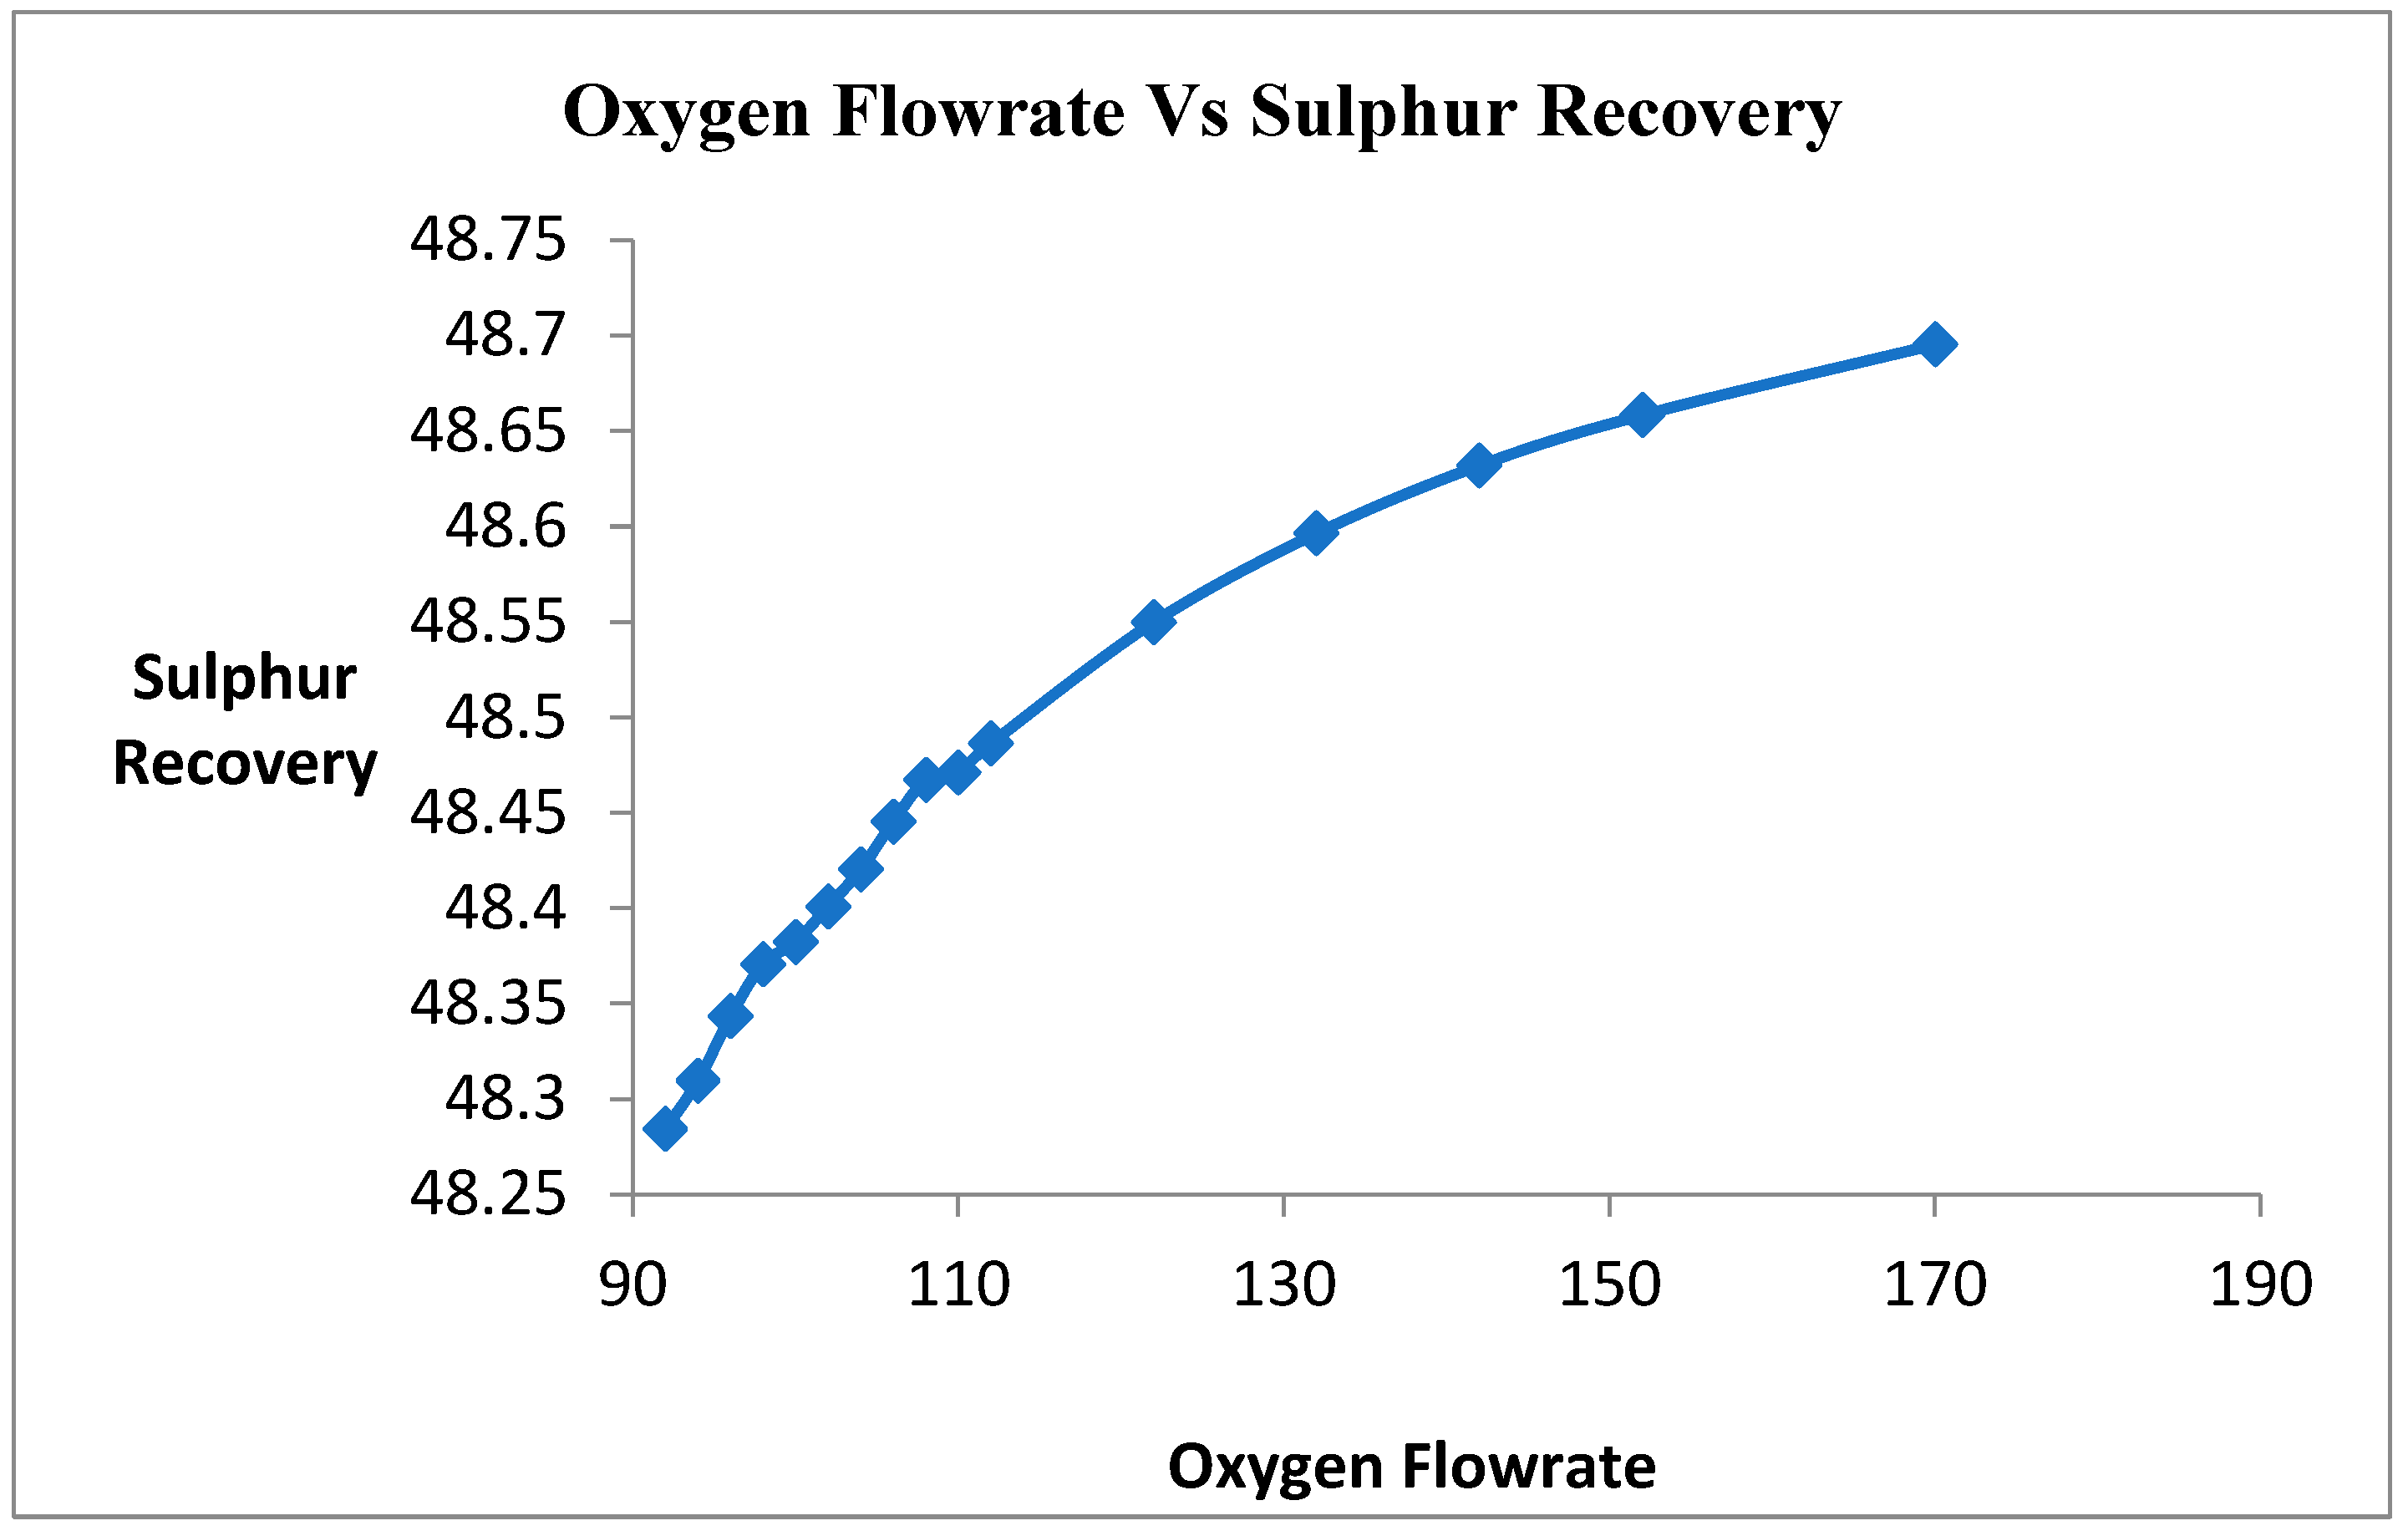
3.3. Effect of Increasing Oxygen Flow Rate on Sulfur Recovery
Oxygen is a limiting reactant of this Claus process. Therefore, the goal is to maximize the consumption of H2S gas into elemental sulfur in this process. In this primary reaction of the Claus process, hydrosulfide gas is reacted with oxygen to form water and sulfur. Therefore, the oxygen flow rate varied for the maximum consumption of H2S gas into sulfur. The target was 0% unreacted H2S gas coming out from the product. Figure 4 shows that when the oxygen flow rate increases, the conversion of H2S gas into sulfur increases. When the flow rate of oxygen is increasing, the unreacted H2S is increasing. The oxygen is a limiting reactant, providing the oxygen in excess amounts.
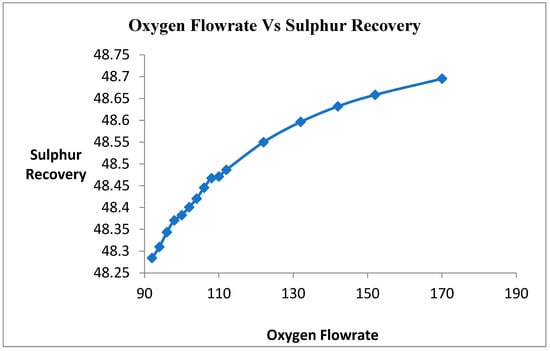
Figure 4.
Effect of Oxygen on sulfur Recovery.
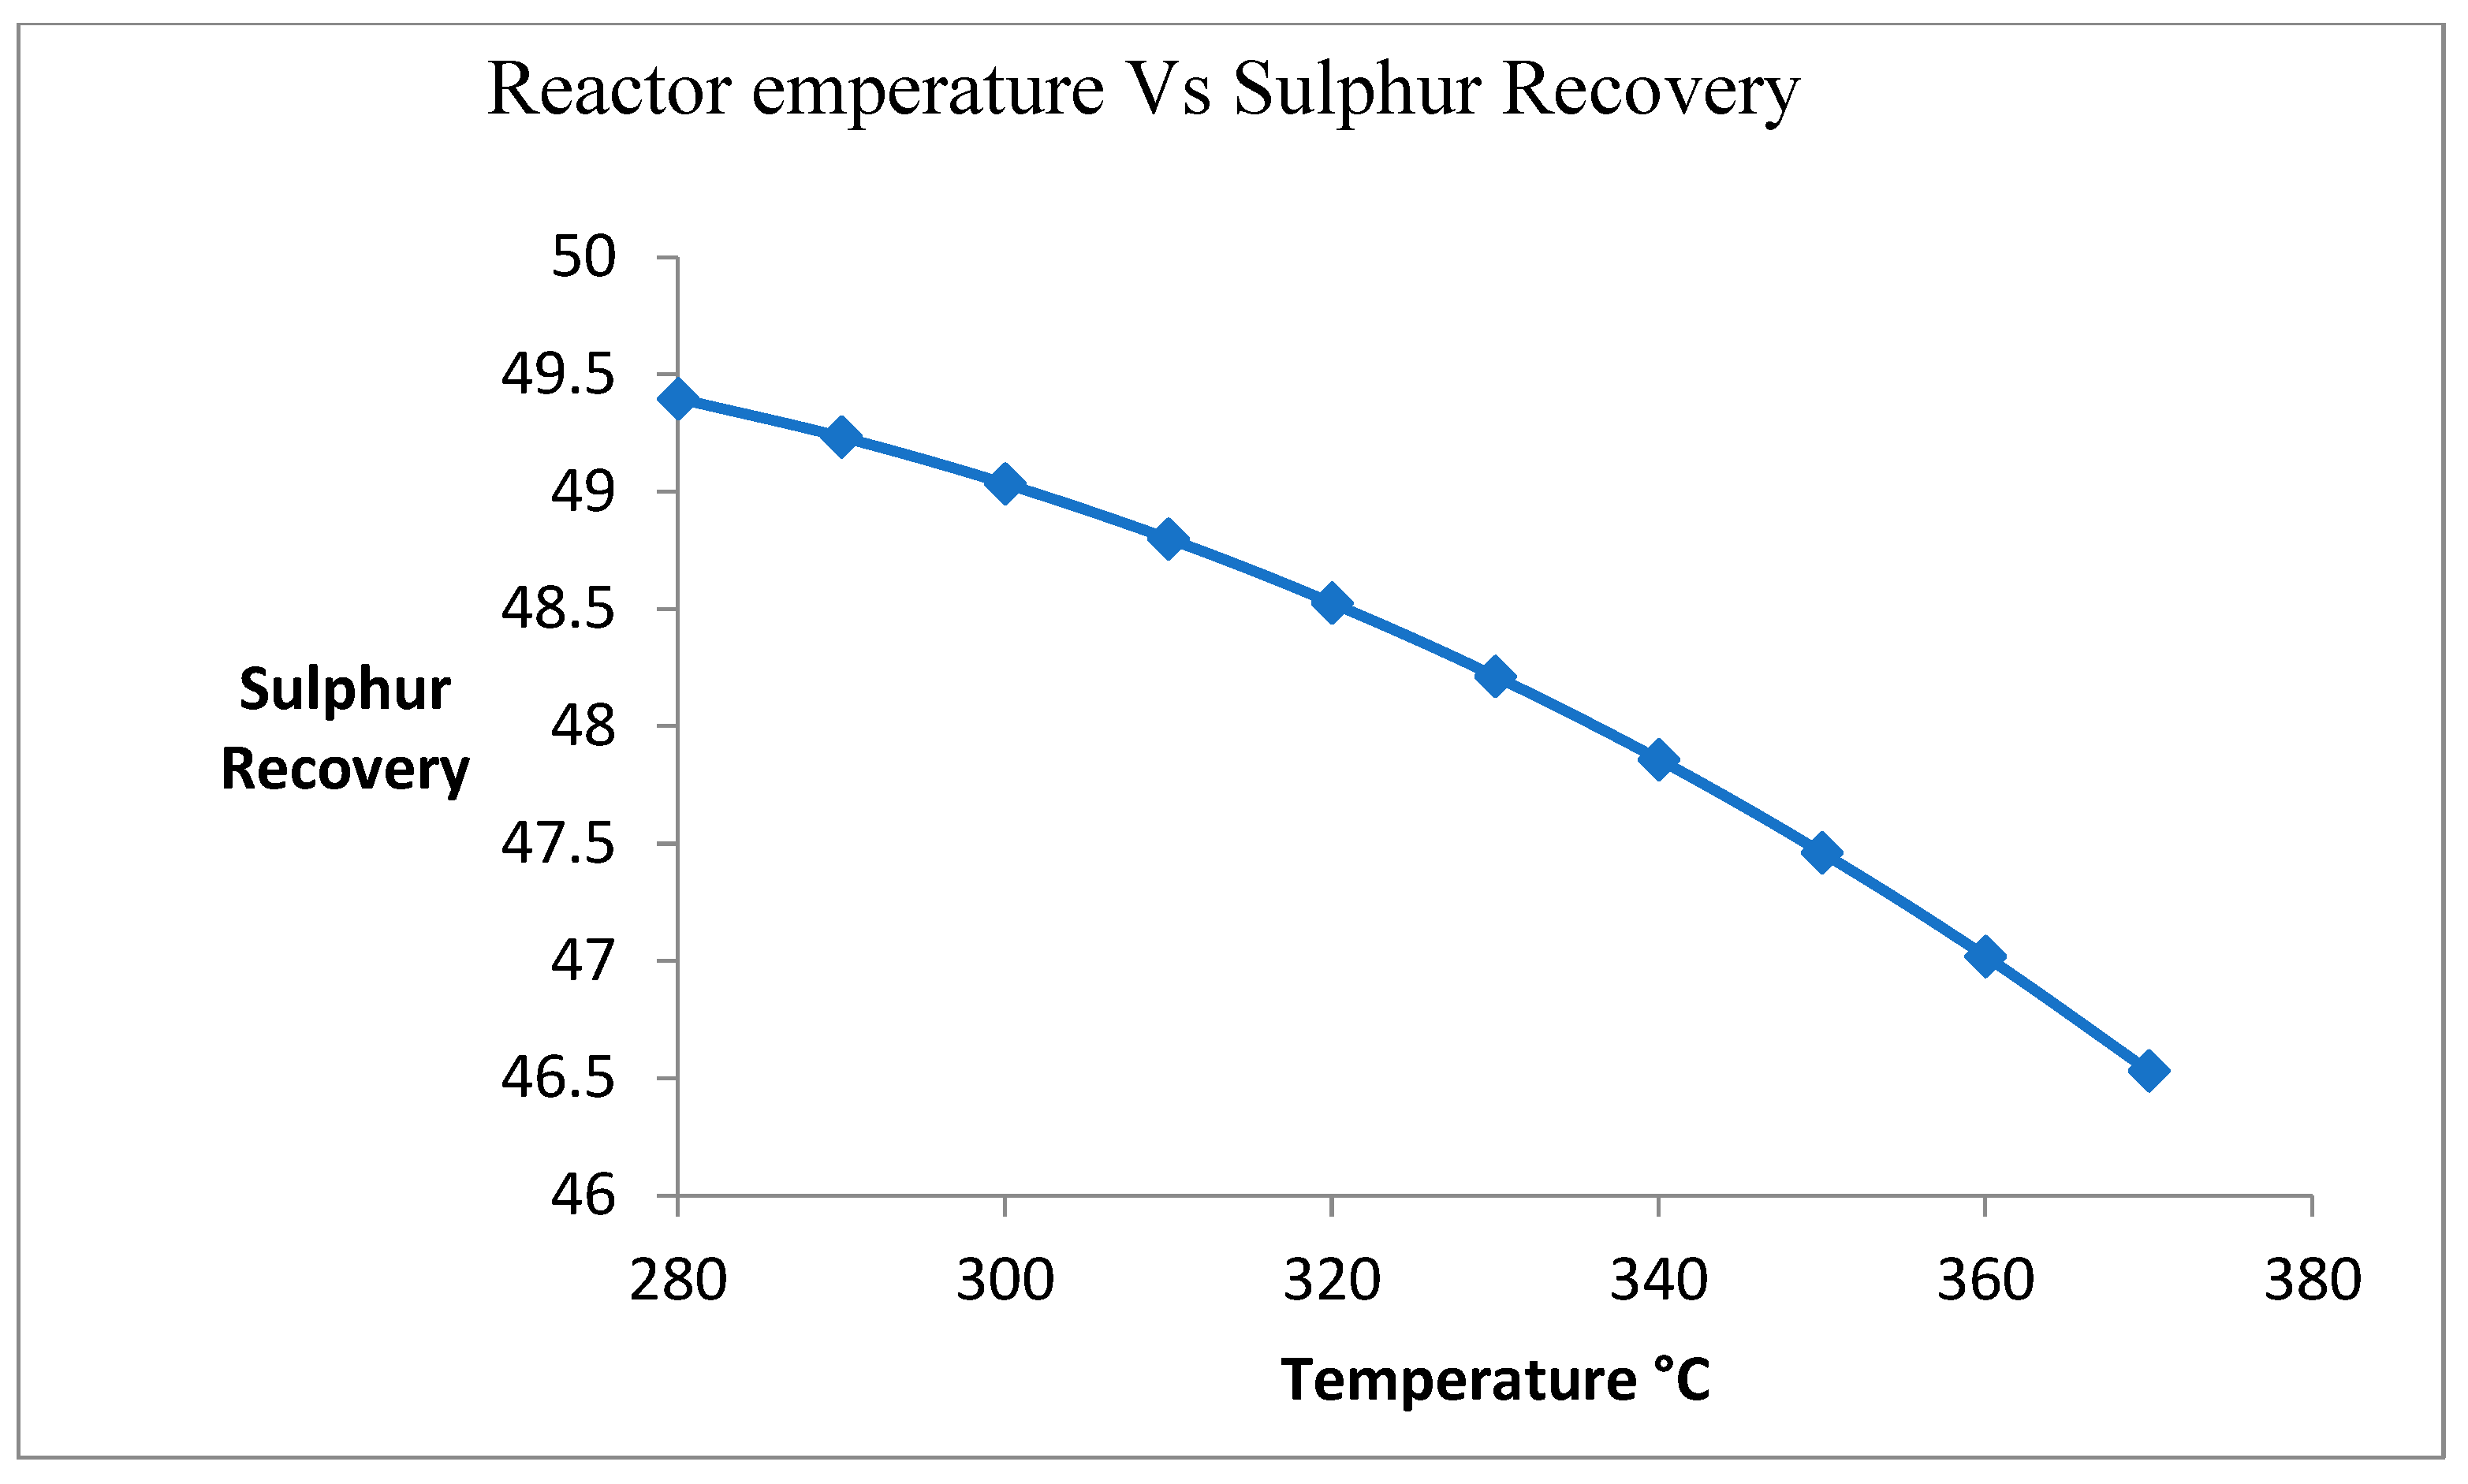
3.4. Effect of Changing Temperature on Sulfur Recovery
Figure 5 shows the effect of temperature on the sulfur recovery process. Due to the exothermic reaction, the temperature of the reactor is increased. Due to an increase in temperature, the deactivation of catalysts is increased. It is caused by the reduction in the sulfur recovery unit.
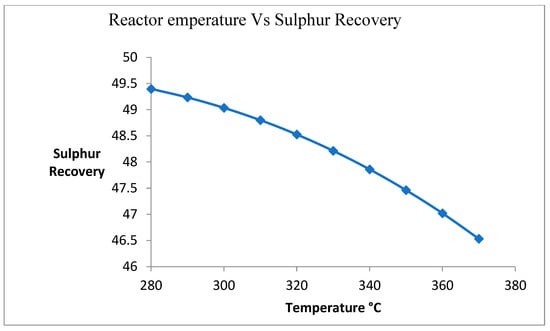
Figure 5.
Effect of change in temperature on sulfur recovery.
3.5. Pinch Analysis
Pinch analysis is a method for minimizing the energy consumption of the chemical process industry. There is maximum utilization of internal utilization and minimum consumption of external utilization. The heat exchanger size is changed, and the area of the heat exchanger is also increased.
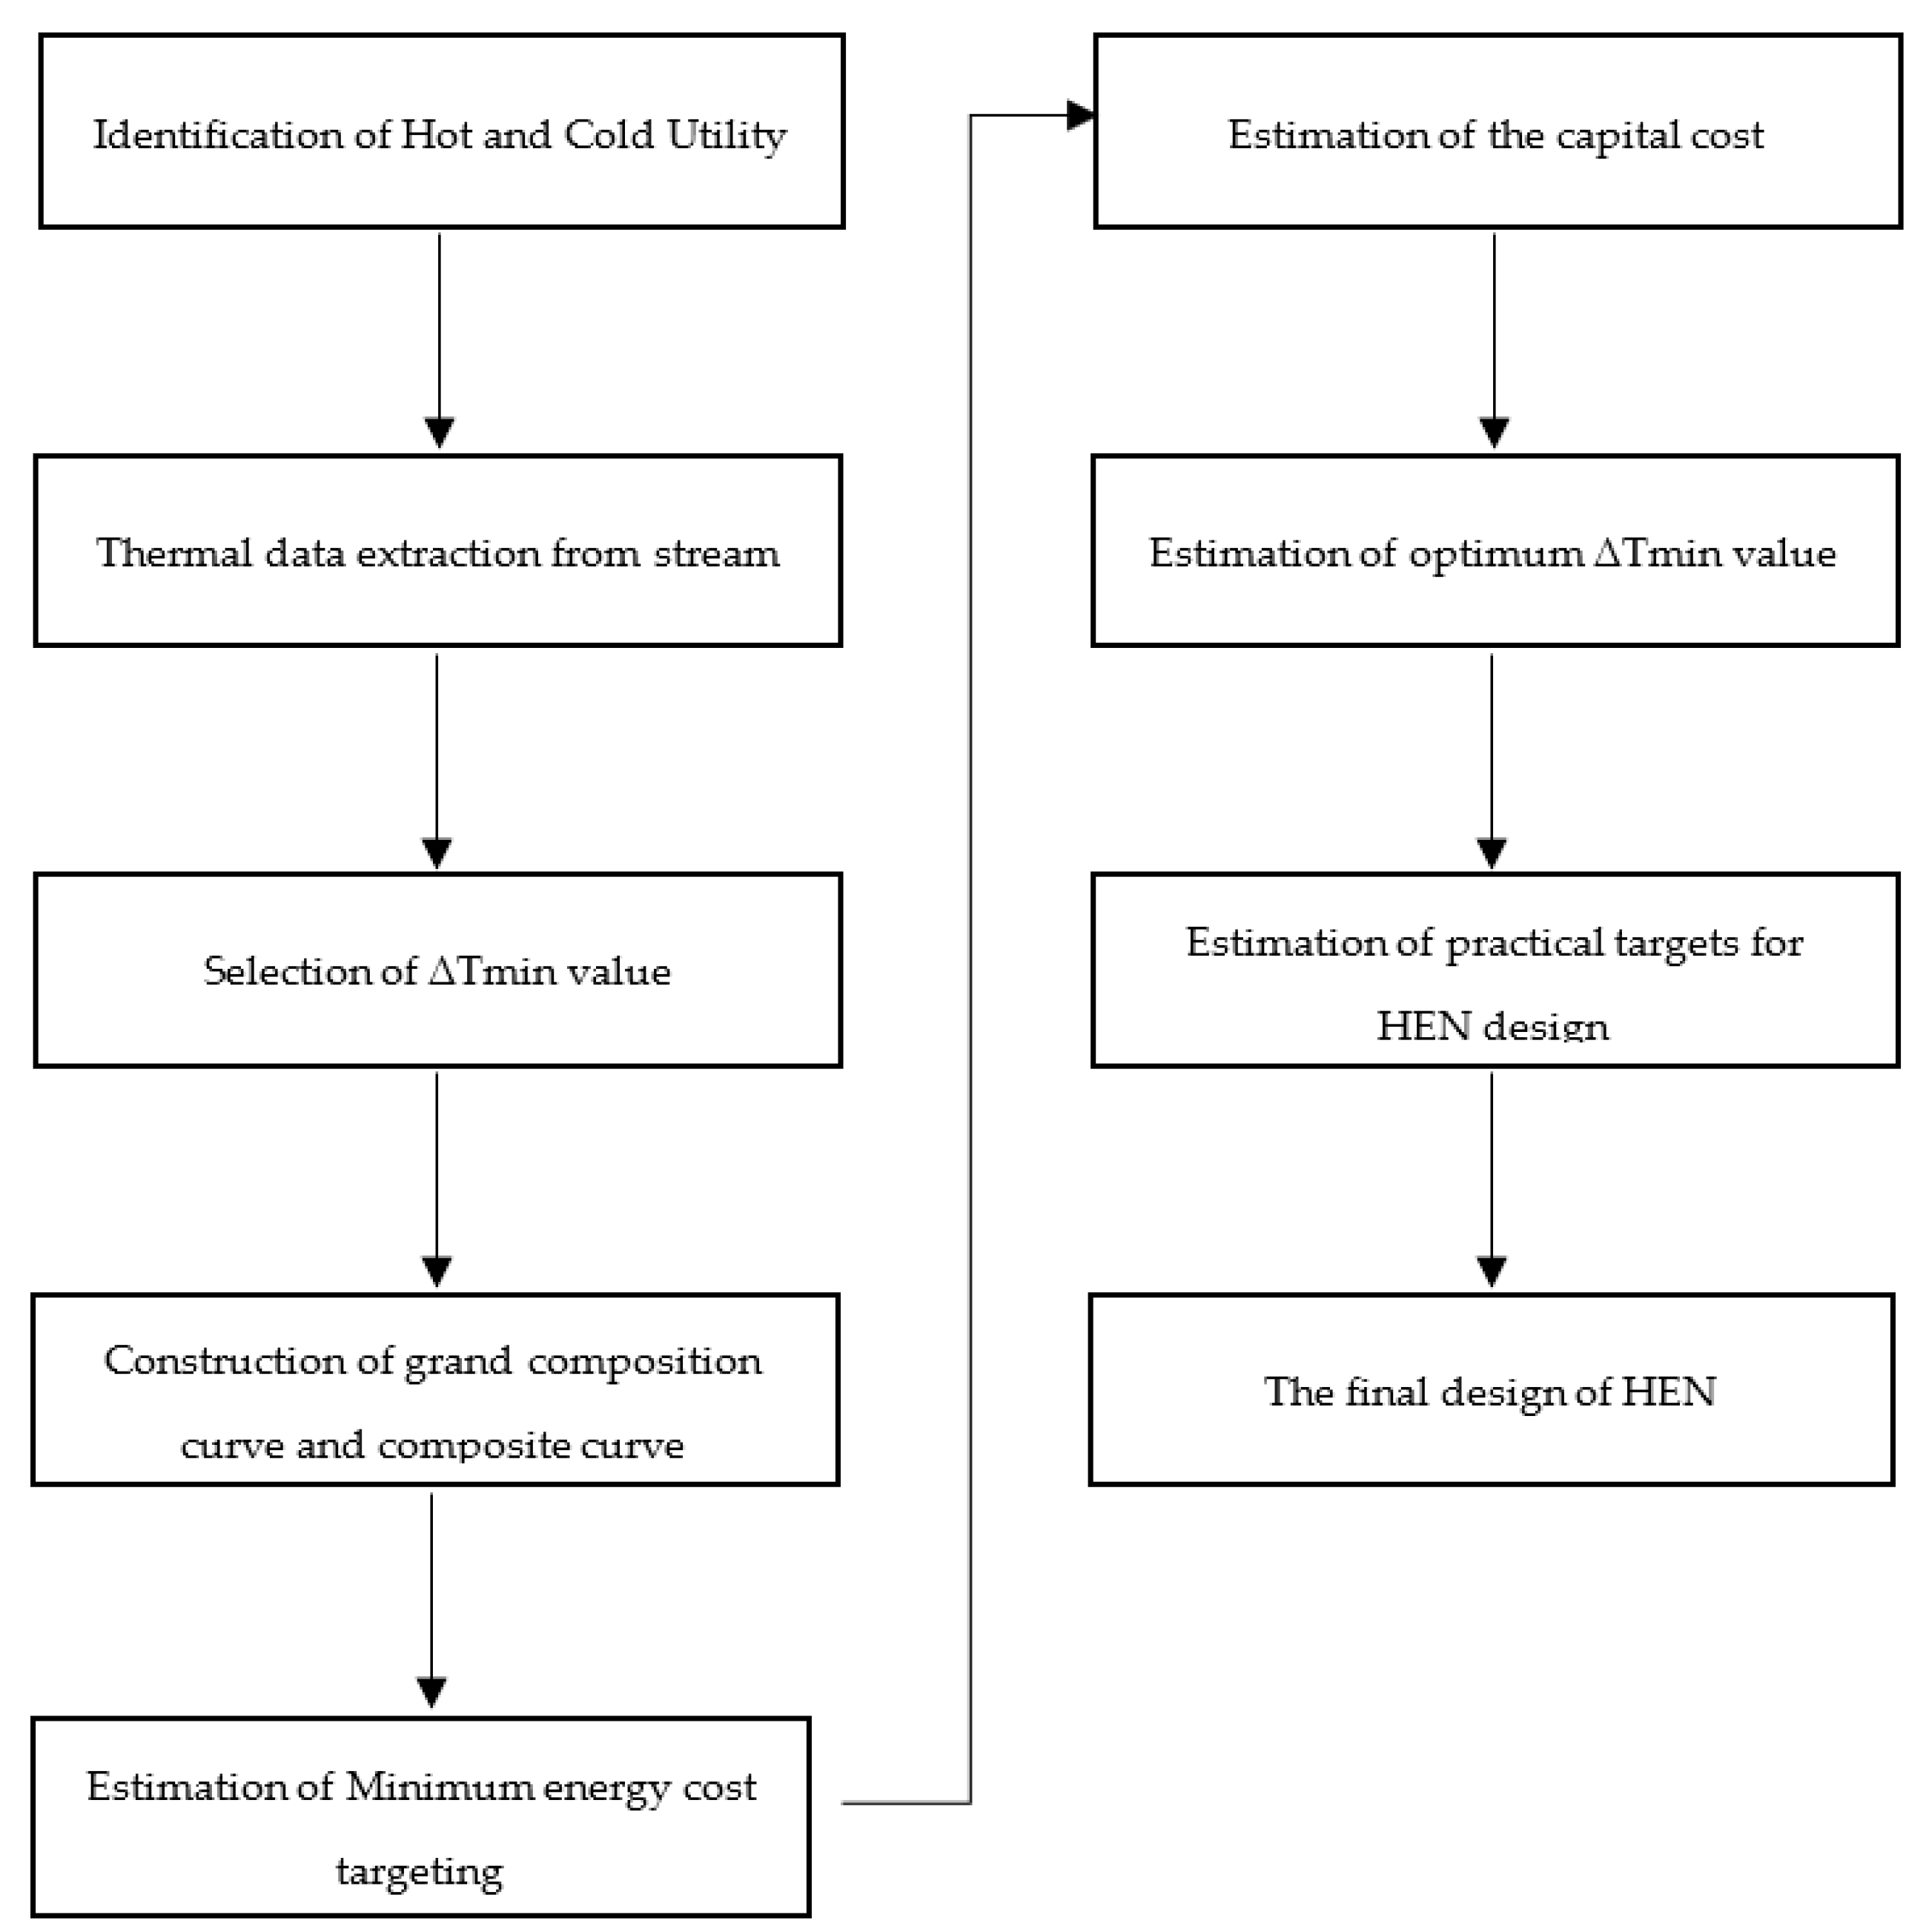
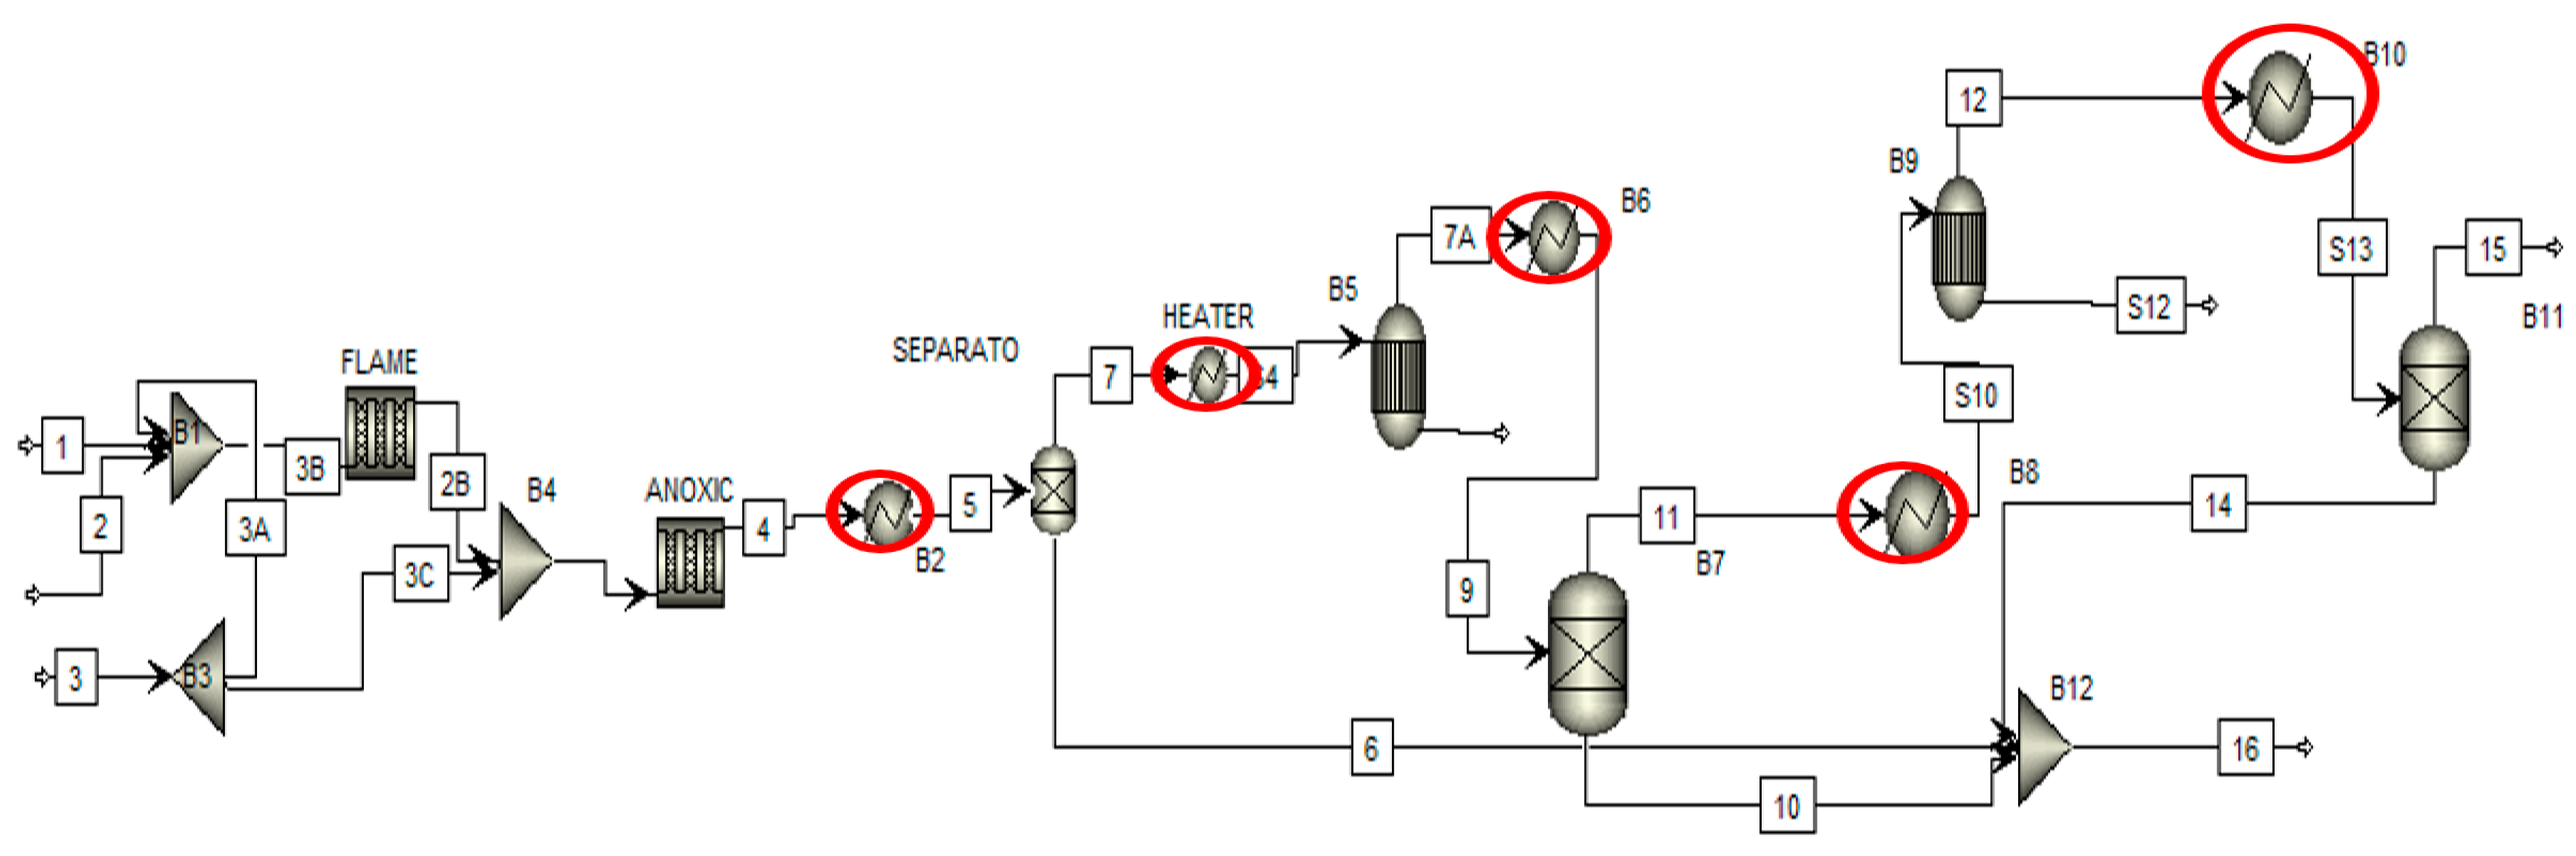
Figure 6 shows the nine pinch analysis steps followed to perform the pinch analysis of the chemical process industry. The first step is identifying cold and cold utilities to find the number of hot and cold streams. In the second step of each stream’s thermal data extraction, we can find the heat duty of cold and hot streams. In the third step, the selection of ∆Tmin value of the process streams in which minimum heat transfers between the two process streams. The fourth step is the construction of the grand composite curve and composite curve. It tells us about the available energy in process streams and how much energy is recovered from them. The fifth step is to estimate the energy cost of the overall chemical plant and how much cost is required to pinch analysis all over the chemical plant. The sixth step is estimating the capital cost of a heat exchanger and the utility cost of an overall chemical plant. The seventh step is used to find the optimum minimum temperature value of the chemical plant. The eighth step is to estimate the heat exchanger network design of the overall chemical plant. Finally, the ninth step is the final design of the heat exchanger network, in which we can find the optimum design of the heat exchanger and the efficient design of the heat exchanger. Figure 7 shows the process flow diagram of the sulfur recovery unit in pinch analysis on the chemical process industry. Pinch analysis is performed on five heat exchangers of the sulfur recovery unit shown in the red circle. The purpose of pinch analysis is to maximize internal utilities’ utilization and minimize the consumption of external utilities. Therefore, a heat exchanger is used in pinch analysis for maximum utilization of internal utilities.
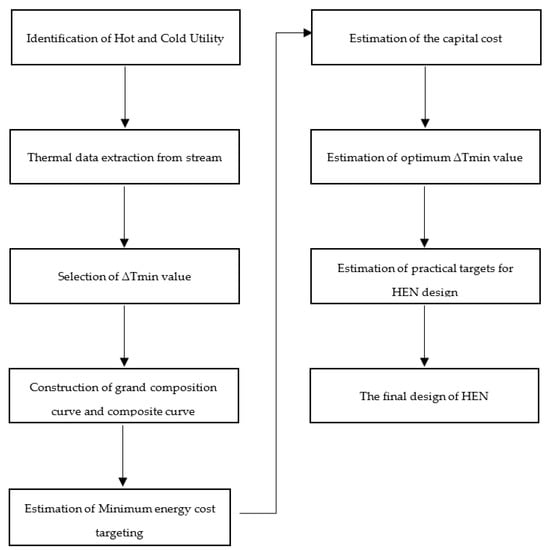
Figure 6.
Steps of pinch analysis.

Figure 7.
Pinch analysis process diagram.
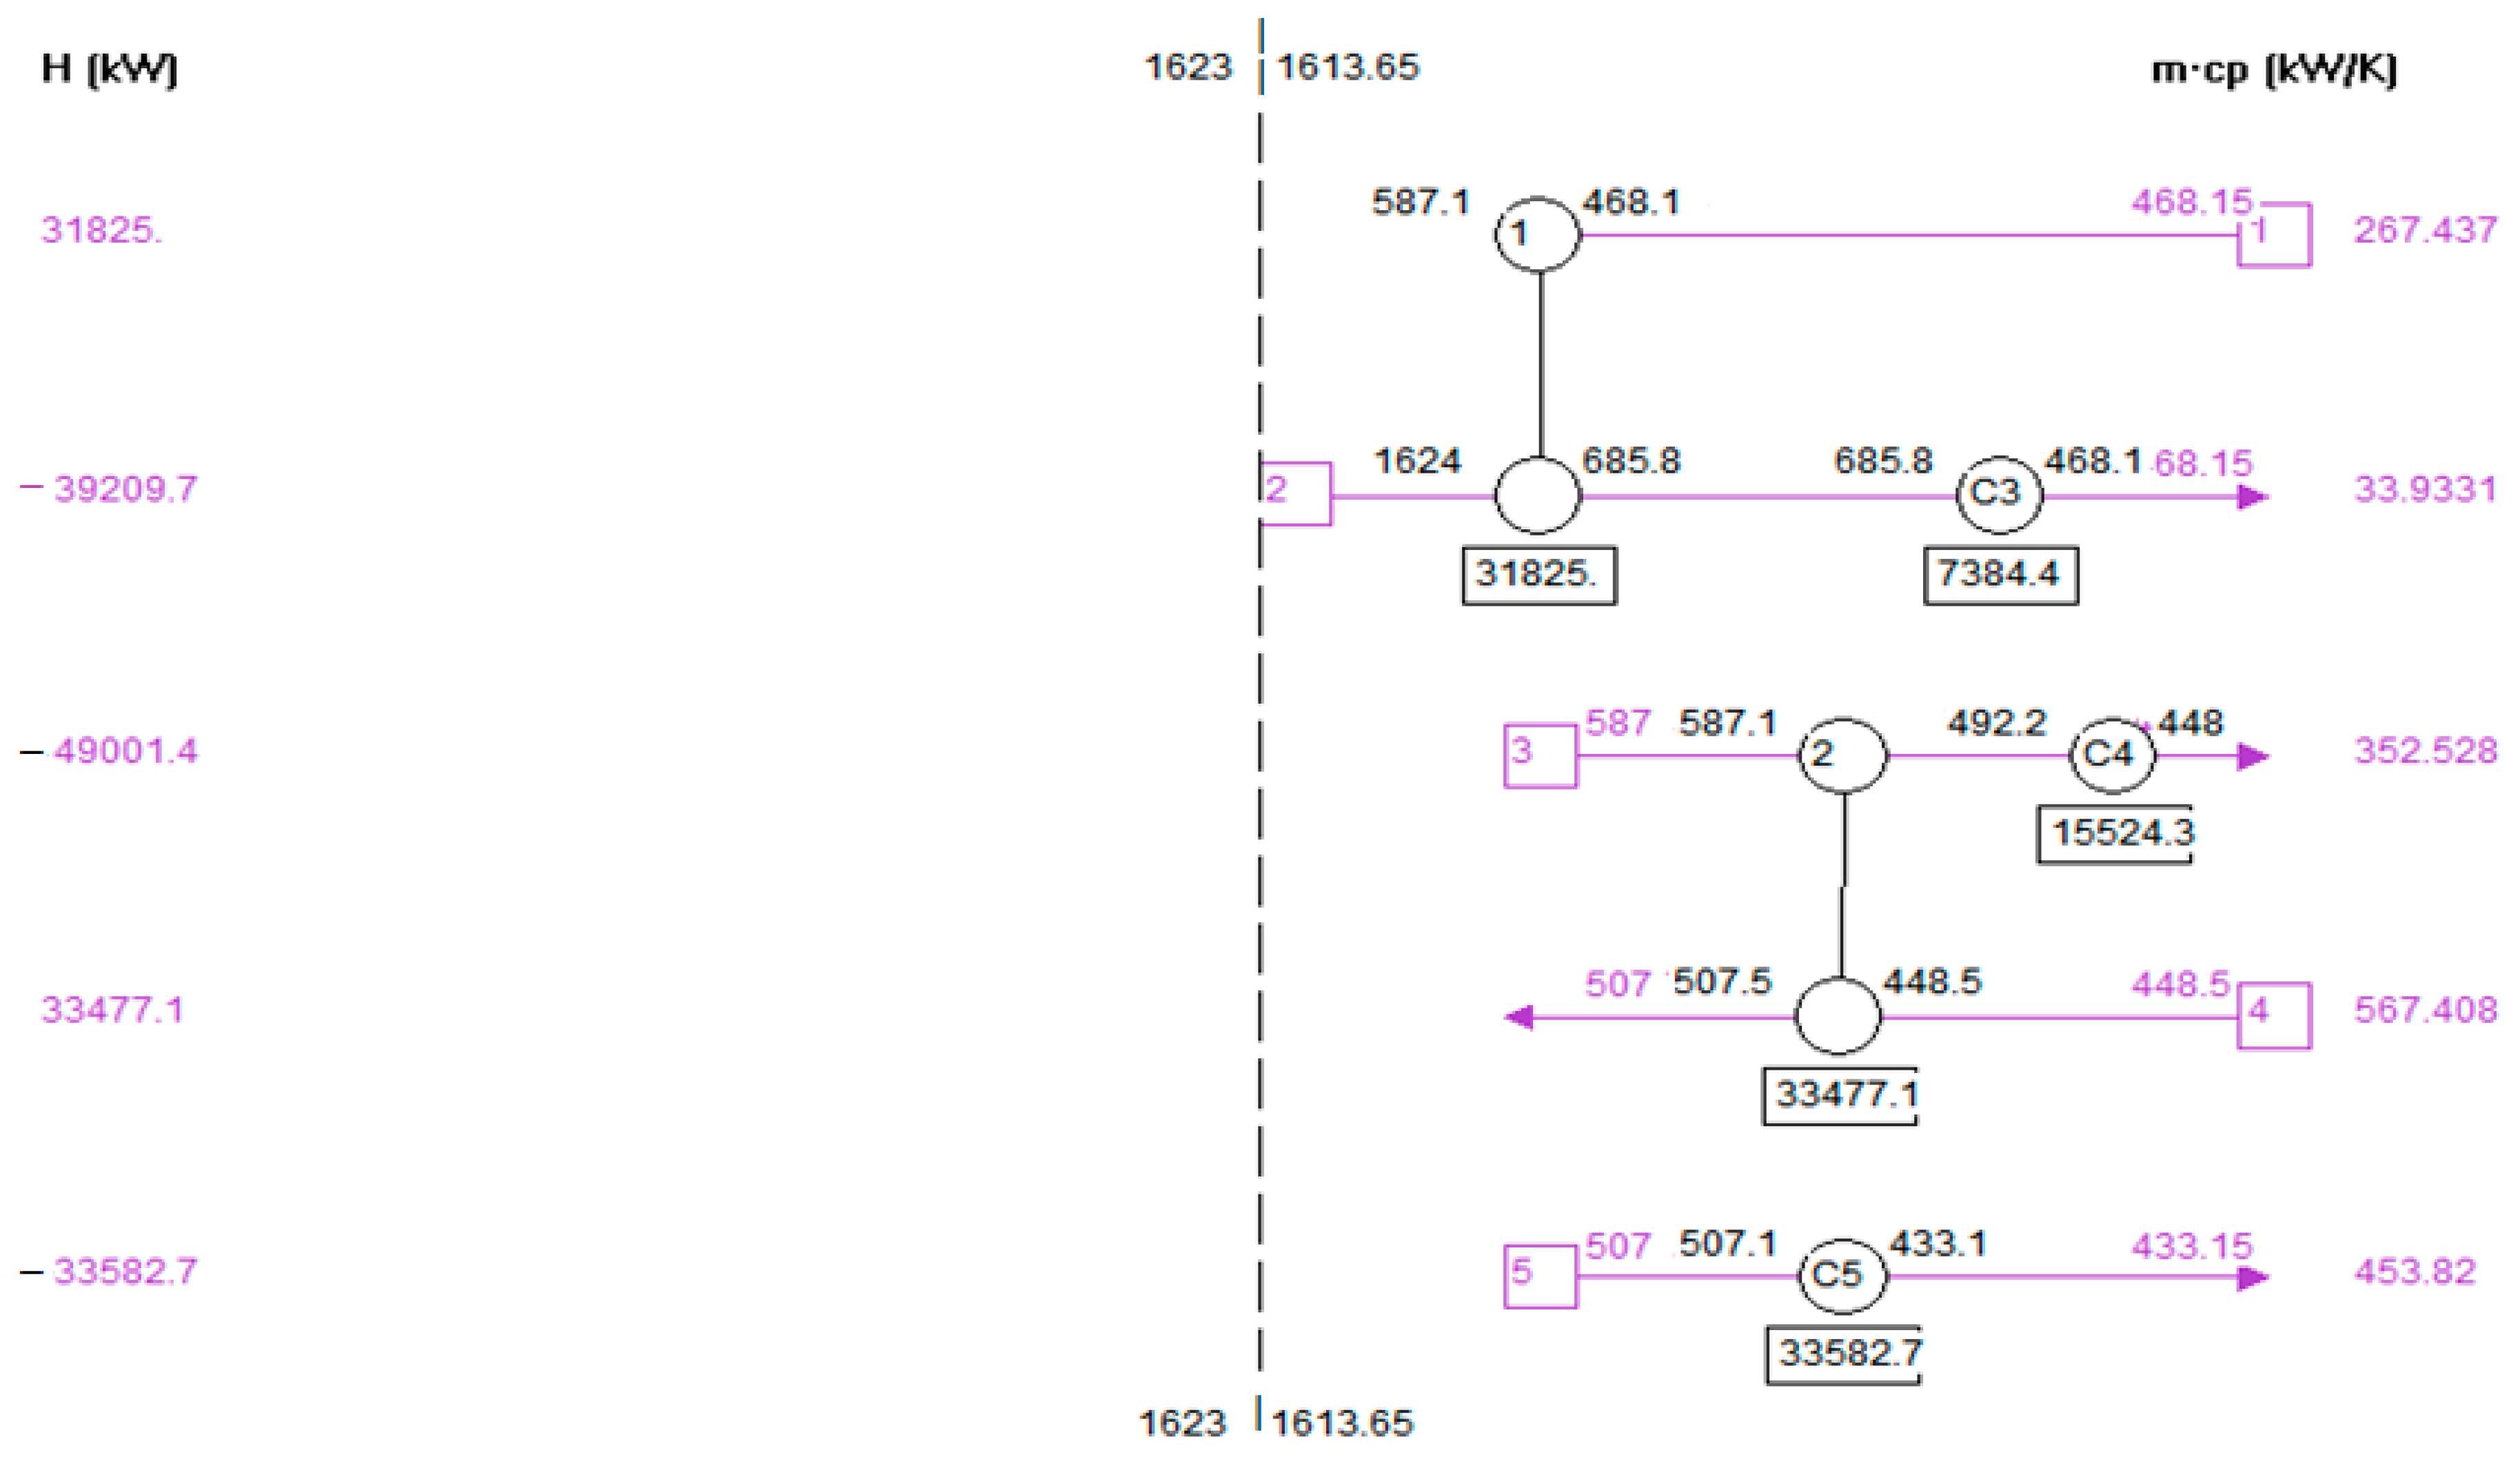
Figure 8 shows the optimum heat exchanger network of the heat exchanger. There are seven heat exchangers used, which are used to process heat exchangers. The total number of areas is 5666 m2; the total heating utilities are used at 4.12 × 10⁵ kj/h. The total cooling utilities are used 3.6 × 10⁷ kj/h. These diagrams show the sizes of a heat exchanger and the heat duty of each heat exchanger. The blue line shows the cold streams, and the red line shows the hot streams. The heat exchanger is shown in circles.
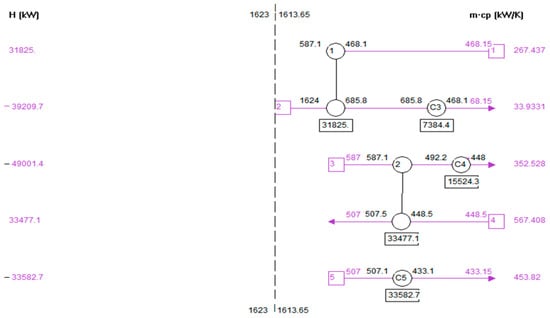
Figure 8.
Heat exchanger network (HEN) design of heat exchanger.
Table 3 shows the number of heat exchangers that are used for pinch analysis. The first column shows the name of heat exchangers, and the third column shows the types of heat exchangers, such as a heater or cooler. The fourth column shows the heat duty of the heat exchanger in (cal/s). The next column shows the inlet temperature and outlet temperature of hot utility and cold utility.
Table 3.
Pinch Analysis temperature interval result by using Aspen Plus.
Table 4 shows the pinch analysis result and temperature interval. It shows a detailed study of a heat exchanger. The first column shows the name of the heat exchanger. The second column shows the heat exchanger’s feather-like working principle. The fourth column shows the heat duty of the heat exchanger, the fifth column shows the recoverable duty, and the other table shows the inlet and outlet temperature of hot and cold utilities.
Table 4.
Pinch analysis and temperature interval result.
Table 5 shows the energy saving and utility saving during the pinch analysis of the Claus process. The table is divided into three categories; first is energy, greenhouse, and energy cost saving. In the first energy section, the total hot utilities are 5.13 × 10⁵. The hot target utilities are 2.73 × 10⁴ cal/s. The potential saving energy by pinch analysis is approximately 4.865 × 10⁵ cal/s. The energy cost saving is 229,578 USD/yr by using pinch analysis. By using the pinch analysis, an energy cost saving is about 93.73%.
Table 5.
Utilities cost and energy saving by pinch analysis with the help of Aspen Plus.
In Table 6, the first graph shows total utilities, the second shows heating utilities, the third shows cooling utilities, and the fourth shows carbon utilities. The actual total utilities are 3.41 × 10⁶ cal/s and the target utilities are 2.4373 × 10⁶ cal/s. The actual energy saving is 28.53%. The actual heating utilities are 5.13 × 10⁵ cal/s, the target is 2.73 × 10⁶ cal/s, and the actual saving is 94.68%. The actual cooling utilities are 2.8 × 10⁶ (cal/s), the target is 2.4 × 10⁶ cal/s, and the actual saving is 16.80%.
Table 6.
Total utilities, heating utilities, cooling utilities, and carbon emission.
Table 7 shows carbon emissions into the atmosphere. The total hot utilities and cold utilities are emitted carbon compounds into the atmosphere. There is zero emission of carbon to the atmosphere by hot and cold utilities.
Table 7.
Carbon Emission Details.
Table 8 shows the mechanical design of the heat exchanger. Theses parameter of mechanical design plays a vital role in checking the physical stability of heat exchanger to have a safe design without any failure.
Table 8.
Mechanical Design of Heat Exchangers.
Table 9 shows the name of equipment used in a process flow diagram, the cost, and area of equipment. The type of equipment used in the process flow diagram, the material of construction of equipment, and pressure at the tube side and shell side are also shown.
Table 9.
Equipment summary of the Claus process.
Table 10 shows the total model cost, grass root cost, utility cost, and actual usage cost of each piece of equipment. For example, in the heat exchanger, cooling and heating medium are used, and natural gas is used as a heating source in the furnace. Therefore, the grass-root cost of a heat exchanger, utility cost, efficiency, actual usages, and annual cost utilities are also shown.
Table 10.
Utility summary of the Claus process.
Table 11 shows the material name and its classification. This table shows the price in dollars (year 2020) and the flow rate of each component. It is also described the annual cost of raw material and product cost.
Table 11.
Material of construction cost summary.
Table 12 describes the result of the heat exchanger and heating utility after the pinch analysis. This result shows that, after the pinch analysis, the size of the heat exchanger increases, and the utility consumption decreases.
Table 12.
Cost analysis of the Claus process after pinch analysis.
Table 13 shows the revenue from the sale, raw material cost, utilities, and final profit. After the pinch analysis and parametric optimization, it takes 2.2 million USD per year. Furthermore, by comparing both tables after optimization and optimization, a difference of 2.2 million USD per year is observed.
Table 13.
Cost comparison before and after optimization of the Claus process.
Table 14 shows the comparison between post-optimization of process and pre-optimization of a chemical process. Before optimizing the process, the direct, indirect, and utility costs are increased compared to the post-optimization column. However, after pinch analysis and parametric optimization, the production efficiency of sulfur recovery increased.
Table 14.
Summary of economic parameters, advantages, and disadvantages of processes for H2S gas conversion.
Table 15 shows the comparison between the production result obtained from the simulation of the Claus process and literature data. This table shows that the sulfur recovery increased by 18% in the proposed simulation.
Table 15.
Production results compared with the literature.
4. Conclusions
This study focused on the three objectives related to the Claus process: process modeling simulation, optimization, and cost analysis of the Claus process. Aspen Plus software was used for process modeling and simulation of the process. After the Claus process modeling, the result was compared with the literature result. It is shown that sulfur recovery increased by 18%. The second objective was optimization; two types of optimizations were used. The first was parametric optimization and the second was topological optimization. A parametric optimization was used for operating parameters and design parameters to increase the production of sulfur.
Furthermore, topological optimization was used to deal with the size and amount of equipment. Pinch analysis has changed the size of equipment to maximize the utilization of heating and cooling utilities. The pinch analysis on the sulfur recovery unit reduced the operating cost of a heat exchanger to 28.53%. The third objective was a cost analysis of the Claus process. It has shown that, after optimization, profit can be improved by more than 2.5% by process modeling simulation, changing operating conditions, design parameters, and pinch analysis on the Claus process.
Author Contributions
M.A. proposed the main idea and methodology; M.A.Z. performed the analysis and wrote the manuscript; I.A. and M.N.A.K. provided key suggestions and improved the manuscript. All authors have read and agreed to the published version of the manuscript.
Funding
This research received no external funding.
Institutional Review Board Statement
Not applicable.
Informed Consent Statement
Not applicable.
Data Availability Statement
Not applicable.
Conflicts of Interest
The authors declare that the research was conducted in the absence of any commercial or financial relationships that could be construed as a potential conflict of interest.
References
- Maclean, D.I.; Wagner, H.G. The structure of the reaction zones of ammonia-oxygen and hydrazine-decomposition flames. Symp. Int. Combust. 1967, 11, 871–878. [Google Scholar] [CrossRef]
- Vandooren, J. Comparison of the experimental structure of an ammonia seeded rich-hydrogen-oxygen-argon flame with the calculated ones along several reaction mechanisms. Combust. Sci. Technol. 1992, 84, 335–344. [Google Scholar] [CrossRef]
- Glarborg, P.; Kubel, D.; Dam-Johansen, K.; Chiang, H.M.; Bozzelli, J.W. Impact of SO2 and NO on CO oxidation under post-flame conditions. Int. J. Chem. Kinet. 1996, 28, 773–790. [Google Scholar] [CrossRef]
- Clark, P.; Dowling, N.; Huang, M. Ammonia destruction in the Claus furnace. In Proceedings of the Name of the Brimstone 1998 Sulphur Recovery Symposium, Tucson, AZ, USA, 1–4 November 1998; pp. 15–18. [Google Scholar]
- Monnery, W.; Hawboldt, K.; Pollock, A.; Svrcek, W. Ammonia pyrolysis and oxidation in the Claus furnace. Ind. Eng. Chem. Res. 2001, 40, 144–151. [Google Scholar] [CrossRef]
- Dagaut, P.; Lecomte, F.; Mieritz, J.; Glarborg, P. Experimental and kinetic modeling study of the effect of NO and SO2 on the oxidation of CO H2 mixtures. Int. J. Chem. Kinet. 2003, 35, 564–575. [Google Scholar] [CrossRef]
- ZareNezhad, B.; Hosseinpour, N. Evaluation of different alternatives for increasing the reaction furnace temperature of Claus SRU by chemical equilibrium calculations. Therm. Eng. 2008, 28, 738–744. [Google Scholar] [CrossRef]
- Mendiara, T.; Glarborg, P. Ammonia chemistry in oxy-fuel combustion of methane. Combust. Flame 2009, 156, 1937–1949. [Google Scholar] [CrossRef]
- Selim, H.; Gupta, A.; Sassi, M. Novel error propagation approach for reducing H2S/O2 reaction mechanism. Appl. Energy 2012, 93, 116–124. [Google Scholar] [CrossRef]
- Duissenov, D. Production and Processing of Sour Crude and Natural Gas-Challenges due to Increasing Stringent Regulations. Master’s Thesis, Institutt for Petroleumsteknologi Og Anvendt Geofysikk, Trondheim, Norway, 2013. [Google Scholar]
- Zhou, C.R.; Sendt, K.; Haynes, B.S. Experimental and kinetic modelling study of H2S oxidation. Proc. Combust. Inst. 2013, 34, 625–632. [Google Scholar] [CrossRef]
- Nabikandi, N.J.; Fatemi, S. Kinetic modelling of a commercial sulfur recovery unit based on Claus straight through process: Comparison with equilibrium model. J. Ind. Eng. Chem. 2015, 30, 50–63. [Google Scholar] [CrossRef]
- Gupta, A.; Ibrahim, S.; Al Shoaibi, A. Advances in sulfur chemistry for treatment of acid gases. Prog. Energy Combust. Sci. 2016, 54, 65–92. [Google Scholar] [CrossRef]
- Ibrahim, S.; Al Shoaibi, A.; Gupta, A. Role of toluene to acid gas (H2S and CO2) combustion in H2/O2–N2 flame under Claus condition. Appl. Energy 2015, 149, 62–68. [Google Scholar] [CrossRef]
- Rahman, R.K.; Ibrahim, S.; Raj, A. Oxidative destruction of monocyclic and polycyclic aromatic hydrocarbon (PAH) contaminants in sulfur recovery units. Chem. Eng. Sci. 2016, 155, 348–365. [Google Scholar] [CrossRef]
- Weiland, S.; Hatcher, N.; Jones, C.; Weiland, R. Ammonia destruction in the reaction furnace. Pet. Technol. Q. Q 2016, 4, 2016. [Google Scholar]
- Zarei, S.; Ganji, H.; Sadi, M.; Rashidzadeh, M. Kinetic modeling and optimization of Claus reaction furnace. J. Nat. Gas Sci. Eng. 2016, 31, 747–757. [Google Scholar] [CrossRef]
- Rahman, R.K.; Raj, A.; Ibrahim, S.; Khan M, I.; Al Muhairi, N.O. Reduction in natural gas consumption in sulfur recovery units through kinetic simulation using a detailed reaction mechanism. Ind. Eng. Chem. Res. 2018, 57, 1417–1428. [Google Scholar] [CrossRef]
- Abdoli, P.; Hosseini, S.A.; Mujeebu, M.A. Influence of O2 enrichment in dry air on combustion temperature, contaminant production and sulfur recovery, in SRU reaction furnace. Forsch. Im Ing. 2018, 82, 99–106. [Google Scholar] [CrossRef]
- Otomo, J.; Koshi, M.; Mitsumori, T.; Iwasaki, H.; Yamada, K. Chemical kinetic modeling of ammonia oxidation with improved reaction mechanism for ammonia/air and ammonia/hydrogen/air combustion. Int. J. Hydrogen Energy 2018, 43, 3004–3014. [Google Scholar] [CrossRef]
- Al Hamadi, M.; Ibrahim, S.; Raj, A. Effects of Oxygen Enrichment on Natural Gas Consumption and Emissions of Toxic Gases (CO, Aromatics, and SO2) in the Claus Process. Ind. Eng. Chem. Res. 2019, 58, 16489–16501. [Google Scholar] [CrossRef]
- Li, D.; Dowling, N.; Marriott, R.; Clark, P. Kinetics and Mechanisms for Destruction of Ammonia in the Claus Furnace; Alberta Sulphur Research Ltd.: Calgary, AB, Canada, 2016. [Google Scholar]
- Ibrahim, S.; Rahman, R.K.; Raj, A. Effects of H2O in the feed of sulfur recovery unit on sulfur production and aromatics emission from Claus furnace. Ind. Eng. Chem. Res. 2017, 56, 11713–11725. [Google Scholar] [CrossRef]
- Kazempour, H.; Pourfayaz, F.; Mehrpooya, M. Modeling and multi-optimization of thermal section of Claus process based on kinetic model. J. Nat. Gas Sci. Eng. 2017, 38, 235–244. [Google Scholar] [CrossRef]
- Ibrahim, S.; Rahman, R.K.; Raj, A. Roles of hydrogen sulfide concentration and fuel gas injection on aromatics emission from Claus furnace. Chem. Eng. Sci. 2017, 172, 513–527. [Google Scholar] [CrossRef]
- Abdoli, P.; Hosseini, S.A.; Mujeebu, M.A. Effect of preheating inlet air and acid gas on the performance of sulfur recovery unit—CFD simulation and validation. Forschung Im Ingenieurwesen 2019, 83, 81–89. [Google Scholar] [CrossRef]
- He, X.; Shu, B.; Nascimento, D.; Moshammer, K.; Costa, M.; Fernandes, R.X. Auto-ignition kinetics of ammonia and ammonia/hydrogen mixtures at intermediate temperatures and high pressures. Combust. Flame 2019, 206, 189–200. [Google Scholar] [CrossRef]
- Nopmongcol, U.; Beardsley, R.; Kumar, N.; Knipping, E.; Yarwood, G. Changes in United States deposition of nitrogen and sulfur compounds over five decades from 1970 to 2020. Atmos. Environ. 2019, 209, 144–151. [Google Scholar] [CrossRef]
- Okafor, E.C.; Naito, Y.; Colson, S.; Ichikawa, A.; Kudo, T.; Hayakawa, A.; Kobayashi, H. Measurement and modelling of the laminar burning velocity of methane-ammonia-air flames at high pressures using a reduced reaction mechanism. Combust. Flame 2019, 204, 162–175. [Google Scholar] [CrossRef]
- Manna, M.V.; Sabia, P.; Ragucci, R.; de Joannon, M. Oxidation and pyrolysis of ammonia mixtures in model reactors. Fuel 2020, 264, 116768. [Google Scholar] [CrossRef]
- Jones, D.; Bhattacharyya, D.; Turton, R.; Zitney, S.E. Rigorous kinetic modeling and optimization study of a modified claus unit for an integrated gasification combined cycle (IGCC) power plant with CO2 capture. Ind. Eng. Chem. Res. 2012, 51, 2362–2375. [Google Scholar] [CrossRef]
Publisher’s Note: MDPI stays neutral with regard to jurisdictional claims in published maps and institutional affiliations. |
© 2021 by the authors. Licensee MDPI, Basel, Switzerland. This article is an open access article distributed under the terms and conditions of the Creative Commons Attribution (CC BY) license (https://creativecommons.org/licenses/by/4.0/).