Article

Use of H2O2 to Cause Oxidative Stress, the Catalase Issue

Institut Cochin, Université de Paris, INSERM, CNRS, F-75014 Paris, France
*
Author to whom correspondence should be addressed.
Int. J. Mol. Sci. 2020, 21(23), 9149; https://doi.org/10.3390/ijms21239149
Submission received: 10 November 2020 / Revised: 27 November 2020 / Accepted: 28 November 2020 / Published: 30 November 2020
(This article belongs to the Special Issue Cellular Models of Oxidative Stress)

Abstract

:
Addition of hydrogen peroxide (H2O2) is a method commonly used to trigger cellular oxidative stress. However, the doses used (often hundreds of micromolar) are disproportionally high with regard to physiological oxygen concentration (low micromolar). In this study using polarographic measurement of oxygen concentration in cellular suspensions we show that H2O2 addition results in O2 release as expected from catalase reaction. This reaction is fast enough to, within seconds, decrease drastically H2O2 concentration and to annihilate it within a few minutes. Firstly, this is likely to explain why recording of oxidative damage requires the high concentrations found in the literature. Secondly, it illustrates the potency of intracellular antioxidant (H2O2) defense. Thirdly, it complicates the interpretation of experiments as subsequent observations might result from high/transient H2O2 exposure and/or from the diverse possible consequences of the O2 release.

1. Introduction

Exposure to hydrogen peroxide (H2O2) is a widely used procedure to cause oxidative damage/stress in cellular models. The Fenton’s reaction between H2O2 and Fe2+ ions generates the highly reactive OH radical and is thought to be the main mechanism for oxidative damage [1]. Then the question arises as to whether the conditions used are relevant to the mechanism underlying endogenous oxidative damage. Oxidative damage to cells is supposed to result primarily from oxygen using reactions within cells: cellular respiration accounts for most of the cellular oxygen consumption hence mitochondria are supposed to be oxidative stress generators. A quick survey of the literature reveals that the concentrations of H2O2 used to trigger oxidative damage appear disproportionately high to anyone used to dealing with cellular respiration for the following reasons: Dissociation of oxygen from hemoglobin starts below 50 µM and interstitial concentration is in the 20 µM range [2] hence even lower within cells. The affinity of mitochondria for oxygen is extremely high [3,4] and consequently mitochondria can exhaust all incoming oxygen with minimal decrease in their respiratory rate. This allows a sustained oxygen consumption flux while oxygen concentration is close to zero [5]. This points to the distinction to be made between concentrations and fluxes. Several questions arise with regard to this H2O2 model of oxidative damage: (1) Why are these high concentrations of H2O2 necessary to observe oxidative damage? (2) Are there other consequences than direct oxidative damage by H2O2? (3) Are the induced modifications relevant to physiology and to the redox balance associated with aerobic life?
The aim of the present report is to attract attention to the fact that direct application of H2O2 to cells results in the generation of oxygen (O2) because of the presence of catalase [6,7,8]. This is not unexpected but seems generally overlooked and is likely relevant to the above first two questions. With regard to the third question, which lies well beyond the scope of the present article, two comments arise: (1) High concentration of H2O2 may be justified with the belief that they would increase the frequency of oxidative damages but would not alter their nature. (2) In addition to normal aerobic metabolism, local concentrations might be closer to the experimental values mentioned before in the inflammatory state where enzymatic reactions generate oxygen radicals with the aim to kill unwanted organisms/cells.
Actually, this report originates from our attempts to generate DNA strand breaks in mitochondrial DNA with hydrogen sulfide [9,10]. In our hands hydrogen sulfide could neither cause nuclear [11] nor mitochondrial DNA damage, while H2O2 as a positive control required the high micromolar concentrations found in the literature (Appendix A).
Lipids and proteins are other targets for oxidative stress. The enzyme aconitase contains an iron atom (Fe2+) sensitive to oxidative stress [12]. Its mitochondrial isoform is part of the tricarboxylic acid cycle (Krebs cycle). In contrast, fumarase, whose mitochondrial isoform is also part of the Krebs cycle, is resistant to oxidative stress. Similar experimental procedures detect aconitase and fumarase activities allowing sequential monitoring of these two reactions in the same reaction medium. Therefore, the aconitase to fumarase ratio is a convenient index of the extent of oxidative damages/stress [12]. Examination of this ratio in cells exposed to H2O2 could not detect indication of intracellular oxidative damage to aconitase unless H2O2 approached the millimolar concentration.

2. Results

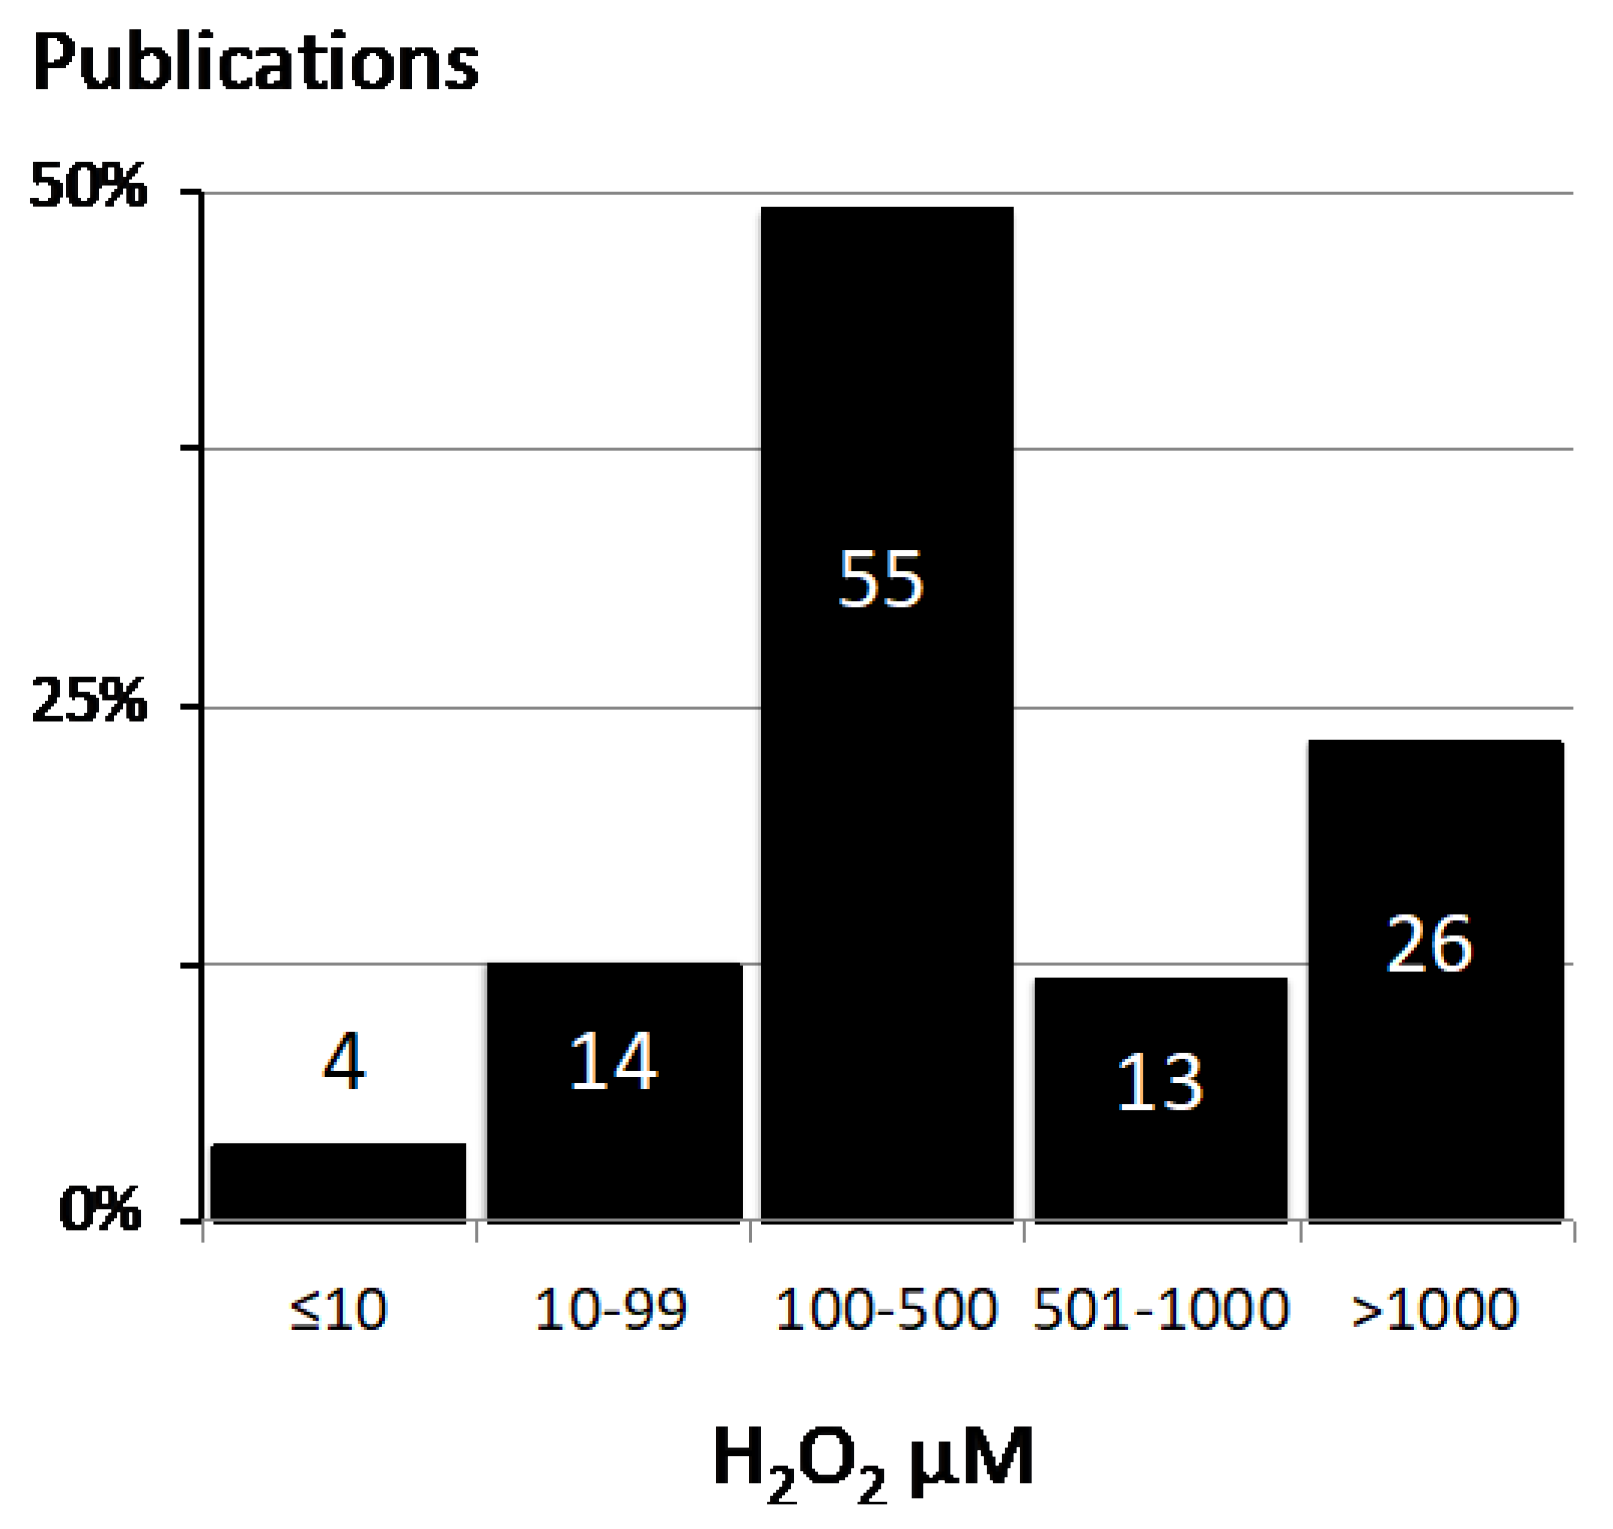
2.1. Values for H2O2 Concentration in the Literature

The PubMed database was searched with the keywords «Oxidative damage and Hydrogen Peroxide» and only publications in open access were considered. This request yielded 5147 publications. They were sorted according to best match. The first 201 were scrutinized for H2O2 treatment with concentration values, yielding 112 publications, whose PMID identifiers are listed in Appendix B. Different experimental profiles had to be considered: 46 publications used a single H2O2 concentration value, 36 publications presented a dose response curve leading to the choice of a single concentration used throughout the rest of the study (this concentration was considered here), and 30 publications used a set of increasing concentrations with no privileged concentration leading us to consider the mean value between minimal and maximal concentrations. Then the repartition of the H2O2 concentrations used was as follow: <10 µM 4 publications, 10–99 µM 14 publications, 100–500 µM 55 publications, 501–1000 µM 13 publications, and >1000 µM 26 publications. The concentrations of H2O2 used to generate oxidative damage in cellular models are therefore in the high micromolar range with 84% above 100 µM. Notably the 100–500 µM range was used in half of the publications.

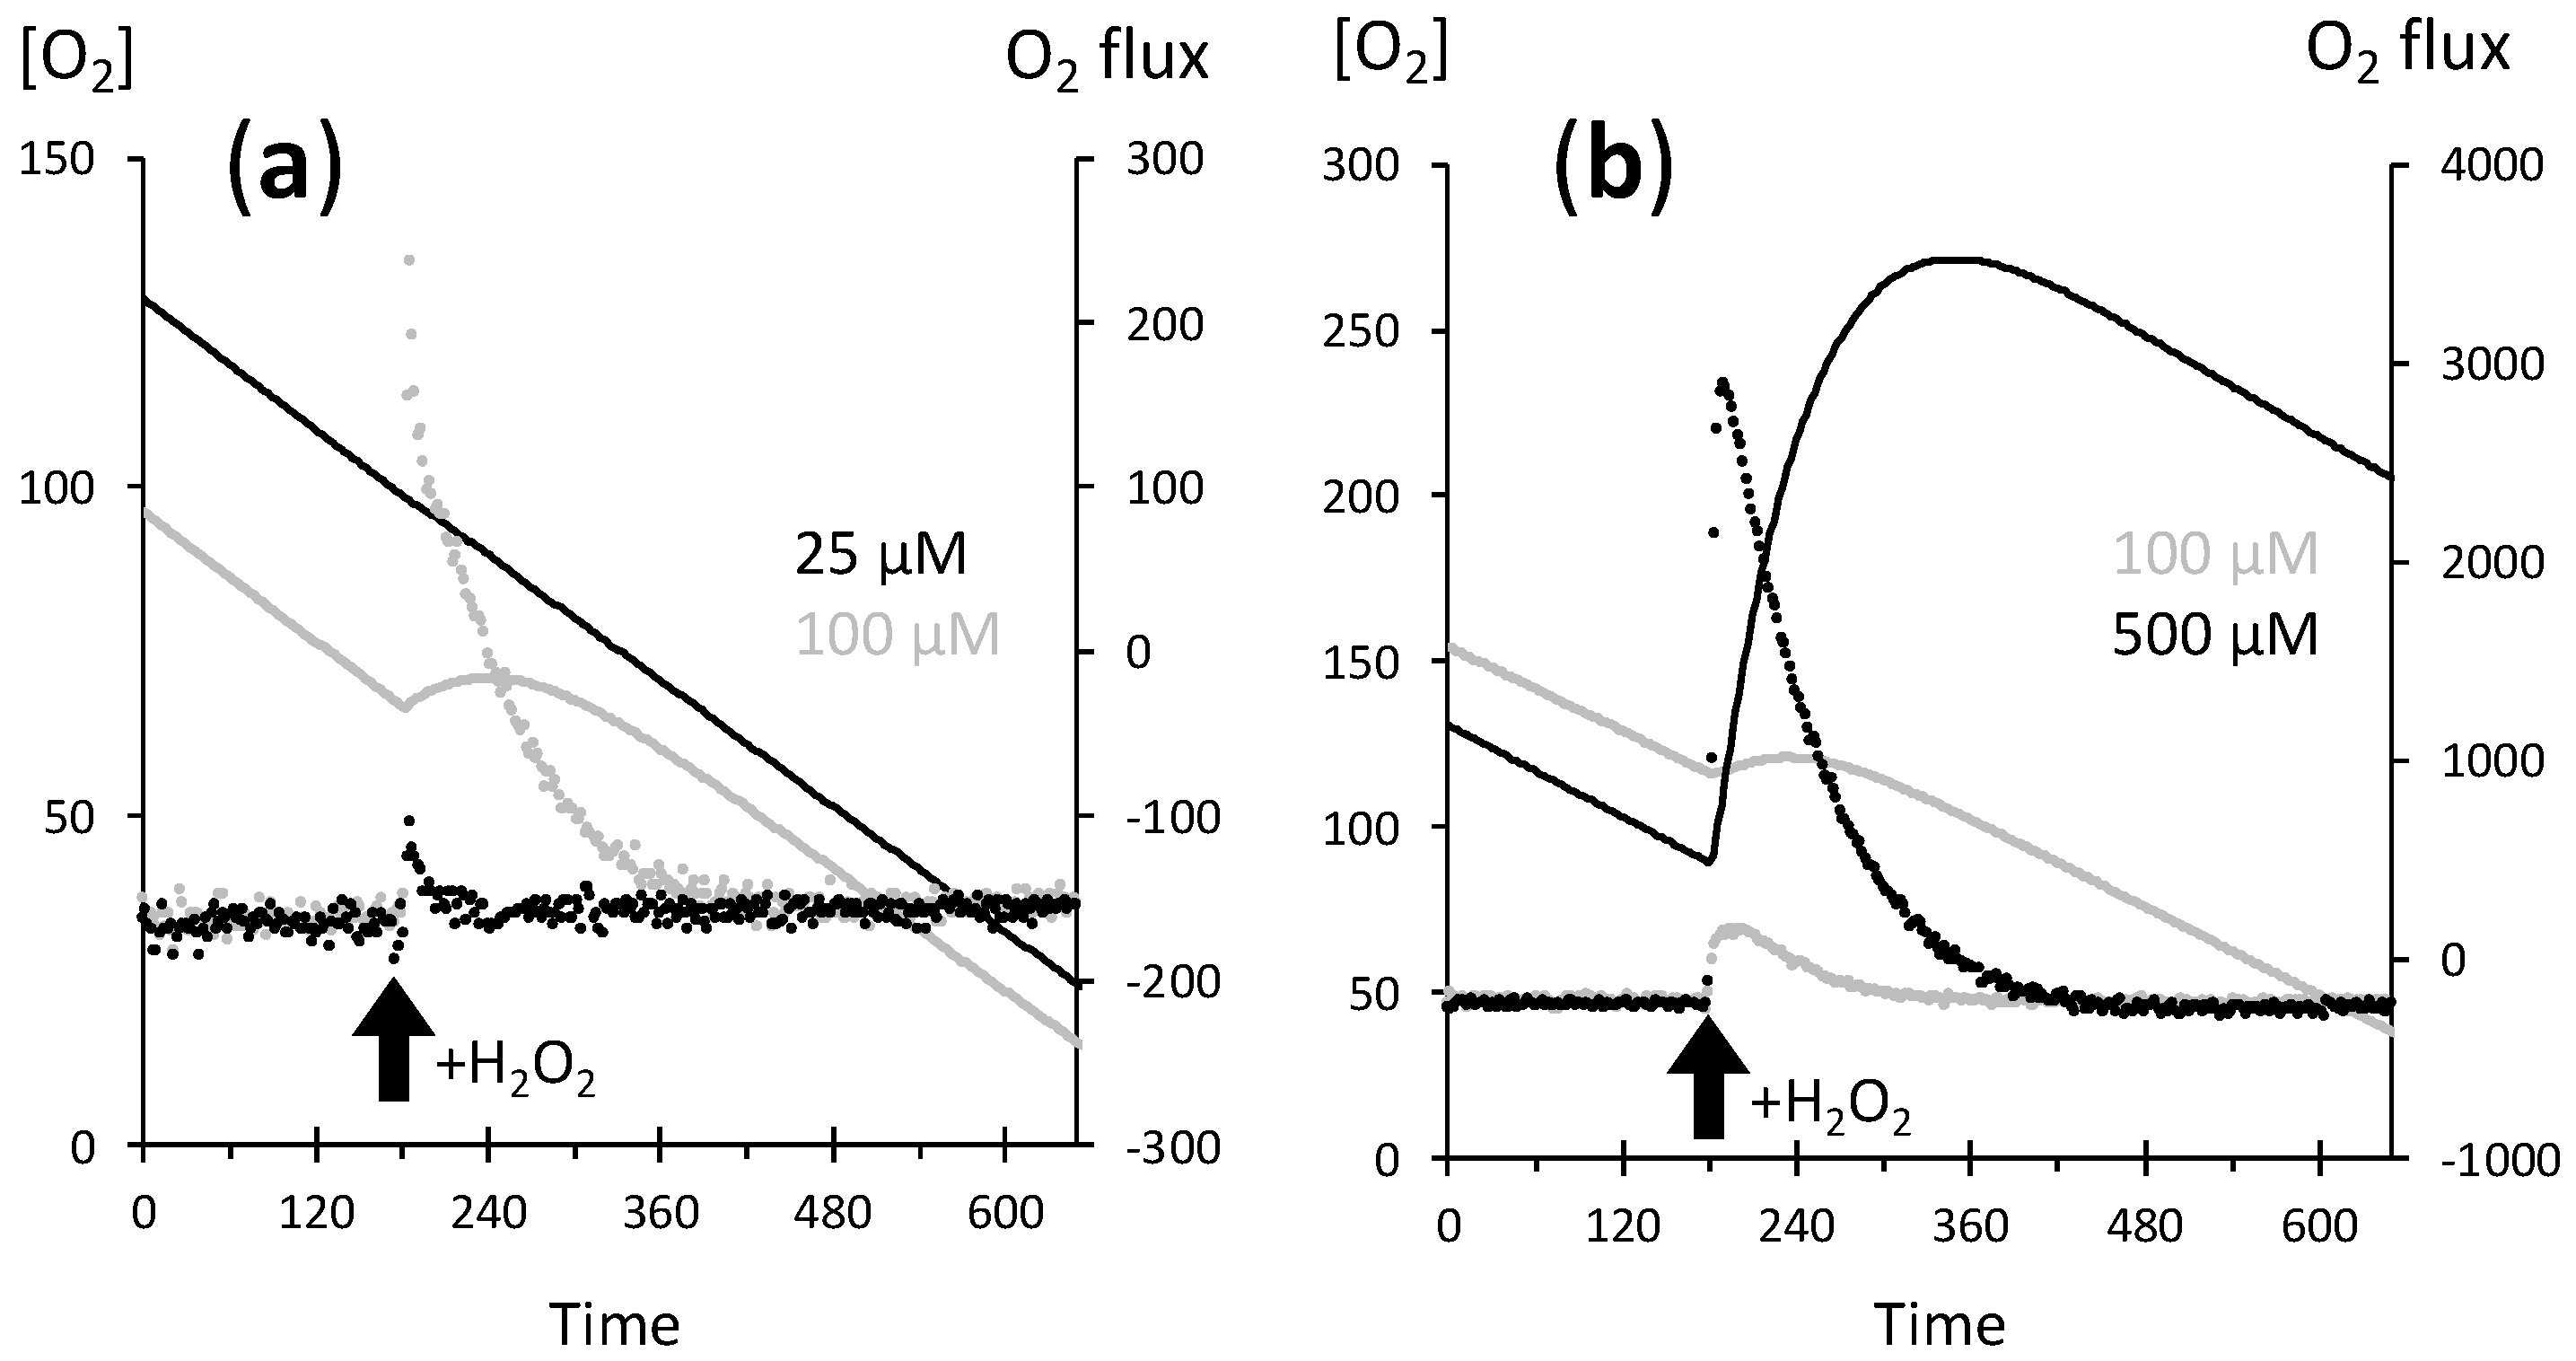
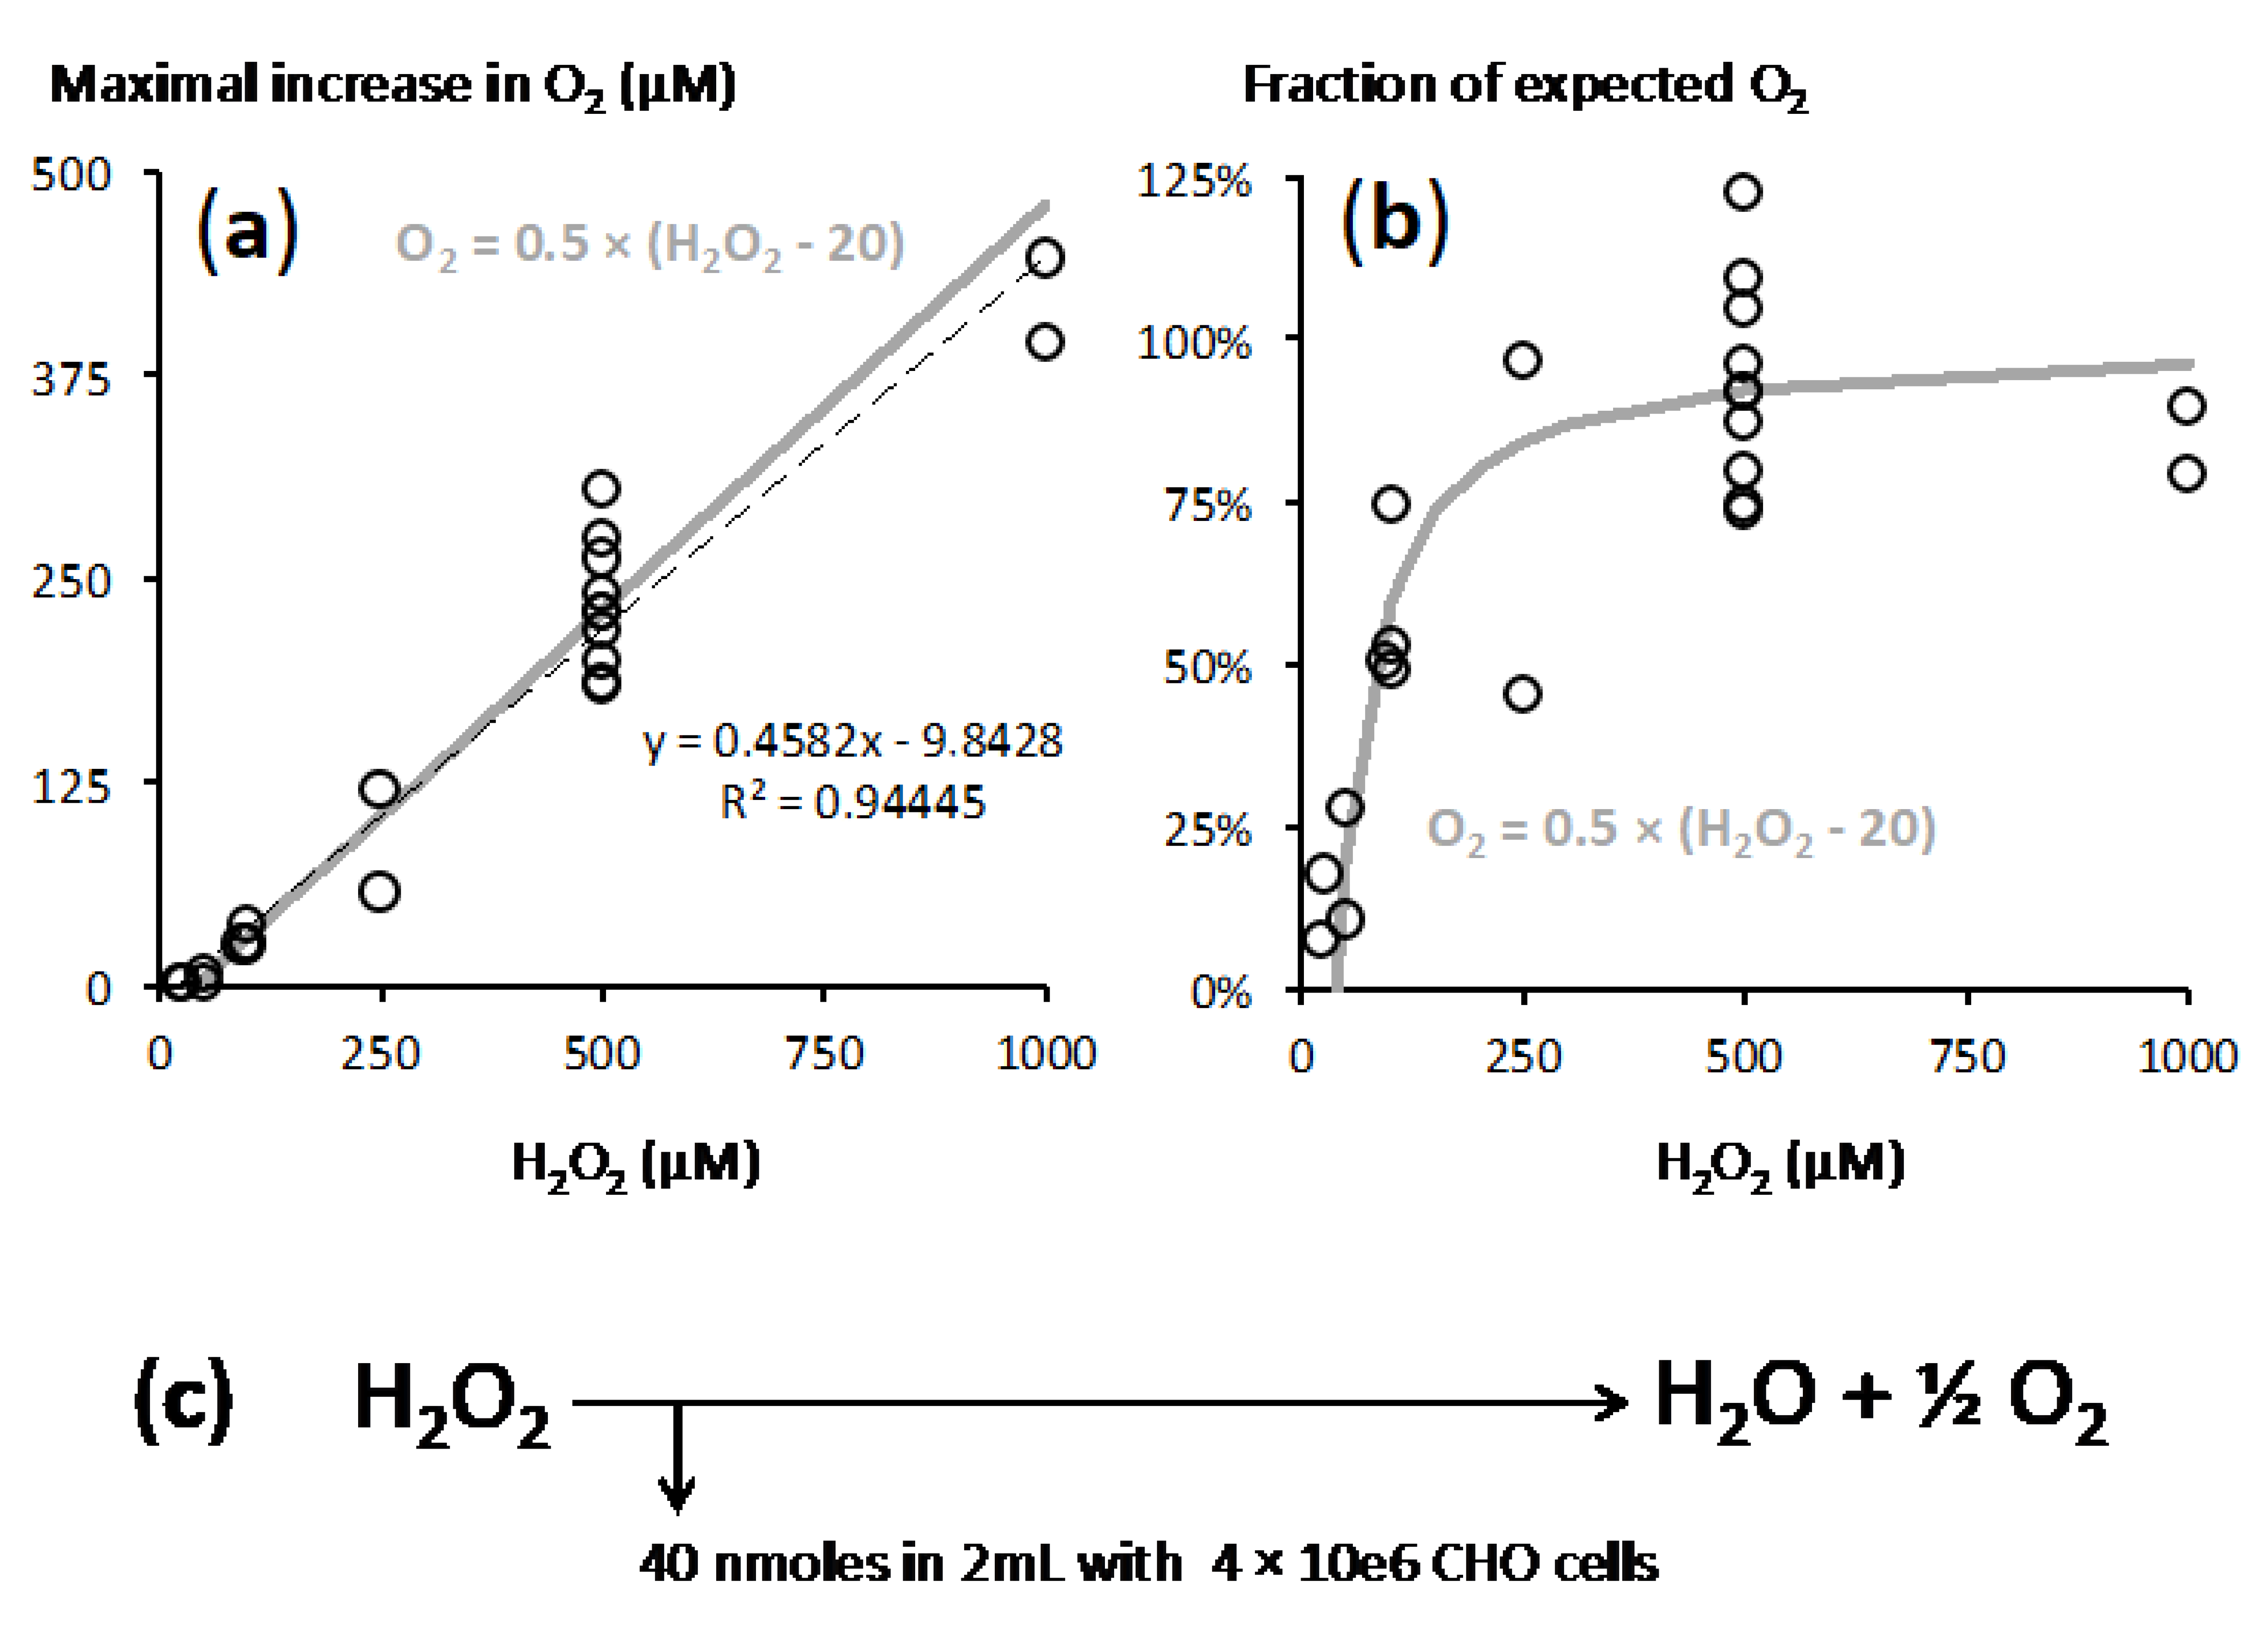
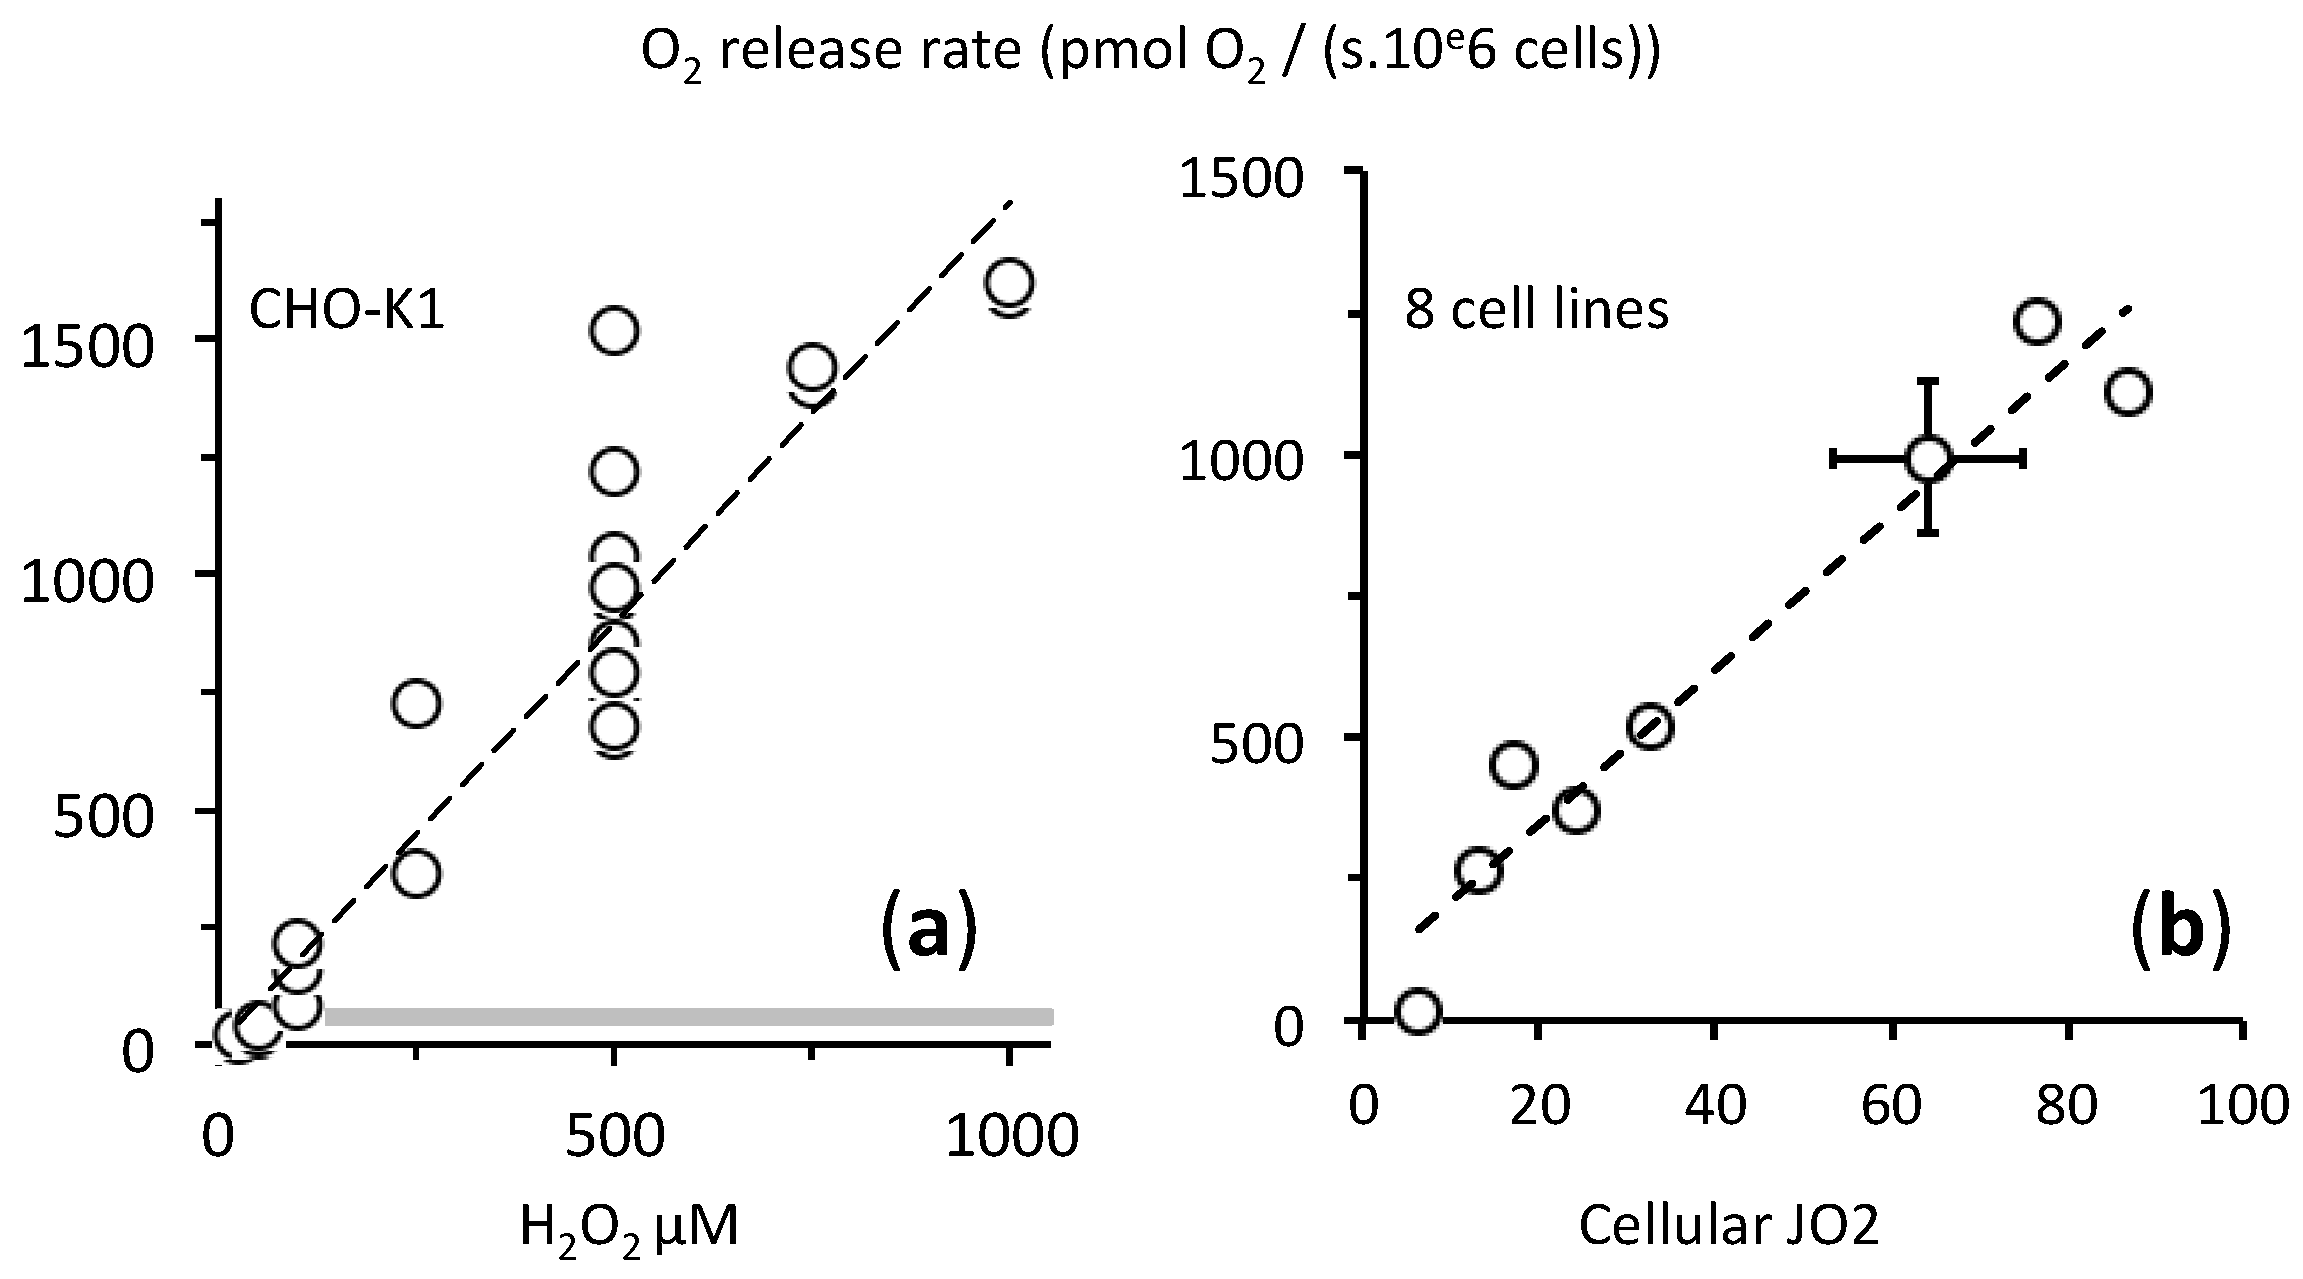
2.2. A Proportionate Increase in Dioxygen Follows High Micromolar H2O2 Addition

Our initial aim was to evaluate mitochondrial DNA strand break in conditions of induction of mitochondrial sulfide oxidation in wild type chinese hamster ovary (CHO) cells or in cells with overexpressed human sulfide quinone reductase [13]. We used the O2k oxygraph, which allows simultaneous measurement in two identical chambers (Figure 1). It showed that addition of high (hundreds) micromolar H2O2 resulted in an immediate release of molecular oxygen apparently proportionate to the H2O2 input, and 500 µM H2O2 led to oxygen concentrations above 250 µM, hence higher than that resulting from air saturation of the medium (approx. 200 µM at 37 °C). However, with 25 µM H2O2 the oxygen release was hardly detected.
We hypothesized that catalase enzymatic activity (H2O2 H2O + ½ O2) underlay the observed phenomenon. The reaction equation predicts that the oxygen concentration increase would equal half the concentration of H2O2 added, hence 12.5, 50, and 250 µM in the examples shown in Figure 1. Figure 2 shows the percentage of this theoretical oxygen increase that was actually measured in the experiments shown in Figure 1. More than 80% of predicted oxygen was recovered with 500 µM H2O2, roughly 50% with 100 µM, and this percentage dropped below 10% with 25 µM H2O2, at which the slow linear increase in the long term (120 s and more) is rather explained by small experimental differences exaggerated by the conversion in % of absolute values differing by two orders of magnitude. When the difference between two simultaneous experiments shown in Figure 1 was considered (empty circles in Figure 3), the percentage of O2 recovery was higher and reached 100% when the difference between 500 µM and 100 µM traces (hence 400 µM H2O2) was considered.
Putting together the results of all the experiments made with H2O2 additions in the 25–500 µM range and with CHO cells suspensions close to 2 × 10e6 cells/mL suggested a simple model (Figure 3). In that model two reactions took place: an immediate titration of a part of H2O2 and catalase reaction on the rest of H2O2. With the lowest H2O2 concentration (25 µM) the immediate titration checked almost 100% of the H2O2 and little was made available to catalase (Figure 1 and Figure 2).
Analysis of a range of cell concentrations strengthened the proposed role of cellular catalase (Figure 4). With increasing cell concentration, the lag time between H2O2 addition and maximal O2 release decreased (Figure 4a). A single experiment with medium alone led to a low rate of O2 release that reached a peak of 27 µM, hence 11% of the value explained by a catalase like reaction, after 1518 s (not shown on Figure 5). Altogether, this meant that the more cells, the faster the catalase reaction.
However, when the yield of the catalase reaction was considered it declined when lower amounts of cells were used. Time needed for completion of catalase reaction was then likely to be the determinant factor. To a significant extent experimental limitation could explain this because the determination of time and extent of the maximal O2 release became increasingly inaccurate when it took a long time. Another proposal would be that in addition to fast titration (see above) other slower reactions, which could involve components of the culture medium or renewal of H2O2 quenchers, contributed to H2O2 elimination.

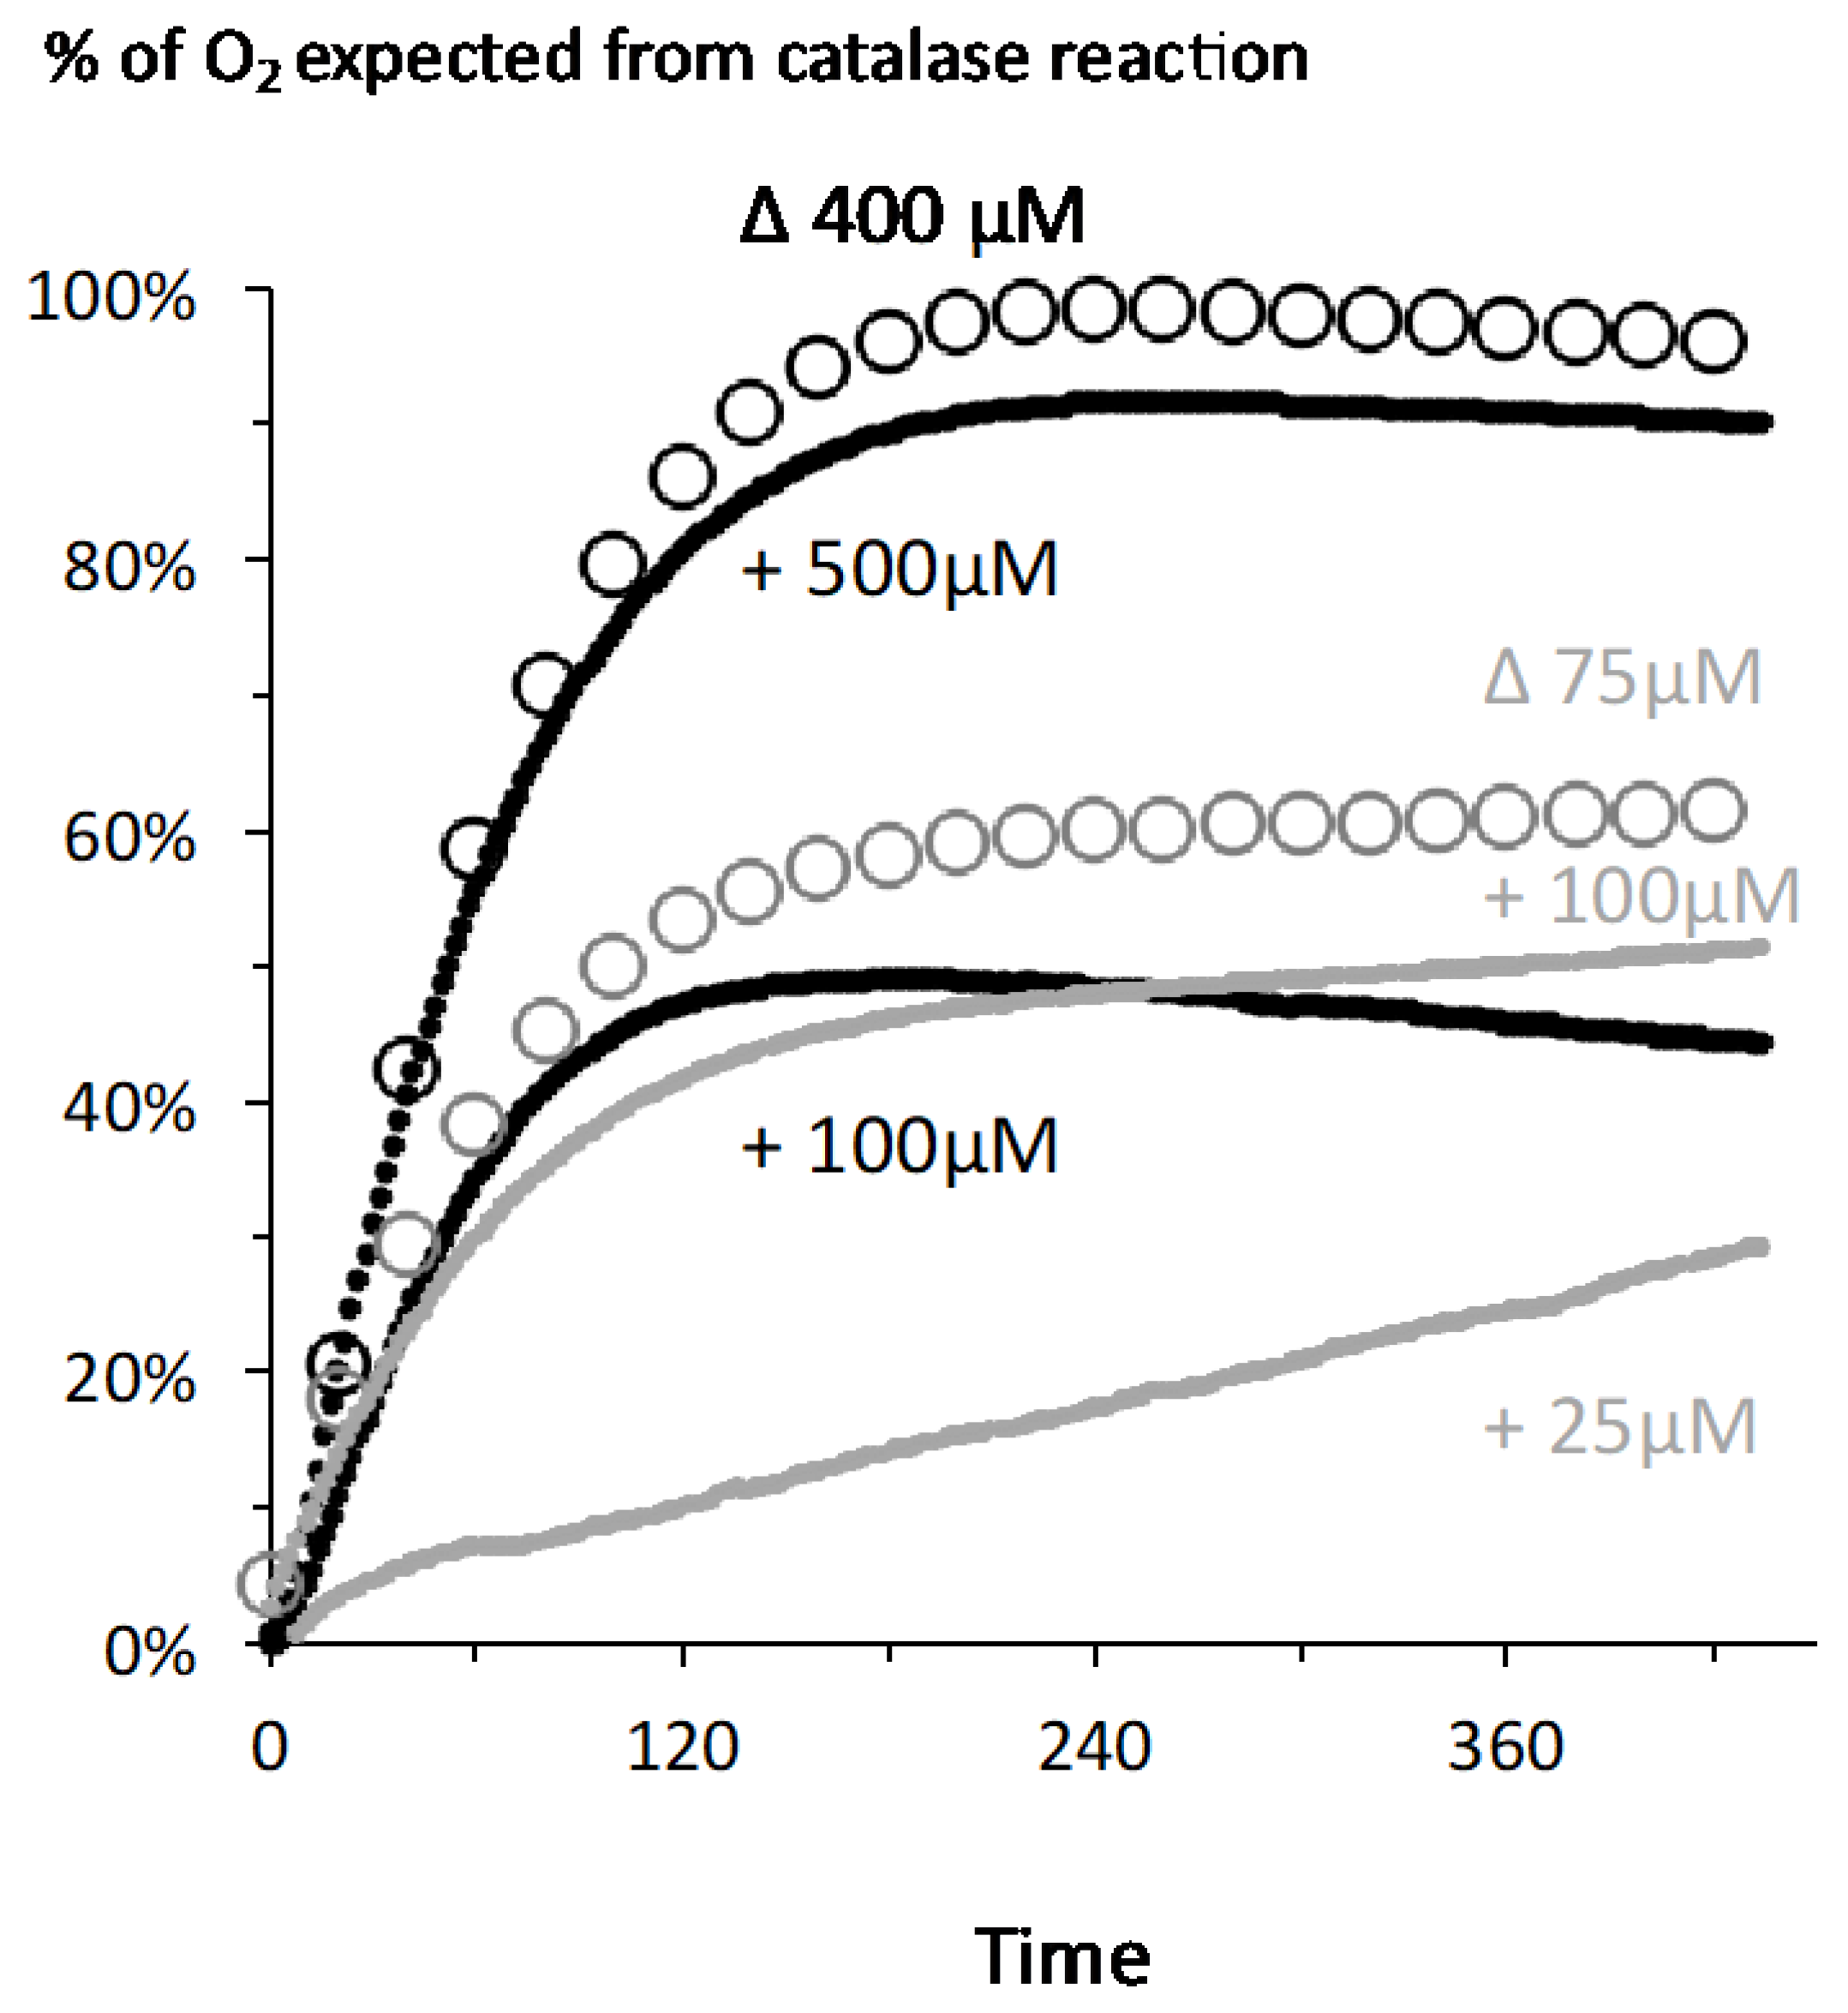
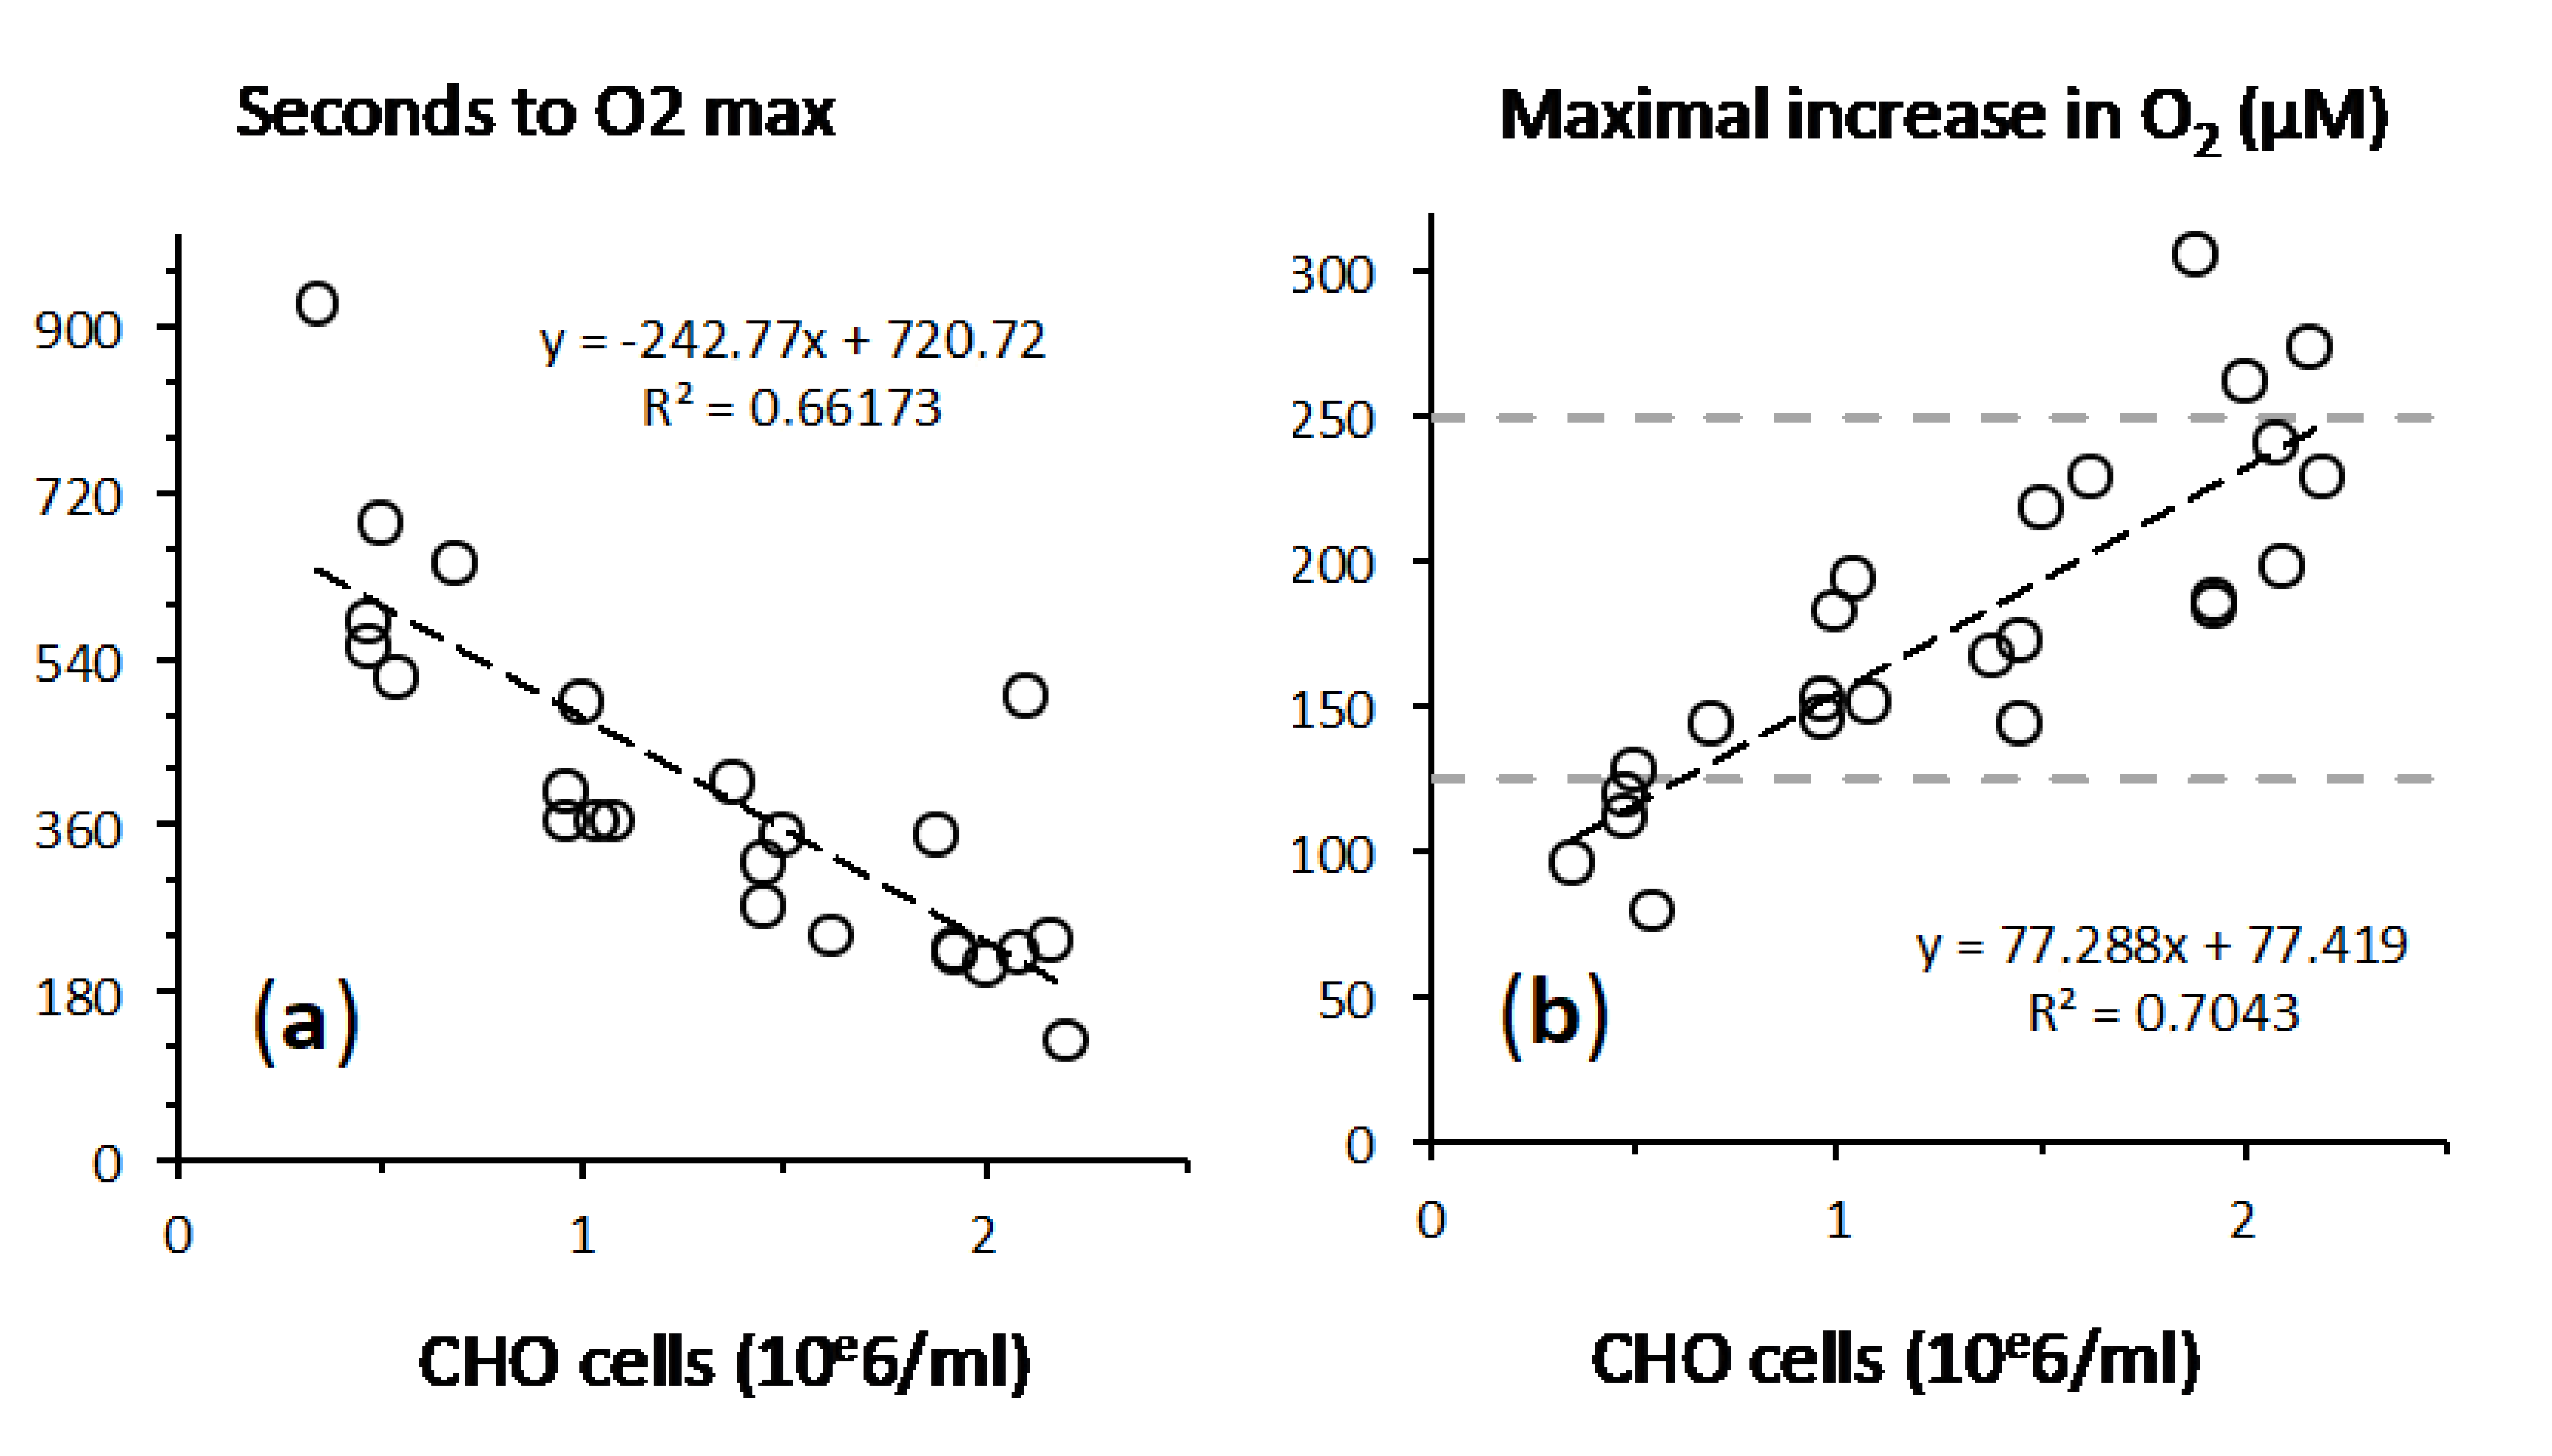
2.3. Fast Rates of Catalase Reaction

Within three minutes, 2 × 10⁶ CHO cells neutralized 500 µM H2O2 (Figure 4a). This corresponds to an average rate while the initial rate was much faster (Figure 1). We estimated this initial rate and Figure 5a represents its dependence on H2O2 concentration with CHO cells. This initial rate of oxygen release remained proportionate to H2O2 concentration in the range 0–1000 µM with no saturation. The oxygen release rate could largely outperform the cellular oxygen consumption rate (cellular respiration) with rates that are more than one order of magnitude higher in the opposite direction (Figure 5a). This fits with the very high turnover rate of the catalase catalytic cycle [6] as a consequence while minutes were needed to reach the maximal increase in O2 (Figure 4a), hence to exhaust all H2O2 in the external medium the H2O2 concentration decreased sharply within seconds after being in contact with cells.
We observed comparable rates for this catalase reaction in eight cell lines. Interestingly, the O2 release rate (catalase reaction) apparently correlated with the endogenous respiration rate, i.e., the cellular oxidative metabolism (Figure 5b).

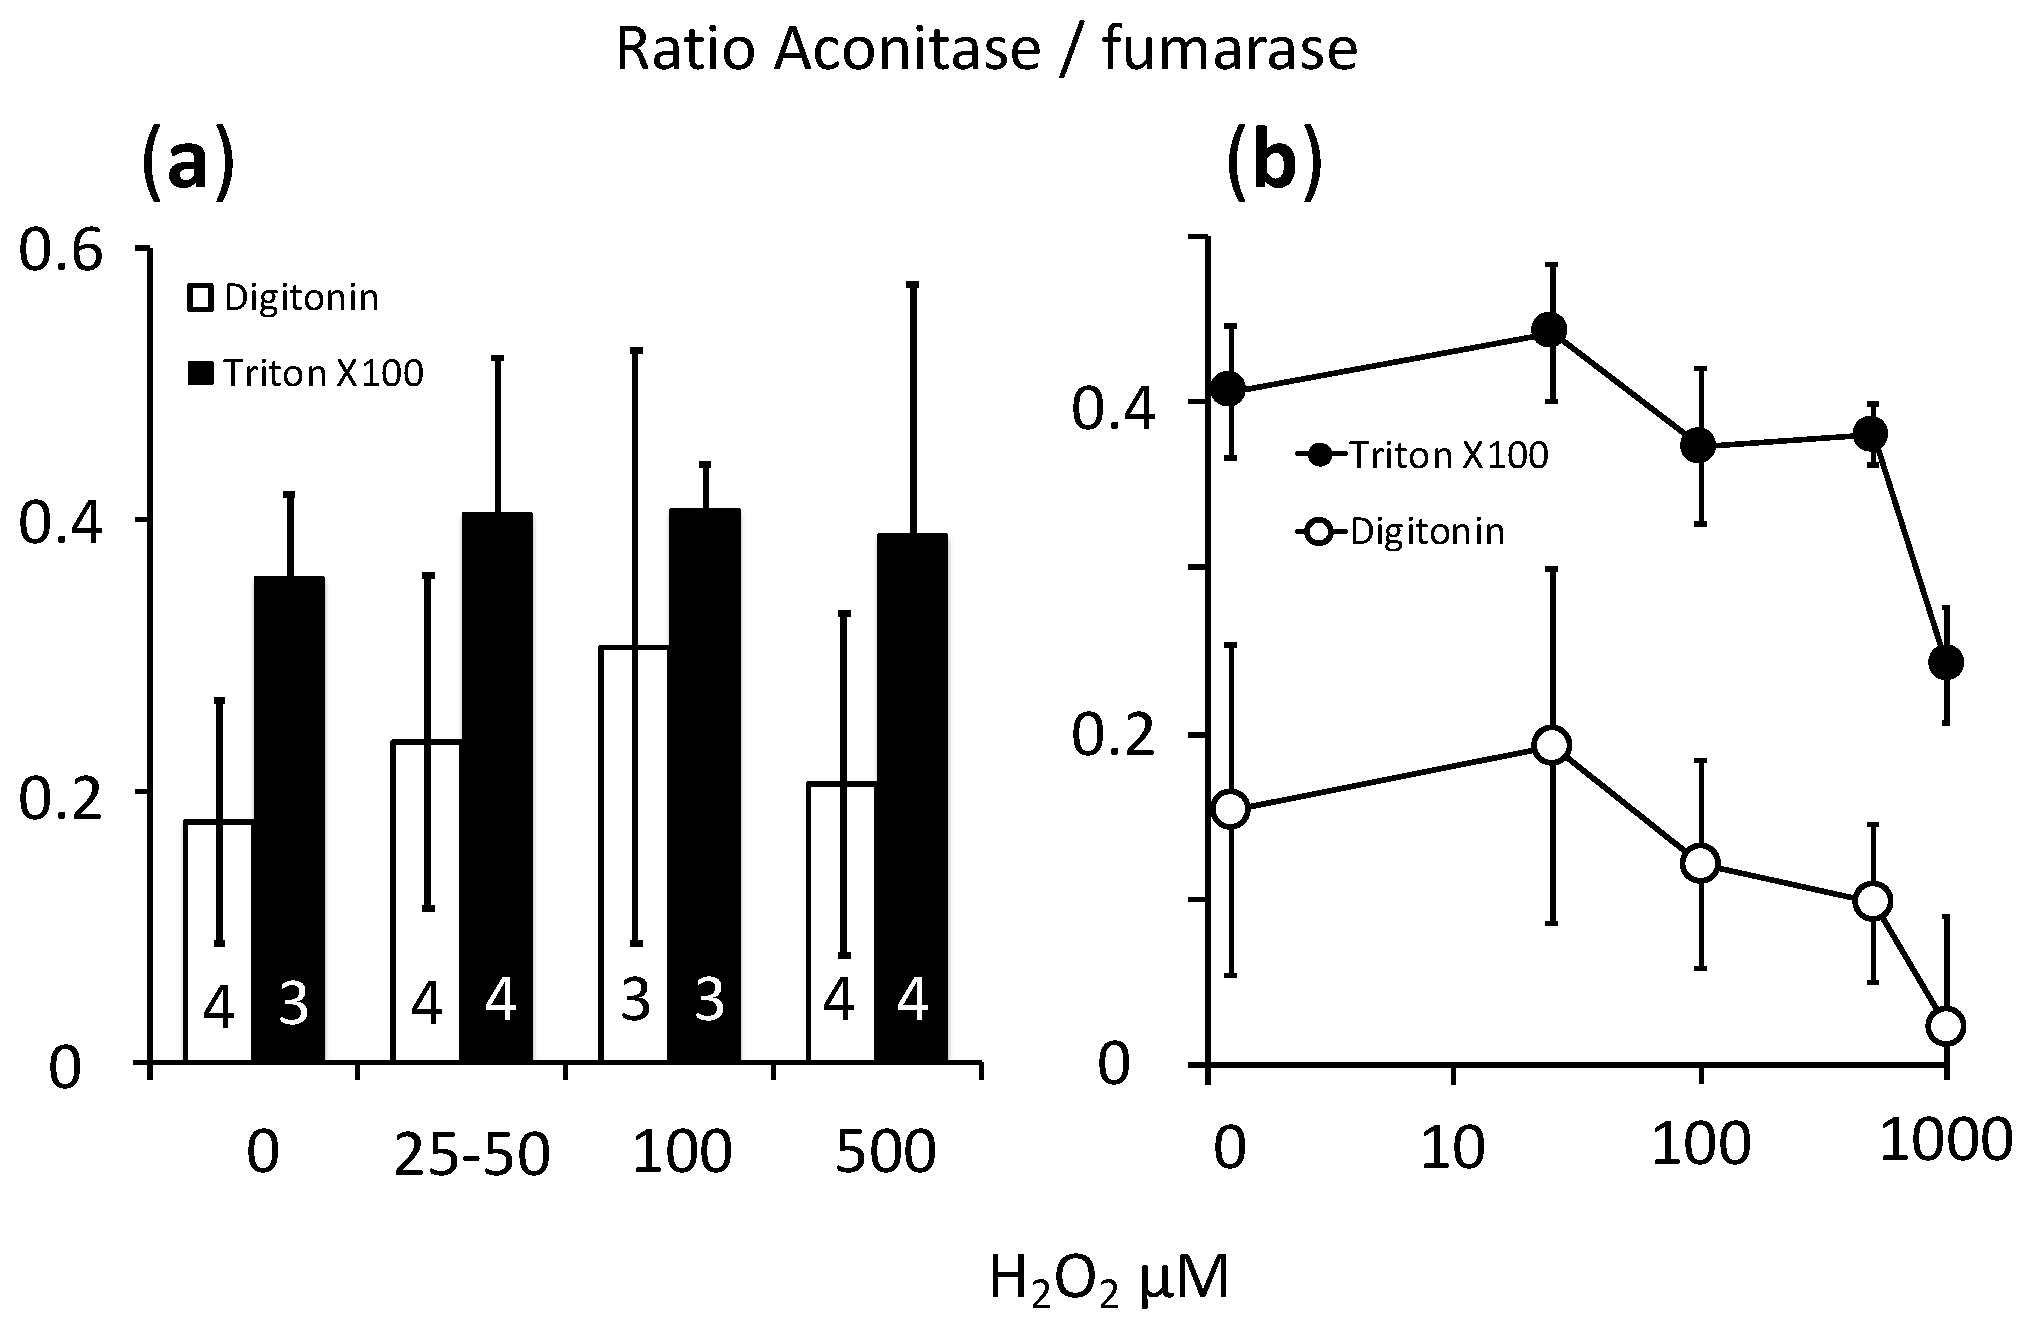
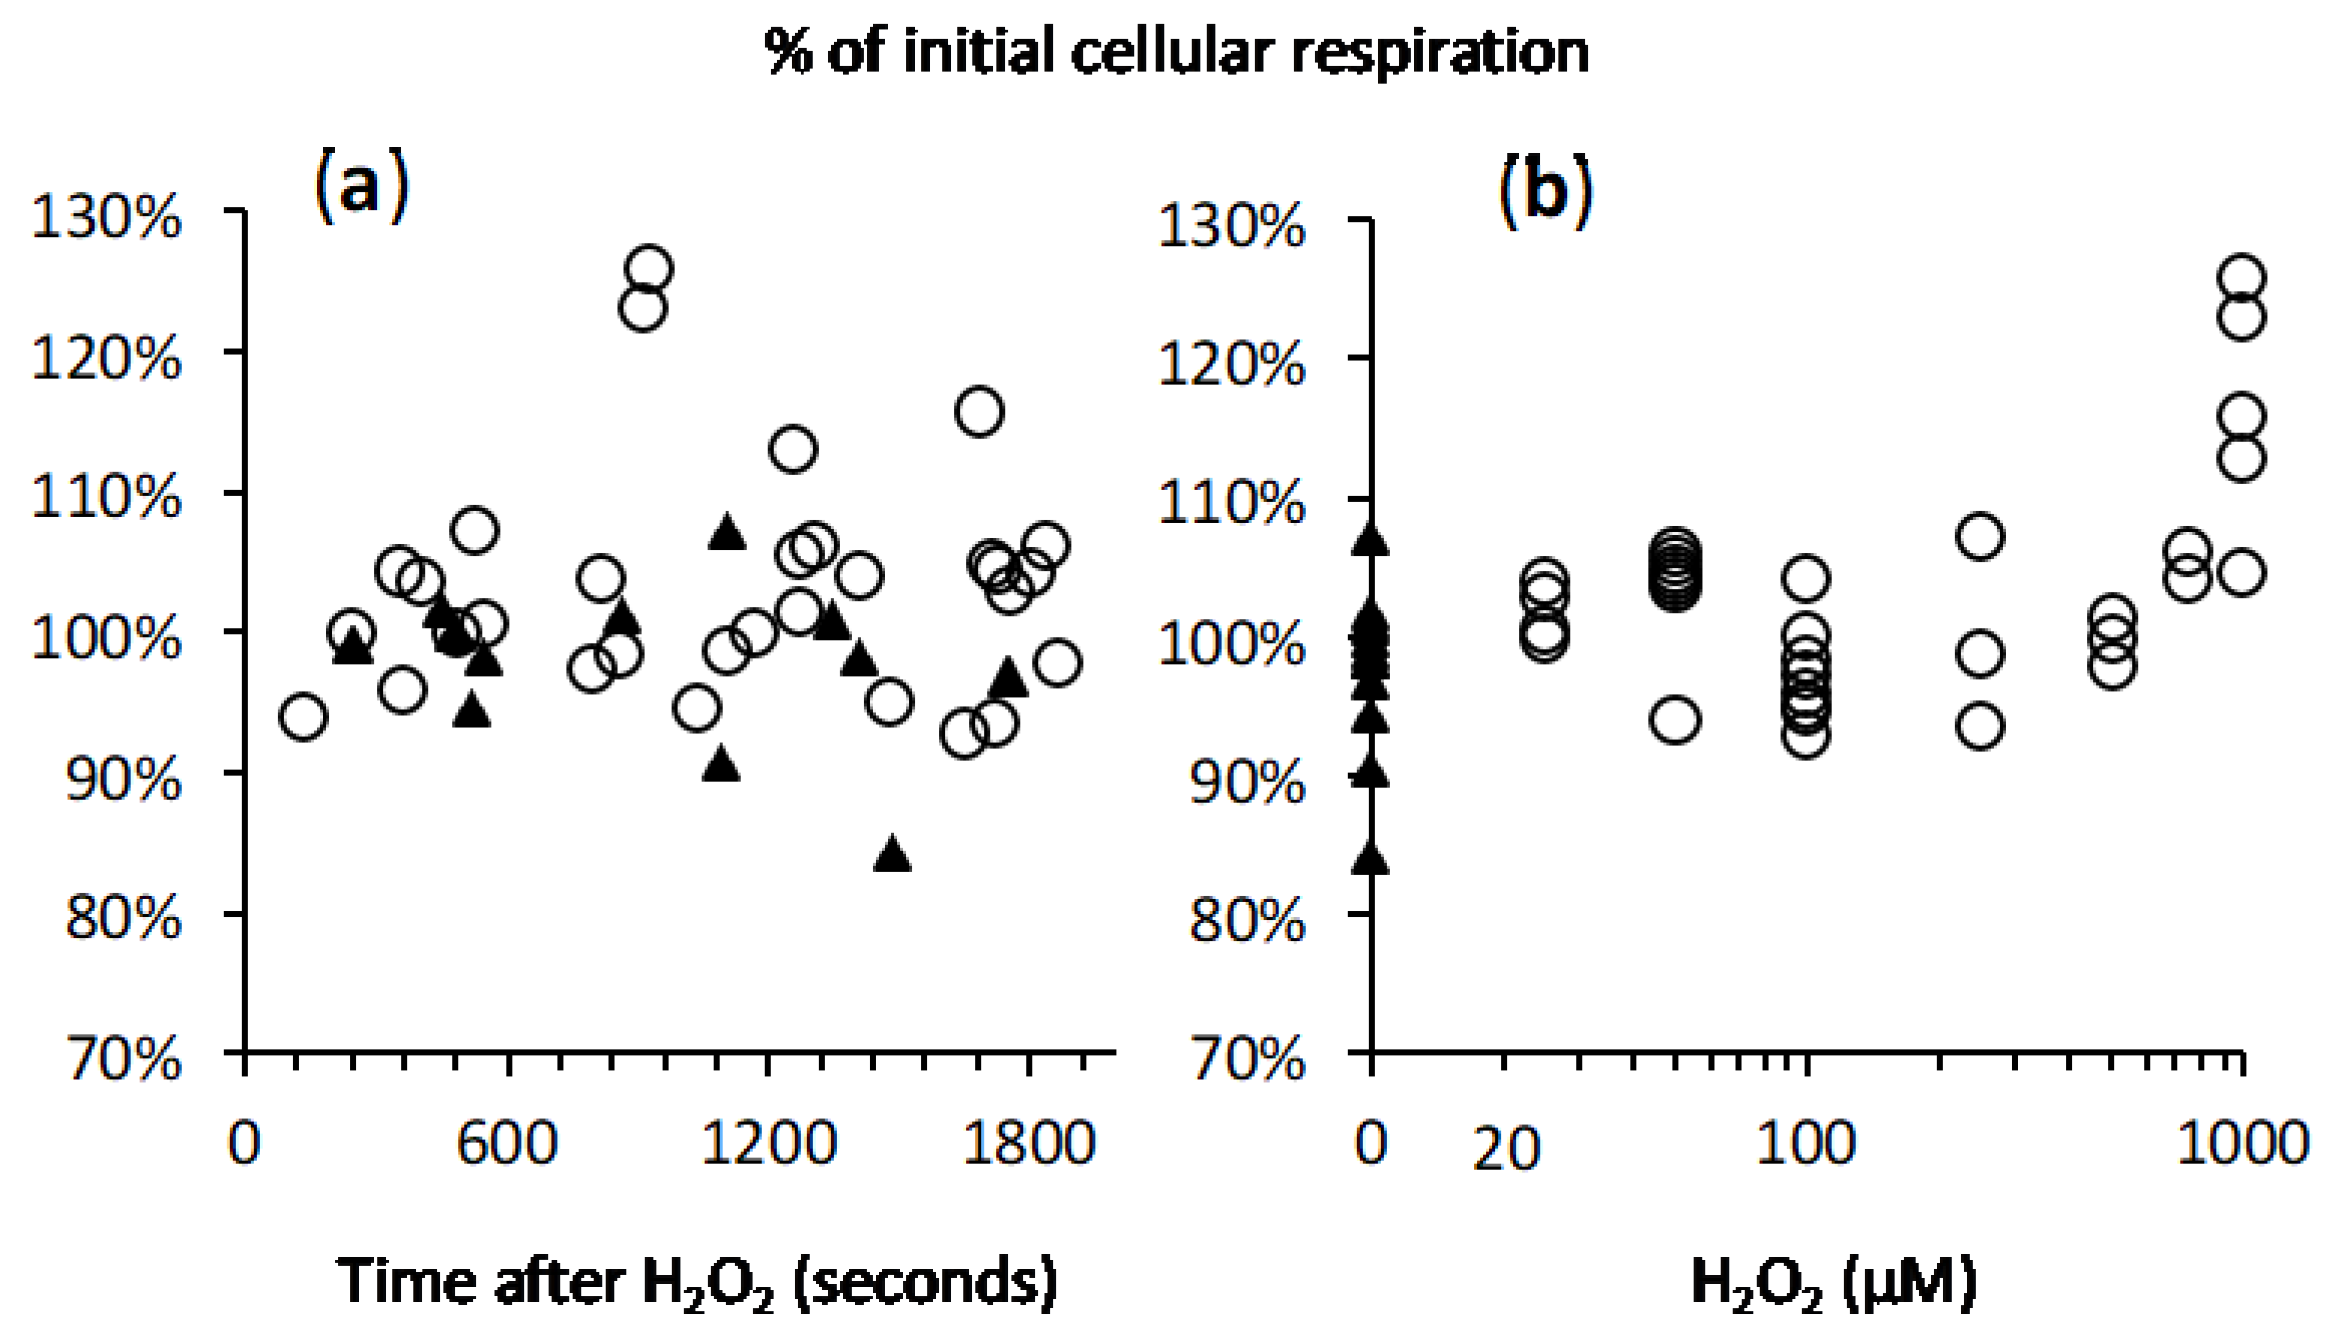
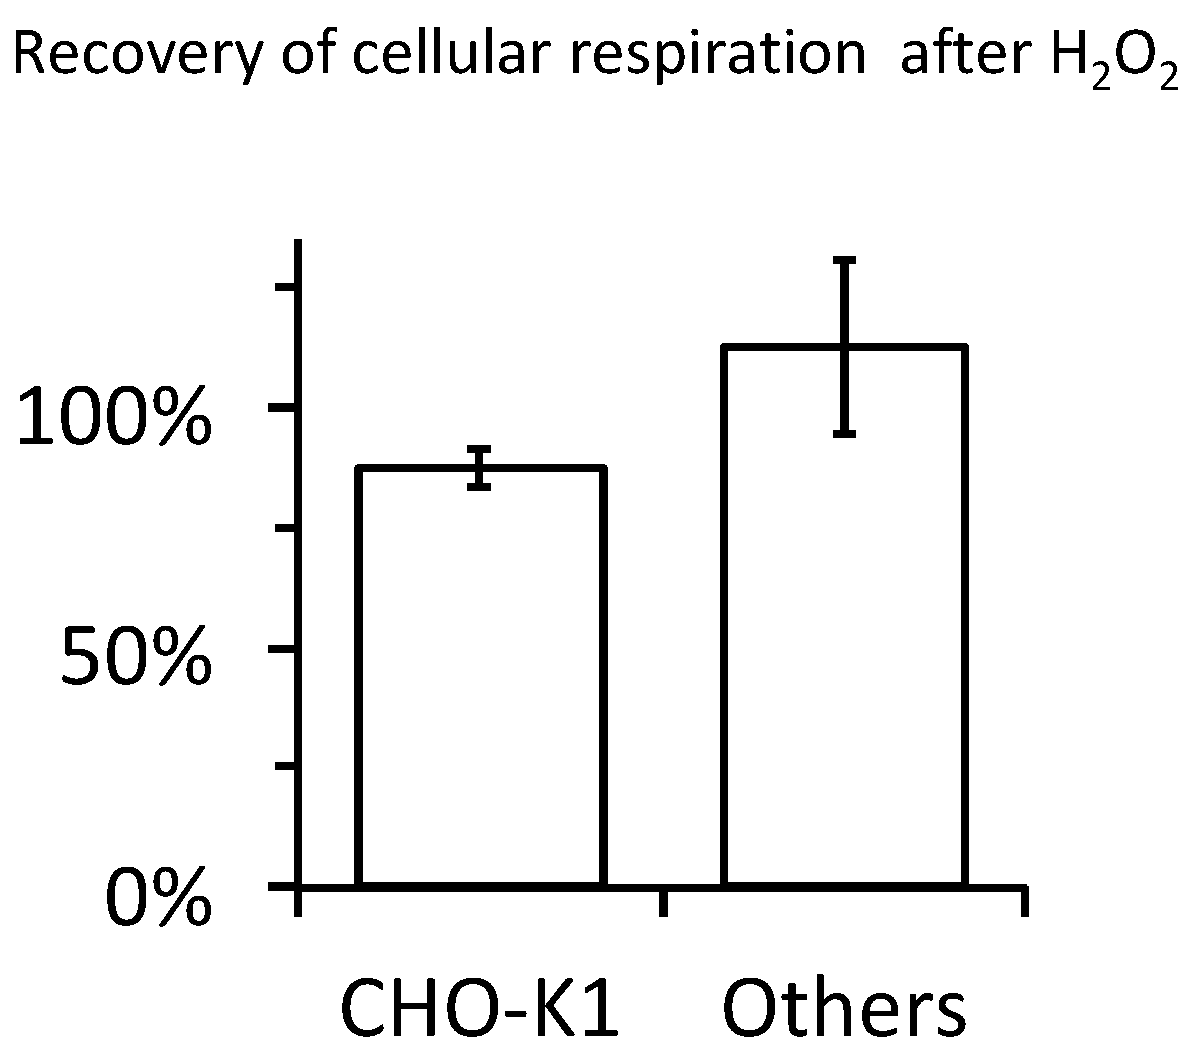
2.4. Cellular Respiration and Aconitase Activity Resistant to H2O2 in the High Micromolar Range

We evaluated intracellular oxidative stress using the aconitase to fumarase ratio, which is considered a sensitive index [12]. Furthermore, we discriminated the cytosolic enzymes, revealed after mild digitonin treatment of the cells, from the mitochondrial enzymes, requiring drastic disruption of the mitochondrial inner membrane using Triton X100 (Figure 6). Increasing concentrations of H2O2 up to 500 µM did not alter the aconitase to fumarase ratio, either in cytosol or in mitochondria (Figure 6a). One experiment with H2O2 concentration raised up to 1mM induced a detectable decrease in cytosolic aconitase activity that remained partial for the mitochondrial enzyme (Figure 6b).
Evaluation of a potential impact of H2O2 impact on cellular oxygen consuming reactions was impossible in the short term after H2O2 addition because of the O2 release. However, with the rapid decline of H2O2 concentration, cellular oxygen consumption rate became detectable, gradually converging towards a new stable value. Comparison of that value with the value observed just before H2O2 addition, used as reference, did not show any change with H2O2 ranging from 0 to 750 µM (Figure 7 and Figure 8). This was true within the period considered, limited to 30–40 min after H2O2 addition. Respiration showed a mild increase (>110%) with 1mM H2O2, likely explained by the huge increase in O2 concentration up to three times the level for saturation with air (not shown). With the reservation that we could not distinguish between mitochondrial respiration and other oxygen consuming processes, this suggested that intense exposure to H2O2 and subsequently to oxygen did not result in fast and irreversible damage to any critical component necessary for normal cellular respiration. This was fully consistent with the resistance of mitochondrial aconitase to the exogenous H2O2.

3. Discussion

The results presented here indicate that cells subjected to H2O2 exposure convert H2O2 into O2 within a few minutes. This makes the H2O2 exposure considerably shorter and less intense than expected. It may well explain why such high H2O2 concentrations were required to record detectable damages. The conversion of hundreds of micromolar H2O2 into oxygen has the consequence of exposing cells to O2 concentrations higher than that resulting from equilibration of the aqueous medium with air, a concentration already way above physiological oxygen concentrations [2].
The oxidative damages taking place after H2O2 exposure are thought to result for a significant (largest) part from the hydroxyl radical liberated by Fenton’s reaction. However, a surge in superoxide has been associated with exposure to H2O2 [14]. Superoxide results from O2 reduction with a single electron, and is converted into H2O2 by superoxide dismutase. Occurrence of the reverse reaction, with generation of superoxide from H2O2, is not immediately obvious and is expected to be an indirect consequence of H2O2 exposure [15]. Our experiments indicate that a large increase in oxygen concentration is expected to take place at the site of catalase action hence inside the cell. This rise in intracellular O2 would greatly increase the probability of its reduction by leakage of a single electron from cellular metabolism. It may therefore provide a direct explanation for the observed increase in cellular superoxide production.
In our experiments, the equilibration of concentrations was immediate because of the stirring of the cellular suspension necessary for the measurement of cellular oxygen consumption. Consequently, cellular catalase could access added H2O2 within a short time. However, in cells attached at the bottom of a well and surrounded by a still medium, O2 and H2O2 may have restricted diffusion leading to delayed access to catalase. H2O2 may then represent an additional oxygen reserve. Interestingly, the dose response curve showed a rather positive effect of H2O2 at low concentrations, before the deleterious effect took place/dominated [16]. Reactive oxygen species (ROS) signaling might explain this observation but the improvement of cellular bioenergetics by H2O2/catalase mediated O2 supply to mitochondria may also deserve consideration.
At low concentrations of H2O2, a significant proportion escaped from catalase action (Figure 2 and Figure 3). One could easily envision that H2O2 would first titrate all the molecules able to react quickly with it. They would represent a “sink for H2O2”, which includes components of the medium as well as cellular antioxidant defenses. This sink shows highest affinity but limited size (40 nanomoles in our experimental settings). In contrast, catalase shows relatively low affinity but a large activity able to neutralize within a few minutes surrounding H2O2 concentrations approaching the millimolar range, hence a micromole of H2O2 in our settings.
Altogether these observations render the interpretation of H2O2 experiments far more complex than considering a sudden increase in the probability for Fenton’s reaction to occur (Figure 9).
ROS release by mitochondria often leads to considering them as permanent cell threatening ROS generators, checked by antioxidant defenses. Decline of the latter would explain increase in oxidative damage. Mitochondrial superoxide dismutase (MnSOD) quickly converts mitochondrial superoxide, the essential mitochondrial ROS, into H2O2. Then, if the largest part of cellular oxidative damage has a mitochondrial origin, the mitochondrial exposure to H2O2 would be maximal as well as the possible damage. Indeed, coincidence between mitochondrial aconitase inactivation and cell death has been observed [12]. However, when considering exposure to exogenous H2O2, our study indicated protection from H2O2 action of the mitochondrial aconitase. This highlights that the topology is inversed between mitochondrial ROS mediated damage and H2O2 treatment. Possible explanation of the relative immunity of the mitochondrial matrix with regard to exogenous H2O2 could be diffusion limitations [17] or/and large excess in antioxidant defense, the latter expected to be also efficient against mitochondrial H2O2.
In conclusion, one may consider that mitochondria protect themselves and other cellular components from oxygen damage by three different means: avidly consuming oxygen, antioxidant defenses, and contribution to cellular bioenergetics to feed the renewal of damaged components. Mitochondrial impairment would in the first instance downgrade the above-mentioned protective roles. Further degradation would render mitochondria unable to check for their endogenous ROS and, worse, could increase their generation rate. Therefore, mitochondrial ROS release would not cause but rather highlight the decline in cellular bioenergetics and both would contribute cell death.

4. Materials and Methods

All cells were grown at 37 °C with 5% CO2 in media supplemented with 10% fetal bovine serum, 50 U/mL penicillin, and 50 µg/mL streptomycin. CHO-K1 cells (ATCC CCL-61) were grown in Ham’s F-12 medium containing 10mM glucose, 1mM glutamax, and 1mM sodium pyruvate (Gibco 31765-027). Human lymphoblasts (HPB-All, Jurkat, DND, Molt4) were obtained from Françoise Pflumio (CEA, Fontenay aux Roses France) and were grown in RPMI medium (Gibco 61870-010). Human immortalized fibroblast cell lines were established by one of the co-authors (AL) and grown in DMEM with 1mM Glutamax 5mM glucose. For oxygen flux measurements the cells were resuspended in their culture medium after action of trypsin 0.05 g/L in phosphate-buffered saline (PBS) containing 1 g/L EDTA.
Oxygen concentration at 37 °C was monitored with an Oroboros “O2k” (http://www.oroboros.at/index.php?home). Oxygen consumption/production rate was calculated from oxygen concentration variation either with the DatLab software, which averaged rates over 80 s, or by calculation of individual values between two successive measurements (2 s) when fast rates had to be considered (early phase of H2O2 consumption and O2 release). H2O2 solution was prepared each day of experiment from stock solution (Sigma ref. H1009). The concentration was checked by UV absorbance using the extinction coefficient at 240 nm of 46.3 L × mol−1 × cm−1.
To evaluate the impact of H2O2 on the aconitase to fumarase ratio H2O2 was added to CHO cells (approximately 2 × 10e6 cells per mL) incubated in the O2k 37 °C with stirring, and cell sampling was done 30 min after H2O2 addition. The aconitase and fumarase activities were measured in 96 well plates allowing measurement at 240 nm (Greiner Bio-One 675801) with a microplate reader equipped with two injectors (TECAN Infinite M200). Preparation of the plate was as follows: first 20 µL of detergent solution in PBS was introduced in the wells, followed by 20 µL of the cellular suspension in PBS, and, finally, by 50 µL of Tris Buffer 0.5 M pH 7.4. In our study 36 wells were used simultaneously (12 samples in triplicates), and optimization led to 100,000 CHO cells per well with final concentrations of 0.01% digitonin and 0.05% Triton X100 to probe for cytosolic enzymes or cytosolic and mitochondrial enzymes, respectively. The plate was introduced in the plate reader to start the reading protocol for measurement of OD240 nm: (1) Shaking (15 s, 2 mm linear); (2) Four readings (each 60 s) to evaluate the background and stability; (3) aconitase reaction with injection of isocitrate solution 120 mM (25 µL at 200 µL/s), shaking as before, twelve readings (each 40 s); (4) fumarase reaction with injection of malate 250 mM, rest of the procedure as before. Calculation of the aconitase to fumarase ratio was made with the assumption that the OD240 increase summed the rates of aconitase and fumarase reactions, which furthermore shared the same proportionality between OD increase and enzymatic reaction rate.

Author Contributions

Conceptualization, F.B.; methodology, A.L., C.R., and F.B.; investigation, C.R., C.V., and A.L.; writing—original draft preparation, C.R. and F.B.; writing—review and editing, F.B. and A.L.; funding acquisition, F.B. All authors have read and agreed to the published version of the manuscript.

Funding

This research was funded by the Fondation ARC pour la Recherche sur le Cancer, grant number 20131200283.

Acknowledgments

The authors acknowledge the contribution of Mrs Sara Mrabet to experiments on sulfide genotoxicity and mitochondrial DNA qPCR.

Conflicts of Interest

The authors declare no conflict of interest.

Abbreviations

CHOChinese Hamster Ovary
ROSReactive Oxygen Species
MnSODManganese SuperOxide Dismutase (mitochondrial for of SOD)
EDTAEthylene Diamine Tetra-acetic Acid
ODOptical Density

Appendix A

Figure A1. Quantitation of mitochodrial DNA damage: DNA was prepared from CHO cells exposed to Na2S (H2S) or H2O2. qPCR of samples compared with that of a known amount of target sequence allowed absolute quantitation. This quantitative measurement was made either directly with CHO DNA preparation or after eight cycles of a long PCR amplifying a 8Kb fragment of mitochondrial DNA (2976–11031) including the qPCR target sequence (6744–6918). Therefore, after the long PCR the theoretical amplification factor of the mtDNA target sequence is 64 times. The graph represents the experimental amplification factor (Y axis) when cells were exposed to increasing concentrations (X axis) of H2S (empty symbols) or H2O2 (filled symbols). The number of experiments (independent treatment with H2O2 or H2S) is indicated. A log scale is used for both axes with following modifications: H2S values are represented with X values 10% higher than reality, this allows distinction of error bars, the 106 value (1M) Na2S is represented as if 104.
Ijms 21 09149 g0a1

Appendix B

Figure A2. The histogram shows the percentage (Y axis) and the number of publications according to H2O2 concentrations.
Ijms 21 09149 g0a2
Table A1. The list hereafter indicates the PMID identifiers of the articles considered.
H2O2 ≤ 10 µM
20572791
29550333
23044977
9188618
H2O2 range 10–99 µM
17925005
19840190
14981287
12673362
12832847
15830107
17451824
29470430
29208995
10082315
16331539
18463796
21293477
26310930
H2O2 range 100–500 µM
21284033
12195838
25383141
31465957
20072135
28188272
22885031
25279550
19151733
12067712
23484085
14578137
26861269
27105496
31562333
26764141
9012815
22766155
28204825
29983082
18501193
23326372
27582624
31353362
31683554
17879239
26225431
29121706
29386875
18497977
20847286
23519197
9551742
22914987
26991551
29165341
28977633
20559505
11905987
18520066
10409635
14627202
28122344
26898812
29431851
27479053
18003976
31112588
24695490
11558568
25381633
28067784
22796327
15060142
29386875
H2O2 range 501–1000 µM
23349856
25236744
24642881
9453543
24634295
20224152
6292103
30662338
30662323
15138265
22580126
16150148
18954526
H2O2 range > 1000 µM
10846797
22302021
8176261
31783479
30513827
30366994
16101127
22542292
23357941
9422344
8628669
9735602
26555819
25528699
21429293
17085975
20824890
29351805
22208537
29661935
14688260
20566850
16194237
16936020
21176282
30634966

References

  1. Ward, J.F.; Evans, J.W.; Limoli, C.L.; Calabro-Jones, P.M. Radiation and hydrogen peroxide induced free radical damage to DNA. Br. J. Cancer Suppl. 1987, 8, 105–112. [Google Scholar] [PubMed]
  2. Hirai, D.M.; Colburn, T.D.; Craig, J.C.; Hotta, K.; Kano, Y.; Musch, T.I.; Poole, D.C. Skeletal muscle interstitial O2 pressures: Bridging the gap between the capillary and myocyte. Microcirculation 2019, 26, e12497. [Google Scholar] [CrossRef] [PubMed]
  3. Gnaiger, E. Oxygen Conformance of Cellular Respiration: A perspective of mitochondrial physiology. In Hypoxia; Roach, R.C., Wagner, P.D., Hackett, P.H., Eds.; Advances in Experimental Medicine and Biology; Springer: Boston, MA, USA, 2003; Volume 543, pp. 39–55. ISBN 978-1-4613-4753-8. [Google Scholar]
  4. Gnaiger, E.; Lassnig, B.; Kuznetsov, A.V.; Margreiter, R. Mitochondrial respiration in the low oxygen environment of the cell effect of ADP on oxygen kinetics. Biochim. Biophys. Acta BBA Bioenergy 1998, 1365, 249–254. [Google Scholar] [CrossRef] [Green Version]
  5. Benamar, A.; Rolletschek, H.; Borisjuk, L.; Avelange-Macherel, M.-H.; Curien, G.; Mostefai, H.A.; Andriantsitohaina, R.; Macherel, D. Nitrite-nitric oxide control of mitochondrial respiration at the frontier of anoxia. Biochim. Biophys. Acta 2008, 1777, 1268–1275. [Google Scholar] [CrossRef] [PubMed]
  6. Sepasi Tehrani, H.; Moosavi-Movahedi, A.A. Catalase and its mysteries. Prog. Biophys. Mol. Biol. 2018, 140, 5–12. [Google Scholar] [CrossRef] [PubMed]
  7. Nandi, A.; Yan, L.-J.; Jana, C.K.; Das, N. Role of Catalase in Oxidative Stress- and Age-Associated Degenerative Diseases. Oxidative Med. Cell. Longev. 2019, 2019, 9613090. [Google Scholar] [CrossRef] [PubMed] [Green Version]
  8. Shin, S.-K.; Cho, H.-W.; Song, S.-E.; Im, S.-S.; Bae, J.-H.; Song, D.-K. Oxidative stress resulting from the removal of endogenous catalase induces obesity by promoting hyperplasia and hypertrophy of white adipocytes. Redox Biol. 2020, 37, 101749. [Google Scholar] [CrossRef] [PubMed]
  9. Attene-Ramos, M.S.; Wagner, E.D.; Gaskins, H.R.; Plewa, M.J. Hydrogen Sulfide Induces Direct Radical-Associated DNA Damage. Mol. Cancer Res. 2007, 5, 455–459. [Google Scholar] [CrossRef] [PubMed] [Green Version]
  10. Yakes, F.M.; Van Houten, B. Mitochondrial DNA damage is more extensive and persists longer than nuclear DNA damage in human cells following oxidative stress. Proc. Natl. Acad. Sci. USA 1997, 94, 514–519. [Google Scholar] [CrossRef] [PubMed] [Green Version]
  11. Beaumont, M.; Andriamihaja, M.; Lan, A.; Khodorova, N.; Audebert, M.; Blouin, J.-M.; Grauso, M.; Lancha, L.; Benetti, P.-H.; Benamouzig, R.; et al. Detrimental effects for colonocytes of an increased exposure to luminal hydrogen sulfide: The adaptive response. Free Radic. Biol. Med. 2016, 93, 155–164. [Google Scholar] [CrossRef] [PubMed]
  12. Li, Q.-Y.; Pedersen, C.; Day, B.J.; Patel, M. Dependence of excitotoxic neurodegeneration on mitochondrial aconitase inactivation: Mitochondrial superoxide and excitotoxicity. J. Neurochem. 2001, 78, 746–755. [Google Scholar] [CrossRef] [Green Version]
  13. Lagoutte, E.; Mimoun, S.; Andriamihaja, M.; Chaumontet, C.; Blachier, F.; Bouillaud, F. Oxidation of hydrogen sulfide remains a priority in mammalian cells and causes reverse electron transfer in colonocytes. Biochim. Biophys. Acta 2010, 1797, 1500–1511. [Google Scholar] [CrossRef] [Green Version]
  14. Tochigi, M.; Inoue, T.; Suzuki-Karasaki, M.; Ochiai, T.; Ra, C.; Suzuki-Karasaki, Y. Hydrogen peroxide induces cell death in human TRAIL-resistant melanoma through intracellular superoxide generation. Int. J. Oncol. 2013, 42, 863–872. [Google Scholar] [CrossRef] [PubMed] [Green Version]
  15. Biary, N.; Xie, C.; Kauffman, J.; Akar, F.G. Biophysical properties and functional consequences of reactive oxygen species (ROS)-induced ROS release in intact myocardium. J. Physiol. 2011, 589, 5167–5179. [Google Scholar] [CrossRef] [PubMed]
  16. Xie, W.-H.; Ding, J.; Xie, X.-X.; Yang, X.-H.; Wu, X.-F.; Chen, Z.-X.; Guo, Q.-L.; Gao, W.-Y.; Wang, X.-Z.; Li, D. Hepatitis B virus X protein promotes liver cell pyroptosis under oxidative stress through NLRP3 inflammasome activation. Inflamm. Res. Off. J. Eur. Histamine Res. Soc. Al 2020, 69, 683–696. [Google Scholar] [CrossRef] [PubMed]
  17. Lismont, C.; Revenco, I.; Fransen, M. Peroxisomal Hydrogen Peroxide Metabolism and Signaling in Health and Disease. Int. J. Mol. Sci. 2019, 20, 3673. [Google Scholar] [CrossRef] [PubMed] [Green Version]
Figure 1. O2 release upon H2O2 addition. Chinese hamster ovary (CHO) cells suspension at approx. 2 × 10⁶ cells/mL; X axis = time in seconds; left Y axis = recorded oxygen concentration expressed in µM (lines); right Y axis = oxygen flux rate in pmol/(s.mL) calculated over a two second interval (dots); and thick upward black arrow = H2O2 addition performed at time 180 s. The stable negative value of oxygen rate before H2O2 addition is the oxygen consumption due to cellular respiration. Different H2O2 additions are represented: (a) 25 µM (black symbols) or 100 µM (grey symbols) H2O2 in the cellular suspension, (b) 500 µM (black symbols) or 100 µM (grey symbols) H2O2 in the cellular suspension.
Ijms 21 09149 g001
Figure 2. Increase in oxygen content in the medium compared to a full catalase reaction: X axis = time in seconds with addition of H2O2 considered as zero time; Y axis = oxygen release expressed as percentage of the amount expected from a 100% yield for the catalase reaction (O2 = ½ H2O2). The two experiments presented in Figure 2a are in black symbols (+100 and +500 µM H2O2) while those presented in Figure 2b are in grey (+25 µM and +100 µM). Empty symbols represent results obtained when subtracting the oxygen release in the two concomitant chambers, i.e., either 100 − 25 = 75 µM H2O2 or 500 − 100 = 400 µM, with one data point out of ten shown for the sake of clarity.
Ijms 21 09149 g002
Figure 3. Recapitulation of experimental data led to a model for the reaction between H2O2 and CHO cells. CHO cells suspension ranged from 1.5 to 2.2 × 10⁶/mL. (a) X axis = final H2O2 concentration in the medium, Y axis = maximal observed increase in O2 (see Figure 2 for an example); dotted black line = linear fitting according to the equation shown in grey (with values in µM) in the panel upper part; grey lines = released oxygen given by the predicted equation of the model. (b) Expression of these O2 increases as percentage of the value expected from full engagement into catalase reaction, same X axis and symbols as in panel a. (c) Resulting model: upon H2O2 addition, 40 nanomoles H2O2 are immediately engaged in reactions not leading to O2 release; the rest of H2O2 is subjected to catalase action.
Ijms 21 09149 g003
Figure 4. Influence of cell density on O2 release. X axis = concentration of CHO cells exposed to a single addition of 500 µM H2O2. (a) Time delay to reach the maximal O2 increase, inverse to the reaction rate. (b) O2 release in µM with dotted grey lines figuring the values corresponding to a 50% and 100% yield of O2 recovery from the catalase reaction (125 µM and 250 µM).
Ijms 21 09149 g004
Figure 5. High initial rates of O2 reflect the catalytic efficacy of catalase reaction. Y axis = initial O2 release rate determined over 10 to 40 s after H2O2 injection; (a) X axis = H2O2 final concentration after injection; CHO-K1 cells suspension were in the range 1.5 to 2.2 × 10⁶ cells/mL; thick grey line = CHO-K1 cellular oxygen consumption (≈60 pmol O2/(second × 106 cells) given for comparison’s sake; dotted line = linear fitting, which suggested the absence of saturation up to 1 mM H2O2. (b) The catalase initial rate after 500 µM H2O2 injection was determined with eight different cell lines. X axis = endogenous cellular oxygen consumption rate (respiration) before the single 500 µM H2O2 addition. The different cell types are listed according to increasing X values: human lymphoblasts (HPB-All, Jurkat, DND, Molt4), human immortalized skin fibroblast, CHO-K1 ± SD (n = 21 more data than in (a), cell density from 0.35 to 2 × 10⁶ cells/mL), osteosarcoma 143B, and human neuroblastoma (SH-SY5Y). The dotted line represents linear fitting with values Y = 14x + 75 with R2 = 0.94.
Ijms 21 09149 g005
Figure 6. Evaluation of cellular oxidative stress using the aconitase to fumarase ratio in CHO cells exposed to H2O2. Y axis = aconitase to fumarase ratio; X axis = H2O2 concentration. (a) Empty bars = values observed in cells treated with digitonin (cytosolic activities); filled bars = values observed in cells treated with Triton X100 (both cytosolic and mitochondrial activities); values expressed as mean ± SD; the number of independent experiments is indicated at the bottom of the histogram bars. (b) Single experiment with the concentration of H2O2 raised to 1 mM; values expressed as mean and SD of the wells observed in that experiment.
Ijms 21 09149 g006
Figure 7. Absence of impact of H2O2 on CHO cells respiration. Y axis = cellular oxygen consumption after H2O2 had been exhausted and expressed as percent of the initial rate (rate recorded just before H2O2 addition). (a) X axis = lag time between H2O2 addition and measurement oxygen consumption rate; black triangles refer to concomitant control experiments (without H2O2). (b) X axis = amount of H2O2 injected in the experiments represented in panel a.
Ijms 21 09149 g007
Figure 8. Absence of impact of H2O2 on the respiration is common to different cells. Oxygen consumption rate after H2O2 had been exhausted is expressed in % of the reference rate for cells exposed to 500 µM H2O2; values expressed as mean ± SD; CHO-K1: 21 preparations of CHO-K1 with cell density ranging from 0.35 to 2.08 × 10e6 cells per mL. Others: 7 preparations of the cell lines used in Figure 5b (one value per cell line cell and density ranging from 0.86 to 3 × 10⁶ cells per mL).
Ijms 21 09149 g008
Figure 9. Scenario for H2O2 mediated oxidative damage. Top: normal cellular physiology, endogenous oxygen metabolism is essentially devoted to mitochondrial ATP generation (1). This and other oxygen using enzymes generate oxygen radicals (2) and a vast majority is eliminated by antioxidant defenses. Some oxidative damages (Damages) occur and cellular bioenergetics contributes to their reparation resulting in a steady state with no accumulation of oxidative lesions. Bottom: addition of H2O2 (high µM) has three immediate consequences: it increases the probability of Fenton’s reaction (3), H2O2 reacts within seconds with existing reactive molecules and annihilates the existing antioxidant defenses (4), and H2O2 concentration drops abruptly through action of cellular catalase. This increases greatly the intracellular O2 concentration (5) and hence endogenous oxygen radicals production (2). On one side oxygen radical generation is increased (2 and 3) and on the other side antioxidant defenses are invalidated (4). This is expected to generate oxidative damages at rates exceeding repair: they accumulate and become detectable and may result in cell death.
Ijms 21 09149 g009
Publisher’s Note: MDPI stays neutral with regard to jurisdictional claims in published maps and institutional affiliations.

