2.1. Screening of ILs
Because of their unique and attractive properties, ILs have been efficiently applied in the separation of several bioactive compounds from plant materials. Moreover, previous studies have suggested that parameters including the structures of ILs, the cations, and/or anions of ILs influence the extraction efficiency of specific compounds [
25,
26]. In their study, Han et al. [
20], suggested that the cation and anion have a large influence on the extraction efficiency of phenolic compounds from
Laminaria japonica Aresch. In this regard, three ILs containing 1-butyl-3-methylimidazolium as cation and Tf
2N
−, PF
6−, and BF
4− as anions were evaluated to examine the effect of these anions on the simultaneous extraction of D and DA. The extraction experiment was performed by stirring 1 g of dried and powdered roots of
A. gigas with a known volume (6 mL) of ILs at room temperature (20 °C) and 500 rpm for 2 h. Afterwards, the extracts were filtered and then analyzed via HPLC according to the HPLC method depicted in
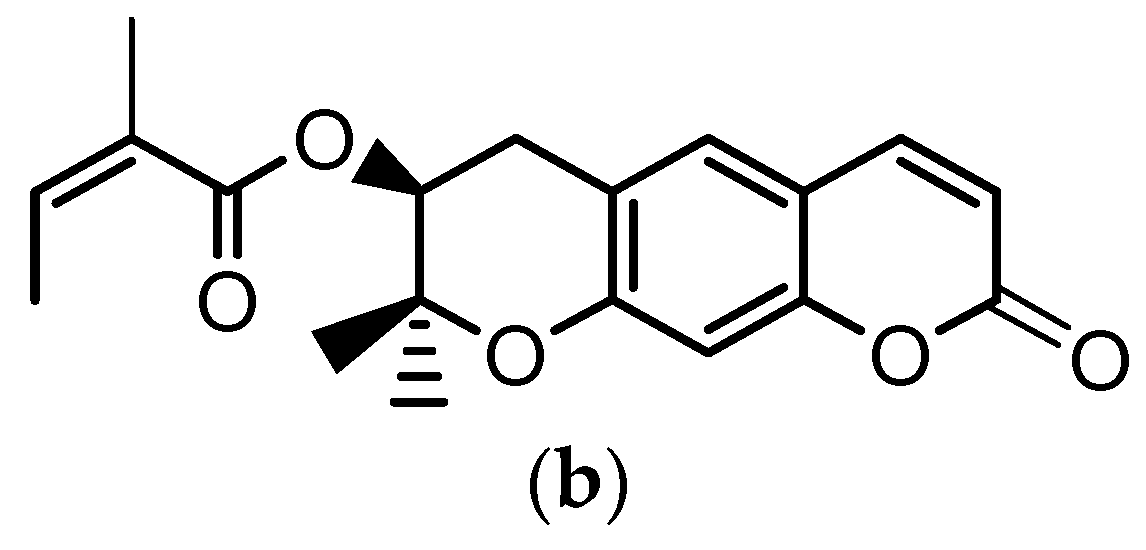
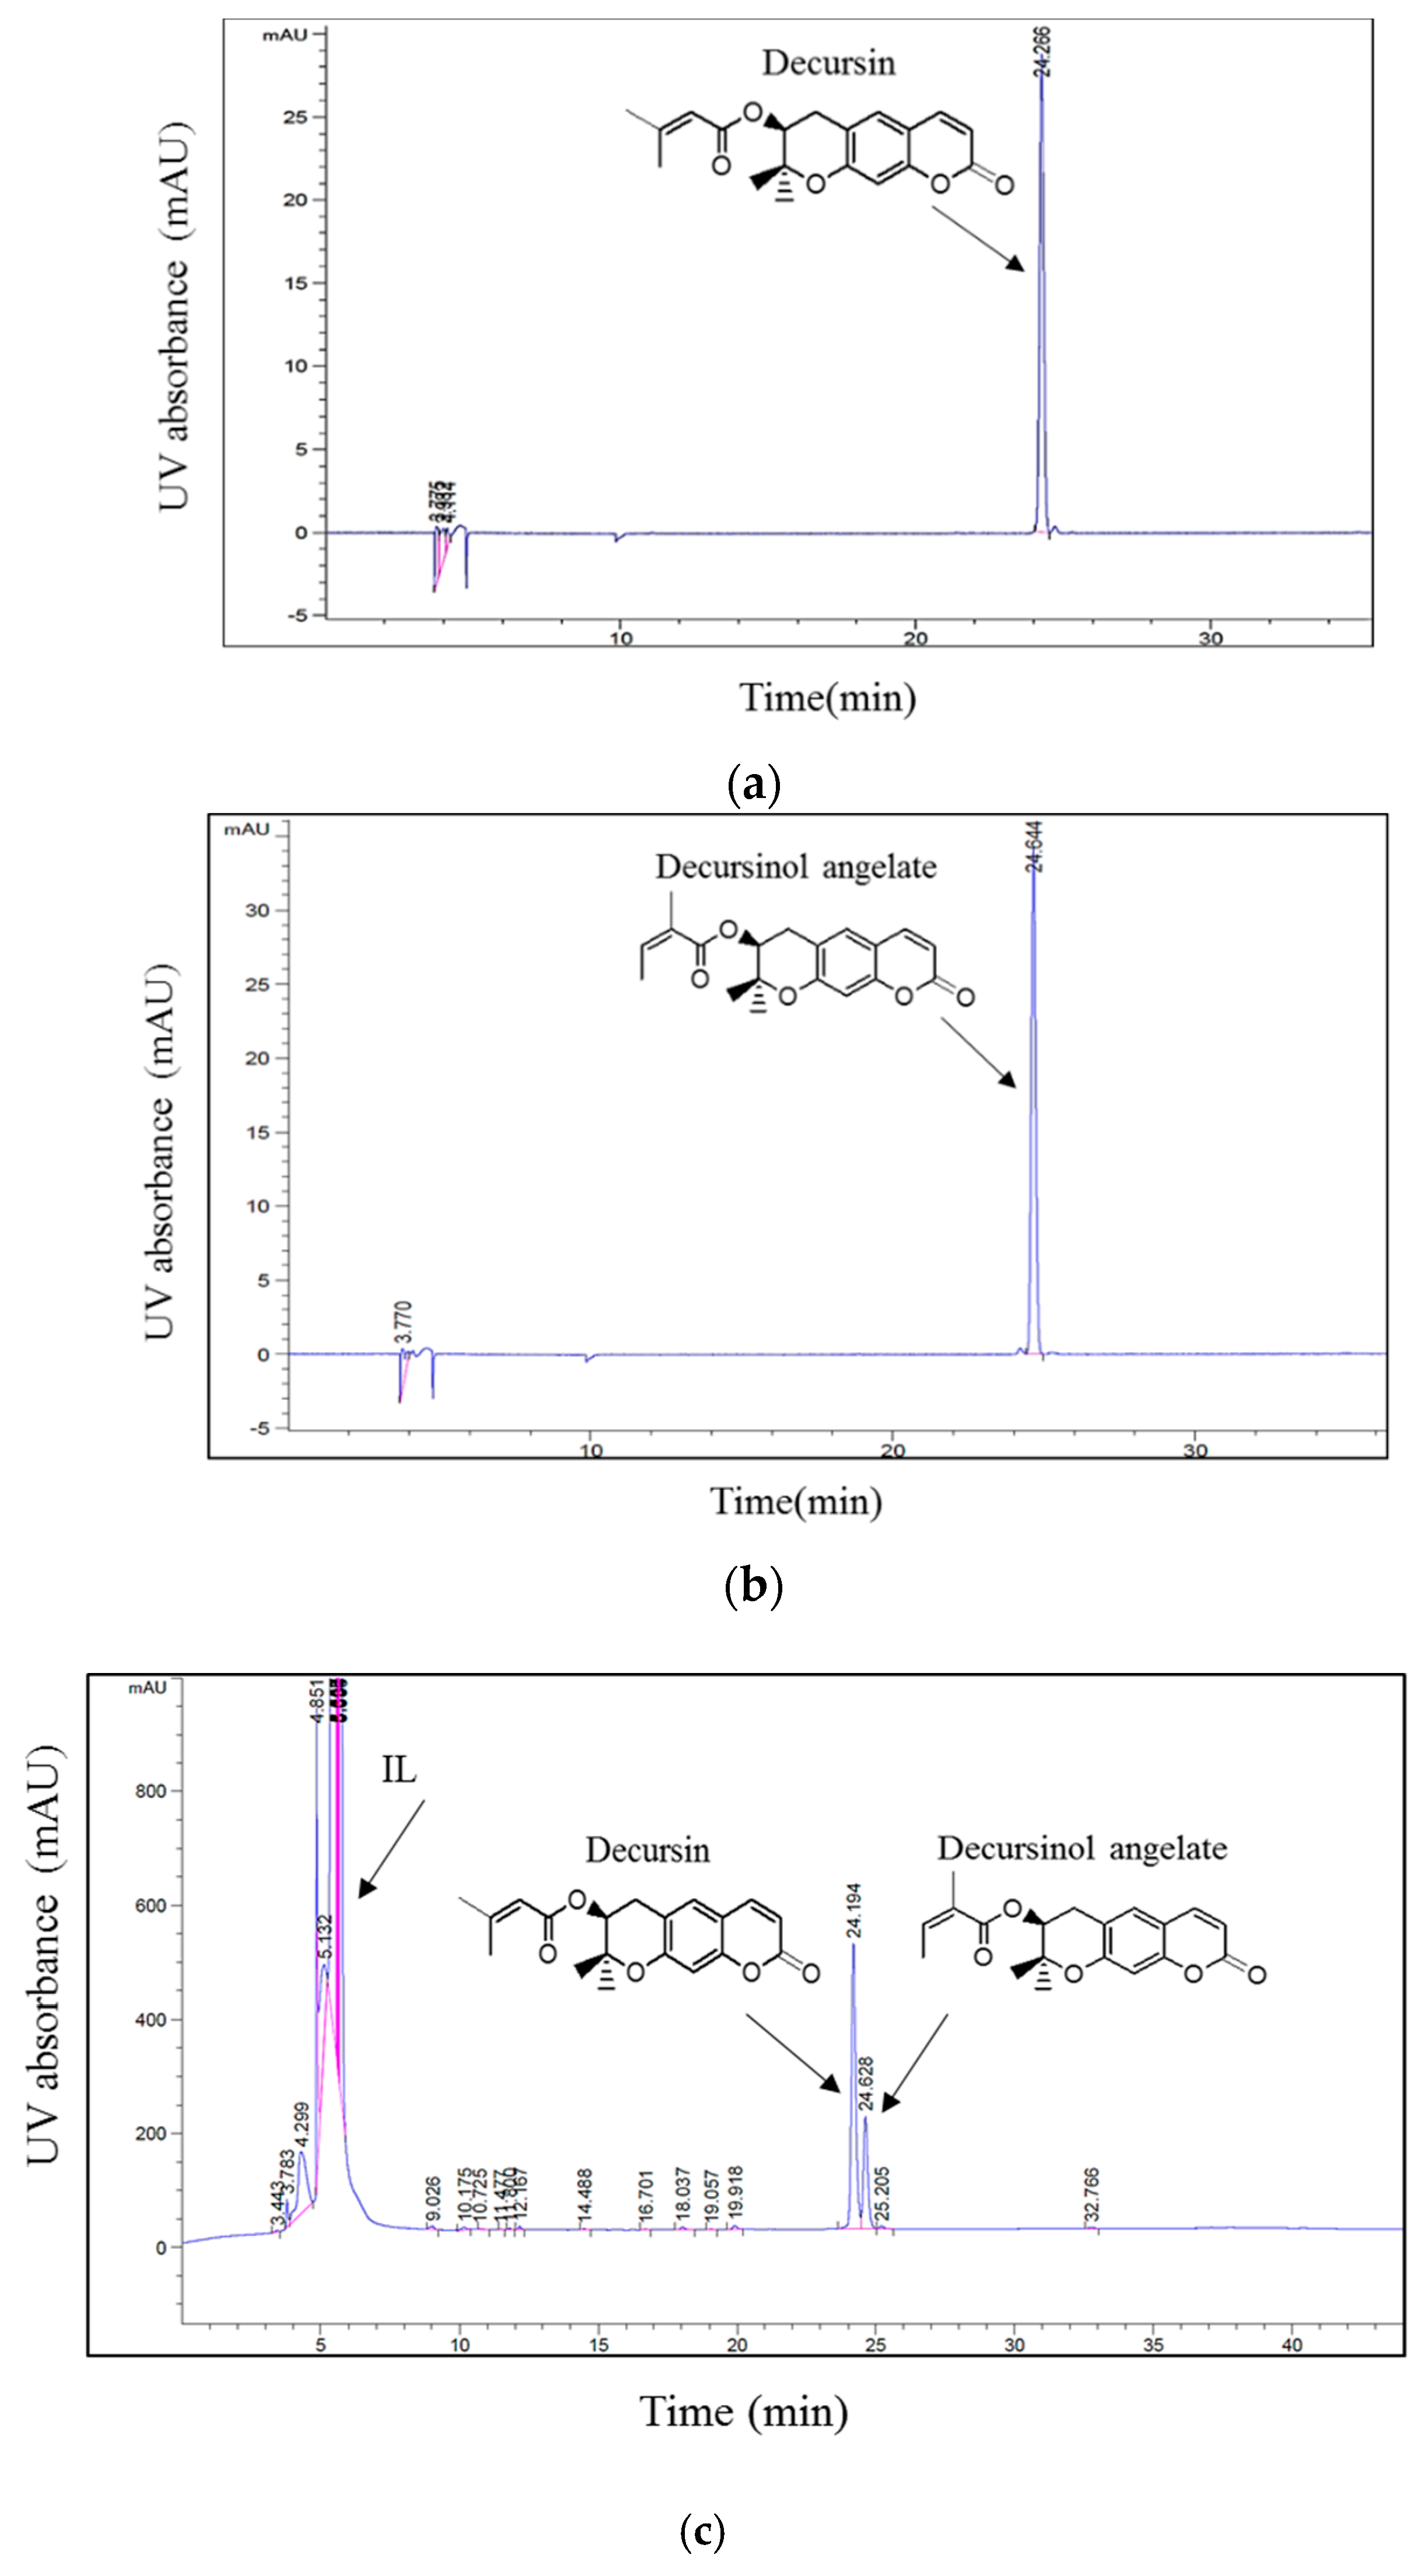
Section 3.2. The chromatographic peaks of D and DA in the
A. gigas–IL extraction solutions were confirmed by comparing their retention times and UV spectra with those of the reference standards in
Figure 2.
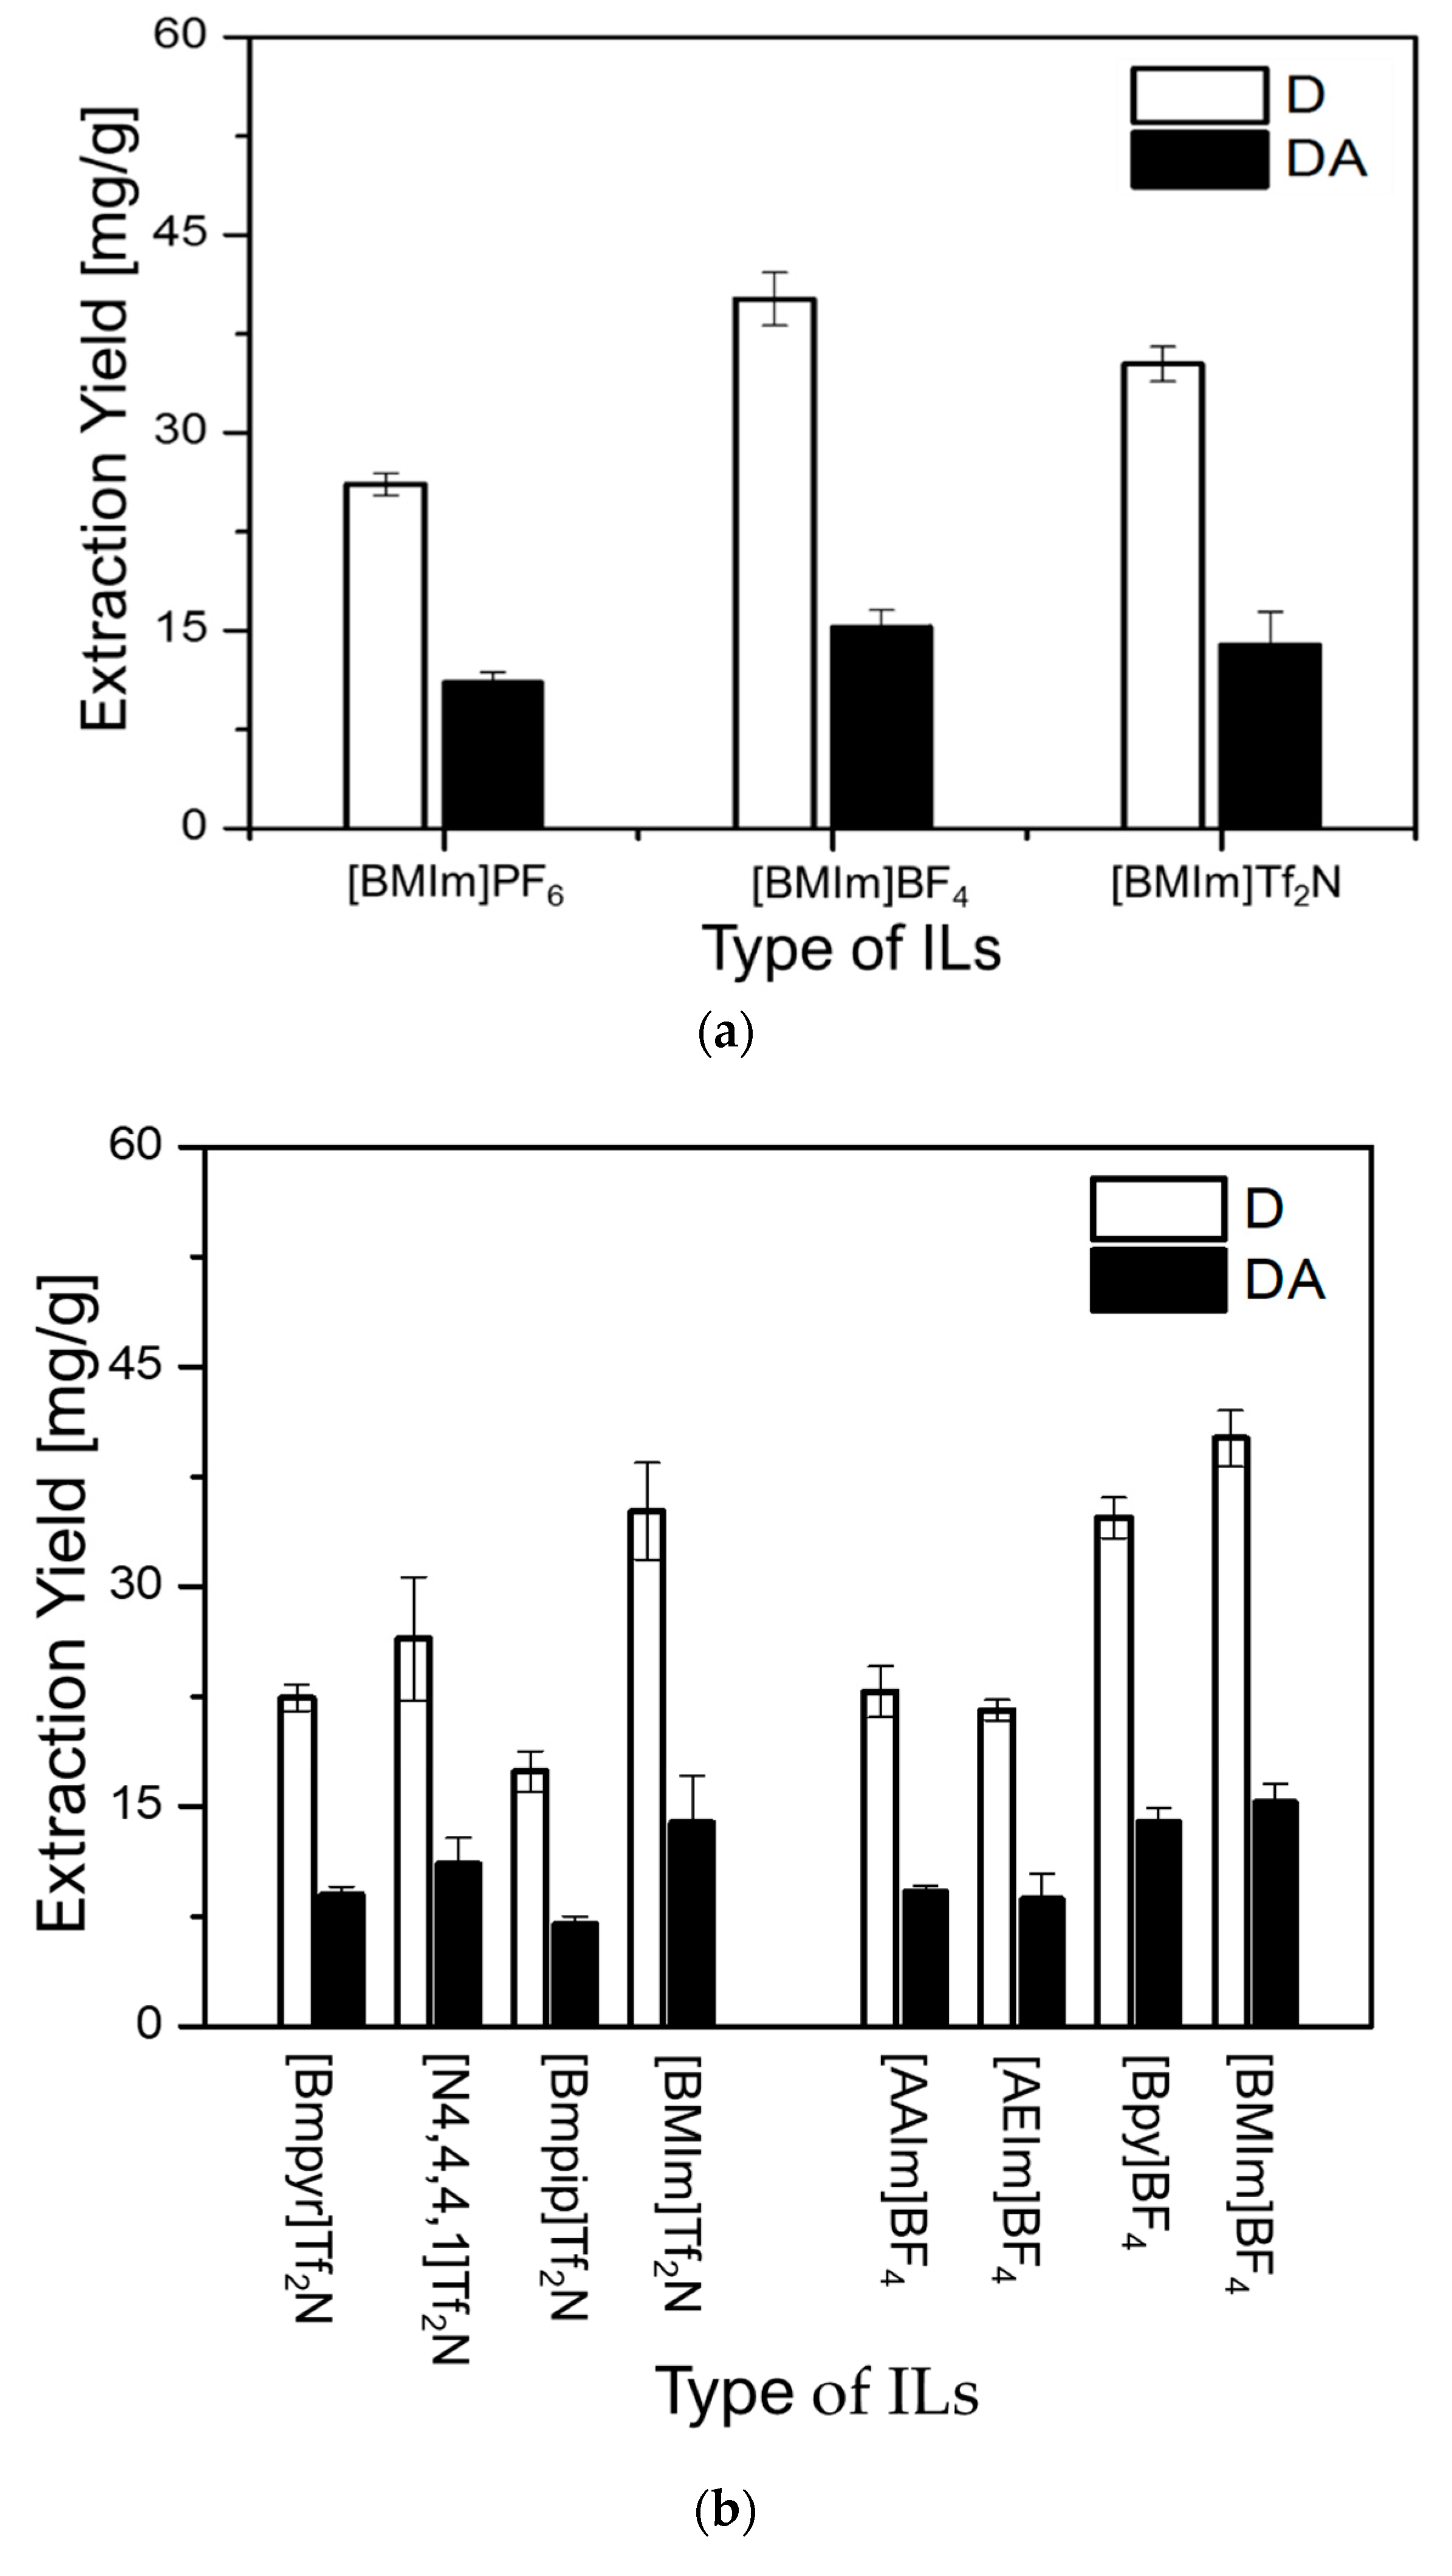
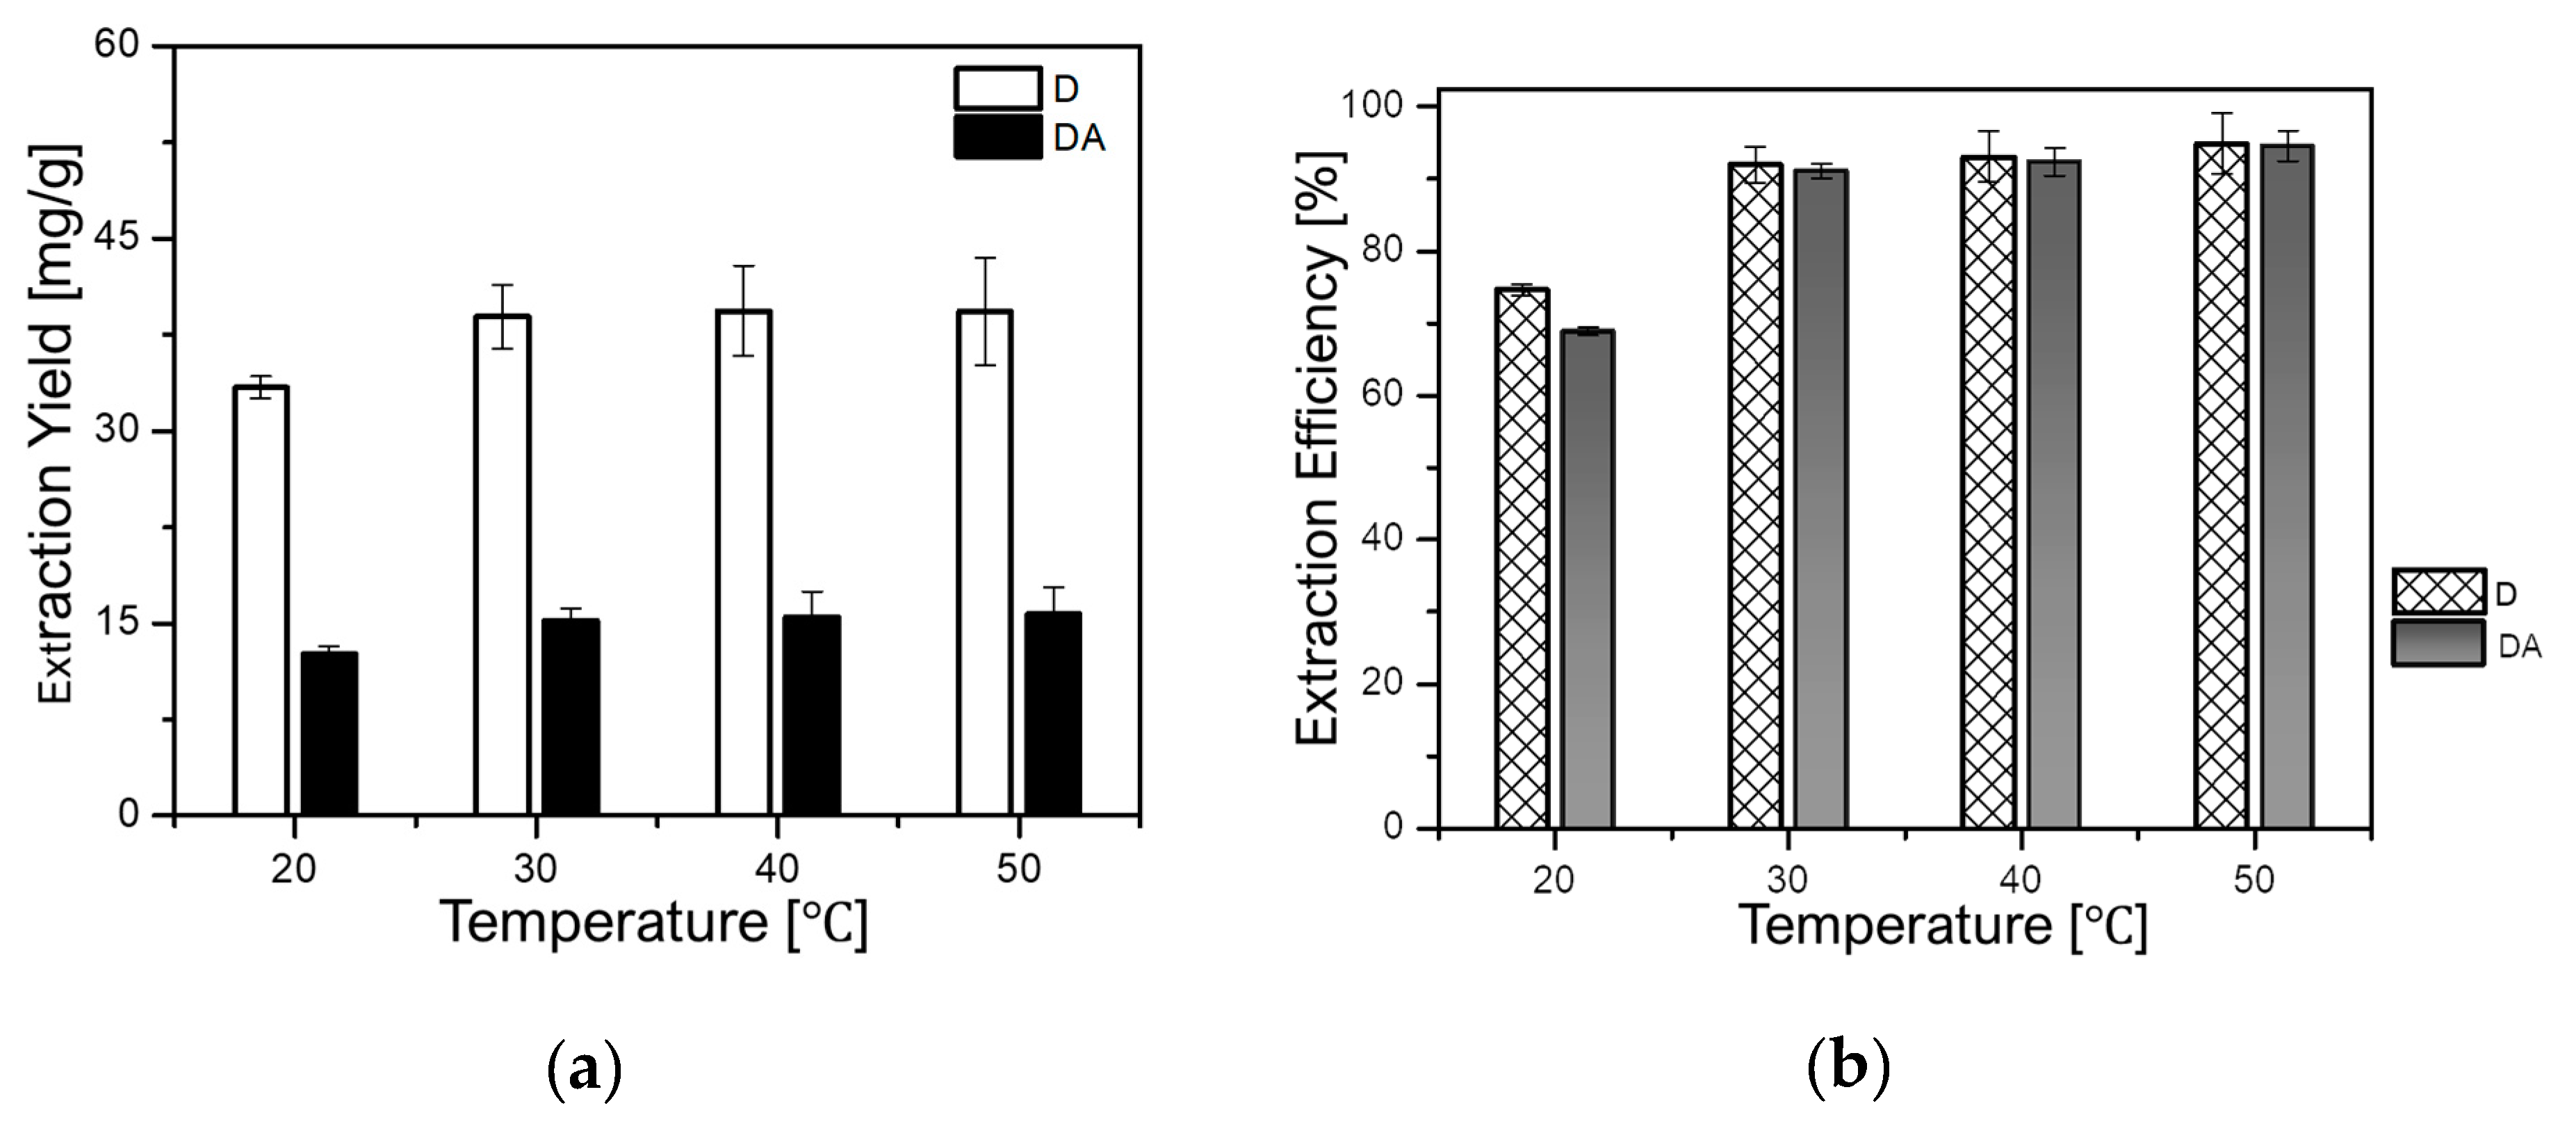
As can be observed in
Figure 3a, (BMIm)BF
4 revealed the highest extraction capacity for both D (D = 40.12 mg/g) and DA (DA = 15.27 mg/g), followed by (BMIm)Tf
2N (D = 35.00 mg/g and DA = 13.90 mg/g) and (BMIm)PF
6 (D = 26.10 mg/g and DA = 11.06 mg/g), respectively. Because, (BMIm)BF
4 and (BMIm)Tf
2N demonstrated better extraction efficiencies for both D and DA, their respective anions BF
4− and Tf
2N
− were further investigated. Using these anions, BF
4– and Tf
2N
−, ILs with distinct cations were evaluated to investigate the effect of their cations on the extraction yields of D and DA. As can be seen in
Figure 3b, the greatest extraction ability of 40.12 mg/g for D and 15.27 mg/g for DA was obtained with (BMIm)BF
4. It was also found that (Bpy)BF
4 (D = 34.70 mg/g and DA = 13.94 mg/g), and (BMIm)Tf
2N (D = 35.00 mg/g and DA = 13.90 mg/g) possess similar ability to extract both D and DA. However, other ILs showed very low ability to extract D and DA. Based on these results, it was concluded that the cations and anions of ILs simultaneously influence the extraction yields of D and DA.
2.3. Optimization of Extraction Condition by Response Surface Method (RSM)
Fifteen runs were conducted using RSM (Box–Behnken experimental design) to investigate the interaction between three variables: extraction time, temperature, and the solid-to-liquid ratio. The extraction time ranged from 30 to 120 min, the temperature from 20 to 60 °C, and the solid-to-liquid ratio from 1 g/4 mL to 1 g/8 mL. These conditions were set based on the results obtained from the previous section. The experimental conditions as well as the obtained responses are depicted in
Table 1. In addition, below are the second-order polynomial equations for the determination of the extraction yields of D (Y
D) and DA (Y
DA); Y
D = −81.4555 + 0.309886A + 0.686104B + 79.2225C + 2.2428A
2 − 0.011615B
2 − 11.2171C
2 + 0.00096AB − 0.056AC + 0.08575BC (Actual
R2 = 99.33% and Adjusted
R2 = 98.12%) and Y
DA = −94.5399 + 0.4458A + 0.812312B + 83.5383C − 1.79012A
2 − 0.0109156B
2 − 11.6538C
2 − 3.7500AB − 0.07844AC + 0.0822500BC (Actual
R2 = 99.27% and Adjusted
R2 = 97.96%). Herein, A represents the extraction time, B the temperature, and C the solid-to-liquid ratio. The regression coefficient (
R2) and the probability (
p-value) were used to confirm the quality and significance of the results.
Table 2 List of the
F-values and
p-values calculated from the model. As can be seen in
Table 2, the
F-values for D and DA were 82.02 and 75.65, respectively, and the
p-values were inferior to 0.0001. The observed high
F-values and the lower
p-values indicate that the developed model was significant and that the chance for the model
F-value of this size to occur as the statistical noise was less than 0.0001%. The values of “lack of fit” of
p-values and
F-values (0.117 and 7.72 for D, and 0.117 and 11.85 for DA, respectively) indicate that the lack of fit was not significant. Generally, values of probability less than 0.05 or greater than 0.01 indicate that the model terms are significant or not significant. In this model, linear coefficients A, B, and C; quadratic term coefficients B
2 and C
2, and cross product coefficients AC and BC were significant with
p-values inferior to 0.05. However, quadratic term coefficient A
2 and cross product coefficient AB were not significant. Based on the overall obtained results, the model was confirmed very satisfactory.
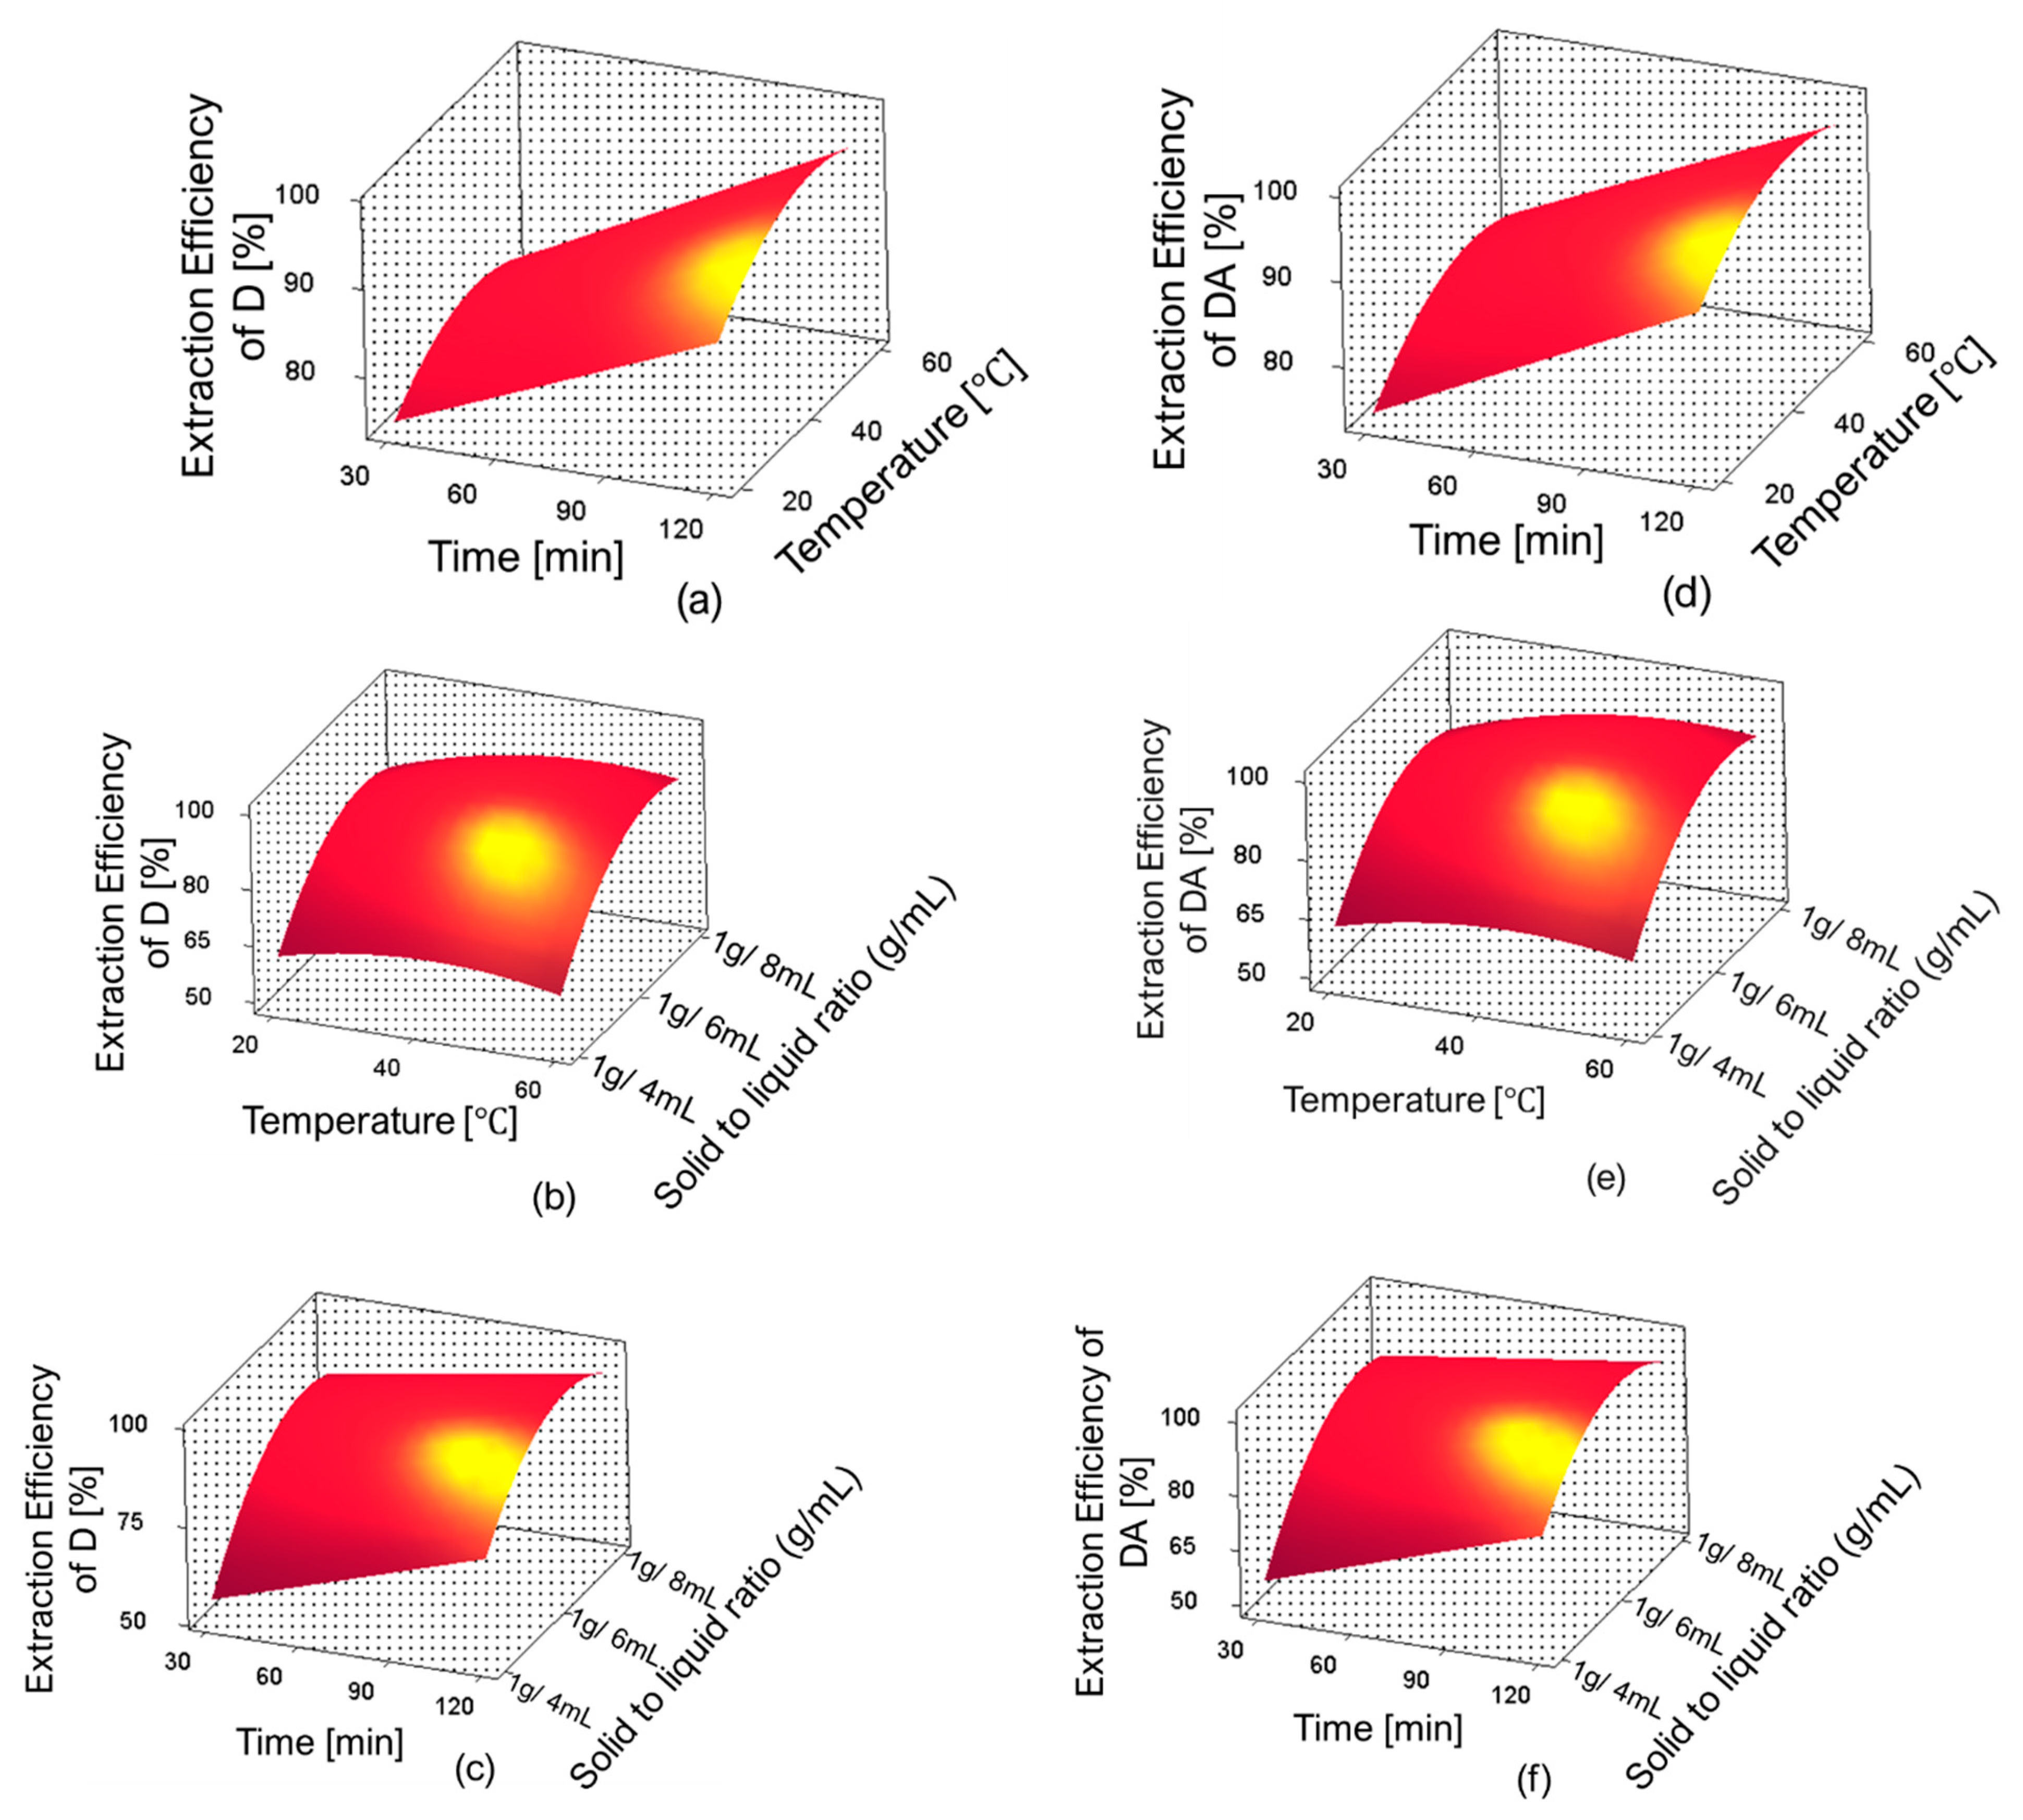
The three-dimensional response surface plots for D and DA extraction efficiency are shown in
Figure 7. In these figures, one can observe the influence of independent variables and their interactions on the extraction efficiencies of D and DA. The optimum extraction conditions proposed by the RSM were: extraction time 120 min, temperature 59.98 °C, and solid-to-liquid ratio 1 g/6.46 mL; the predicted extraction yields were 43.74 mg/g (98%) for D and 18.03 mg/g (97.99%) for DA. However, the predicted conditions were slightly adjusted for the validation experiments as follows: extraction time 120 min, temperature 60 °C, and solid-to-liquid ratio 1 g/6.5 mL.
2.6. Drowning out Crystallization of D and DA from A. gigas–(BMIm)BF4 Extraction Solution
Drowning out crystallization experiments were performed in order to recover D and DA from the A. gigas–(BMIm)BF4 extraction solutions. Herein, the experiments were conducted using various anti-solvents (MeOH, EtOH, EA, IPA, and DW) at a randomly selected A. gigas–IL extraction solution to anti-solvents ratio of 1:5 (v/v) at 20 °C and 200 rpm for 5 h. As result, crystal could not be yielded when MeOH, EtOH, EA, and IPA were used as anti-solvents. However, precipitates were obtained when DW was used as an anti-solvent. The obtained precipitates were analyzed by means of HPLC to determine whether D and DA were recovered well from the IL extraction solutions and to evaluate their purities. From the HPLC analysis results, the rates of recovery of D and DA as well as their total purity exceeded 80%.
Furthermore, the correlation between the supersaturation level and the selective crystallization of D and DA was investigated to determine the reason influencing the occurrence and non-occurrence of D and DA crystallization when different anti-solvents were utilized. Supersaturation is the difference between the initial and the equilibrium concentration (solubility) of a certain compound. It is assumed as the driving force to induce crystallization. The supersaturation can be expressed as supersaturation level (S) and expressed as S~C
I/C
eq. Here, C
I indicates the initial concentration and C
eq the equilibrium concentration. Generally, spontaneous crystallization occurs at supersaturated state when S > 1; however, when S < 1, it is an undersaturated state; therefore, a spontaneous crystallization cannot be induced. Additionally, crystallization is impossible when S = 1 because the solution is in the saturated state, at this state, equilibrium is maintained. This shows that crystallization can occur only at a supersaturation level consistently higher than 1 [
38,
39].
Table 5 presents different values of D and DA supersaturation levels (S
D and S
DA) when different anti-solvents (MeOH, EtOH, and DW) were used. The result revealed the reason why crystallization was possible exclusively when DW was applied as anti-solvent. The fact that S
D and S
DA were lower when MeOH and EtOH were used as anti-solvents is presumed as the causes leading to the non-occurrence of precipitation. However, the high supersaturation levels, S
D = 5.28 and S
DA = 46.6, respectively, observed for D and DA when DW was the anti-solvent, impacted the crystallization of D and DA from the IL extraction solutions. This is because these supersaturation levels were satisfactory to induce spontaneous nucleation of target compounds, and consequently, their crystallization. Moreover, the simultaneous high supersaturation levels observed for both D and DA were assumed to influence their simultaneous nucleation, thus, the obtention of D and DA solid mixture.
In addition, drowning out crystallization experiments were carried out using various ratios of
A. gigas–(BMIm)BF4 extraction solution to DW compositions (1:1, 1:3, 1:5, 1:10, 1:15, 1:20) to evaluate the effect of DW composition ratios on the crystallization behavior and recovery of both D and DA. The initial concentrations of D and DA in the
A. gigas–(BMIm)BF4 extraction solution were 6.22 mg/mL and 2.631 mg/mL, respectively. The temperature and the rotational speed were 20 °C and 200 rpm, respectively. From the results, it was found that when the ratio of
A. gigas–(BMIm)BF
4 extraction solution to DW was set to 1:1 (
v/
v), precipitates could not be induced even after three days of solution stirring. In addition, when the ratio of
A. gigas–(BMIm)BF
4 extraction solution to DW was set to 1:3 (
v/
v), precipitates were obtained after 20 h of solution stirring: however, in a much lower yield. Nevertheless, when the ratios of
A. gigas–(BMIm)BF
4 extraction solution to DW were set to 1:5, 1:10, 1:15, and 1:20 (
v/
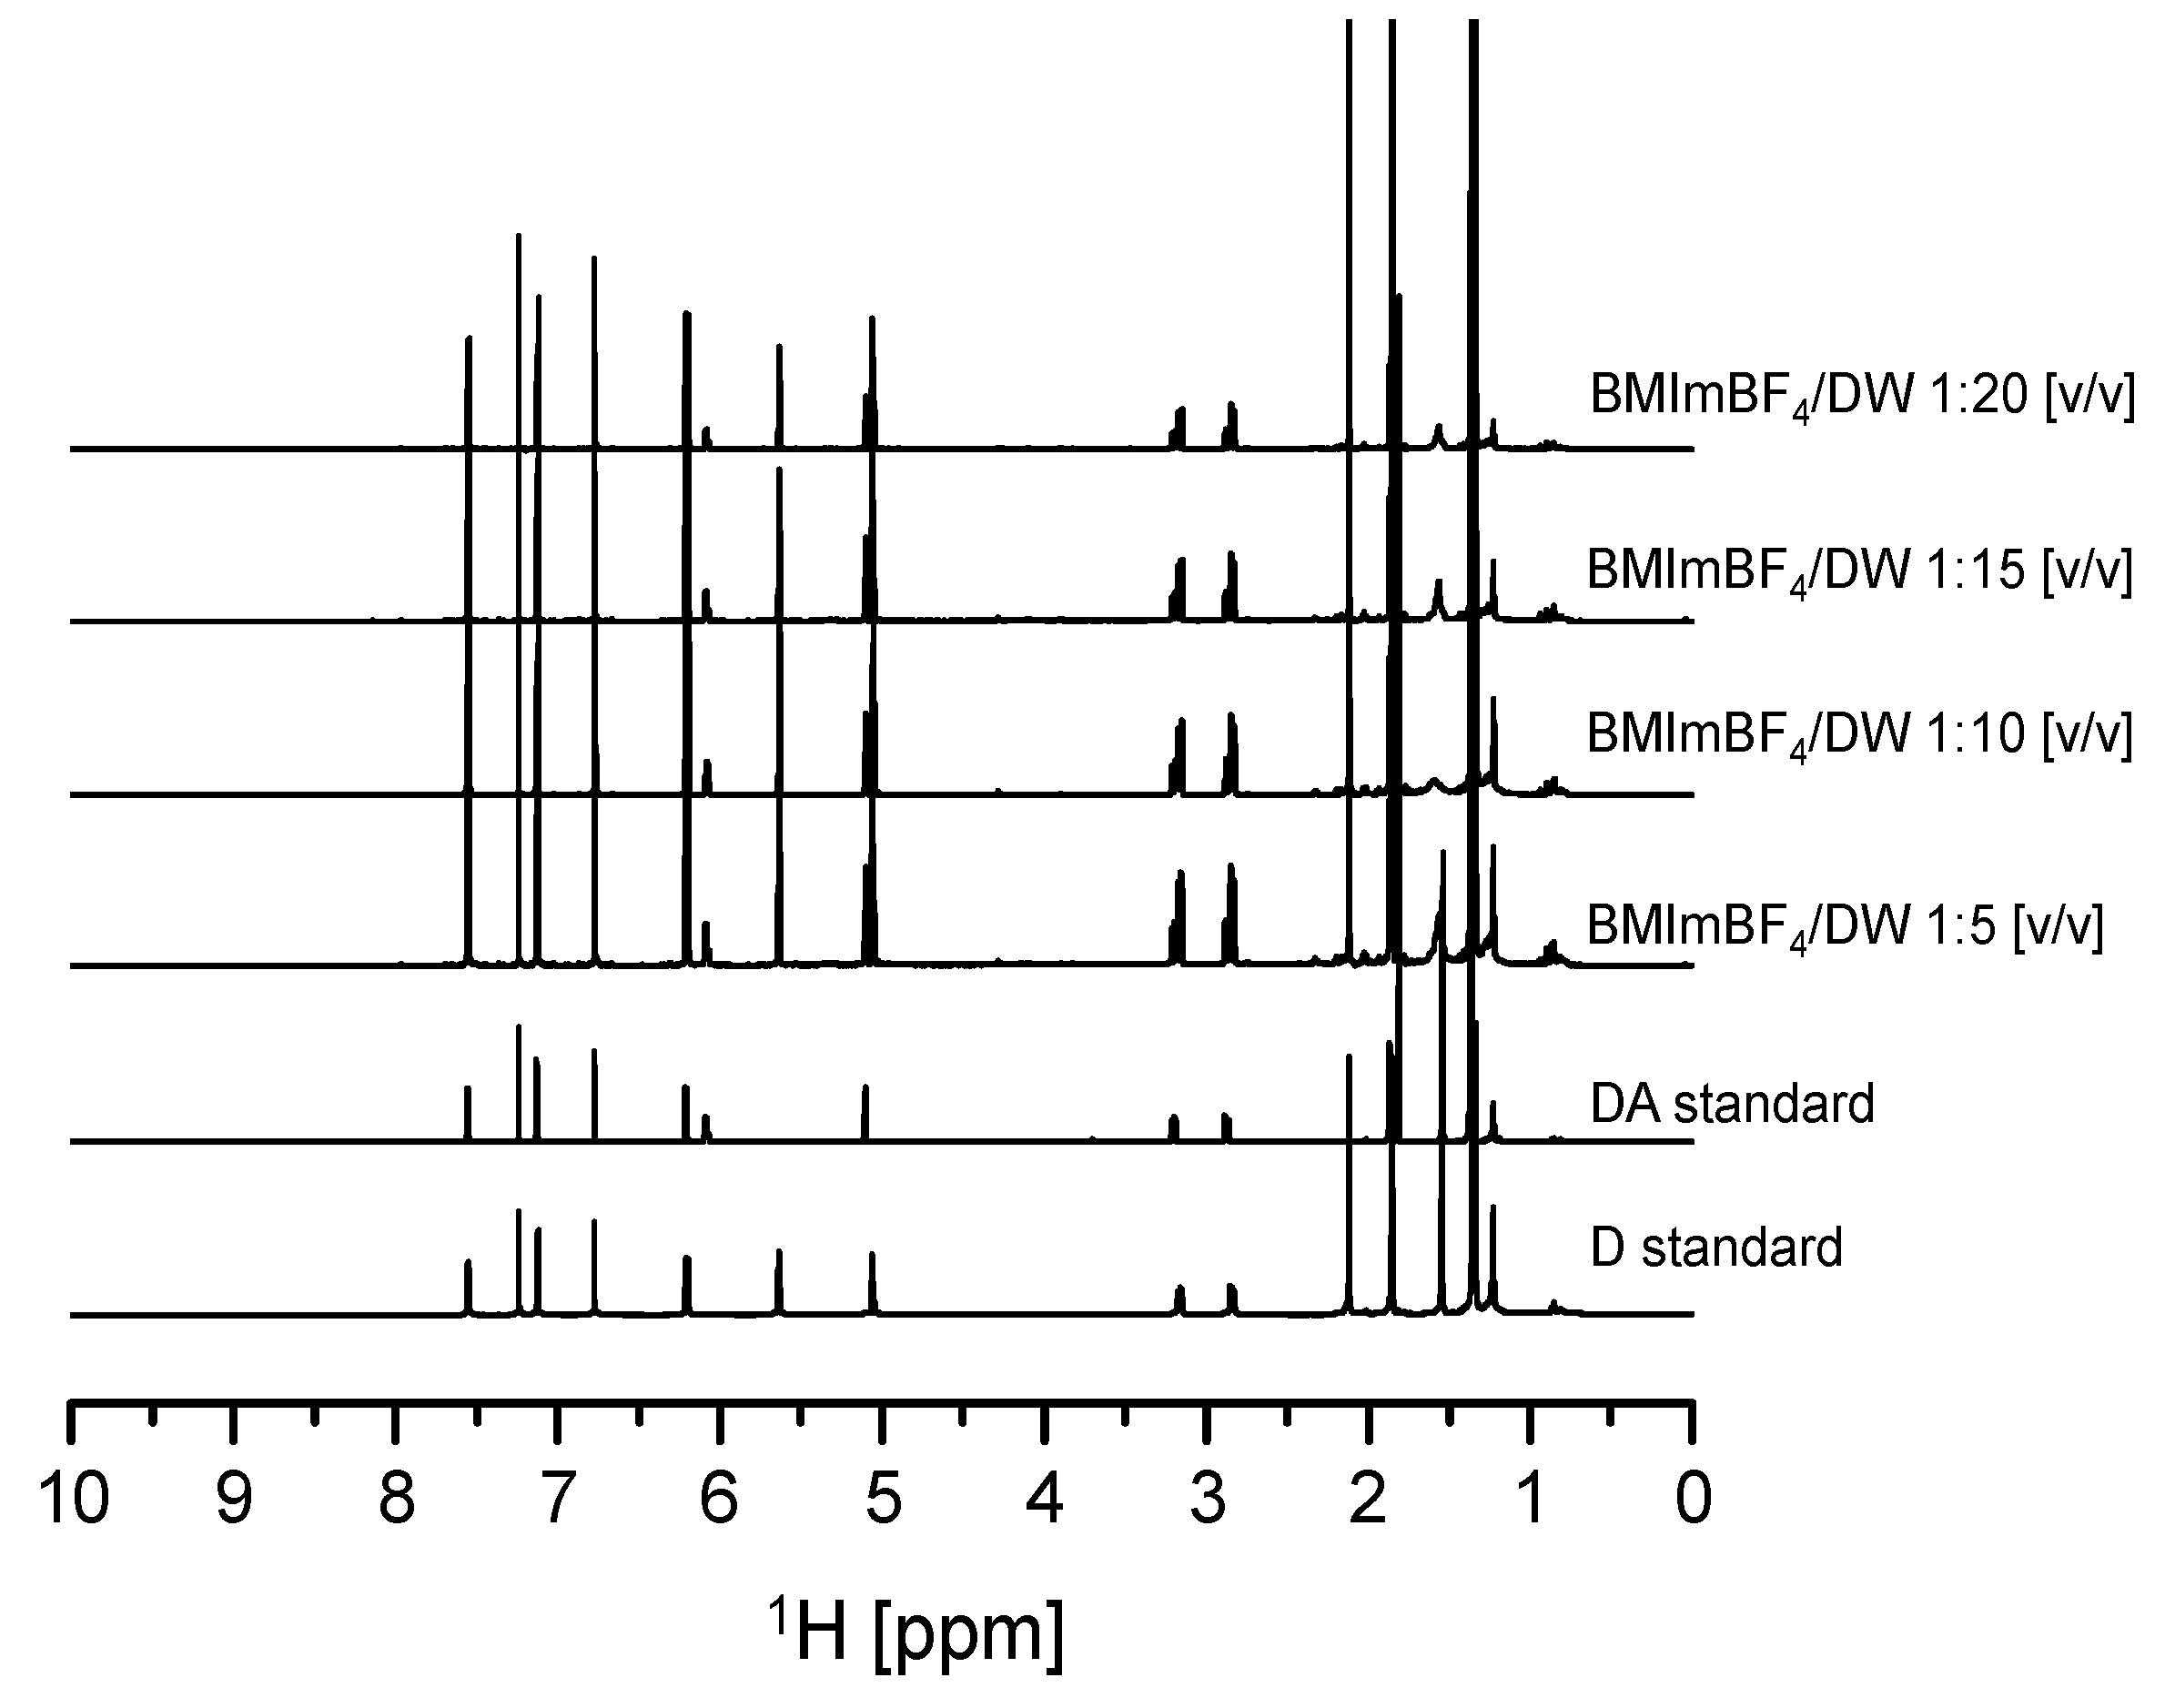
v), large quantities of solid materials could be induced very rapidly within only one to five hours of stirring. The obtained solid materials were analyzed via solution-state 1H-NMR as presented in
Figure 8. From the solution-state
1H-NMR data presented in
Figure 8, it was ascertained that the solid materials obtained in this work were mixtures of sole D and DA precipitates.
The
Table 6 presents the supersaturation level profile for D and DA monitored when the crystallization was induced at different ratios (1:1, 1:3, 1:5, 1:10, 1:15, and 1:20) of
A. gigas–(BMIm)BF
4 extraction solution to DW. These results deduced the reason leading to the non-occurrence of crystallization at the ratio 1:1 and to the occurrence of small product quantity at the ratio 1:3. As seen in
Table 6, at the ratio of 1:1, the S
D and S
DA were 1.01 and 1.07, respectively. Although, these supersaturation levels (S) were greater than 1 (S > 1), they are assumed inadequate to induce spontaneous nucleation of D and DA, and consequently, the reason for the non-occurrence of crystallization at this ratio. In addition, the supersaturation levels (S) for D and DA were S
D = 1.77 and S
DA = 1.83, respectively, at 1:3 ratio. These supersaturation levels (S) were considered capable to induce spontaneous nucleation of both D and DA. Thus, crystals formation was possible at this ratio. Moreover, as shown in
Table 6, very high supersaturation levels (S), exceeding 4.5, were monitored for both D and DA at 1:5, 1:10, 1:15, and 1:20 ratios. Hence, the large supersaturation levels observed at these composition ratios were assumed to provoke the rapid and simultaneous precipitation of D and DA.
Table 7 illustrates the rates of recovery of D and DA at different ratios (1:3, 1:5, 1:10, 1:15, and 1:20) of
A. gigas–(BMIm)BF
4 extraction solution to DW. The obtained result showed that crystallization was not induced when the ratio was 1:3; however, it was greatly achieved at ratios greater than 1:5. As can be seen in
Table 7, the rates of recovery of D dramatically improved from 43.41% to 79.74%, and those of DA dramatically improved from 45.25% to 81.75% at 1:3 and 1:5 ratios, respectively. The rates of recovery of D increased from 90.35% to 97.42% when the ratios were set to 1:10 and 1:15, respectively. Also, the rates of recovery of DA increased from 95.82% to 97.71% at ratios of 1:10 and 1:15, respectively. At last, the rates of recovery of D and DA at 1:20 were recorded as D = 96.62% and DA = 98.09%, respectively. The increase of D and DA recovery rates was attributed to the change in their supersaturation levels when the ratio of DW was increased (
Table 6).
Moreover, the total purity of D and DA in products obtained at 1:5, 1:10, 1:15, and 1:20 ratios of
A. gigas-(BMIm)BF
4 extraction solution to DW was determined. These ratios were selected as they demonstrated high recovery of D and DA. The results are illustrated in
Table 8. As can be observed in
Table 8, the average total purity of D and DA was of approximatively 97% in the products.
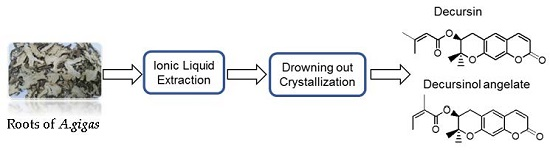
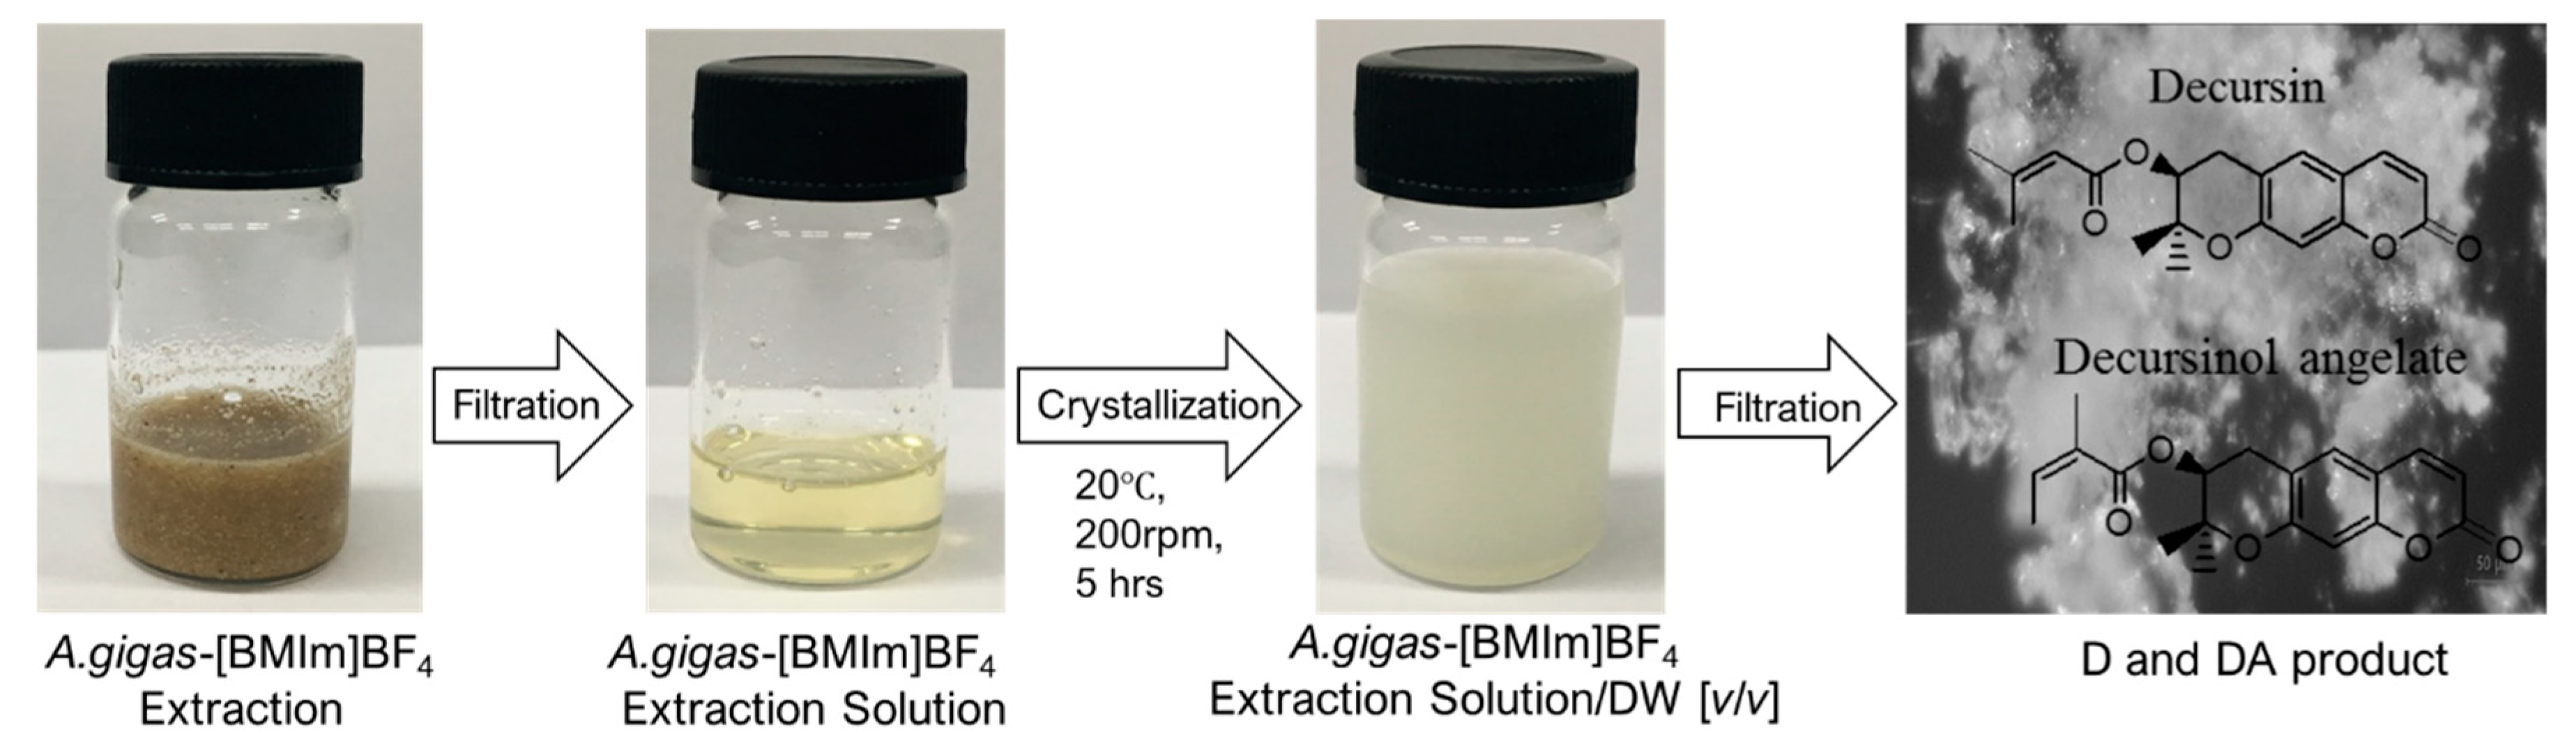
From this study, an efficient and adequate method for the rapid and selective separation of D and DA from
A. gigas using (BMIm)BF
4 as extraction solvent and DW as anti-solvent was developed. Only these ratios of
A. gigas–(BMIm)BF
4 extraction solution to DW, 1:5 1:10, 1:15, and 1:20, were found favorable to produce D and DA with high yields and high purities. The separation scheme of D and DA from
A. gigas using IL ((BMIm)BF
4) as extraction solvent and drowning out crystallization for the recovery of D and DA is illustrated in the
Scheme 1.


 ,
, 


