Abstract
The impact of carbon emissions on corporate financial performance within the African corporate setting has remained open and inconclusive, owing primarily to the unavailability of data. However, this paper examines the effect of carbon emissions (Scope 1, Scope 2, and Scope 1 and 2) on the financial performance (ROE, ROI, and ROS) of 63 South African CDP companies for the 2015 fiscal year. Using multiple regression techniques, the paper found overwhelming evidence of a negative relationship between carbon emissions and corporate financial performance. Thus, results indicate that companies which integrate green investment initiatives designed to lower carbon emissions can effectually manage financial performance. Therefore, the paper provides useful insights on how companies can fully utilise their organisational resources and capabilities as well as gain insight, resulting in a higher environmental and financial performance within a firm.
1. Introduction
Recently, challenges including the destruction of the natural environmental, excessive employment of the natural resource base, and expanded pollution by dangerous carbon elements has prompted new policies not only by governments but by both local and global companies. Such policies have led to the adoption of sustainable development as an essential principle that is critical for the implementation of specific activities at both the macro and micro economic level. Climate change threatens life of a global scale, both in developing and developed countries [1]. Evidence suggests than anthropogenic practices, especially the use of non-renewable energy sources, have contributed to growing carbon emissions, thereby increasing financial, social, and environmental effects on a global scale. Thus, if policies are not implemented immediately to combat the effects of climate change, associated consequences will only grow more severe. However, there is a current lack of knowledge amongst most companies as to what effect practices designed to diminish carbon emissions have on corporate financial performance. Traditionally, green investment activities have been accused of incurring financial losses for a company [1,2,3]; however, others have argued that green investments can improve overall firm profitability [4,5]. Irrespective of what companies perceive about this debate, stakeholders have also raised concerns regarding growing carbon emissions. Thus, a failure for firms to address these issues is no guarantee of their continued success or existence.
As seen throughout the world, growing carbon emissions will likely pose acute social, economic, and environmental negative externalities in South Africa unless mitigative practices are implemented to stabilise this condition. For example, CDP [6] states that up to 80% of energy used by South African corporate entities is derived from coal, a fossil fuel. The Department of Environmental Affairs [7] has shown that the categories which have added 95% of South Africa’s greenhouse gas are energy firms, road transport firms, manufacturing industries, and construction firms (solid fuels). To demonstrate how carbon emissions have grown in South Africa, IndexMundi [8] valued the amount of carbon emissions through gas fuel use at 8694.46 kilo tonnes as of 2011; however, this number was 0.00 kilo tonnes in 1960. Copans [9] has highlighted that South Africa is the leading emitter of carbon emissions in Africa, producing three times more emissions than the rest of Africa combined. In light of these high carbon emission levels, studies on the association between emissions and corporate financial performance are vital both from a social platform and in terms of evaluating firm conduct. In the past, environmental challenges have been the responsibility of government intervention; these issues were largely viewed as incompatible aspects between social and private advantages. Nonetheless, if financial performance is negatively associated with the level of carbon emissions, companies should aim to lessen environmental damage resulting from their operations, encouraging market approaches to improve issues related to the natural environment.
Recently, several studies within an African and/or South African context have scrutinised corporate environmental and/or green activities [10,11]. Nonetheless, little or no research has been implemented regarding carbon emissions, particularly the various dimensional effects of carbon emissions (Scope 1, Scope 2, and Scope 1 and 2) on corporate financial performance. This paper addresses this current research void. Thus, the uniqueness of this analysis regarding carbon emissions can provide findings which are imperative for both African policy makers and businesses to adopt, leading to additional efforts for initiatives which preserve the natural environment from a direct and indirect corporate context. In addition, an increasing number of South African companies now publish their data on carbon emissions in annual integrated reports as well as reports to entities such as the CDP, providing new avenues in which to implement rigorous research on the connection between carbon emissions and firm financial performance.
The study adopts an institutional theory to explain corporate behaviour in cognisance of both internal and external green interest pressures. Because the emissions of these companies have been made available (which are disaggregated to Scope 1, 2, and 1 and 2), the study employed a multiple regression analysis to investigate the influence of these forms of emissions on diverse firm financial performance indicators (Return on Equity, Return on Investment and Return on Sales) on 63 CDP South African companies. The study found overwhelming evidence of a negative relationship between carbon emissions and corporate financial performance. Thus, the findings of the paper support the conclusion that companies that integrate green investment initiatives designed to lower carbon emissions are able to effectually manage financial performance.
This paper is organised as follows: Section 2 evaluates the theoretical framework of the paper. Section 3 discusses the debates on carbon emissions and firm financial performance. Section 4 describes the research methodology. Section 5 presents the study findings and discussion. Section 6 presents the conclusion of the study.
2. Institutional Theory
Institutional theory addresses the intense and more resilient issues of a social framework; it considers the procedures through which models, regulations, values, norms, and schemas become relevant as authoritative benchmarks for corporate social conduct [12]. In this case, use of the theory allowed an investigation into how these aspects are developed, communicated, and implemented over space and time as well as how they lose momentum along with disuse. Although, according to Institutional theory, an apparent motive would be to establish stability along with order, the management teams of companies inevitably subscribe to not only consensus and conformity but they also engage with matters of conflict and transformation in social frameworks [13]. Organisational forces are seen as a regulatory body on the interests, goals, and desires of an individual, thereby shaping scenarios for action; such forces may also influence a specific course of action, resulting in continual adoption or transformation [14,15,16]. In this vein, a vital constituent of the social environment affects how institutions are organized, in which organisations have “regulative, normative, and cognitive structures and activities that provide stability and meaning for social behavior” [17]. In this regard, regulative instruments are rules, legislations, or other forms of regulations; normative structures refer to social as well as professional standards. Cognitive frameworks are largely connected to issues of culture as well as ethics [18]. Thus, organisational green pressures from outside interested parties send signals to companies to introduce behaviours that address such demands [19,20,21,22]. This procedure is assumed to be recursive as well as self-reinforcing; accordingly, an organisational science of reasoning is represented in and conducted by individuals and is reflected in their conduct as well as the instruments and technology they employ. To that end, some individual behaviours strengthen current conventions, while other actions change them. Moreover, goals and objectives can be taken from one scenario and used in other settings, while technologies can also be utilised multi-purposively, enhancing an overall concern for human involvement and decision-making [23,24,25], “Institutional theory is thus concerned with regulatory, social, and cultural influences that promote survival and legitimacy of an organization rather than focusing solely on efficiency-seeking behavior” [26]. Therefore, there is a greater need to achieve high goals about corporate greening through eliciting changes in the overall mindset; an equal need is felt in the increased integration of green-based initiatives among companies on a global scale, making such initiatives institutionalized over time [27,18].
3. Literature Review: Carbon Emissions and Firm Financial Performance
This section covers policies which are influencing carbon emissions in a corporate context in both South Africa and on a global scale, examining empirical studies on the relationship between emissions and company financial performance.
3.1. Policies Affecting Carbon Emissions in South Africa.
In light of the ever-growing importance of minimising carbon emissions as well as recognising the potential advantages connected with a green-based society, the government of South Africa has incorporated strategies aimed at lowering carbon emissions to 34% and 42% by 2020 and 2025 respectively [28,29]. The adoption of the carbon tax system could be perceived as one of the most important direct steps in lowering emissions at a national level. Thus, the proposed carbon tax initiative indicates a relevant approach which is designed to communicate essential price signals to transform consumer anti-green behaviours; it also intends to motivate investor appetites towards low-carbon-based practices. According to Fin24 [28], the carbon tax initiative has a proposed regulation which includes the marginal rate of R120 per ton of CO2 emitted. The report further emphasises that the government proposal allows for an initial 60% tax-free allowance until the year 2020, at which point the tax will be charged on 40% of emissions. A further 10% allowance is associated with process emissions and trade-exposed sectors, respectively. A 5% allowance will be given to companies which control their emissions at below industry average figures; a 5% to 10% allowance will be awarded to South African-oriented and approved mitigating practices, along with a 5% tax break for firms which take part in the early stages of carbon tax budgeting. Fin24 [29] also has reported that these carbon offset legislations were designed by inputs from the Department of Environmental Affairs, the National Treasury, and the Department of Energy; they aim to stimulate companies to invest in green initiatives that produce both quantifiable and verifiable carbon emission reductions. Such projects also promote the creation of employment prospects, a reduction of land damage, and foster the preservation of biodiversity. In this regard, within the South African context, factors such as energy consumption, the Gross Domestic Product (economic growth), and trade are associated with high emissions [27]; hence, stringent green economic policies at the industrial level are imperative to manage the growth of emissions.
3.2. Empirical Study Results and the Development of the Hypothesis
Greening represents an important practice that corporations must exercise; such a practice has benefits beyond those of producing goods for profit. In this context, companies are expected to implement activities that mitigate natural environmental damage, enhance its preservation, and promote its recovery. However, the debate concerning carbon emissions and corporate financial performance has not yet resolved. Some schools of thought have postulated that the relationship between emissions and firm financial performance is negative, while others argue that it is positive, with others hinting that it is mixed. Conflicting discussions continue. The findings of Narayan and Sharma [4] suggest that both the mean-variance investor and the constant relative risk aversion (CRRA) investor in carbon emissions trading are characterised by a high utility and can generate supernormal financial returns through forecasts produced from a forward return framework. Kopidou et al. [30] confirmed that the two major drivers of reduced carbon emissions and employment were financial performance indicators, namely economic growth concerns and resource intensity issues. Hayami et al. [31] demonstrated that firms that generate less waste tend to produce high corporate financial performance. Furthermore, Philip and Shi [5] postulated that financial risk corporate management teams that utilise state-dependent hedge ratios to manage carbon emissions portfolio risks on the market could generate superior hedging financial gains. Cucchiella et al. [20] applied an econometric framework on the control of emissions using several Italian companies; the findings suggested that inclusion of an EMS (Environmental Management System) along with improved control of emissions spurred a firm to increased profitability through a combination of heightened demand and productivity. Concurrently, using data gathered from 941 publicly traded US manufacturing companies as well as the adoption of multilevel hypothesis testing approaches, Lucas and Noordewier [21] demonstrated that environmental management practices in dirty along with non-proactive industries generated a positive marginal impact on firm financial performance thanks to the introduction of pollution control initiatives. That effect was also found to be greater in dirty sectors than in clean and proactive corporate settings.
In addition, Lee and Min [32] evaluated the effect of green research and development investment on environmental and financial performance using Japanese manufacturing companies (from 2001 to 2010) and reported a negative relationship between green research and development investment and carbon emissions. They concluded that companies must control emissions to acquire high financial performance. Gallego-Álvarez et al. [24] examined the influence of carbon emissions on corporate financial performance of 89 companies for the period 2006–2009 and posited that a reduction of carbon emissions increased corporate financial returns. Lee et al. [33] studied the effect of carbon emissions in conjunction with environmental research and development investment on corporate financial performance of 362 companies from 2003 to 2010, reporting that an increase in carbon emissions lowered the value of a company. Likewise, Zhang and Wang [25] investigated the factors that motivate industrial companies to engage in carbon emission reduction (CER) within their industrial chains, looking specifically at Chinese energy intensive industries. Their findings highlighted that reporting as well as overall activities that lower carbon emissions improved economic performance through improved environmental performance settings. Lastly, Nishitani et al. [34] explored the impact of minimising carbon emissions on the economic performance of Japanese manufacturing firms over the period 2002–2008, explaining that lowering scopes of emissions increased economic value (e.g., productivity, demand of products, etc.).
However, another group of scholars produced contradicting results. For instance, Salahuddin et al. [2] highlighted that economic growth generated no significant short or long term impact on carbon emissions. A study by Yu et al. [35] revealed that there was no significant relationship between environmental efficiencies (investment in emissions abatement, emissions saving, monetary saving, direct emissions, indirect emissions) and operational efficiencies (research and development expense, total assets, sales, net income, number of employees, and cost of goods sold) in all six of the industrial sectors under analysis. Additionally, Wang et al. [3] discovered that carbon tariffs (designed to lower emissions) negatively impacted the financial performance of firms in developing economies, thereby threatening the long-term survival of such firms. Concurrently, Dragomir [36] highlighted that financial information was unrelated to firm environmental performance data; numerous reports were characterised with unexplained numerical values as well as methodologies that lacked consistency. Mao and Zhang [37] explored 12 Chinese business departments (from transportation, machinery, electronic sectors) and argued that low carbon integration enhanced company environmental performance; however, it was found to hinder company financial performance. In addition, Rokhmawati et al. [38] analysed the impact of carbon emissions, environmental performance (EP), and social performance (SP) on financial performance (FP) on Indonesian companies; results indicated a positive relationship between carbon emissions and Return on Assets (ROA).
Research has also demonstrated a mixed relationship. For example, Chan et al., [19] illustrated that emissions trading had no effect on cement, steel, and iron industries; however, it produced a positive impact on material costs (related expenses on abidance to emissions constraints or other parallel green programs) along with revenue in the power sector. In the same context, Jia et al. [39] reported that, on average, corporate emissions announcements produced significant effects on carbon expected financial gains; however, they generated a weak impact on price volatility. Moreover, another study examined the extent to which carbon emissions and financial performance developed a relationship within UK FTSE-350-listed firms [40]. Results indicated that monetary metric indicators (e.g., profits, assets) showed a clear inverted U-shape (environmental Kuznets curve) when compared to ratio-oriented measures (Return on Equity, TOBIN’S Q). These results indicated that there was a non-linear relationship between emissions and corporate financial performance; the association initially increased but subsequently decreased after company performance reached a set level. Damert et al. [14] surveyed the factors and long-run performance results of company carbon policy within 45 leading enterprises from the steel, cement, and automotive sector in 2008 and 2013; findings showed that activities to minimise carbon emissions had no association with long-term improvements in carbon performance, despite their relationship to long-term financial returns. Gonenc and Scholtens [15] argued that, for fossil fuel companies (chemicals, oil, gas, and coal), environmental outperformance (over the studied period, 2002–2013) does not influence chemical firm financial performance, diminishes both returns and risks for coal companies, produces mixed effects in oil and gas financial returns, and minimises financial risks in gas and oil companies. Misani and Pogutz [41] used a non-linear approach to investigate environmental results and procedures on corporate financial performance using carbon-intensive firms (from the CDP from 2007 to 2013); they concluded that companies acquired their highest financial returns when their carbon performance was intermediate, that is, neither high nor low.
This study has disaggregated carbon emissions into Scope 1, Scope 2, and Scope 1 and 2. Therefore, from the foregoing literature review, the following research hypotheses are suggested:
H1:
The intensity of Scope 1 carbon emissions (CE1 intensity) generate an effect on firm financial performance.
H2:
The intensity of Scope 2 carbon emissions (CE2 intensity) generate an effect on firm financial performance.
H3:
The intensity of Scope 1 and 2 carbon emissions (CE1 and 2 intensity) generate an effect on firm financial performance.
4. Research Methodology
This paper examines the relationship between carbon emissions and corporate financial performance. Thus, the paper will investigate how the intensity of these dimensions of carbon emissions (Scope 1, 2, and 1 and 2) impact corporate financial performance indicators (ROE, ROI, and ROS). The developed hypothesis will be analysed using multiple regression techniques. To confirm the heteroscedasticity assumption of regressions, the paper utilised the heteroscedasticity-robust standard error estimates [33]. Moreover, the research also analysed multicollinearity of the study variables using variance inflation factors, which were found to be less than 10, showing evidence of non-multicollinearity. The issue of non-multicollinearity as also supported by the pairwise-correlations of variables which indicated that most correlations were very low and not close to one.
4.1. Sample
Data related to corporate carbon emissions was acquired from the CDP South Africa 2015 report. From this report, the study acquired a sample of 63 companies from various sectors. These 63 companies were the only firms which disclosed their carbon emissions data in the country, in accordance with CDP demands. Although disclosure of emissions to the CDP is voluntary, it is consistent with the overall demands of users, regulatory bodies, and standard-setters. Analysis of the sample separated dirty sectors from clean sectors. The distinction between dirty and clean sector was previously implemented [16,42] by ranking diversified industries based on their emissions per unit of output. In this case, the paper considered clean and dirty sectors to improve the analysis of the impact of emissions on firm financial performance based on both sectoral and overall capacities, particularly because the emission output levels of these industries varies according to sector. According to their classification, the dirty sectors in this study include: Materials (16 firms), Healthcare and Pharmaceuticals (1 company), Industrial (5 companies), and Energy (2 companies). The clean sectors include: Financial (18 firms), Consumer Staples (12 firms), Health Care, including distribution and service (2 firms), Consumer Discretionary (4 firms), and Telecommunications (3 firms). In total, 39 firms were determined to be clean, with 24 determined to be dirty.
4.2. Dependent Variables
This paper relied on corporate financial performance data with a one year time lag (that is, data relating to the 2015 fiscal year), using three identifiable accounting indicators of firm financial performance. The study used a Return on Equity (ROE), which can be viewed as an indicator of corporate shareholder return [43,44]. The study utilized a Return on Investment (ROI) indicator, which considered equity capital contributed by shareholders as well as borrowed capital through investor groups [45]. Finally, Return on Sales was also considered as it illustrated market analysis through consumers as well as corporate trading partners [44]. ROE was computed by dividing the 2015 net income of the companies by total book value of equity for 2014 and 2015 (taking an average of these two values) [43,46]. ROI was calculated by dividing 2015 net income by the total sum of long-term liabilities and book value of equity for 2014 and 2015 (the average of these two values) [16]. Then, ROS was obtained by dividing the 2015 net income by total net sales for 2014 and 2015 (the average of these two values) [16,44]. The INET BFA database of South Africa provided financial data to compute ROE, ROI, and ROS.
4.3. Independent Variables
Analysis for this paper comprises three variables: Scope 1, Scope 2, and Scope 1 and 2, which refer to carbon emission levels gathered (in tCO2e) from the 2015 South Africa CDP report. According to Global Reporting [47], Scope 1 are emissions which are directly attributed to company practices or its controlled sources. Scope 2 refers to emissions indirectly produced from purchased energy. The paper analyzed the intensity of carbon emissions from a company which was derived from the ratio of carbon emissions and total sum of net assets [48] for 2014 and 2015 (the average of these two values) as its explanatory variable. As such, the intensity of Scope 1, Scope 2, and Scope 1 and 2 carbon emissions was calculated using the formula.
4.4. Control Variables
The control variables considered in the study include growth, firm size, leverage, and capital intensity. Growth represents how the firm grew, calculated from its growth rate of sales [16,45]. Sales growth was included as a control factor because it demonstrates the capability of the sales team of a company to increase revenue over a fixed time. Thus, it can be considered a strategic measure employed by senior management teams in decision-making and corporate strategy because the company may be at risk of being overtaken by competition if it earns low sales. Leverage measures corporate financial risk [43], which was computed by dividing the total debts of a company in 2015 by the total sum of assets for 2014 and 2015 (the average of these two values) [49]. Accordingly, it indicates the percentage of total assets of a company that were financed through liabilities, debt, and/or creditors. In this vein, a high percentage of leverage indicates that the company has high financial risk. As such, corporate shareholders deploy leverage to ascertain if the firm has adequate funds to pay its current debts; it also evaluates if the company can acquire viable financial benefits from its investments. Capital intensity is acquired as total assets of 2015 divided by the total sum of net sales of 2014 and 2015 (the average of these two values) [50,51]. Hence, capital intensity is an indicator of company efficiency in employment of its assets; the computation of this value establishes the amount of funds invested to generate one rand of sales revenue. In this case, a higher capital intensity ratio demonstrates that the firm requires additional assets (normally caused by underutilisation of available assets or if the firm is more capital intensive as opposed to labour intensive). Firm size increases firm visibility to corporate stakeholders as well as determines the economies of scale levels for a firm [43]; this value is the sum of the natural logarithms of the net sales of 2014 and 2015, divided by two [16]. Firm size was also selected as a control variable because issues such as market experience, high advantages associated with research and development, greater financial base, and market power are usually associated with large companies. The INET BFA database of South Africa provided financial data to compute growth, firm size, leverage, and capital intensity.
With full consideration of the dependent variables, independent variables, and control variables, the main specification model for a company (i) is therefore presented below:
where β0 is the intercept; i = 1, 2, …, N pertains to the cross section unit; t = 1, 2, …, T refers to the time period; βk is the gradient parameter; uit is the random error; Carbon Emissions Intensityi,t = the intensity of Scope 1 carbon emissions (CE1 intensity); the intensity of Scope 2 carbon emissions (CE2 intensity) and the intensity of Scope 1 and 2 carbon emissions (CE1&2 intensity) and Financial Performancei,t = ROE, ROI, and/or ROS.
Financial Performancei,t = β0 + β1(Carbon Emissions Intensityi,t) + β2(Growthi,t) + β3(Firm Sizei,t) + β4(Leveragei,t) + β5(Capital Intensityi,t) + ɛi,t
5. Results and Discussion
The results of the paper are presented in the sections that are outlined below.
Table 1 demonstrates a summarised analysis for the South African CDP companies under study. The 63 observations were produced from 63 companies that were evaluated over the 2015 fiscal year. For the sample companies, the average (median) of ROE was 0.1398655 (0.1469). Thus, 0.1398655 indicates the return on investment with respect to equity for a particular company. The average (median) of ROI was −0.0033959 (0.0657), which indicates the amount of return on a firm investment in accordance to investment expenses. Then, the average (median) of ROS was 0.0941062 (0.099) which demonstrates a measure of profits generated by a business in relation to sales. The average (median) of Scope 1 emissions (CE1 intensity) was 0.03222 (0.002259). This suggests that an ordinary company selected from the sample could produce a typical value of 0.0322 in Scope 1 emissions. The average (median) of Scope 2 emissions (CE2 intensity) was 0.060019 (0.01419). The average (median) of Scope 1 and 2 emissions (CE1&2 intensity) was 0.0983333 (0.019813). Furthermore, averaged values of the control factors, namely, growth, firm size, leverage, and capital intensity were 0.0563492, 15.59418, 0.6075706, and −1.788605, respectively.

Table 1.
Summary statistics for sample companies.
Table 2 reports that ROE is positively related to CE1 intensity, ROS, ROI, growth, firm size, and leverage, but has a negative association with CE2 intensity, CE1&2 intensity and capital intensity. ROS has positive correlations with ROI, CE1 intensity, CE1&2 intensity, growth, firm size, and capital intensity, but demonstrates a negative link with CE2 intensity and leverage. ROI develops a positive association with all the control variables (growth, firm size, leverage, capital intensity) but has a negative relationship with all independent variables (CE1 intensity, CE2 intensity, CE1&2 intensity). CE1 intensity is positively related with CE2 intensity, CE1&2 intensity, firm size, leverage, and capital intensity but is negatively associated with growth. CE2 intensity is positively associated with CE1&2 intensity, firm size, leverage and capital Intensity but is negatively associated with growth. CE1&2 intensity is positively associated with firm size, leverage, and capital intensity but also negatively related with growth.
Table 2.
Correlation coefficients among variables.
Table 3 presents the estimation outcomes using the sample of clean industries for Scope 1 emissions intensity (CE1 intensity). The results demonstrate how CE1 intensity affects firm financial performance. The impacts of CE1 intensity on ROE and ROI in columns (1) and (2) is significantly negative. This shows that an increase in CE1 intensity will decrease corporate ROE and/or ROI. Thus, the findings indicate that, for the clean industries, the stakeholders (investor groups, shareholders, financial firms) consider the long-term context of company performance because both ROE and ROI is constituted by both equity and debt values respectively. Concurrently, the Department of Energy [52] illustrates that green initiatives, such as Clean Development Mechanisms (CDMs), within South African firms attract capital for green initiatives, improve co-operation of public and private industry, and create new green business prospects, thereby improving firm economic performance. Nonetheless, the relationship of CE1 intensity on ROS was positive and not significant; an increase CE1 intensity was also likely to increase ROS. This outcome may be explained a lack of concern among the customers of these clean industries (particularly in the short-term) and/or aware of the practical impact of a firm on climate change. Accordingly, they may not have considered issues regarding carbon emissions in buying and trading decisions.
Table 3.
Carbon Emission Intensity (Scope 1) and firm financial performance (clean industries).
Table 4 presents contrasting results with the findings in Table 3. There is a positive relationship involving indirect Carbon Emission Intensity (Scope 2)—CE2 intensity and both ROE and ROI, as seen in column (1) and (2); however, in Table 3, both values were negative and significant. One important reason that can justify these findings (ROE and ROI) in Table 4 is that corporate stakeholders (especially all the investor groups) may not be very interested in emissions that are generated indirectly by the firm; stakeholders may view those emissions as not under the total control and accountability of a company. In such cases, it appears that the investor groups view indirect emissions as not damaging to corporate reputation. Next, ROS generated a negative relationship with CE2 intensity, thereby conflicting with Table 3 outcomes. The negative association seen in column (3) of Table 4 may be understood as the means by which buyers, clients, and/or trading partners of these clean industries understand the practices of companies to control carbon emissions; accordingly, they tend to exhibit the same negative sentiments to their sellers who associate with such environmentally degrading activities. In this regard, an increase in carbon emissions will also diminish sales.
Table 4.
Carbon Emission Intensity (Scope 2) and firm financial performance (clean industries).
Table 5 show similar findings with Table 3 (with ROE and ROI) and Table 4 (with ROS). The similarity is based on Carbon Emission Intensity (Scope 1&2)—CE 1&2 intensity for the clean industries which generated negative associations with ROE, ROI, and ROS-columns (1) to (3). Therefore, the combined impact of CE 1&2 intensity on corporate ROE, ROI, and ROS on clean industries illustrates that increases in emissions will decrease firm profitability (e.g., investment gains, sales).
Table 5.
Carbon Emission Intensity (Scope 1 and 2) and firm financial performance (clean industries).
Table 6 illustrates conflicting results. Carbon Emission Intensity (Scope 1)—CE1 intensity for dirty industries is negatively associated with both ROI and ROS in column (2) and (3), respectively. Both buyers and investors groups of dirty industries are environmentally conscious of the impact a firm may have on the environment; thus, increases in carbon emissions decrease sales. Investors are considered green-oriented if they support green investments, especially in the short term, just as ROI considers firm debt. Additionally, the Africa Report [53] analysed green investor interest in South Africa; its conclusions suggested that the approval by the South African government of renewable energy technology schemes in the business sector has attracted many international and some local green investors, thereby creating extended viable business prospects. Nonetheless, the ROE-column (1) is positively associated with the CE1 intensity of dirty industries. Because ROE considers equity capital and not debt, some stakeholders may not be very concerned about the issues of carbon emissions in the short term.
Table 6.
Carbon Emission Intensity (Scope 1) and firm financial performance (dirty industries).
The results in Table 7 report that Carbon Emission Intensity (Scope 2)—CE2 intensity for dirty industries is negatively related with all firm financial performance indicators (ROE, ROI, and ROS)-column (1), (2) and (3). The outcomes show that investor groups, financial agencies, buyers, and trading partners of dirty industries are environmentally aware and consider the entire environmental impact of a firm, even indirect emissions. Thus, South African stakeholders are highly critical of dirty industries. An increase in indirect emissions is likely to diminish corporate investment capacity as well as sales.
Table 7.
Carbon Emission Intensity (Scope 2) and firm financial performance (dirty industries).
The results in Table 8 are also supported by Table 7. As with Table 7, Carbon Emission Intensity (Scope 1&2)—CE1&2 intensity for dirty industries is negatively associated with all financial performance measures (ROE, ROI, and ROS)—columns (1) to (3). Thus, the combined effects of CE1&2 intensity on firm financial status overwhelmingly demonstrate that corporate stakeholders of dirty industries place a high value on environmental and climate change issues.
Table 8.
Carbon Emission Intensity (Scope 1&2) and firm financial performance (dirty industries).
Table 9 presents an analysis of all industries (clean and dirty). Carbon Emission Intensity (Scope 1)—CE1 intensity is positively related with ROS—column (3), but negatively associated with ROE and ROI—columns (1) and (2), respectively. For all industries, corporate buyers and trading stakeholders did not appear to consider the activities of a company to minimise direct carbon emissions. Thus, the ROS positive relationship with CE1 intensity for both clean and dirty firms suggests that both corporate buyers and trading partners who do not have financial associations with companies are not concerned with any direct green investment initiative of a firm as long as those companies adhere to governmental and industrial environmental regulations. Moreover, the buyers and trading partners could be environmentally unaware of corporate effects on climate change. In consideration of the ROE and ROI—columns (1) and (2), the negative links with direct carbon emission intensity—CE1 intensity (significant for ROI) support the conclusion that corporate investor groups and financial partners view green investment initiatives of a South African firm as imperative to sustain and maintain healthy long-term financial status both in the short and long term.
Table 9.
Carbon Emission Intensity (Scope 1) and firm financial performance (all companies).
Table 10 reports that indirect emissions intensity-CE2 intensity of these companies generate negative relationships with ROE, ROI, and ROS—columns (1), (2) and (3). These findings confirm the results of Table 5 (CE1&2 intensity-clean industries), Table 7 (CE2 intensity-dirty industries), and Table 8 (CE1&2 intensity-dirty industries). This suggests that all companies (dirty and clean) have provided critical evidence that demonstrates the significant concern and/or interest corporate stakeholders have exercised on corporate environmental policies and/or carbon reduction initiatives among individual companies.
Table 10.
Carbon Emission Intensity (Scope 2) and firm financial performance (all companies).
Table 11 presents the combined impact of emissions intensity—CE1&2 on corporate financial performance. The findings in Table 11 also indicate that CE1&2 intensity develops a negative relationship with ROE, ROI, and ROS—columns (1) to (3). This relationship is also significant for ROI. Because ROI takes into account firm debt, lenders of companies are demonstrably concerned about corporate carbon emissions even in the short term.
Table 11.
Carbon Emission Intensity (Scope 1&2) and firm financial performance (all companies).
To determine corporate growth in terms of the association between corporate direct carbon emissions and firm financial performance, the paper has also considered interaction variables. In Table 12, above the interaction variable is the Carbon Emission Intensity (Scope 1)—CE1 intensity × Growth. In relation to direct emissions, the interaction variable developed positive relationships with all financial variables (ROE, ROI, and ROS)—columns (1) to (3). Nevertheless, taking into account the interaction terms between Carbon Emission Intensity (Scope 1) and corporate growth, the partial effects of the direct carbon emissions for all companies is useful. Thus, to examine the results in a detailed approach, Figure 1 demonstrates the partia × l effects of CE1 intensity on ROE. The study considered ROE because it takes into account the equity capital of stakeholders.
Table 12.
Carbon Emission Intensity (Scope 1) and firm financial performance with interaction terms (all companies).
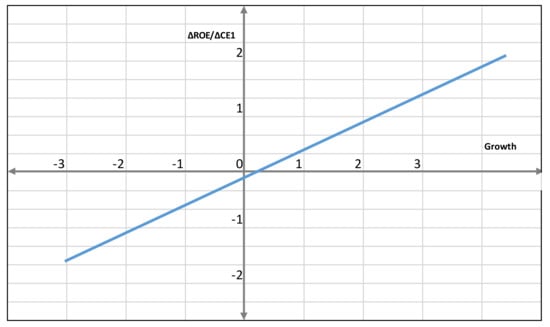
Figure 1.
Interaction between direct carbon emissions intensity (scope 1)—CE1 intensity and firm growth.
As firm growth rate increases, the partial effect of Carbon Emission Intensity (Scope 1)—CE1 intensity increases. The threshold level of company growth, which separates the negative and positive impacts of CE1 intensity on ROE, was 0.02726. The number of firms in which the corporate growth rate was below the threshold was 28. As seen in Figure 1, the partial effect of CE1 intensity was found to be positive when company growth was also positive. Within the South African context, the absence of a direct green legislation makes it difficult to regulate direct carbon emissions; accordingly, investors groups may not be encouraged to disregard companies that prefer to increase their production capacity without taking into account direct carbon emission issues. Nonetheless, South African firms were found to be accountable in the reduction of emissions. This view of South African firm responsible behaviour towards their environment was demonstrated by predictive margins which appear to support this orientation (Figure 1).
Using the findings from Table 12, the vertical axis represents the probability linear predictions of Carbon Emission Intensity (Scope 1)—CE1 intensity, following the inclusion of the interaction variable. The horizontal axis indicates the total number of years that the company was reducing its direct carbon emissions. The margins were tested at 95% confidence intervals. Therefore, Figure 2, illustrates that direct carbon emissions in all industries are highly likely to continue gradually decreasing.
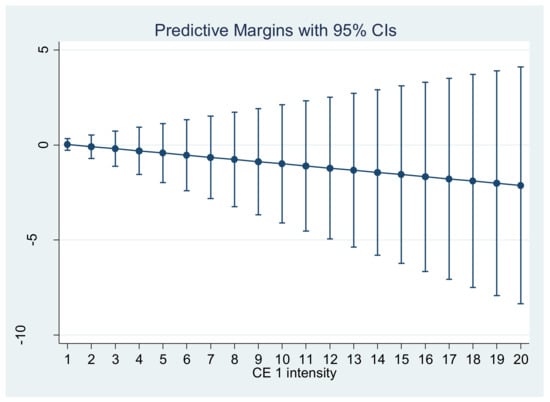
Figure 2.
Predictive margins of direct Carbon Emission Intensity (Scope 1)—CE1 intensity.
The paper also considered the interaction variable Carbon Emission Intensity (Scope 2)—CE2 intensity ×, specifically, growth to ascertain the role of corporate growth on the association between indirect carbon emissions and firm financial performance. In relation to indirect emissions, the interaction term developed a negative relationship with all financial indicators (ROE, ROI, and ROS)—columns (1) to (3). The partial effects of indirect carbon emissions was important as part of the comprehensive analysis of the study. Figure 3 reports the partial effects of CE2 intensity on ROE.
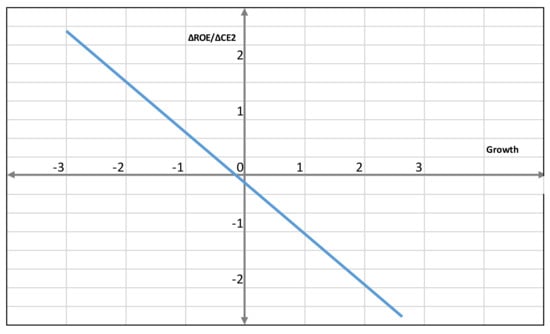
Figure 3.
Interaction between indirect carbon emissions intensity (scope 2)—CE2 intensity and firm growth.
As corporate growth rate heightened, the partial effect of Carbon Emission Intensity (Scope 2)—CE2 intensity decreased. The threshold level of company growth was −0.2482. As seen in Figure 3, the partial effect was negative in most firms because only four firms had a growth rate that was below the threshold value. This result explains that both the Johannesburg Stock Exchange listing and the King III report demands a regulation of the environmental performance of companies; accordingly most firms have integrated more green investment practices to lower carbon emissions and mitigate climate change. This view is supported by the predictive margins seen in Figure 4.
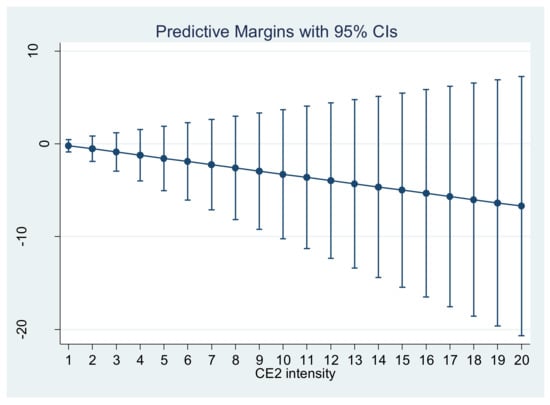
Figure 4.
Predictive margins of indirect Carbon Emission Intensity (Scope 2)—CE2 intensity.
These results agree with the analysis found in Table 13 and Figure 3; findings from Figure 4 (margins tested at 95% confidence intervals) suggest that indirect carbon emissions in all industries are highly likely to continue consistently decreasing in the future.
Table 13.
Carbon Emission Intensity (Scope 2) and firm financial performance with interaction terms (all companies).
The findings in Table 14 indicate that the introduction of the interaction variable Carbon Emission Intensity (Scope 1&2)—CE1&2 intensity × growth, which is the combined effect of both direct and indirect carbon emissions on firm financial performance, was negatively related with (ROE, ROI, and ROS)—columns (1) to (3). Thus, Table 14 concurs with Table 13 (indirect emissions—CE2 intensity × Growth) but conflicts with the outcome of Table 12 (direct emissions—CE1 intensity × Growth). However, additional analysis of the findings from Table 12 suggest that carbon emissions will decline as a firm continues operation with reference to Table 14, the consideration of interaction terms involving Carbon Emission Intensity (Scope 1&2) and Growth requires further analysis using partial effects. Figure 5 illustrates the partial effects of CE1&2 intensity on ROE.
Table 14.
Carbon Emission Intensity (Scope 1&2) and firm financial performance with interaction terms (all companies).
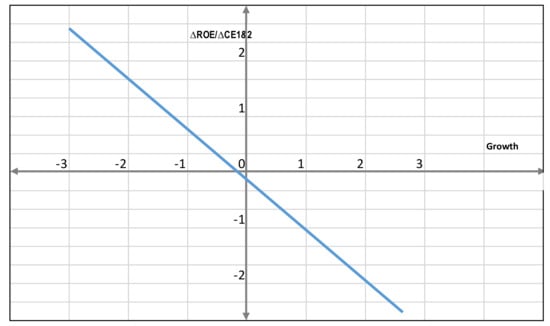
Figure 5.
Interaction between carbon emissions intensity (Scope 1&2)—CE1&2 intensity and firm growth.
As corporate growth increased, the partial effect of Carbon Emission Intensity (Scope 1&2)—CE2 intensity also decreased. The threshold level of firm growth was −0.003816. Thus, Figure 5 suggests that the partial effect was also negative in most companies because only 11 firms had a growth rate below the threshold value. This finding also supports the impact associated with Johannesburg Stock Exchange listing requirements and the King III report demands. Moreover, firms could be integrating greening initiatives to reduce possible high costs associated with the proposed carbon tax in South Africa. This fact is further supported by Figure 6.
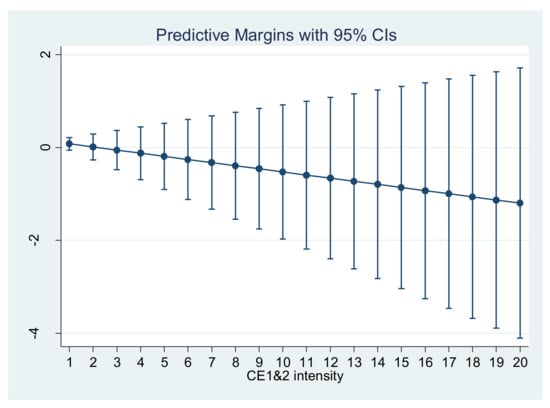
Figure 6.
Predictive margins of indirect Carbon Emission Intensity (Scope 1&2)—CE1&2 intensity.
Figure 6 (margins tested at 95% confidence intervals) demonstrates that both direct and indirect carbon emissions in all industries are possibly likely to continue diminishing in the future.
5.1. Discussion
The findings presented from Table 3, Table 4, Table 5, Table 6, Table 7, Table 8, Table 9, Table 10, Table 11, Table 12, Table 13 and Table 14 are explained by Table 15.
Table 15.
Summary of results on the relationship between carbon emissions and firm financial performance.
The above table indicates that the findings generally suggested a negative association between the different types of emissions and corporate financial performance. The outcomes with negative associations agree with the studies of Gallego-Álvarez et al. [24,32,33] and Zhang and Wang [25]; however, the findings with positive associations were also supported by Rokhmawati et al. [38], Salahuddin et al. [2], and Yu et al. [35]. Overall, this study produced mixed results, which were indicated by the presence of both positive and negative relationships. Previous studies which produced mixed results include Broadstock et al, Damert et al., Jia et al. [14,39,40], and Chan et al. [19].
5.2. Implications for Policy Makers and Business Practice
This paper has supported the view that carbon emissions within corporate operations can be lowered while allowing the company to sustain and/or even improve its financial performance. Hence, it is imperative that policy makers augment existing programs that are designed to reduce carbon emissions. Additionally, policy makers should ensure the enforcement of tough and robust technical benchmarks and rules for carbon emission reduction of corporate operations on a direct and indirect level. Policy makers should also establish long-term incentives that will stimulate companies to adopt efficient green technologies and acquire environmentally compatible processes and systems which mitigate impacts of climate change. It is apparent that some green technologies, such as carbon capture and storage, remain prohibitively expensive for most companies, especially in developing economies. Accordingly, the provision of incentives and encouragement in their adoption, along with achieving cost efficiency is equally important. There is no doubt that a greater commitment to the development of low-carbon and/or zero-carbon environments is imperative at a national level if large carbon emission reduction levels are desired. Although countries may have different carbon emission regimes, characterised by different standards and limits, an international collective of initiatives, supported through consensus and coordinated action, will provide an improved degree of flexibility and tolerance of differences when accounting for carbon emissions at levels which will inevitably exceed global targets. Furthermore, societal views regarding climate change need to be continuously implemented in emission reduction policies so that a greater understanding of climate change amongst stakeholders is supported, leading to an adjustment of policies.
5.3. Limitations of the Study and Future Research
This study only focused on the effect of carbon emissions on firm performance. Additional studies could examine the effects of carbon performance on carbon emissions and/or firm financial performance. Moreover, this study only considered an analysis over a one year period; accordingly, longitudinal studies, which use panel data, are relevant to determine the vital relationships on the variables examined. In addition, future research should also analyse and compare the long-term impact of green investments on corporate financial situations, using cases in developing, emerging, and developed economies.
6. Conclusions
This paper investigated the effect of carbon emissions on firm financial performance. Using a sample of 63 South African CDP companies, content analysis was employed to collect both carbon data and financial data for the 2015 fiscal year. Multiple regression approaches were deployed to analyse the data and mixed results were produced. Firstly, the intensity of direct emissions (CE1 intensity) of clean industries was negative and significantly related to ROE and ROI; in contrast, CE1 intensity developed positive relationships with the ROS of clean firms. The intensity of indirect emissions (CE2 intensity) of clean industries was positively associated with ROE and ROI; however, CE2 intensity was negatively linked with ROS. The intensity of both direct and indirect emissions (CE1&2 intensity) of clean industries was negatively associated with ROE, ROI, and ROS. Secondly, the intensity of direct emissions (CE1 intensity) of dirty companies was negatively associated with ROE, ROI, and ROS. The intensity of indirect emissions (CE2 intensity) of dirty companies was also negatively associated with ROE, ROI, and ROS. The intensity of both direct and indirect emissions (CE1&2 intensity) of dirty industries was negatively associated with ROE, ROI, and ROS. Lastly, the intensity of direct emissions (CE1 intensity) of all companies (clean and dirty) was negatively associated with ROE and ROI and but positively associated with ROS. The intensity of indirect emissions (CE2 intensity) of all companies was negatively associated with ROE, ROI, and ROS. The intensity of both direct and indirect emissions (CE1&2 intensity) of all industries was negatively associated with ROE, ROI, and ROS. Although the study results were mixed, the paper found additional evidence of a negative relationship between carbon emissions and firm financial performance within the South African corporate setting.
Author Contributions
All authors have contributed equally in conceptualizing, data collection, analysis and writing of the paper.
Acknowledgments
The author of this paper wishes to acknowledge the two anonymous reviewers for their constructive comments.
Conflicts of Interest
The authors declare no conflict of interest.
References
- World Resources Institute. The Greenhouse Gas Protocol Initiative: A Corporate Accounting and Reporting Standard; WRI Publication: Washington, DC, USA, 2001. [Google Scholar]
- Salahuddin, M.; Alam, K.; Ozturk, I. The effects of Internet usage and economic growth on CO2 emissions in OECD countries: A panel investigation. Renew. Sustain. Energy Rev. 2016, 62, 1226–1235. [Google Scholar] [CrossRef]
- Wang, M.; Liu, J.; Chan, H.; Choi, T.; Yue, X. Effects of carbon tariffs trading policy on duopoly market entry decisions and price competition: Insights from textile firms of developing countries. Int. J. Prod. Econ. 2016, 181, 470–484. [Google Scholar] [CrossRef]
- Narayan, K.; Sharma, S.S. Is carbon emissions trading profitable? Econ. Model. 2015, 47, 84–92. [Google Scholar] [CrossRef]
- Philip, D.; Shi, Y. Optimal hedging in carbon emission markets using Markov regime switching models. J. Int. Financ. Mark. Inst. Money 2016, 43, 1–15. [Google Scholar] [CrossRef]
- National Business Initiative. CDP South Africa 100 Climate Change Report; CDP South Africa Report; National Business Initiative: Sandton, South Africa, 2009. [Google Scholar]
- Department of Environmental Affairs. Greenhouse Gas Inventory for South Africa 2000–2010; Department of Environmental Affairs: Pretoria, South Africa, 2013.
- IndexMundi. South Africa—CO2 Emissions: CO2 Emissions from Gaseous Fuel Consumption (kt). Available online: http://www.indexmundi.com/facts/south-africa/co2-emissions (accessed on 16 October 2016).
- Copans, G. SA’s Carbon Emissions a Cause for Concern. Available online: http://www.engineeringnews.co.za/article/sa039s-carbon-emissions-a-cause-for-concern-2008-01-25 (accessed on 16 October 2016).
- De Villiers, C.; van Staden, C.J. Where firms choose to disclose voluntary environmental information. J. Account. Public Policy 2011, 30, 504–525. [Google Scholar] [CrossRef]
- Visser, W.A.M.T. Sustainability reporting in South Africa. Corp. Environ. Strateg. 2002, 9, 79–85. [Google Scholar]
- Scott, W.R. Institutional theory. In Encyclopedia of Social Theory; Sage: Thousand Oaks, CA, USA, 2004; pp. 408–414. [Google Scholar]
- Yigitcanlar, T.; Dur, F.; Dizdaroglu, D. Towards prosperous sustainable cities: A multiscalar urban sustainability assessment approach. Habitat. Int. 2015, 45, 36–46. [Google Scholar] [CrossRef]
- Damert, M.; Paul, A.; Baumgartner, R.J. Exploring the determinants and long-term performance outcomes of corporate carbon strategies. J. Clean. Prod. 2017, 160, 123–138. [Google Scholar] [CrossRef]
- Gonenc, H.; Scholtens, B. Environmental and financial performance of fossil fuel firms: A closer inspection of their interaction. Ecol. Econ. 2017, 132, 307–328. [Google Scholar] [CrossRef]
- Iwata, H.; Okada, K. How does environmental performance affect financial performance? Evidence from Japanese manufacturing firms. Ecol. Econ. 2011, 70, 1691–1700. [Google Scholar]
- Scott, W.R. Institutions and Organizations; Sage: Thousand Oaks, CA, USA, 1995. [Google Scholar]
- Ganda, F.; Ngwakwe, C.C. Strategic Approaches towards a Low Carbon Economy. Environ. Econ. 2013, 4, 46–55. [Google Scholar]
- Chan, H.S.; Li, H.; Zhang, F. Firm competitiveness and the European Union emissions trading scheme. Energy Policy 2013, 63, 1056–1064. [Google Scholar] [CrossRef]
- Cucchiella, F.; Gastaldi, M.; Miliacca, M. The management of greenhouse gas emissions and its effects on firm performance. J. Clean. Prod. 2017, 167, 1387–1400. [Google Scholar] [CrossRef]
- Lucas, M.T.; Noordewier, T.G. Environmental management practices and firm financial performance: The moderating effect of industry pollution-related factors. Int. J. Prod. Econ. 2016, 175, 24–34. [Google Scholar] [CrossRef]
- Ulvila, J.W.; Snider, W.D. Negotiation of international oil tanker standards: An application of multiattribute value theory. Oper. Res. 1980, 28, 81–96. [Google Scholar] [CrossRef]
- De Mare, G.; Granata, M.F.; Nesticò, A. Weak and strong compensation for the prioritization of public investments: multidimensional analysis for pools. Sustainability 2015, 7, 16022–16038. [Google Scholar] [CrossRef]
- Gallego-Álvarez, I.; Segura, L.; Martínez-Ferrero, J. Carbon emission reduction: The impact on the financial and operational performance of international companies. J. Clean. Prod. 2015, 103, 149–159. [Google Scholar] [CrossRef]
- Zhang, B.; Wang, Z. Inter-firm collaborations on carbon emission reduction within industrial chains in China: Practices, drivers and effects on firms’ performances. Energy Econ. 2014, 42, 115–131. [Google Scholar] [CrossRef]
- Bruton, G.D.; Ahlstrom, D.; Li, H.L. Institutional theory and entrepreneurship: Where are we now and where do we need to move in the future? Entrep. Theory Pract. 2010, 34, 421–440. [Google Scholar] [CrossRef]
- Ganda, F. The factors which motivate carbon emissions in the long-term in South Africa: Evidence from co-integration and VEC model. Int. J. Sustain. Econ. 2018, 10, 99–122. [Google Scholar] [CrossRef]
- Fin24. Carbon Tax Laggards May Pay Dearly, Cautions Environmental Firm. Available online: https://www.fin24.com/Economy/carbon-tax-laggards-may-pay-dearly-cautions-environmental-firm-20170112 (accessed on 15 February 2018).
- Fin24. Carbon Offsets Will Make SA Economy Greener—Treasury. Available online: https://www.fin24.com/Economy/carbon-offsets-will-make-sa-economy-greener-treasury-20160620 (accessed on 15 February 2018).
- Kopidou, D.; Tsakanikas, A.; Diakoulaki, D. Common trends and drivers of CO2 emissions and employment: A decomposition analysis in the industrial sector of selected European Union countries. J. Clean. Prod. 2016, 112, 4159–4172. [Google Scholar] [CrossRef]
- Hayami, H.; Nakamura, M.; Nakamura, A.O. Economic performance and supply chains: The impact of upstream firms’ waste output on downstream firms’ performance in Japan. Int. J. Prod. Econ. 2015, 160, 47–65. [Google Scholar] [CrossRef]
- Lee, K.H.; Min, B. Green R&D for eco-innovation and its impact on carbon emissions and firm performance. J. Clean. Prod. 2015, 108, 534–542. [Google Scholar]
- Lee, K.; Min, B.; Yook, K. The impacts of carbon emissions and environmental research and development (R&D) investment on firm performance. Int. J. Prod. Econ. 2015, 167, 1–11. [Google Scholar]
- Nishitani, K.; Kaneko, S.; Fujii, H.; Komatsu, S. Effects of the reduction of pollution emissions on the economic performance of firms: An empirical analysis focusing on demand and productivity. J. Clean. Prod. 2011, 19, 1956–1964. [Google Scholar] [CrossRef]
- Yu, Y.; Wang, D.D.; Li, S.; Shi, Q. Assessment of U.S. firm-level climate change performance and strategy. Energy Policy 2016, 92, 432–443. [Google Scholar] [CrossRef]
- Dragomir, V.D. The disclosure of industrial greenhouse gas emissions: A critical assessment of corporate sustainability reports. J. Clean. Prod. 2012, 29, 222–237. [Google Scholar] [CrossRef]
- Mao, Z.; Zhang, S.; Li, X. Low carbon supply chain firm integration and firm performance in China. J. Clean. Prod. 2017, 153, 354–361. [Google Scholar] [CrossRef]
- Rokhmawati, A.; Sathye, M.; Sathye, S. The effect of GHG emission, environmental performance, and social performance on financial performance of listed manufacturing firms in Indonesia. Procedia Soc. Behav. Sci. 2015, 211, 461–470. [Google Scholar] [CrossRef]
- Jia, J.; Xu, J.; Fan, Y. The impact of verified emissions announcements on the European Union Emissions Trading Scheme: A bilaterally modified dummy variable modelling analysis. Appl. Energy 2016, 173, 567–577. [Google Scholar] [CrossRef]
- Broadstock, D.C.; Collins, A.; Hunt, L.C.; Vergos, K. Voluntary disclosure, greenhouse gas emissions and business performance: Assessing the first decade of reporting. Br. Account. Rev. 2018, 50, 48–59. [Google Scholar] [CrossRef]
- Misani, N.; Pogutz, S. Unraveling the effects of environmental outcomes and processes on financial performance: A non-linear approach. Ecol. Econ. 2015, 109, 150–160. [Google Scholar] [CrossRef]
- Mani, M.; Wheeler, D. In search of pollution havens? Dirty industry in the world economy, 1960 to 1995. J. Environ. Dev. 1998, 7, 215–247. [Google Scholar]
- Artiach, T.; Lee, D.; Nelson, D.; Walker, J. The determinants of corporate sustainability performance. Account. Financ. 2010, 50, 31–51. [Google Scholar] [CrossRef]
- Wagner, M. How to reconcile environmental and economic performance to improve corporate sustainability: Corporate environmental strategies in the European paper industry. J. Environ. Manag. 2005, 76, 105–118. [Google Scholar] [CrossRef] [PubMed]
- Montabon, F.; Sroufe, R.; Narasimhan, R. An examination of corporate reporting, environmental management practices and firm performance. J. Oper. Manag. 2007, 25, 998–1014. [Google Scholar] [CrossRef]
- Damodaran, A. Return on Capital (ROC), Return on Invested Capital (ROIC) and Return on Equity (ROE): Measurement and Implications. Available online: http://people.stern.nyu.edu/adamodar/pdfiles/papers/returnmeasures.pdf (accessed on 21 May 2018).
- Global Reporting. GRI 305: Emissions. Available online: https://www.globalreporting.org/standards/media/1012/gri-305-emissions-2016.pdf (accessed on 10 February 2018).
- Rokhmawati, A.; Gunardi, A.; Rossi, M. How Powerful is Your Customers’ Reaction to Carbon Performance? Linking Carbon and Firm Financial Performance. Int. J. Energy Econ. Policy 2017, 7, 85–95. [Google Scholar]
- Helfert, E.R. Financial Analysis: Tools and Techniques, A Guide for Managers; McGraw-Hill: New York, NY, USA, 2001. [Google Scholar]
- Acquaah, M. Corporate management, industry competition and the sustainability of firm abnormal profitability. J. Manag. Gov. 2003, 7, 57–85. [Google Scholar] [CrossRef]
- Shaheen, S.; Malik, Q.A. Impact of Capital Intensity, Size of Firm and Profitability on Debt Financing in Textile Industry of Pakistan. Interdiscip. J. Contemp. Res. Bus. 2012, 3, 1061–1066. [Google Scholar]
- Department of Energy. Opportunities in South Africa. Available online: http://www.energy.gov.co.za/files/esources/kyoto/kyoto_sa.html (accessed on 12 June 2016).
- The Africa Report. RE: Investors Excited about SA. Available online: http://www.greenbusinessguide.co.za/re-investors-excited-sa/ (accessed on 19 June 2014).
© 2018 by the author. Licensee MDPI, Basel, Switzerland. This article is an open access article distributed under the terms and conditions of the Creative Commons Attribution (CC BY) license (http://creativecommons.org/licenses/by/4.0/).