Abstract
Thirteen porcelains assigned to Sèvres factory productions and a few references to the other contemporary factories (Chantilly, Limoges, and Venice) have been studied on-site with a portable X-ray fluorescence (pXRF) spectrometer in order to control the provenance attribution. Characteristic XRF signals of major elements (Si, Ca, K, Pb) and minor/trace (Au, Bi, As, Ti, Co, Cu, Zn, Ni, Y, Zr, Rb, and Sr) elements are compared for the paste, blue mark, various glazed (colored) areas, and gilding. The comparison of peak intensities clearly distinguishes different types of hard- and soft-paste porcelain, made from either similar or distinct raw materials. The analysis of transition elements associated with cobalt identifies three types of cobalt blue and reveals that du Barry-style decoration on certain artifacts was typical of 19th-century production. On-site comprehensive studies of the two famous Etruscan-style breast bowls from Rambouillet Castle dairy, using pXRF and Raman spectroscopy, confirm the use of soft-paste porcelain for the cup and hard-paste for its support, providing detailed information on the use of gold nanoparticles in the burgundy-colored decoration.
1. Introduction
For a very long time, the identification of objects relied solely on documentation and sensory examination (sight, touch, and sound). Sampling-based analysis is generally not possible for rare objects. However, the reduction in required sample sizes—from a few grams in the 1950s to a few micrograms by the late 20th century—now allows for micro or even non-invasive analysis of nearly all objects, particularly ceramics. With the availability of compact and portable instruments on-site, non-invasive studies are possible.
Two non-invasive key methods are X-ray fluorescence spectroscopy, which provides information on the chemical composition (partially, since some elements escape detection) of a variety of Cultural Heritage artifacts [1,2,3,4,5,6,7,8], and Raman microspectroscopy, which identifies the crystalline or amorphous phases of materials [9]. For about 20 years, these mobile techniques have been applied to specific porcelain categories, and more recently, combined analyses have examined the decoration (the most sophisticated part, hence the most technologically characteristic) of the very representative artifacts developed by the Arts of Fire from notable factories, including Rouen [10], the Parisian region (Saint-Cloud, Pavie, etc.) [10], and Meissen (Saxony) [11]. Studies using just one of these techniques have been conducted on a series of productions from Medici (Florence) [12], Chantilly [13], Mennecy [13], Saint-Cloud [13], and Sceaux [14] soft-paste factories. Other major European manufacturers have also been analyzed, such as those in Central Europe [15,16], the United Kingdom [17,18], and Italy (Capo di Monte) [19]. However, most past studies focus on case studies of fragments [13,18,20,21], primarily using laboratory-based, non-portable instruments for elemental analysis of pastes [15,16,17,18,19,20,21].
In some cases, a significant number of similar objects (tens of pieces) have been analyzed, lending representativeness to the measurements, although the overall number of objects studied remains limited. Nonetheless, these studies have shown that the presence of certain phases in enamels [13,14], specific elemental distributions associated with cobalt [22] or gold nanoparticles [11], and the proportions of relevant impurities detectable by pXRF (e.g., Y, Rb, Sr, Zr, and U) in pastes or glazes [11] can reliably differentiate provenances.
To further this approach, we are focusing on the early production years of the factory initially established in Vincennes (1740), which later became the Manufacture Royale relocated at Sèvres in 1756 [23,24,25,26]. Before kaolin discovered near Limoges in 1767 was exploited [27], hard-paste factories had to import kaolin from German territories, and we aim to distinguish these different sources.
Our objective is to develop discrimination procedures for different productions using mobile, non-invasive (contact-free) measurement methods, which inherently have certain limitations. The analysis is conducted on the accessible surfaces of objects, whether enameled or not. To ensure usability by non-specialists, these procedures need to be straightforward and as visually intuitive as possible. Eleven objects bearing the Sèvres factory mark, along with two that may be attributed to Sèvres or Chantilly, will be compared with French (Chantilly, Limoges) and Italian references (Venice, likely Vezzi, decorated by Antonio Bon [28]) to identify major differences in elemental composition. Objects with uncertain assignments will also be analyzed. The varying distances from production sites should correspond with the use of different raw materials. Some objects are suspected to be fakes or embellishments (e.g., later addition of polychrome decoration). The complementary methods, XRF and Raman, will also be applied to one of the most famous artifacts from the Sèvres factory, Etruscan-style breast bowls on a stand from Marie-Antoinette’s dairy at Rambouillet Castle [29,30], two pieces representative of 18th-century royal production, designed by Pierre Julien [31]. Additional artifacts will be analyzed in future campaigns.
2. Materials and Methods
2.1. Objects
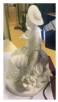
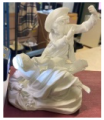
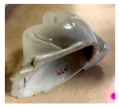
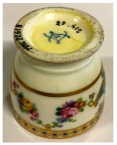
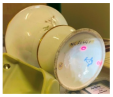
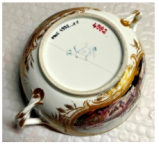
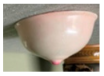
Among the most characteristic Sèvres artifacts are the two Etruscan-style milk cups made for Marie-Antoinette’s dairy at Rambouillet Castle [29]. Equally famous is the service decorated with antique casserole dishes and flower garlands (“petits vases et guirlandes”), ordered in 1770 by Madame du Barry from the Royal Manufacture of Sèvres and delivered to her in 1771 for her music pavilion in Louveciennes [30,32]. This service includes 322 pieces. Fakes are common, and the authenticity or provenance of artifacts studied here is questioned.
Information about the objects is given in Table 1. A question mark is added when the attribution is uncertain.

Table 1.
List of studied artifacts with assigned provenance and date. Inventory numbers are shown. For simplicity, only the number will be used in the text. Dates are deduced from the mark. Permission from Sèvres-Cité de la Céramique to study the objects and publish these images of work in progress was granted by V. Mesqui, curator at the Musée national de Céramique and co-author of this manuscript.
2.2. Techniques
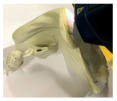
Set-ups of the instruments are shown in Figure 1.
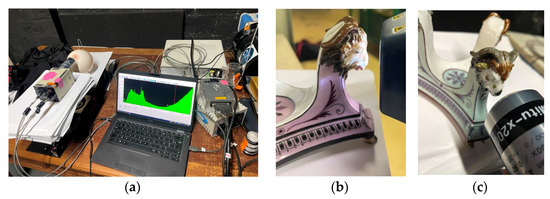
Figure 1.
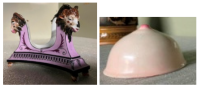
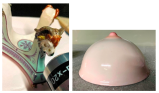
Examination of two Etruscan-style Rambouillet Castle dairy breast bowls and stands (MNC 23399 and MNC 23400). View (a) of the Raman set-up and the laser illumination optics and simultaneous collection of the Raman signal; view of the positioning of the head of pXRF spectrometer on the MNC 23399 (b) and MNC 23400 (c) stands.
2.2.1. Portable X-Ray Fluorescence Spectroscopy (pXRF)
The procedure has been described in detail in previous articles [10,11,38,39,40]. X-ray fluorescence analysis was performed on-site using a portable instrument (Elio-Bruker, Berlin, Germany). The set-up included a miniature X-ray tube system with a Rh anode, a ~1 mm2 collimator, and a large-area Silicon Drift Detector with an energy resolution of <140 eV for Mn Kα, and an energy range of detection from 1.3 keV (in air) to 43 keV. The working distance between the instrument front and the analyzed spot is 1.40 cm, which permits the selection of colored areas located on rather flat or convex zones. Depending on the object, the measurement was performed by positioning the instrument from the top to the lateral side. Perfect perpendicularity to the area measured was sought. Measurements were carried out in point mode with an acquisition time of 180 s, using a tube voltage of 50 kV and a current of 80 μA. Additional measurements with an AlTiCu filter were made to compare more precisely the signals in the 8–21 keV range (Ge, Rb, Sr, Y, Zr, and U elements). But a longer recording time is required for the analysis (300 s instead of 180 s). The analysis depth, defined as the thickness of the top layer from which 90% of the fluorescence originates, was determined using the Beer–Lambert law to be approximately 6 μm at Si Kα, 170 μm at Cu Kα, 300 μm at Au Lα, and 3 mm at Sn Kα [41].
In comparison, glaze and enamel thicknesses range from a few tens of microns (thin painted enamel) to approximately 500 to 1000 µm for very thick glaze. The data fitting procedure using Artax 7.4.0.0 (Bruker, AXS GmbH, Karlsruhe, Germany) software has been described in previous papers [38,39,40]. As the energy of the X-ray photons varies significantly depending on the transition of the element considered, the absorption also varies considerably. Analyzing a compound surface with layers of varying thicknesses complicates the straightforward calculation of composition. When the stratigraphy is not known, the calculation of the chemical composition is not possible [38,39,40,42]. To address this, we compared the areas of characteristic peaks as performed in previous studies [38,39,40]. The variability in peak area measurements based on the measurement procedure has been studied previously [43]. The net area under the peak at the characteristic energy of each selected element in the periodic table was calculated, and the counts of the major, minor, and trace elements were determined for the paste and colored areas (white, red, yellow, orange, blue, green, and black). Before plotting the diagrams, the net areas for each element were normalized by the number of XRF photons derived from the elastic peak of the rhodium X-ray tube. Normalization with respect to the Co signal was used for comparing specific elements. The normalized data were then plotted in ternary scatter plots for interpretation and discussion, using the software Statistica® 13.5.0.17 (TIBCO Software Inc., Palo Alto, Santa Clara, CA, USA).
For clustering/similarity analysis (dendrogram), the dataset was first explored using the Pandas library. Agglomerative Clustering from sklearn.cluster® module was then performed. To visualize and illustrate the composition of each cluster, dendrograms were generated, displaying the points in each cluster and their relative distances. Ward’s method was selected and implemented as the linkage method, using the spicy.cluster.hierarchy® module for visual representation and matplotlib® for plotting. The code was developed and executed in a Jupyter Lab® environment, version 4.1.6.
2.2.2. Raman Microspectroscopy
Some artifacts were analyzed on-site using a mobile HE532 set-up (Figure 1) (HORIBA Scientific Jobin-Yvon, Palaiseau, France). Due to the limited availability of the objects, the analysis conditions varied based on the type of object being studied.
Long working distance (LWD) 50× (Olympus Corp., Tokyo, Japan) and 200× (Mitutoyo Corp. Tokyo, Japan) microscope objectives were used. Analyzed spots are about 5 × 5 and 1 × 1 µm2; the in-depth penetration is similar for the colorless glaze, respectively, and strongly reduced for dark-colored areas. Typically, a 50–3200 cm−1 spectral window was recorded. Counting time ranged between a few minutes and a few tenths of minutes (at least three accumulations required to suppress cosmic ray signals). The measurement campaigns were carried out under different conditions (room temperature was not constant), and the limited resolution of the instrument led to an uncertainty of ±2 to 3 cm−1 on the wavenumbers.
3. Results
3.1. Nature of Pastes
Figure 2 shows the XRF spectra recorded on the bodies. Pastes MNC 23399 (breast bowl), MNC 28003 (Chantilly monkey), and MNC 424.2 (Chantilly figurine) show intense peaks characteristic of the lead element, as expected for soft-paste porcelain; the latter paste is very rich in calcium. For these bodies, the aluminum peak is barely visible, but traces of chlorine are detected, which is consistent with the recipes [20,23,24,25,26]. In the case of egg cup MNC 22618, traces of sulfur are detected, possibly due to the use of gypsum as a raw material or contamination from firing with earth charcoal.
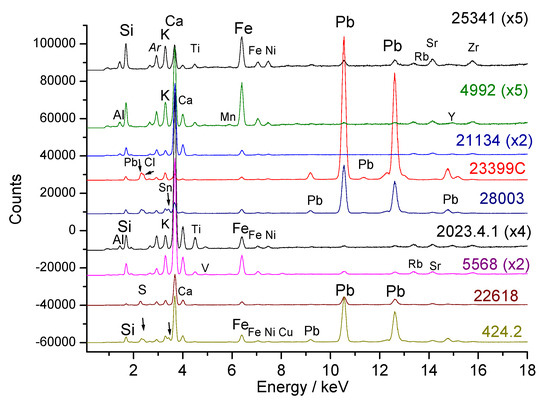
Figure 2.
Representative XRF spectra recorded on the paste (the inventory numbers XXX (MNC XXX) and the magnification of the spectrum are given, see Table 1). Arrows: peaks of Sn, Cl, or S elements.
In the spectral window shown in Figure 2, traces of tin (Sn Lα peak at 3.44 keV, located just after the potassium peak at 3.31 keV) are detected in figurine MNC 28003, attributed to the Chantilly factory [36]. Signal comparisons are made more precisely using the Sn Ka peak at more than 25 keV (see further). The traces of lead observed in other objects are probably due to surface contamination during the firing of lead-rich enamel (very volatile PbO oxide reacts with the surface). As a result, the surfaces of unglazed biscuits are free from lead contamination. The residual iron content varies, and the differing intensities of the K and Ca peaks highlight significant variations in composition. Additionally, the significant intensities of Rb, Sr, Y, and Zr traces detected between 13 and 17 keV are noted, which will be compared later.
Figure 3 compares the areas of the characteristic XRF peaks for the elements silicon (the major element), fluxes (Ca, K, and Pb), and tin, measured on the accessible areas of the paste and different colors. Full data set is given as Supplementary Materials.
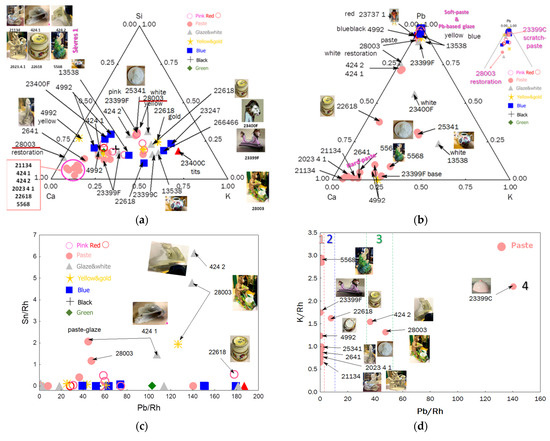
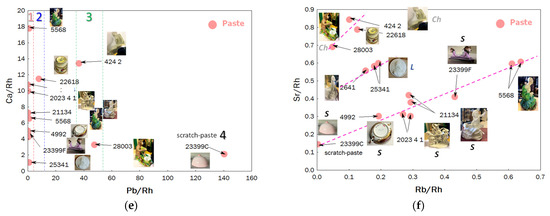
Figure 3.
Ternary diagrams comparing the relative areas of characteristic XRF peaks of the elements Si-Ca-K (a) and Pb-Ca-K (b) for the pastes and the different colors of enamels (pink, red, white/colorless, blue, green, yellow/gilding, and black). Inventory numbers are given in Table 1. Binary Sn vs. Pb (c), K vs. Pb (d), Ca vs. Pb (e), and Sr vs. Rb (f) plots are given for the classification of different pastes: 1: hard-paste porcelain; 2: special paste or pollution during firing; 3: soft-paste porcelain; 4: soft-paste porcelain data contaminated by lead-reach glaze blur; S: Sèvres; L: Limoges; Ch: Chantilly. The inventory numbers XXX (MNC XXX) are given.
The Si-Ca-K ternary diagram distinguishes three types of paste, which can be described as follows:
- (i)
- lime-rich (those called “Sèvres 1” and a production attributed to Chantilly (with the lead signal excluded)),
- (ii)
- potassium-rich (e.g., the Limoges medallion, with the lead signal also excluded), and
- (iii)
- intermediate (e.g., the lead-rich breast bowl MNC 23399).
Two groups of glazes are identified, differing in potassium content (Pb is excluded here as well).
The Pb-Ca-K diagram clearly confirms that the first two types of paste are hard-paste porcelain, while the third is soft-paste porcelain (e.g., bowls MNC 23399 and MNC 23400, figurines MNC 424.1 and MNC 424.2).
The egg cup (MNC 22618), monkey figurine (MNC 28003), and Limoges medallion (MNC 25341) pastes exhibit weak lead signals. For the two first-mentioned artifacts, the presence of lead is likely due to surface contamination during firing (possibly from the use of a kiln contaminated by lead or lead evaporation–condensation from overglazes). The paste of artifact MNC 28003 contains the highest concentration of lead. For the case of the Limoges medallion (MNC 25341), one of the first “hard”-paste porcelain made in France, a voluntary addition of lead-based frit by making a hybrid paste intermediate between soft- and hard-paste is not excluded; this addition of frit facilitating sintering at lower temperatures. Only an examination of the microstructure or a micro-destructive analysis could answer that.
The Ca vs. Pb diagram shows the absence of tin in the glaze, except for objects attributed to the Chantilly factory (e.g., MNC 28003, MNC 424.1, and 424.2), where cassiterite was already identified in the glaze [13,14]. This diagram confirms the presence of four types of porcelain:
- (i)
- Hard-paste porcelain, identified as standard Sèvres production (MNC 23399 stand, MNC 21134 biscuit, MNC 2641 biscuit, MNC 5568 figurine, MNC 4992 bowl, and 2023.4.1 biscuit);
- (ii)
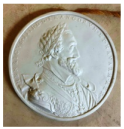
- Two similar objects whose paste (surface only?) contains traces of lead: the egg cup MNC 22618 attributed to Sèvres (mark S, i.e., 1771) with a decoration known as “petits vases et guirlandes” used on the table set of the Countess du Barry [32], and the biscuit medallion representing King Henri IV made at Limoges (MNC 25341) [34];
- (iii)
- Soft-paste porcelain containing a moderate level of lead: the two figurines (MNC 424.1 and MNC 424.2) assigned to the Chantilly factory [35,44];
- (iv)
- Soft-paste porcelain rich in lead: the MNC 28003 monkey figurine was also assigned to Chantilly.
The paste of Rambouillet Castle dairy breast bowl (MNC 23399) [29,30] belongs to this latter group, although it is likely that the true lead content of the paste is lower than measured due to contamination during measurement by the glaze (as there was no measurable surface of paste without risking damage to the object, the measurement was made on a fault, a scratch revealing the paste). The area without glaze was smaller than the spot analyzed by pXRF.
The binary diagrams K vs. Pb (Figure 3d) and Ca vs. Pb (Figure 3e) clearly distinguish hard-paste (Group 1 in Figure 2) from soft-paste porcelain (Group 3). Measurement #4 of the MNC 23399 breast bowl (from the glaze scratch) shows a high Pb signal due to significant glaze contribution within the analysis spot. For the egg cup (MNC 22618), it is likely that the paste surface was heavily contaminated by lead oxide in the gas phase during the firing of the enamel.
Certain impurities, such as yttrium and zirconium (typical impurities in quartz in the form of zircon), rubidium (an impurity associated with sodium and potassium), and strontium (associated with calcium), exhibit relatively strong XRF signals despite their low concentrations. Moreover, their Kα peaks are located in a spectral zone with minimal overlap with other peaks.
The Sr vs. Rb impurity diagram highlights the use of different raw materials supplying calcium (Sr) and alkalis (Rb). Data points aligned on the same line suggest the simultaneous presence of these two elements from the same material. All artifacts attributed to earlier production at the Sèvres factory align on the same line. Therefore, the unassigned figurine (MNC 5568) in green clothing is likely a Sèvres hard-paste porcelain, rich in calcium, while figurine MNC 2641 aligns with the Limoges medallion; the egg cup (MNC 22618) aligns with MNC 28003 and MNC 424.2 (assigned to Chantilly). These results suggest that each group shares the same raw materials.
Impurity levels vary based on the geological origin of the raw materials. If the geological context differs significantly, the relative intensities can distinguish between different types of production. Consequently, the Y-Rb-Sr diagram differentiates at least two groups of pastes (Figure 4). The first group (MNC 23737.1, MNC 23399 (stand), 2023.4.1, MNC 4992, and MNC 21134), with lower strontium levels, corresponds to the groups already identified as standard calcium-rich Sèvres porcelains (data in the squared area of Figure 3a). The diagram using the zirconium signal provides similar information.
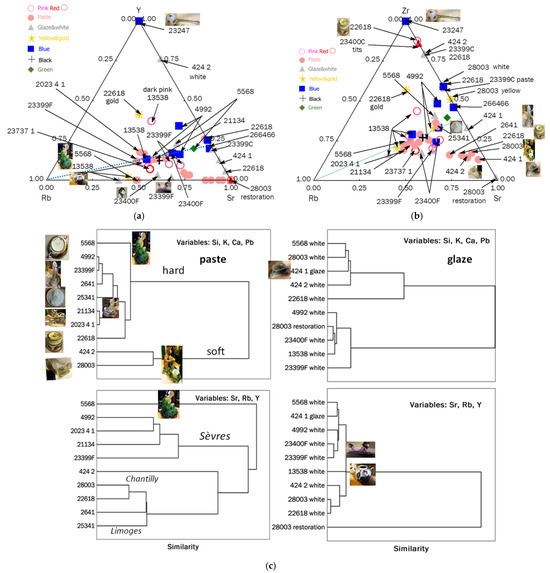
Figure 4.
Diagrams comparing the relative areas of characteristic XRF peaks of the impurities Y-Rb-Sr (a) and Zr-Rb-Sr (b) for the pastes and the different colors of enamels (pink, red, white/colorless, blue, green, yellow/gilding, and black). (c) Ward’s hierarchical clustering for different pastes is shown by using major (Si, K, Ca, and Pb) and trace elements (Sr, Rb, and Y) signals. The inventory numbers XXX (MNC XXX) are given.
The second group, rich in strontium (and containing the most calcium-rich paste), includes figurines MNC 2641 (biscuit), MNC 424.1, and MNC 424.2 (Chantilly-enameled figurines) and MNC 28003 (monkey figurine), along with artifact MNC 22618 (egg cup). This distinction also applies to the glazes. Binary plots of Figure 5 compare Y vs. Si (yttrium is associated with sands) and Ti vs. K (titanium, found in kaolins, generally as anatase and in quartz and feldspar as rutile), providing additional information. The specific characteristics of egg cup MNC 22618, distinct from Sèvres production, are confirmed, as are those of figurines MNC 28003 and MNC 5568. Comparing values obtained from different spots on the same object allows for estimating uncertainties due to measurement procedures and paste heterogeneity. Objects aligned vertically, indicating similar Si signals, may correspond—particularly for extreme values—to the use of different sands. In the binary Ti vs. K plot, the light brown coloring of the body in the biscuit (2023.4.1) is attributed to its higher Ti (and associated Fe) content.
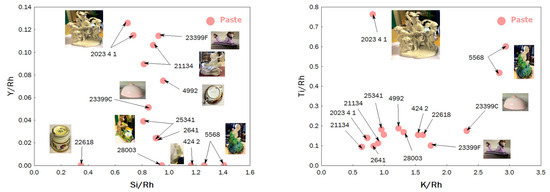
Figure 5.
Binary plots comparing the relative areas of X-ray fluorescence peaks characteristic of the elements Y vs. Si and Ti vs. K of the paste. The inventory numbers XXX (MNC XXX) are given.
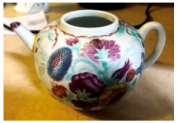
The signals of the major elements clearly distinguish soft-paste from hard-paste porcelains, while trace elements are more effective in recognizing production sites when sufficiently differentiated raw materials are used. The same applies to the analysis of glazes. Thus, the signals of the major elements, including lead, help distinguish glazes fired at low and high temperatures. Clustering based on characteristic impurities with significant signals better differentiates provenance: For example, the Venice teapot (MNC 13358) forms a unique group. Measurements from restored areas also form a separate category.
Given the uncertain attribution of the ochre-colored biscuit 2023.4.1, particular attention was paid to its paste and to the comparison with three objects with well-established attributions: the medallion depicting King Henry IV (MNC 25341) produced in Limoges, and two Sèvres biscuits (MNC 2641 and MNC 21134).
The Ward’s hierarchical diagrams (Figure 4), constructed from the signals of major elements (Si, K, Ca, and Pb) and trace elements (Sr, Rb, and Y), discriminate between different groups: Major elements distinguish paste types (hard or soft), while impurities reflect common or geologically similar raw materials. For uncolored glazes, the lead content is decisive. These diagrams also reveal objects not belonging to the studied groups, such as figurine MNC 5568.
The use of a primary filter (a stack of 25 µm Cu, 25 µm Ti, and 259 µm Al foils) enhances the peak-to-background ratio within the relevant energy range, as shown in Figure 6. Comparison of the biplots relating to flux signals (Pb, K, and Ca), characteristic flux traces (Sr and Rb), and sands or other raw materials (Y) containing quartz (feldspars, pegmatites) shows the proximity of the values measured for the brown biscuit 2023.4.1 to those of the Sèvres biscuits (MNC 2641 and MNC 21134), and their distinct difference from the Limoges biscuit (MNC 25341). The Y/Zr vs. Rb/Sr biplot maximizes the differences between paste types, making it a useful tool for future comparisons and confirming the attribution of biscuit 2023.4.1 to the Sèvres factory, as also suggested by the fleur-de-lys mark. Complementary Y vs. Si and Ti vs. K plots, shown in Figure 5, provide additional criteria.
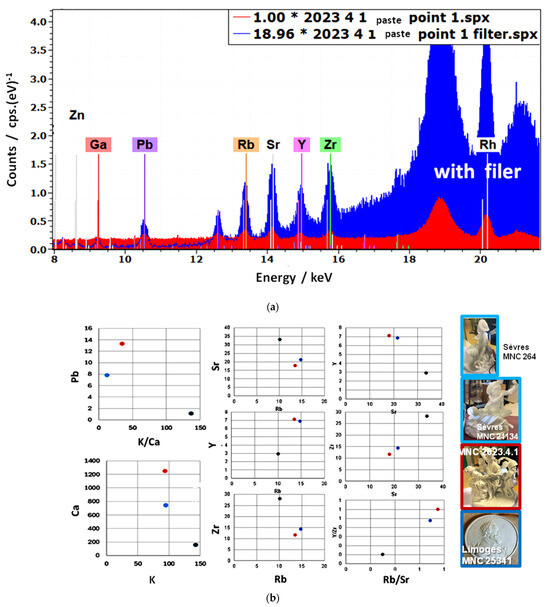
Figure 6.
Comparison of the net intensities (cps as counts) recorded with (blue) and without (red) filter (a) and Pb vs. K/Ca, Sr vs. Rb, Y vs. Sr, Y vs. Rb, Zr vs. Sr, Zr vs. Rb, and Y/Zr vs. Rb/Sr biplots (b) comparing peak areas of the brown biscuit (2023.4.1, not definitively attributed, red dot) with those measured on Limoges (MNC 25341, dark blue spot) and Sèvres (mean values of MNC 21134 and MNC 2641, light blue spot)) reference paste. Net intensities of high-energy trace elements (Rb, Y, Sr, and Zr) were taken only from filtered measurements, while K and Ca were measured without filtering.
3.2. Glazed Decoration
3.2.1. Blue
The rarity and geological diversity of cobalt deposits, as well as the evolution of “extraction” processes for materials used as sources of blue coloring, result in associated elements that can be comparable in quantity to cobalt itself, providing a unique signature of the coloring material’s provenance [22,45]. For the periods of interest—primarily the 18th-century production period—but also later periods involving forgeries or embellishments (where decoration is applied and fired onto initially “white” objects)—the main elements characterizing these cobalt sources include Mn, Cu, Bi, Ni, As, and Zn [3,4,17,29,30]. The primary sources of cobalt are expected to be the Ore Mountains (Erzgebirge, Saxony, and Bohemia), the Vosges Mountains (Sainte-Marie-aux-Mines, France) [45], and the Giftain Valley (now called Gistain in Spanish and Chistau in Aragon) in the Pyrenean Mountains of Aragon, Spain [22,46,47]. Other minor mining sites have also been identified in Germany [45].
The spectra (Figure 7) and diagrams (Figure 8), both ternary and binary, clearly distinguish three types of cobalt sources:
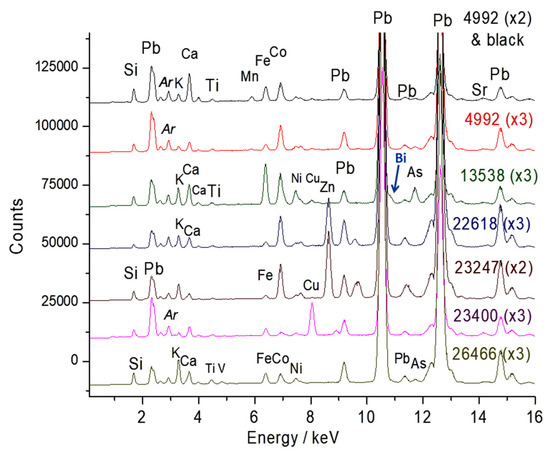
Figure 7.
Spectra recorded on blue areas. Intensity has been multiplied by 2 or 3 in order to highlight the comparison. The inventory numbers XXX (MNC XXX) and magnification of the spectrum are given.
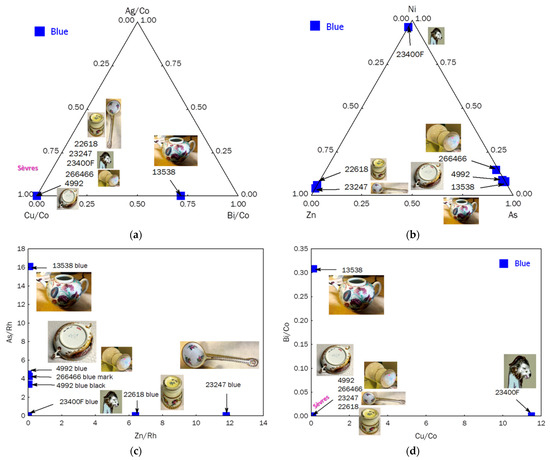
Figure 8.
Ternary diagrams comparing the relative areas of characteristic XRF peaks of the impurities associated with cobalt, Ag-Cu-Bi ((a) normalized vs. Co Kα peak) and Ni-Zn-As (b) for the blue areas (overglaze and mark); As vs. Zn ((c) signals normalized with Rh peak) and Bi vs. Cu ((d) signals normalized with Co Kα peak) are given.
- (i)
- The teapot (MNC 13538), decorated by the workshop of A. Bon [28], likely on a form previously produced at the Vezzi factory, uses cobalt rich in arsenic and bismuth, with traces of copper and low levels of nickel and zinc, presumably from the Erzgebirge, which is consistent with early Italian production [10,22].
- (ii)
- The blue color observed in pieces MNC 4992 (bowl with “R” letter mark, dating to 1770) and MNC 26466 (vase with dot mark, dating to 1750) is similar, indicating the use of the same cobalt source over a significant period, likely from the Giftain Valley as indicated in some documents [20]. Some manganese and nickel are associated with cobalt, along with traces of arsenic but without any bismuth.
- (iii)
- The turquoise blue tripod stand of the Rambouillet Castle dairy bowl (MNC 23400) contains an addition of copper to achieve this color, which explains the higher level of nickel, as nickel is often associated with copper.
- (iv)
- The two objects with “petits vases et guirlandes” decoration (MNC 22618 and MNC 23247), inspired by the Comtesse du Barry tableware set, show a high zinc signal, ruling out the possibility of it being an impurity. Although Co-Zn-Al spinel was first synthesized in 1775 [48], it was only used in blue glaze a few decades later, as seen in 19th-century Meissen porcelain [11]. In fact, the elements associated with cobalt vary not only according to the mining source but also due to the “refining” processes and deliberate combinations with other chemical elements to achieve specific colors using new pigments. Therefore, the decoration of the objects likely occurred after the 18th century, specifically decades after the commissioning of the table service by Countess du Barry around 1769–1770 [32].
3.2.2. Gold-Based Decoration
Figure 9 compares the XRF signal of gold with that of two elements used for the precipitation of colloidal gold from the stock solution in aqua regia, tin according to the Kunckel method for preparing Cassius purple [49,50], or arsenic, according to Perrot’s method for producing the gold nanoparticles required for the preparation of ruby glass [51,52,53,54]. These associated minor elements can yield colors ranging from pink to purple, depending on the size and composition of the gold nanoparticles [49]. We observe the association of gold with tin in the pink/burgundy colors of objects MNC 23400 (turquoise breast bowl stand) and MNC 22618 and with arsenic in the Vezzi-Bon teapot and the pink breast bowl stand (MNC 23399).
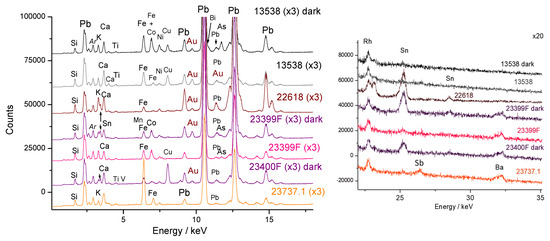
Figure 9.
Representative XRF spectra recorded on pink to red color (left ~0–18 keV range; right, 19–35 keV energy range).
The use of arsenic in the pink background of tripod MNC 23399 is clearly intentional to achieve the desired color, as evidenced by the gradual decrease in arsenic levels along a straight line toward the measurement on the burgundy lines of object MNC 23400. The technique of Perrot (real name Bernardo Perrotti, originally from Altare, Italy, and established in Orléans and Paris) [51,52,53] being of Italian origin makes its use by Antoni Bon understandable. Therefore, the decorations of the two supports were produced using both Perrot’ and Kunckel’ preparation methods, indicating that these two techniques were mastered at Sèvres.
3.2.3. Yellow Color
The ternary diagrams in Figure 10 enable the evidence of colors created either by metallic gold nanoparticles or traditional mineral pigments. Three types of yellows are observed: almost pure tin yellow for bowl MNC 4992 (Sèvres, 1770), and two yellows containing varying levels of antimony (Naples yellows with a pyrochlore structure [55,56,57,58,59,60]) for the monkey MNC 28003 (Chantilly) figure and the MNC 13538 Vezzi-Bon teapot. The red color of vase MNC 23737.1 is either opacified with calcium antimonite or modified with antimony yellow (Figure 9).
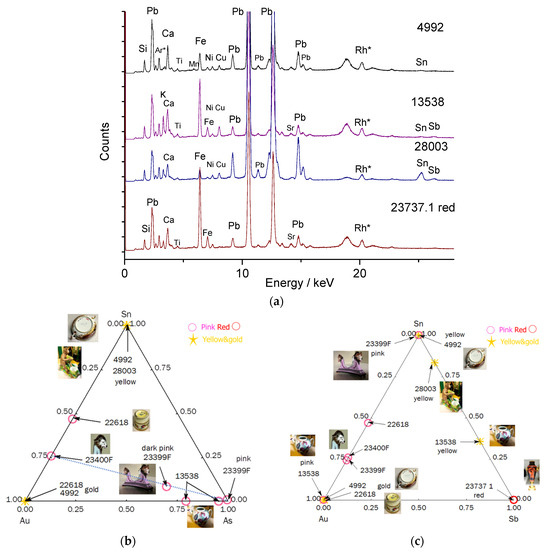
Figure 10.
Representative spectra (a) and ternary diagrams (b,c) comparing the relative areas of characteristic XRF peaks characteristic of the elements that could be associated with the preparation of gold nanoparticles, namely, tin (Sn) and arsenic (As) or the formation of yellow pigment (Sn or Sb). Rh*: Rhodium anode and Compton peak.
3.3. Detailed Raman Study of Two Marie-Antoinette Breast Cups
We observed the limitations of pXRF measurements alone. To gain a deeper understanding of the enameling techniques, Raman analyses were conducted on the most iconic objects in the studied corpus. Figure 11 visually compares the supports of the Rambouillet Castle dairy bowl in terms of background color and specific coloring details. Figure 11 and Figure 12 present the Raman spectra of the pink (MNC 23399) and turquoise (MNC 23400) backgrounds, respectively.
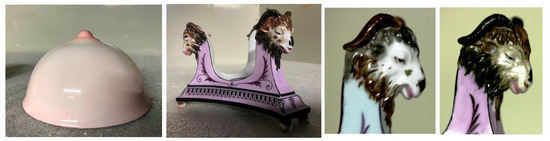
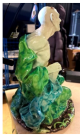
Figure 11.
View of one of the “flesh” colored cups (white to pink), of the support with a pink background, and detail of the sheep’s heads with a turquoise (MNC 23400) and pink (MNC 23399) background.
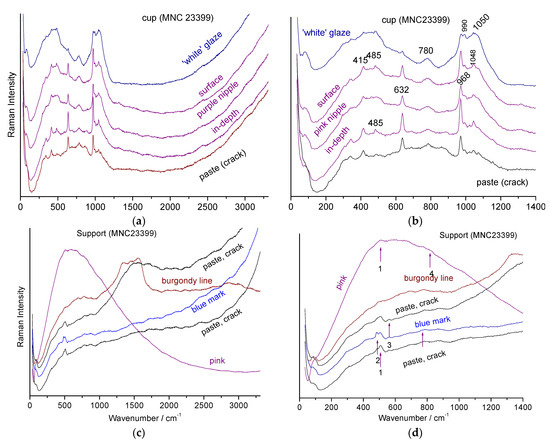
Figure 12.
Representative spectra collected on the support and section of the MNC 23399 breast bowl: (a,c) full spectral window. On the right, a zoomed view of the lower wavenumber range (b,d). The colors or nature of the analysis points are indicated (1: 508, 2: 490, 3: 565, and 4: 815 cm−1).
For both objects, similar Raman signature contrasts are evident: intense spectra for the enamel of the cup, with broad bands around 500 and 1050 cm−1, characteristic of an amorphous phase of lead silicate [61,62,63,64], along with narrow peaks around 635 and 970 cm−1, characteristic of the β-wollastonite phase (CaSiO3, noted #2 in Figure 12) [13,14,65]. This pattern is analogous to the signature found on the Sèvres 1781 plate, which has been extensively characterized for its composition and phases [20,66]. Focusing on the surface shows a dominant lead glass signature, while deeper glaze analysis reveals an increased β-wollastonite signature, indicating significant precipitation at the glaze–body interface.
In contrast, the two breast bowl stands show a weak spectrum with bands around 500 cm−1 (#1 in Figure 12), as well as another very weak and broad component around 815 cm−1 (#4). The narrow quartz band (#2, 465 cm−1) [61,65,66] and the main band of feldspar (508 cm−1) [61,66] are also sometimes observed.
The Raman signatures of Figure 12c,d are characteristic of a hard-paste containing mullite (low-intensity broad components at ~300 and 430 cm−1), quartz (narrow peak at ~464 cm−1), and the amorphous aluminosilicate phase associated with mullite (low-intensity broad component at ~480 cm−1) [61,62]. Differentiating between the spectrum of mullite and the associated amorphous phase is difficult with the green laser wavelength, especially with a mobile device, as the spectra are very similar and weak.
The pink and burgundy-colored areas/lines show strong and rather narrow fluorescence (Figure 12c,d and Figure 13a), indicative of the presence of metal nanoparticles (NPs) [67]. Indeed, depending on their size, gold NPs produce colors ranging from pink to purple (regardless of the preparation method, such as Cassius’ purple or Perrot’ red). Note the variable luminescence profile for the pink and burgundy decoration (Figure 12c,d and Figure 13a,c,d).
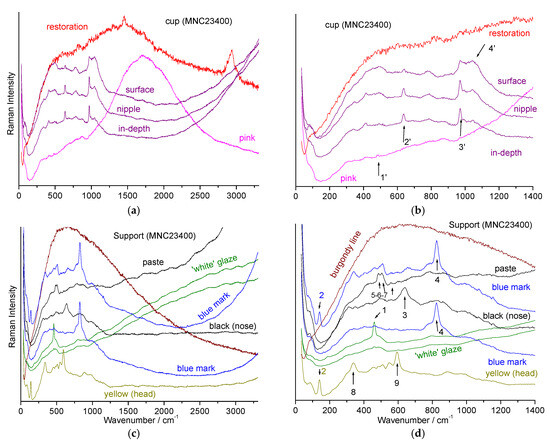
Figure 13.
Representative spectra collected on the MNC 23400 stand and breast bowl ((a,c) full spectral window). On the right, zoom in on the low energy range (b,d). The colors and nature of the analysis points are indicated, specifying whether the measurement is carried out on the surface, in the layer or at depth (~ten(s) of μm); 1′: 490; 2′: 635; 3′: 972; 4′: 1045; 1: 462; 2: 141; 3: 640; 4: 824; 5: 410 and 460; 6: 485; 7: 508; 8: 337; 9: 593.
Black is obtained with a spinel phase, formed by mixtures of varying proportions of Fe2O3, MnO2, Cr2O3, and CuO [67,68,69]. Identifying the exact composition of this phase from the Raman spectrum alone is difficult [65,68,69], but the 640 cm−1 value is consistent with an Mn-rich spinel.
The hairs on the top of the sheep’s head (spot diameter a few µm2) are colored tin yellow (characteristic spectrum with a strong peak around 140 cm−1 and a component around 330 cm−1) [55,56,57,58,59,60]. This is consistent with the Sn-Au-Sb diagram in Figure 9, where the yellow of the pink-colored sheep’s head MNC 23399 (spot diameter ~1 mm2) is located near the Sn vertex. This tin yellow is also found in the blue mark of MNC 23400 (Figure 9), indicating contamination during preparation, which also shows the intense peak around 815 cm−1 and its shoulder around 780 cm−1 (noted #4 in Figure 9), characteristic of a lead–calcium/potassium arsenate with an apatite structure [30,49,53,54,55], formed when cobalt from hydrothermal vein mines reacts with lead-based enamel [22,66,70,71,72].
The breast-shaped milk cups are unambiguously made from soft-paste glazed with lead-rich enamel and fired at a relatively low temperature (petit feu, probably 700–800 °C) [26]. The pink color is achieved by dispersing gold nanoparticles (NPs), as confirmed by pXRF (Figure 9).
The three-sheep supports are hard pastes, but the signature is not strongly mullitic, suggesting it may be less aluminum-rich than, for instance, Meissen paste [10,61,62].
The glaze is colored with NPs, and the decoration was completed using a muffle or petit feu firing (especially for the tin-yellow overglaze), with the mark applied during this second firing.
4. Conclusions
Table 2 summarizes the most relevant characteristics for identifying the provenance and evolution of the features. Figure 14 compares the different types of pastes observed in this study with a Meissen paste.
Table 2.
Raman analyzed areas of Marie-Antoinette cups and supports.
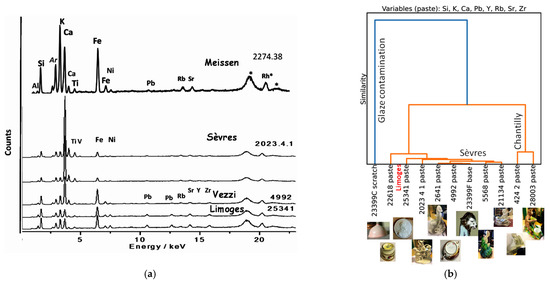
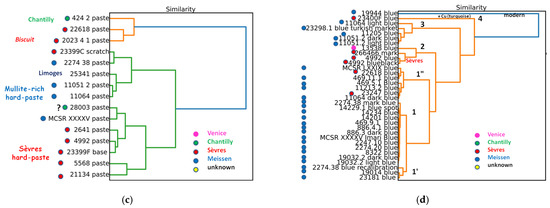
Figure 14.
Comparison of (a) pXRF spectra of pastes in Meissen, Sèvres, Limoges, and Venice (Vezzi) productions; two spectra obtained at different points show the rather good reproducibility of the signatures; (b) hierarchical clustering classification by using peak areas of major elements (Si, K, Ca, and Pb), trace elements (Y, Zr, Rb, and Sr) measured on the body surface for only French; and (c) French and Meissen artifacts (variables are Si, K, Ca, Pb, Sr, Y, Zr, and Rb normalized by Rh); (d) hierarchical clustering classification with variables Ag/Co, Cu/Co, Bi/Co, As/Co, Zn/Co, and Ni/Co measured on the blue decorations and marks. MNC inventory numbers are given, see Table 1 and reference [4]. Rh*: Rhodium anode and Compton peak.
Examination of the XRF spectra from the main factories of the mid-18th century (Figure 14a) highlights that the key differences involve the relative proportions of Si/K/Ca for the major elements and Rb/Sr/Zr for the trace elements. The iron level is also a criterion for discrimination. Meissen paste is the richest in potassium, and since it is fired at very high temperatures, it forms more mullite compared to other porcelain bodies, which is also clearly visible in the Raman spectra [61,62]. The first productions of Sèvres are rich in calcium and contain less mullite. Porcelains from Venice and Limoges show intermediate characteristics (less calcium and more iron in the case of Venice). The addition of filters provides more precision in measuring low-intensity peaks [73,74] but requires longer counting times. The significant intensity of traces of Y, Rb, Sr, and even Zr negates the need for filters when access time to objects is limited. The value of these last three trace elements as a provenance marker has also been recognized in PIXE analyses [75].
The comparison of similarity links visualized by Ward’s technique in the hyperspace of the chosen data (Figure 14b,c) provides additional insights and raises some questions. The classifications based on the major element signals (Si, K, Ca, and Pb) and trace elements (Y, Rb, Sr, Zr) producing significant XRF peaks in the pastes align well with the established attributions, confirming findings from previous work on the specificities of paste compositions. For example, the soft-paste porcelains of Chantilly and Sèvres are clearly distinct. However, the similarity between the compositions of Meissen and Limoges porcelain is striking if Pb traces of Limoges paste (Figure 2) are not considered. The proximity of the paste signature of artifact MNC 22618 to that of Limoges suggests that this item may be a later “replica” (likely from the 19th century), made in the style of the service of the Countess du Barry.
Examination of the clustering diagram (Figure 14d), constructed from signals normalized to cobalt and elements associated with cobalt in ores (namely, Ag, Cu, Bi, As, Zn, and Ni), clearly highlights the use of modern ingredients (MNC 19944 Meissen figurine, Group 4) or the addition of copper to achieve a color between blue and turquoise (MNC 23400 Sèvres, Group 4). The differences in other groups are less clear and may reflect the use of cobalt from different sources or periods. The Sèvres objects in Group 2 are relatively well grouped, while the Venice object is well isolated. Remarkable homogeneity is observed in subgroup 1, with little difference from subgroup 1′, both comprising Meissen objects. Group 3, which is quite distinct, mainly consists of figurines that were likely enameled afterward. More data of this kind and detailed examination are necessary to advance the use of these classification techniques.
Supplementary Materials
The following supporting information can be downloaded at https://www.mdpi.com/article/10.3390/ceramics7040120/s1, XRF-corrected data.
Author Contributions
Conceptualization, P.C.; methodology, P.C., G.S.F., M.G. (Mareike Gerken), and M.G. (Michele Gironda); investigation, P.C., M.G. (Mareike Gerken), and M.G. (Michele Gironda); resources, V.M.; data curation, P.C., G.S.F., and M.G. (Mareike Gerken); writing—original draft preparation, P.C. and G.S.F.; writing—review and editing, P.C., G.S.F., M.G. (Mareike Gerken), M.G. (Michele Gironda), and V.M.; funding acquisition, P.C. All authors have read and agreed to the published version of the manuscript.
Funding
The work was partially funded by the French Agence Nationale de la Recherche EnamelFC project ANR-19-CE27-0019-02.
Institutional Review Board Statement
Not applicable.
Informed Consent Statement
Not applicable.
Data Availability Statement
The original contributions presented in the study are included in the article/Supplementary Materials; further inquiries can be directed to the corresponding author.
Acknowledgments
Makbule Özge Özler who developed and executed the code for clustering analysis in Python and Atika Chemni, Head of the Laboratory of Sèvres National Factory for her help in the preparation of the measurement campaign are kindly acknowledged. Permission from Sèvres-Cité de la Céramique to study the objects and publish these images of work in progress was granted by V. Mesqui, curator at the Musée national de Céramique and co-author of this manuscript.
Conflicts of Interest
Authors Mareike Gerken and Michele Gironda were employed by the company Bruker Nano Analytics. The authors declare that the research was conducted in the absence of any commercial or financial relationships that could be construed as a potential conflict of interest.
References
- Janssens, K.; De Nolf, W.; Van Der Snickt, G.; Vincze, L.; Vekemans, B.; Terzano, R.; Brenker, F.E. Recent trends in quantitative aspects of microscopic X-ray fluorescence analysis. TrAC Trends Anal. Chem. 2010, 29, 464–478. [Google Scholar] [CrossRef]
- Alfeld, M.; Janssens, K.; Dik, J.; de Nolf, W.; van der Snickt, G. Optimization of mobile scanning macro-XRF systems for the in situ investigation of historical paintings. J. Anal. At. Spectrom. 2011, 26, 899–909. [Google Scholar] [CrossRef]
- Casadio, F.; Rose, V. High-resolution fluorescence mapping of impurities in historical zinc oxide pigments: Hard X-ray nanoprobe applications to the paints of Pablo Picasso. Appl. Phys. 2013, A 111, 1–8. [Google Scholar] [CrossRef]
- Mosca, S.; Frizzi, T.; Pontone, M.; Alberti, R.; Bombelli, L.; Capogrosso, V.; Nevin, A.; Valentini, G.; Comelli, D. Identification of pigments in different layers of illuminated manuscripts by X-ray fluorescence mapping and Raman spectroscopy. Microchem. J. 2016, 124, 775–784. [Google Scholar] [CrossRef]
- Romano, F.P.; Caliri, C.; Nicotra, P.; Di Martino, S.; Pappalardo, L.; Rizzo, F.; Santos, H.C. Real-time elemental imaging of large dimension paintings with a novel mobile macro X-ray fluorescence (MA-XRF) scanning technique. J. Anal. Atom Spectrom. 2017, 32, 773–781. [Google Scholar] [CrossRef]
- Alfeld, M.; de Viguerie, L. Recent developments in spectroscopic imaging techniques for historical paintings—A review. Spectrochim. Acta Part B Atom. Spectrosc. 2017, 136, 81–105. [Google Scholar] [CrossRef]
- Janssens, K.; Van der Snickt, G.; Vanmeert, F.; Legrand, S.; Nuyts, G.; Alfeld, M.; Monico, L.; Anaf, W.; De Nolf, W.; Vermeulen, M.; et al. Non-invasive and non-destructive examination of artistic pigments, paints, and paintings by means of X-ray methods. In Analytical Chemistry for Cultural Heritage; Mazzeo, R., Ed.; Topics in Current Chemistry Coll.; Springer: Cham, Switzerland, 2017; pp. 77–128. [Google Scholar] [CrossRef]
- Saverwyns, S.; Currie, C.; Lamas-Delgado, E. Macro X-ray fluorescence scanning (MA-XRF) as tool in the authentication of paintings. Microchem. J. 2018, 137, 139–147. [Google Scholar] [CrossRef]
- Edwards, H.G.M.; Vandenabeele, P.; Colomban, P. Raman Spectroscopy in Cultural Heritage Preservation; Springer: Cham, Switzerland, 2022. [Google Scholar]
- Colomban, P.; Gironda, M.; Edwards, H.G.M.; Mesqui, V. The enamels of the first (softpaste) European blue-and-white porcelains: Rouen, Saint-Cloud and Paris factories: Complementarity of Raman and X-ray fluorescence analyses with mobile instruments to identify the cobalt ore. J. Raman Spectrosc. 2021, 52, 2246–2261. [Google Scholar] [CrossRef]
- Colomban, P.; Simsek Franci, G.; Gerken, M.; Gironda, M.; Mesqui, V. Non-Invasive On-Site XRF and Raman Classification and Dating of Ancient Ceramics: Application to 18th and 19th Century Meissen Porcelain (Saxony) and Comparison with Chinese Porcelain. Ceramics 2023, 6, 2178–2212. [Google Scholar] [CrossRef]
- Colomban, P.; Milande, V.; Lucas, H. On-site Raman analysis of Medici porcelain. J. Raman Spectrosc. 2004, 35, 68–72. [Google Scholar] [CrossRef]
- Colomban, P.; Robert, I.; Roche, C.; Sagon, G.; Milande, V. Identification des porcelaines “tendres” du 18ème siècle par spectroscopie Raman: Saint-Cloud, Chantilly, Mennecy et Vincennes/Sèvres. Rev. D’archéométrie 2004, 28, 153–167. [Google Scholar] [CrossRef]
- Mancini, D.; Dupont-Logié, C.; Colomban, P. On-site identification of Sceaux porcelain and faience using a portable Raman instrument. Ceram. Int. 2016, 42, 14918–14927. [Google Scholar] [CrossRef]
- Casadio, F.; Bezur, A.; Domoney, K.; Eremin, K.; Lee, L.; Mass, J.L. X-ray fluorescence applied to overglaze enamel decoration on eighteenth- and nineteenth-century porcelain from central Europe. Stud. Conserv. 2012, 57, S61–S72. [Google Scholar] [CrossRef]
- Bezur, A.; Casadio, F. The Analysis of Porcelain Using Handheld and Portable X-ray Fluorescence Spectrometer. In Studies in Archaeological Sciences: Handheld XRF for Art and Archaeology; Shugar, A., Mass, J., Eds.; Leuven University Press: Leuven, Belgium, 2013. [Google Scholar]
- Edwards, H.G.M. Porcelain Analysis and Its Role in the Forensic Attribution of Ceramic Specimens; Springer: Cham, Switzerland, 2022. [Google Scholar]
- Colomban, P.; Edwards, H.G.M.; Fountain, C. Raman spectroscopic and SEM/EDXS analyses of high translucent Nantgarw porcelain. J. Eur. Ceram. Soc. 2020, 40, 4664–4675. [Google Scholar] [CrossRef]
- Ricciardi, P.; Colomban, P.; Milande, V. Non-destructive Raman characterization of Capodimonte and Buen Retiro porcelain. J. Raman Spectrosc. 2008, 39, 1113–1119. [Google Scholar] [CrossRef]
- Maggetti, M.; d’Albis, A. Phase and compositional analysis of a Sèvres soft paste porcelain plate from 1781, with a review of early porcelain techniques. Eur. J. Miner. 2017, 29, 347–367. [Google Scholar] [CrossRef]
- Kingery, W.D. The development of European porcelain. In High-Technology Ceramics: Past, Present, and Future—The Nature of Innovation and Change in Ceramic Technology; Technology and Style, Ceramic and Civilization Series; Kingery, W.D., Ed.; The American Ceramic Society: Westerville, OH, USA, 1986; Volume III, pp. 153–180. [Google Scholar]
- Colomban, P.; Kirmizi, B.; Simsek Franci, G. Cobalt and associated impurities in blue (and green) glass, glaze and enamel: Relationships between raw materials, processing, composition, phases and international trade. Minerals 2021, 11, 633. [Google Scholar] [CrossRef]
- d’Albis, A. The history of innovation in European porcelain manufacture and the evolution of style: Are they related? In Technology and Style, Ceramic and Civilization; Kingery, W.D., Ed.; The American Ceramic Society: Westerville, OH, USA, 1986; Volume III, pp. 397–412. [Google Scholar]
- d’Albis, A. Steps in the Manufacture of the soft-paste porcelain of Vincennes, According to the book of Hellot. In Ceramic and Civilization I: Ancient Technology to modern Science; Kingery, W., Ed.; The American Ceramic Society: Colombus, OH, USA, 1985; pp. 257–272. [Google Scholar]
- d’Albis, A. La Marquise de Pompadour et la manufacture de Vincennes. Sèvres. Rev. De La Société Des Amis Du Musée Natl. De Céramique 1992, 1, 52–63. [Google Scholar] [CrossRef]
- d’Albis, A. Traité de la Porcelaine de Sèvres; Editions Faton: Paris, France, 2003. [Google Scholar]
- Cazayus-Claverie, O. L’apothicaire Vilaris, sa vie, son oeuvre, son rôle dans la découverte du kaolin: Odile Cazayus-Claverie, L’apothicaire bordelais Hilaire Vilaris (1719-1792), son rôle dans la découverte du kaolin et dans la naissance de la porcelaine dure en France. Rev. D’histoire De La Pharm. 1991, 79, 220–225. Available online: https://www.persee.fr/doc/pharm_0035-2349_1991_num_79_289_3167_t1_0220_0000_1 (accessed on 18 September 2024).
- Melegati, L. Porcelaines de Vezzi à Sèvres. Sèvres Rev. De La Société Des Amis Du Musée Natl. De Céramique 1996, 5, 42–47. [Google Scholar] [CrossRef]
- Schwartz, S. The “Etruscan” Style at Sèvres: A Bowl from Marie-Antoinette’s Dairy at Rambouillet. Metrop. Mus. J. 2002, 37, 259–266. [Google Scholar] [CrossRef]
- Bastien, V. Quelques pièces historiques en porcelaine de Sèvres. Sèvres Rev. De La Société Des Amis Du Musée Natl. De Céramique 2020, 29, 66–71. [Google Scholar] [CrossRef]
- Worley, M. Pierre Julien: Sculptor to Queen Marie-Antoinette; iUniverse: Bloomington, Indiana, 2003. [Google Scholar]
- Davillier, J.C. Les Porcelaines de Sèvres de Mme du Barry: Exploration des Trésors de Porcelaine de Sèvres de Mme du Barry; Good Press: Boca Raton, FL, USA, 2021. [Google Scholar]
- Cassin, B. Objets Migrateurs, Trésors sous Influences; Catalogue Exposition Centre de la Vieille Charité, Marseille, Avril–October 2022; Musées de Marseille & Lienart Editions: Marseille, France, 2022. [Google Scholar]
- Paul, C. Un médaillon en porcelaine de Limoges à l’effigie du roi Henri IV. Sèvres Rev. De La Société Des Amis Du Musée Natl. De Céramique 2020, 29, 76–78. [Google Scholar] [CrossRef]
- Boucher, A. Merveilles! Le Musée National de Céramique fête ses 200 Ans; Catalogue Exposition 10 October 2024–31 Mai 2025; Sèvres Manufacture et Musée National & Gourcuff Gradenigo: Montreuil, France, 2024. [Google Scholar]
- Deldicque, M. Meissen and Chantilly Porcelain. La Fabrique de L’extravagance; Catalogue Exposition Domaine de Chantilly, 5 September 2020–3 January 2021; Editions d’Art Monelle Hayot: Saint-Rémy-en-l’Eau, France, 2020. [Google Scholar]
- d’Albis, A. La manufacture de Vincennes-Sèvres à la recherche de la porcelaine dure 1747–1768. Sèvres Rev. De La Société Des Amis Du Musée Natl. De Céramique 1995, 4, 48–63. [Google Scholar] [CrossRef]
- Colomban, P.; Gironda, M.; Simsek Franci, G.; d’Abrigeon, P. Distinguishing Genuine Imperial Qing Dynasty Porcelain from Ancient Replicas by On-site Noninvasive XRF and Raman Spectroscopy. Materials 2022, 15, 5147. [Google Scholar] [CrossRef]
- Colomban, P.; Simsek Franci, G.; Burlot, J.; Gallet, X.; Zhao, B.; Clais, J.B. Non-Invasive on-Site pXRF Analysis of Coloring Agents, Marks and Enamels of Qing Imperial and Non-Imperial Porcelain. Ceramics 2023, 6, 447–474. [Google Scholar] [CrossRef]
- Colomban, P.; Simsek Franci, G.; Gironda, M.; d’Abrigeon, P.; Schumacher, A.-C. pXRF Data Evaluation Methodology for On-Site Analysis of Precious Artifacts: Cobalt Used in the Blue Decoration of Qing Dynasty Overglazed Porcelain Enameled at Customs District (Guangzhou), Jingdezhen and Zaobanchu (Beijing) Workshops. Heritage 2022, 5, 1752–1778. [Google Scholar] [CrossRef]
- Available online: https://xrfcheck.bruker.com/InfoDepth (accessed on 6 March 2024).
- Demirsar Arli, B.; Simsek Franci, G.; Kaya, S.; Arli, H.; Colomban, P. Portable X-ray Fluorescence (p-XRF) uncertainty estimation for glazed ceramic analysis: Case of Iznik Tiles. Heritage 2020, 3, 1302–1329. [Google Scholar] [CrossRef]
- Burlot, J.; Gallet, X.; Simsek Franci, G.; Bellot-Gurlet, L.; Colomban, P. Non-invasive on-site pXRF analysis of coloring agents of under-and over-glazes: Variability and representativity of measurements on porcelain. Colorants 2023, 2, 42–57. [Google Scholar] [CrossRef]
- Le Duc, G. Porcelaine Tendre de Chantilly au XVIIIe Siècle; Fernand Hazan: Paris, France, 1996. [Google Scholar]
- Kissin, S.A. Five-element (Ni-Co-As-Ag-Bi) veins. Geosci. Can. 1992, 19, 113–124. Available online: https://journals.lib.unb.ca/index.php/gc/article/view/3768/4282 (accessed on 18 September 2024).
- Federico, F. (Barón de Dietrich), Description des Gîtes de Minéral des Forges et des Salines des Pyrénnées, Suivie D’observations sur le fer mazé et sur les Mines des Sards en Poitou; Didot & Cuchet Libraire: Paris, France, 1786. [Google Scholar]
- Anonymous. L’activité Minière dans la Region du Cirque de Barrosa On-Line. Available online: http://cirquedebarrosa.free.fr/ (accessed on 2 July 2024).
- Colomban, P. The destructive/non-destructive identification of enameled pottery, glass artifacts and associated pigments—A brief overview. Arts 2013, 2, 77–110. [Google Scholar] [CrossRef]
- Colomban, P. The use of metal nanoparticles to produce yellow, red and iridescent colour, from Bronze Age to Present Times in Lustre pottery and glass: Solid state chemistry, spectroscopy and nanostructure. J. Nano Res. 2009, 8, 109–132. [Google Scholar] [CrossRef]
- d’Albis, A. Les débuts des pourpres en France, de Chantilly à Vincennes Salomon Taunay et son fils Pierre Henri Antoine. Sèvres Rev. De La Société Des Amis Du Musée Natl. De Céramique 1994, 3, 34–39. [Google Scholar] [CrossRef]
- Geyssant, J.; Gorget, C.; Tétart-Vittu, F. Bernard Perrot (1640–1709), Secrets et chefs-d’œuvre des verreries royales d’Orléans; Exhibition Catalogue Musée des Beaux-Arts d’Orléans; SOMOGY Editions d’Arts: Paris, France, 2013. [Google Scholar]
- Geyssant, J. Bernard Perrot (1640–1709), maître de la verrerie d’Orléans. Ses innovations dans le contexte verrier européen du XVIIe siècle. Sèvres Rev. De La Société Des Amis Du Musée Natl. De Céramique 2014, 23, 30–43. [Google Scholar] [CrossRef]
- Colomban, P.; Kirmizi, B. Non-invasive on-site Raman study of white and polychrome enamelled glass artefacts in imitation of porcelain assigned to Bernard Perrot and his followers. J. Raman Spectrosc. 2020, 51, 133–146. [Google Scholar] [CrossRef]
- Biron, I.; Gratuze, B.; Pistre, S.; Lehuede, P. Etude en laboratoires d’objets en verre attribués à Bernard Perrot. Bull. De L’association Française Pour L’archéologie Du Verre 2011, 19–26. [Google Scholar]
- Sakellariou, K.; Miliani, C.; Morresi, A.; Ombelli, M. Spectroscopic investigation of yellow majolica glazes. J. Raman Spectrosc. 2004, 35, 61–67. [Google Scholar] [CrossRef]
- Sandalinas, C.; Ruiz-Moreno, S.; Lopez-Gil, A.; Miralles, J. Experimental confirmation by Raman spectroscopy of a Pb-Sn-Sb triple oxide yellow pigment in sixteenth-century Italian pottery. J. Raman Spectrosc. 2006, 37, 1146–1153. [Google Scholar] [CrossRef]
- Rosi, F.; Manuali, V.; Miliani, C.; Brunetti, B.G.; Sgamellotti, A.; Grygar, T.; Hradil, D. Raman scattering features of lead pyroantimonate compounds. Part I: XRD and Raman characterization of Pb2Sb2O7 doped with tin and zinc. J. Raman Spectrosc. 2009, 40, 107–111. [Google Scholar] [CrossRef]
- Pelosi, C.; Agresti, G.; Santamaria, U.; Mattei, E. Artificial yellow pigments: Production and characterization through spectroscopic methods of analysis. E-Preserv. Sci. 2010, 7, 108–115. Available online: http://www.morana-rtd.com/e-preservationscience/2010/Pelosi-10-05-2010.pdf (accessed on 25 May 2023).
- Pereira, M.; de Lacerda-Aroso, T.; Gomes, M.J.M.; Mata, A.; Alves, L.V.; Colomban, P. Ancient Portuguese Ceramic Wall Tiles («Ajulejos»): Characterization of the Glaze and Ceramic Pigments. J. Nano Res. 2009, 8, 79–88. [Google Scholar] [CrossRef]
- Burlot, J.; Vangu, D.; Bellot-Gurlet, L.; Colomban, P. Raman identification of pigments and opacifiers. Interest and limitation of multivariate analysis by comparison with solid state spectroscopical approach. I. Lead-tin and Naples yellow. J. Raman Spectrosc. 2024, 55, 161–183. [Google Scholar] [CrossRef]
- Colomban, P.; Treppoz, F. Identification and Differentiation of Ancient and Modern European Porcelains by Raman Macro- and Microspectroscopy. J. Raman Spectrosc. 2001, 32, 93–102. [Google Scholar] [CrossRef]
- Colomban, P.; Milande, V. On-site Raman analysis of the earliest known Meissen porcelain and stoneware. J. Raman Spectrosc. 2006, 37, 606–613. [Google Scholar] [CrossRef]
- Colomban, P.; Tournié, A.; Bellot-Gurlet, L. Raman Identification of glassy silicates used in ceramic, glass and jewellry: A tentative differentiation guide. J. Raman Spectrosc. 2006, 37, 841–852. [Google Scholar] [CrossRef]
- Simsek, G.; Geckinli, A.E. An assessment study of tiles from Topkapı Palace Museum with energy-dispersive X-ray and Raman spectrometers. J. Raman Spectrosc. 2012, 43, 917–927. [Google Scholar] [CrossRef]
- Pinet, M.; Smith, D.C.; Lasnier, B. Utilité de la microsonde Raman pour l’identification non-destructive des gemmes, in La Microsonde Raman en Géologie. Rev. De Gemmol.-Paris 1992. june-N°Hors Série. [Google Scholar]
- Colomban, P.; Maggetti, M.; d’Albis, A. Non-invasive Raman identification of crystalline and glassy phases in a 1781 Sèvres Royal factory soft-paste porcelain plate, J. Eur. Cer. Soc. 2018, 38, 5228–5233. [Google Scholar] [CrossRef]
- Colomban, P.; Ngo, A.-T.; Fournery, N. Non-invasive Raman Analysis of 18th Century Chinese Export/Armorial Overglazed Porcelain: Identification of the Different Enameling Technology. Heritage 2022, 5, 233–259. [Google Scholar] [CrossRef]
- Caggiani, M.C.; Colomban, P. Raman identification of strongly absorbing phases: The ceramic black pigments. J. Raman Spectrosc. 2011, 42, 839–943. [Google Scholar] [CrossRef]
- Cvejic, Z.; Rakic, S.; Kremenovic, A.; Antic, B.; Jovalekic, C.; Colomban, P. Nanosize ferrites obtained by ball milling: Crystal structure, cation distribution, size-strain analysis and Raman investigations. Solid State Sci. 2006, 8, 908–915. [Google Scholar] [CrossRef]
- Van Pevenage, J.; Lauwers, D.; Herremans, D.; Verhaeven, E.; Vekemans, B.; De Clercq, W.; Vincze, L.; Moens, L.; Vandenabeele, P. A combined spectroscopic study on Chinese porcelain containing Ruan-Cai colours. Anal. Methods 2014, 6, 387–394. [Google Scholar] [CrossRef]
- Burlot, J.; Vangu, D.; Bellot-Gurlet, L.; Colomban, P. Raman identification of pigments and opacifiers: Interest and limitation of multivariate analysis by comparison with solid state spectroscopical approach. II. Arsenic-based opacifiers and relation with cobalt ores. J. Raman Spectrosc. 2024, 55, 184–199. [Google Scholar] [CrossRef]
- Manoun, B.; Azdouz, M.; Azrour, M.; Essehli, R.; Benmokhtar, S.; El Ammari, L.; Ezzahi, A.; Ider, A.; Lazor, P. Synthesis, Rietveld refinements and Raman spectroscopic studies of tricationic lacunar apatites Na1-xKxPb4(AsO4)3 (0 < x < 1). J. Mol. Struct. 2011, 986, 1–9. [Google Scholar]
- Available online: https://www.xrf.guru/Concepts/FilterAndVoltage/index.html (accessed on 18 November 2024).
- An, S.; Reza, S.; Norlin, B.; Fröjdh, C.; Thungström, G. Signal-to-noise ratio optimization in X-ray fluorescence spectrometry for chromium contamination analysis. Talanta 2021, 230, 122236. [Google Scholar] [CrossRef]
- Cheng, H.; He, W.; Tang, J.; Yang, F.; Wang, J. PIXE analysis of ancient Chinese Qing dynasty porcelain. Nucl. Instrum. Methods Phys. Res. Sect. B Beam Interact. Mater. At. 1996, 118, 377–381. [Google Scholar] [CrossRef]


Disclaimer/Publisher’s Note: The statements, opinions and data contained in all publications are solely those of the individual author(s) and contributor(s) and not of MDPI and/or the editor(s). MDPI and/or the editor(s) disclaim responsibility for any injury to people or property resulting from any ideas, methods, instructions or products referred to in the content. |
© 2024 by the authors. Licensee MDPI, Basel, Switzerland. This article is an open access article distributed under the terms and conditions of the Creative Commons Attribution (CC BY) license (https://creativecommons.org/licenses/by/4.0/).