Abstract
Background: The Montreal Cognitive Assessment (MoCA) is widely used to evaluate global cognitive function; however, its precision in measurement in heterogeneous populations—especially among patients with Parkinson’s disease (PD)—remains underexplored. Methods: In this multicenter cross-sectional study, we examined the psychometric properties of the Brazilian Portuguese MoCA in 484 PD patients (age range, 26–90 years; mean ± SD, 59.9 ± 11.1 years; disease duration range, 1–35 years; mean ± SD, 8.7 ± 5.4 years) using Item Response Theory (IRT). The Graded Response Model (GRM) was employed to estimate item difficulty and discrimination parameters, and differential item functioning (DIF) concerning age and education was investigated via a Multiple Indicators Multiple Causes (MIMIC) model. Results: The MoCA demonstrated essential unidimensionality and robust model fit. GRM analyses revealed that items within the Attention and Naming domains had high discrimination, indicating sensitivity to subtle cognitive deficits, while Memory items exhibited lower discrimination. Orientation items showed low difficulty thresholds, suggesting a propensity for ceiling effects. The MIMIC model further indicated that age and education significantly influenced overall scores: increasing age was associated with lower performance, whereas higher educational attainment correlated with better outcomes, particularly in Memory Recall and Executive/Visuospatial domains, even after accounting for their modest inverse relationship. Conclusions: Our findings support the validity of the Brazilian Portuguese MoCA for cognitive screening in PD while highlighting item-level biases linked to age and education. These results advocate for using education-adjusted norms and computerized scoring algorithms that incorporate item parameters, ultimately enhancing the reliability and fairness of cognitive assessments in diverse clinical populations.
1. Background
Recently, there has been growing interest in cognitive decline as an important non-motor manifestation of Parkinson’s disease (PD) [1,2,3]. Studies have demonstrated that cognitive changes, even in the early stages, can significantly impact patients’ quality of life, treatment response, and overall prognosis [4]. Therefore, the early identification of cognitive deficits is crucial for developing targeted therapeutic strategies and personalized interventions [5,6]. This underscores the need for assessment tools that exhibit high accuracy for this population.
The Montreal Cognitive Assessment (MoCA) was designed as a brief cognitive screening test for identifying milder forms of cognitive impairment in the elderly population [7]. It has been extensively studied in Brazil and elsewhere, affirming its utility in assessing cognitive impairment in PD [8,9,10]. Despite its broad application, the MoCA faces challenges, including potential item biases and overall test structure. Originally developed in English, it has been adapted into several languages, including Brazilian Portuguese [11].
The effectiveness of the MoCA in identifying cognitive impairment may vary, particularly in populations with lower education levels. This could lead to incorrect diagnoses or missed cases. Data from a normative study conducted in São Paulo, for example, revealed that the MoCA’s effectiveness in detecting cognitive impairment among Brazilian seniors varies significantly with age and education [12]. It was found that MoCA scores differ across cognitively normal individuals, those with “cognitive impairment no dementia” (CIND), and dementia patients, necessitating the adjustment of MoCA scores based on educational levels. The study notably pointed out the MoCA’s limited effectiveness in detecting CIND in individuals with low educational levels despite its utility in diagnosing dementia in more educated groups.
The need to vary cutoff scores according to educational levels in different populations presents a significant challenge in validating cognitive assessment tools like the MoCA. This variability complicates the efficiency of screening processes and increases the likelihood of human error. Research conducted in various countries highlights this issue, with recommendations for a range of cutoff scores tailored to different education and age groups [12,13,14]. This lack of universally applicable cutoff scores underscores the limitations of a one-size-fits-all approach and emphasizes the need for population-specific norms and scoring guidelines.
Central to this challenge is item bias, where specific test item characteristics not directly related to the cognitive construct being measured affect responses differently among groups [15]. Conventional scoring methods, which often treat all test items uniformly and may adjust scores for educational background, do not adequately tackle the influence of these factors on individual test items. This situation underscores the necessity for more refined methods to address such biases in cognitive assessments.
Item Response Theory (IRT) offers a valuable statistical framework for analyzing psychological and educational tests, playing a crucial role in evaluating test validity [16,17]. IRT allows for a detailed assessment of the quality of a test’s items, offering insights into individual item difficulty, test-taker ability, and overall test performance. This information is instrumental in identifying the strengths and weaknesses of a test and guiding decisions regarding which items should be included or excluded. By employing IRT, researchers can ensure that a test accurately measures the intended construct and yields reliable results, thus enhancing the overall effectiveness and precision of cognitive assessments [18]. Moreover, IRT provides a means to assess and mitigate item bias, allowing for the development of more equitable and culturally appropriate cognitive screening tools.
The MoCA has been extensively examined using the IRT framework in various contexts. For instance, a study conducted in Taiwan revealed that executive function tasks—including Attention, Working Memory, and abstract thinking items—were more effective than language and visual–spatial subscales in distinguishing individuals with mild and moderate cognitive impairment [19]. Conversely, Orientation items proved less effective in differentiating between cognitively unimpaired individuals and those with mild cognitive impairment (MCI) and dementia. Similarly, Rasch-based IRT models demonstrated a strong overall fit between MoCA items and individual values in Portugal, underscoring the test’s scalability and appropriateness [20]. These findings suggest that the discriminative power of MoCA items can vary significantly across different cognitive domains and levels of impairment, highlighting the necessity for a comprehensive understanding of the test’s psychometric properties. However, despite these international insights, the analysis of the MoCA using the IRT framework in Brazil remains limited.
Applying the Graded Response Model (GRM), one of the IRT models for polytomous items, to the MoCA could improve the estimation of individual cognitive abilities [21,22]. The GRM can identify the most informative items, potentially resulting in a more concise MoCA. Additionally, the GRM may offer insights into the psychometric properties of test items, helping to refine the test by pinpointing poorly performing or redundant items. Utilizing the GRM, researchers can develop a more efficient and precise cognitive screening tool tailored to the target population’s specific needs.
This study aims to analyze the performance of specific test domains and the overall scores of the Brazilian version of the MoCA using IRT in varying degrees of PD-related cognitive dysfunction and to conduct a Multiple Indicators Multiple Causes model approach to investigate the impact of educational level and age on test performance. By examining the MoCA’s psychometric properties in a diverse PD sample, this study seeks to contribute to the growing body of evidence on the test’s validity and reliability while also exploring potential sources of item bias. The findings could inform the development of more accurate and equitable cognitive screening strategies for PD patients in Brazil and beyond.
2. Materials and Methods
2.1. Study Design and Ethics
This multicentric observational cross-sectional study was approved by the local Research Ethics Committees at each study site, upholding the ethical principles of the Declaration of Helsinki (including subsequent amendments) regarding research involving human subjects. This study was conducted between May 2007 and July 2022 across five Brazilian centers: Porto Alegre (RS), Ribeirão Preto (SP), Belém (PA), Brasília (DF), and São Paulo (SP). The data originated from two sources: the LARGE-PD study [23] conducted in Belém, Ribeirão Preto, São Paulo, and Porto Alegre, and the Brasília Parkinson Study [24].
2.2. Participant Selection and Inclusion Criteria
A non-probabilistic convenience sample of 484 patients with idiopathic PD was recruited from movement disorder clinics. Patients were enrolled through direct invitation by their neurologists. Inclusion criteria stipulated a minimum age of 18, Brazilian Portuguese as a first language, and meeting PD diagnostic criteria established by the Queen Square Brain Bank [25]. Diagnosis involved medical history, physical examinations, diagnostic testing, and imaging (e.g., MRI, transcranial ultrasound, dopamine transporter scans). Comorbid neurological disorders did not warrant exclusion.
Although a small fraction (0.61%) of patients exhibited PD onset before age 21, these cases were included to ensure the representativeness of the entire clinical spectrum of PD. It is acknowledged that early-onset PD may present distinct clinical characteristics, a point that is further discussed in the Limitations section.
2.3. Instrument
The MoCA is a 10–15 min screening tool that evaluates seven cognitive domains: Visuospatial/Executive, Naming, Attention, Language, Abstraction, Memory, and Orientation [7]. Performance in each domain is assessed using specified tasks: Visuospatial/Executive (0–5 points)—trail making, cube copying, clock drawing; Naming (0–3 points)—animal naming; Attention (0–6 points)—digit span, Go-No-Go, serial sevens subtraction; Language (0–3 points)—phrase repetition, phonemic fluency; Abstraction (0–2 points)—similarity identification; Memory (0–5 points)—delayed recall; Orientation (0–6 points)—place, city, date. Total scores range from 0 to 30, with lower scores indicating greater impairment. Individuals with <13 years of education receive a 1-point bonus.
2.4. Data Analysis
For descriptive statistics, categorical variables were summarized with frequency (n) and percentages (%). Continuous variables were assessed for normality using the Shapiro–Wilk test. Normally distributed variables were reported with means and standard deviations (SD), while non-normally distributed variables were described with medians and interquartile ranges (IQR). Statistical analyses were conducted in R (v4.3.2), using a significance level (α) 0.05 for all two-sided tests.
2.4.1. Dimensionality and Model Fit
Unidimensionality is a fundamental assumption in IRT. Exploratory factor analysis (EFA) with weighted least squares (WLS) was used to examine dimensionality. Factors were rotated using Promax rotation, and parallel analysis guided factor retention decisions. Model fit was evaluated using the root mean square error of approximation (RMSEA; good fit ≤ 0.08, 90% CI ≤ 0.10) and Tucker–Lewis index (TLI; good fit ≥ 0.90, excellent fit ≥ 0.95) [26]. These fit indices provide a quantitative assessment of how well the model aligns with the observed data, with RMSEA values closer to 0 and TLI values closer to 1 indicating better fit.
2.4.2. Graded Response Model (GRM)
The GRM was used for IRT analyses. As initially proposed by Samejima (1968), the GRM posits that, as an individual’s latent ability increases, their likelihood of endorsing a higher item response category increases [22]. A key advantage is its ability to model polytomous items with multiple response options. The GRM characterizes items using difficulty and discrimination parameters. Difficulty parameters quantify item endorsability at varying ability levels, while discrimination indexes an item’s ability to differentiate individuals across the latent trait. The GRM was selected given its flexibility in modeling local item dependencies within our polytomous item data. Analyses were conducted using the mirt and ggmirt packages in R [27,28], which provide a comprehensive suite of tools for estimating and visualizing IRT models.
2.4.3. Test Reliability
Two IRT-based indices were examined: conditional and marginal reliability (rxx). Conditional reliability measures the reliability at precise levels along the latent trait, quantifying the consistency of estimated scores among individuals with equal standing on the latent variable. Marginal reliability integrates conditional reliability across the full distribution of latent trait scores, providing an overall reliability estimate. These reliability indices offer an understanding of the MoCA’s precision across different cognitive ability levels, complementing traditional internal consistency measures.
2.4.4. Multiple Indicators Multiple Causes Modeling
The MIMIC model is a statistical approach that incorporates exogenous variables to assess their influence on latent constructs measured by multiple indicators [29,30]. Its advantages include enhanced flexibility for detecting differential item functioning (DIF) and providing additional insights into the relationships between demographic variables and the test structure: capabilities that may not be captured by traditional factor analysis methods [31,32].
A Multiple Indicators Multiple Causes (MIMIC) model was applied to examine the effects of age and education on cognitive performance across seven MoCA domains using the lavaan package in R [33]. The model specified age and education as exogenous predictors and the MoCA domains as endogenous variables. Regression coefficients (β) quantified the relationships between predictors and domains, with positive values indicating positive associations and negative values suggesting inverse relationships. The statistical significance (p < 0.05) of these coefficients provided evidence for differential item functioning (DIF) related to age and education. Model fit was assessed using CFI, TLI, and RMSEA. This approach allowed for the examination of differential item/test functioning among age and education groups, helping to elucidate background influences on domain functioning and improve the test’s fairness.
3. Results
3.1. Participants
The study sample consisted of 484 patients diagnosed with PD. Participants ranged from 26 to 90 years old (mean ± SD: 59.9 ± 11.1 years). PD duration varied substantially, spanning 1 to 35 years (mean ± SD: 9.1 ± 5.8 years). The average educational attainment was 9.1 ± 5.4 years. Most participants were male (57.6%), aligning with the known higher PD prevalence among males.
Table 1 summarizes the demographic and clinical characteristics, including education levels, PD duration categories, gender proportions, and MoCA scores. The mean total MoCA score for the full cohort was 20.61 ± 5.80 (SD).

Table 1.
Participants’ demographic features.
Table 2 shows the score distribution across MoCA’s seven cognitive domains. Naming and Orientation exhibited ceiling effects, with 70% and 80.4% of participants scoring maximum points, respectively. Visuospatial/Executive scores were evenly distributed, peaking at 5 (21.5%). Attention centered around 6 (26%). Language and Abstraction had modal scores of 2 (36% and 39.3%). Memory showed a wide distribution, with “0” being the most frequent (30%). These patterns indicate varying cognitive performance across domains, with Naming and Orientation showing the strongest performance, while Visuospatial/Executive and Memory displayed more variability. This suggests differential sensitivities to PD-related cognitive impairment across MoCA domains, emphasizing the need for domain-specific score interpretation.
Table 2.
Response frequencies for each MoCA domain.
3.2. IRT Graded Response Model
3.2.1. Dimensionality Analysis, Model Fit, and Reliability Assessment
The correlation matrix’s factorability was confirmed by Bartlett’s test (χ2 = 808.03, df = 21.0, p < 0.001) and KMO (0.867). The parallel analysis supported a unidimensional model (first eigenvalue: 3.205 vs. 1.176 in simulated data). High factor loadings across MoCA domains validated its use as a unidimensional cognitive assessment tool. EFA indicated satisfactory model fit (χ2 = 26.106, df = 14, p = 0.025; RMSEA = 0.042, 90% CI: 0.015–0.067; TLI = 0.977), reinforcing the model’s robustness.
Figure 1 shows the MoCA’s conditional reliability peaks at moderate trait levels (θ between −1 and 1), indicating optimal precision for average cognitive abilities. Reliability decreases at cognitive spectrum extremes. The marginal reliability coefficient (rxx = 0.806) demonstrates good overall precision. These findings support the MoCA’s suitability for assessing cognitive function in PD populations, especially for mild to moderate impairments.
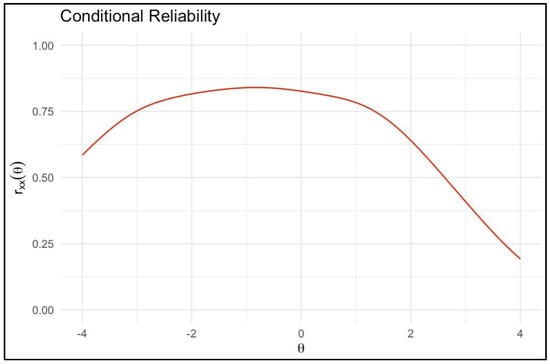
Figure 1.
Conditional reliability curve for the Montreal Cognitive Assessment (MoCA) based on Item Response Theory analysis. Legend. The x-axis shows the latent cognitive trait (θ) continuum. The y-axis displays reliability coefficients (rxx(θ)) at corresponding trait levels. The peak conditional reliability indicates the cognitive ability range at which the MoCA provides optimal measurement precision. As θ diverges from this peak, score reliability declines, reflecting variable consistency across the spectrum of cognitive faculties indexed by the MoCA.
3.2.2. Evaluation of Model and Item Fit
The GRM exhibited a robust overall fit to the MoCA data (M2 = 12.94, degrees of freedom (df) = 14, p = 0.53; RMSEA = 0.000 [90% CI: 0.000–0.041]; standardized root mean square residual [SRMSR] = 0.040), affirming its suitability for this analysis. Table 3 details the item-level fit statistics for each cognitive domain, all demonstrating good concordance with the model.
Table 3.
Item parameters: discrimination and location (thresholds).
Specifically, the Visuospatial/Executive domain aligned well with the model’s assumptions (S-χ2 = 40.918, df = 50, RMSEA = 0.000, p = 0.817). Similarly, acceptable fits were observed in the Naming (S-χ2 = 34.498, df = 27, RMSEA = 0.024, p = 0.152), Attention (S-χ2 = 69.589, df = 50, RMSEA = 0.028, p = 0.035), Language (S-χ2 = 41.125, df = 41, RMSEA = 0.003, p = 0.465), Abstraction (S-χ2 = 21.000, df = 26, RMSEA = 0.000, p = 0.742), Memory (S-χ2 = 49.590, df = 49, RMSEA = 0.005, p = 0.450), and Orientation domains (S-χ2 = 34.239, df = 29, RMSEA = 0.019, p = 0.231). These findings strongly support the GRM-based analysis of the psychometric properties of the MoCA in a PD population.
3.2.3. Analysis of Item and Person Parameters
The GRM analysis was employed to evaluate how effectively each domain of the MoCA discriminates between levels of cognitive abilities and to assess item difficulty levels (as detailed in Table 3). Notably, the Attention and Naming domains exhibited the highest discrimination values, indicating their strong capability to differentiate individuals across various latent trait levels. The exceptionally high discrimination value in the Attention domain (1.985) highlights its sensitivity in identifying subtle cognitive impairment.
On the other hand, the Memory domain demonstrated the lowest discrimination (1.265), implying a weaker capacity to differentiate between varying levels of cognitive abilities. This lower discrimination in Memory could affect its effectiveness, particularly in identifying early stages of cognitive decline.
The analysis of location thresholds provided insights into the range of item difficulties. The Orientation domain was marked by the lowest difficulty levels (thresholds: −4.135 to −1.225), suggesting that these items are more easily endorsed across a range of cognitive abilities. Conversely, the Memory domain presented the highest difficulty (thresholds: −0.860 to 2.402), requiring a higher level of cognitive functioning for successful performance. These findings highlight the MoCA’s capabilities in capturing diverse cognitive performance profiles with varying levels of sensitivity and challenge across its different domains. Identifying highly discriminating domains (Attention and Naming) and those with a broader range of difficulty (Memory) can guide the refinement of the MoCA for optimal use in PD populations.
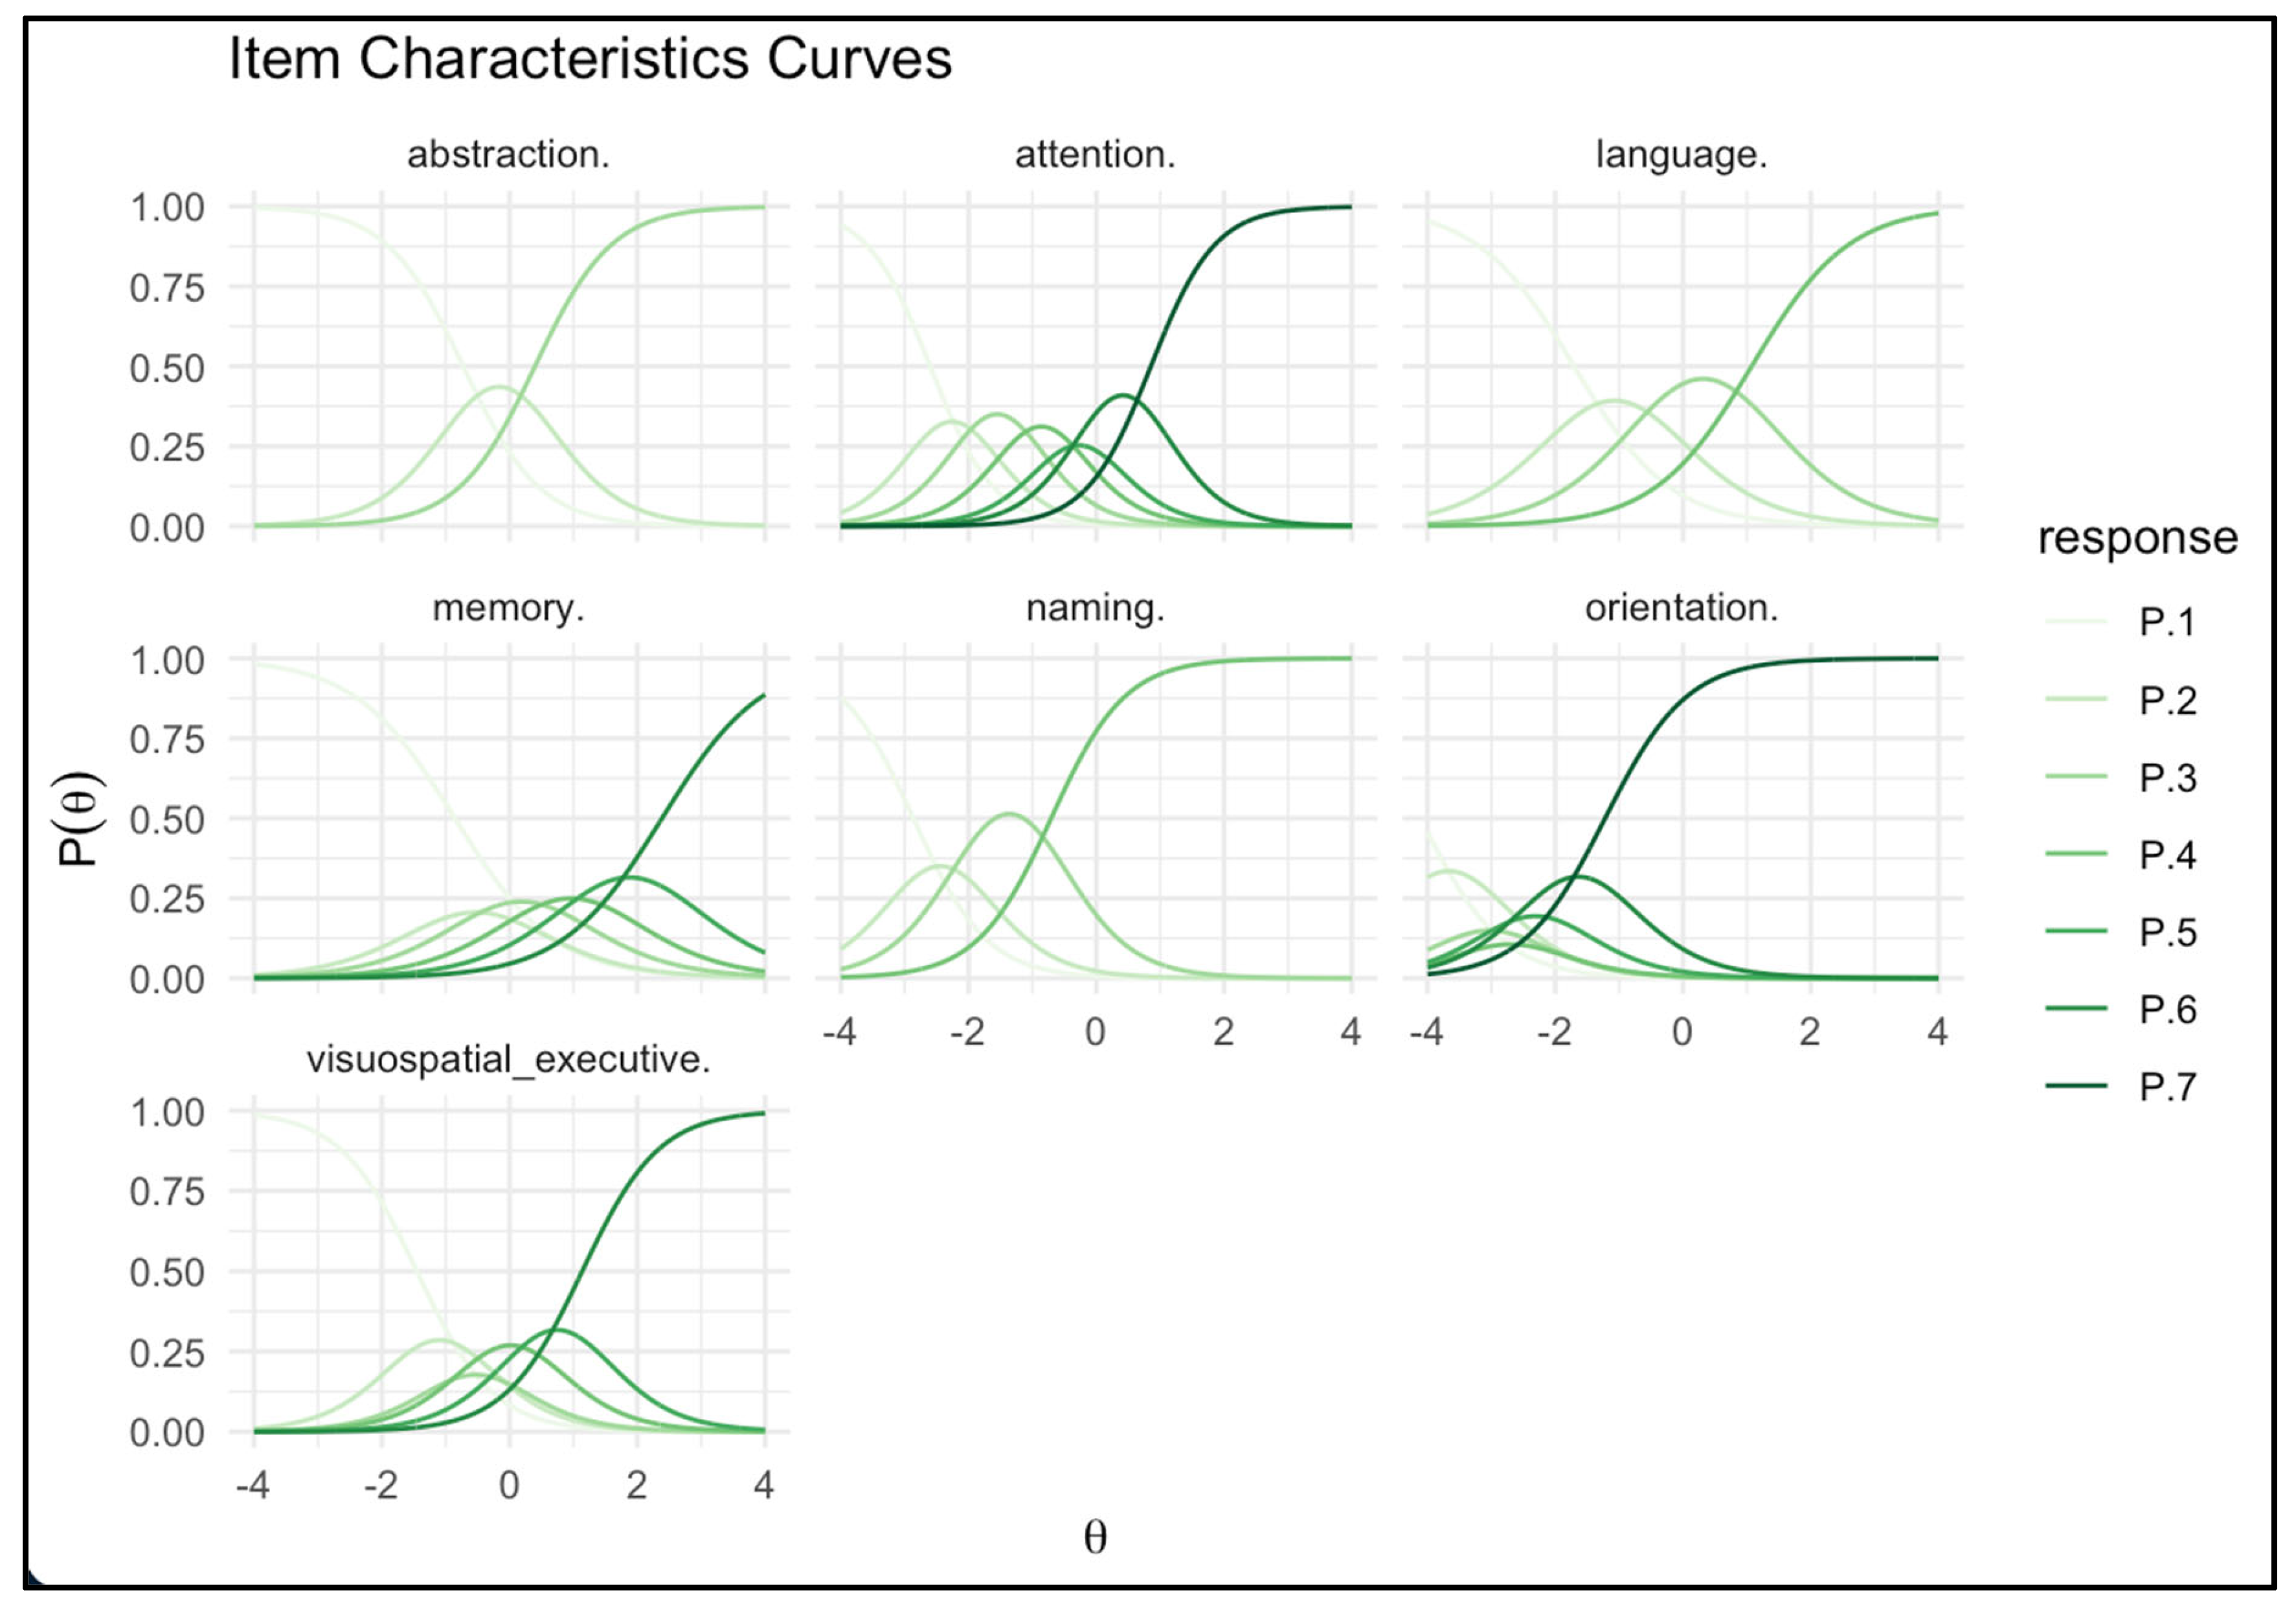
Figure 2 presents Item Characteristic Curves (ICCs) for each MoCA domain, illustrating the relationship between latent cognitive abilities (θ) and response category endorsement probabilities. Steeper curves (e.g., Attention, Naming) indicate higher discrimination, while gradual slopes (e.g., Memory) suggest lower discrimination. Curve positioning along the x-axis reflects domain difficulty, with Orientation being the easiest and Memory the most challenging. These ICCs visually represent how difficulty and discrimination parameters influence response patterns across the cognitive ability spectrum.
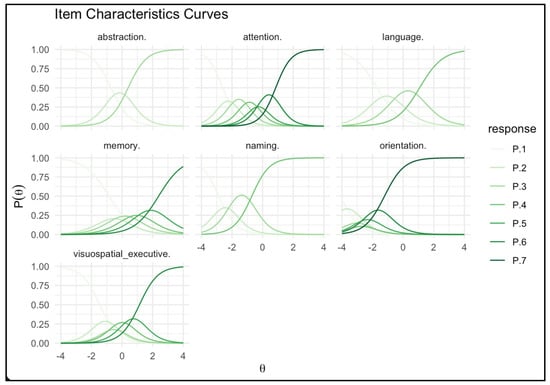
Figure 2.
Item Characteristic Curves for Montreal Cognitive Assessment (MoCA) domains. Legend. The graph presents Item Characteristic Curves (ICCs) for polytomous item responses within the cognitive domains of the MoCA. The x-axis (θ) represents the latent trait of cognitive ability, ranging from −4 (indicating lower ability) to +4 (indicating higher ability). The y-axis depicts the probability [P(θ)] of a participant endorsing a particular response category at a given level of θ. Curves labeled P.1 through P.7 correspond to the ascending response categories for each domain, with P.1 representing the lowest category (e.g., no correct responses) and P.7 representing the highest category (e.g., all correct responses). A higher curve position on the y-axis reflects a higher probability of a participant with a corresponding θ level selecting that response category, providing a visual representation of the likelihood of achieving each score based on cognitive ability.
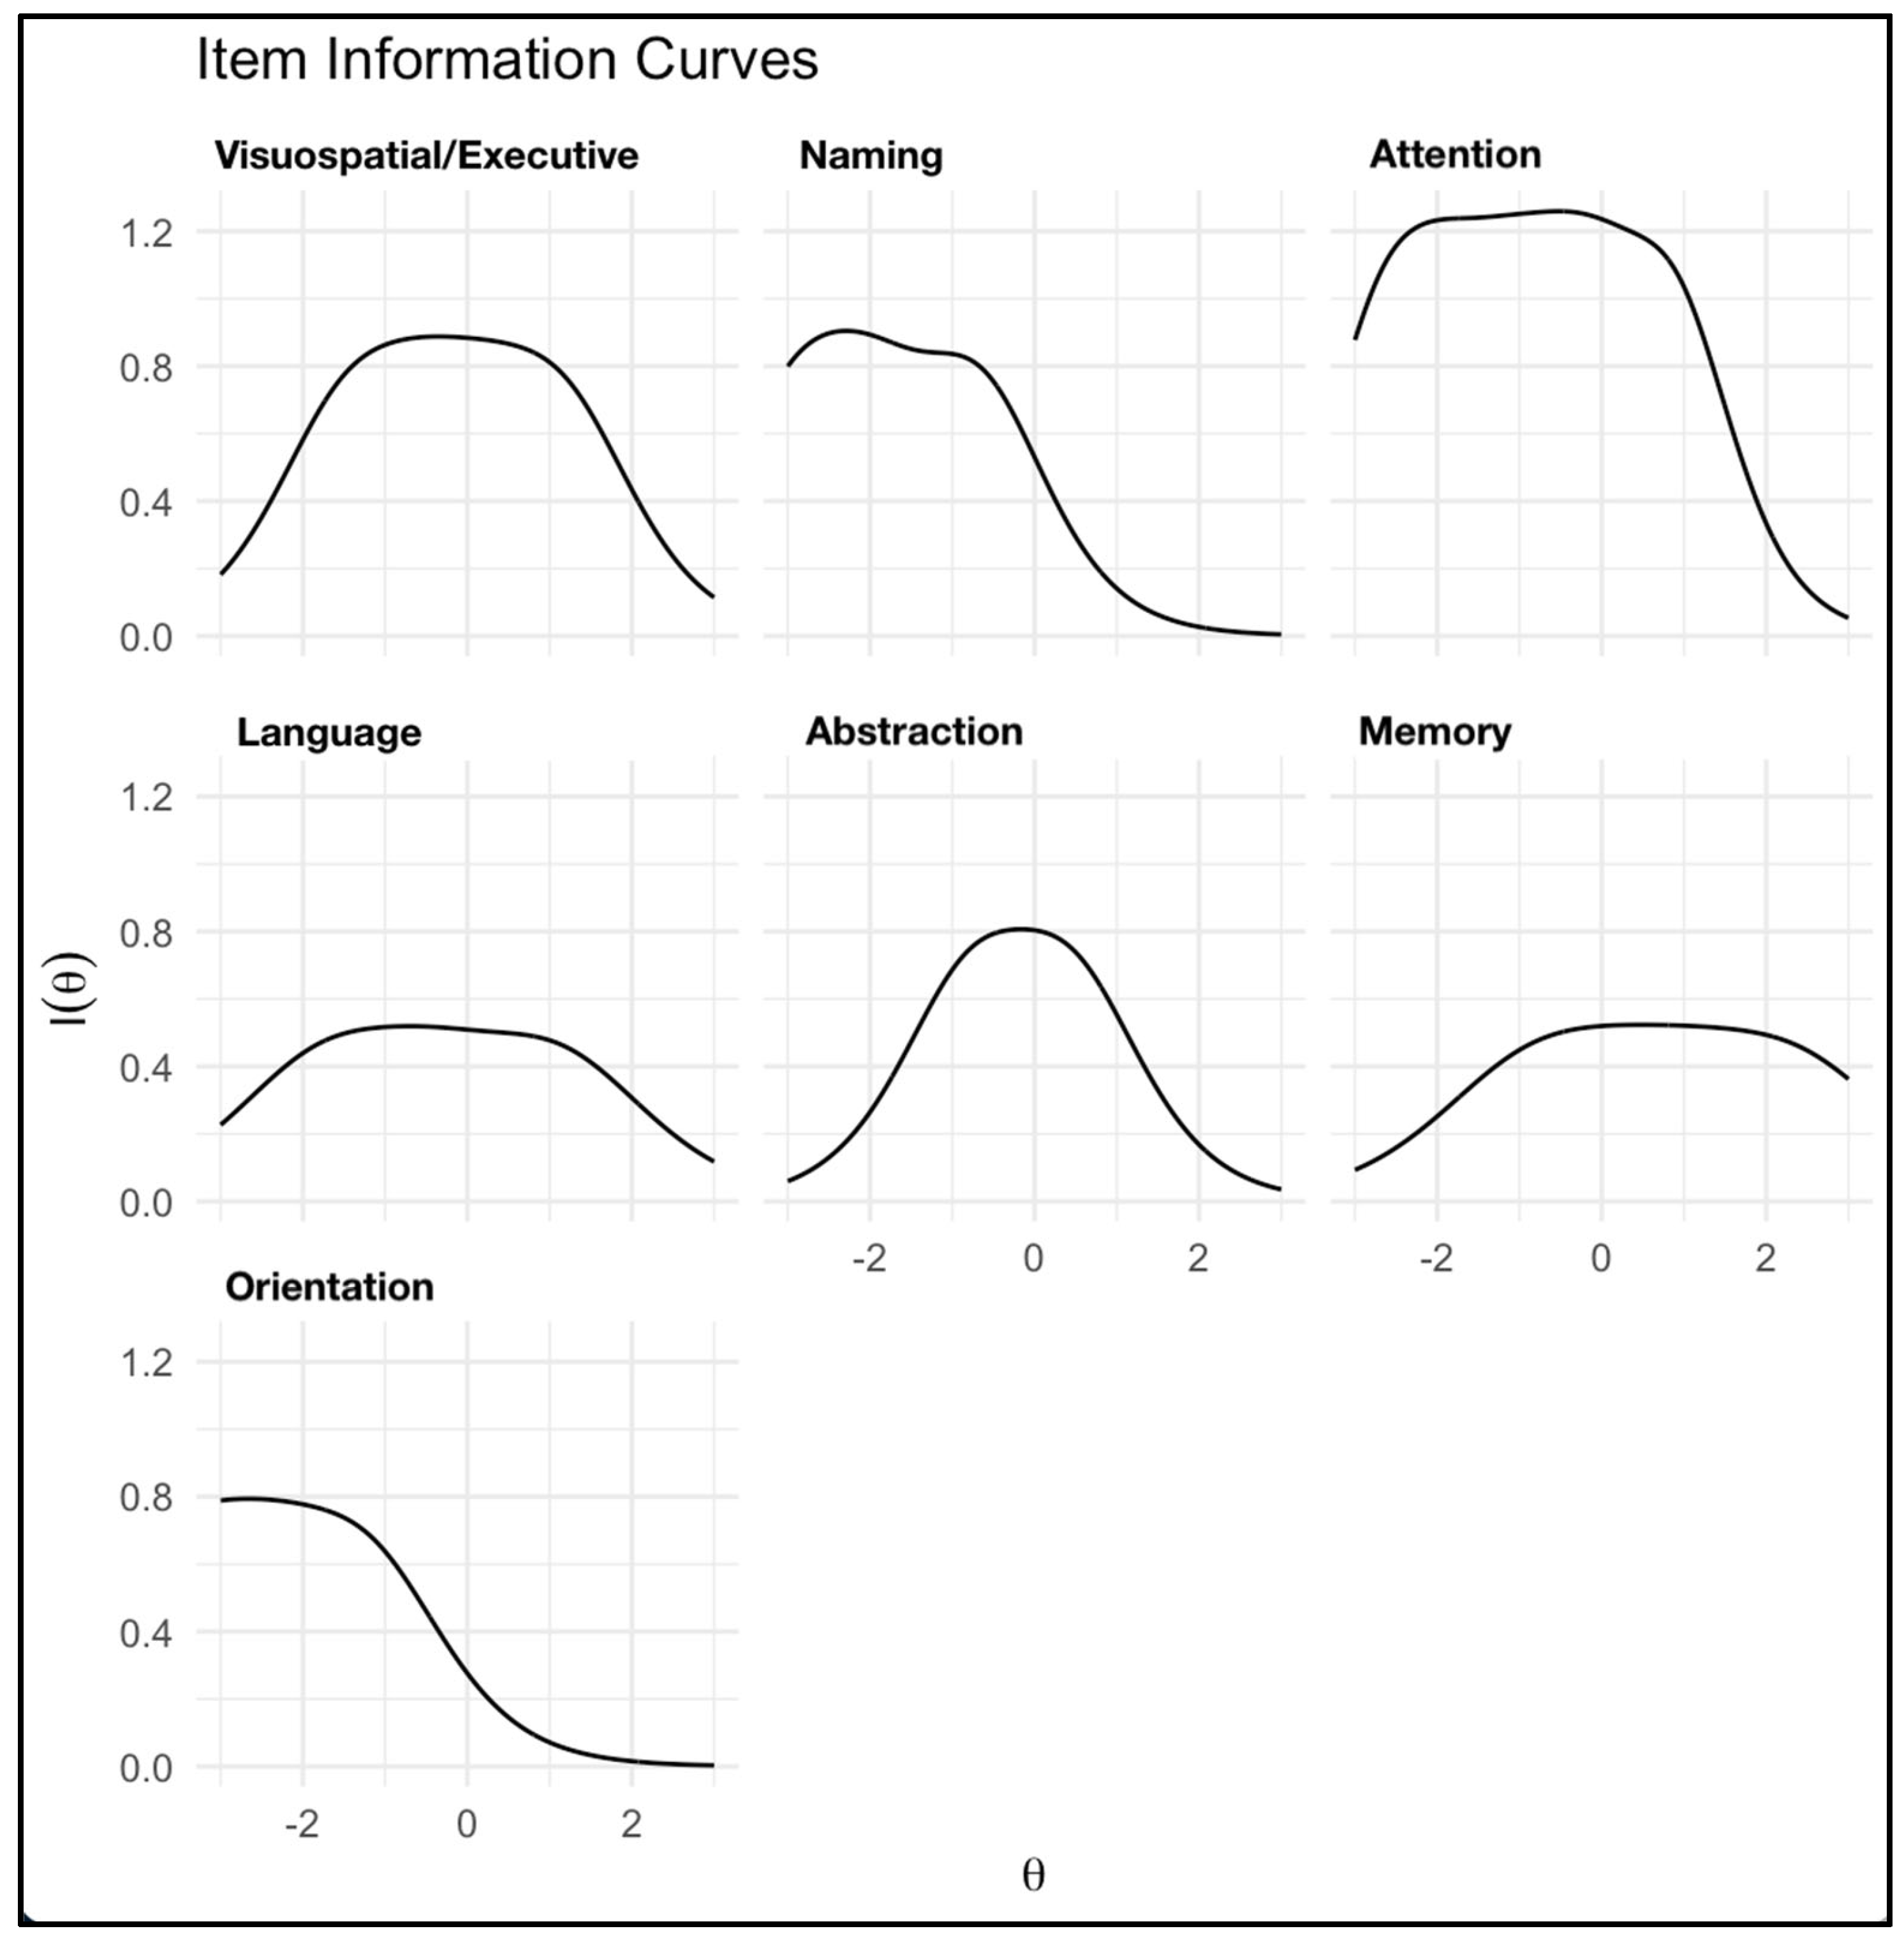
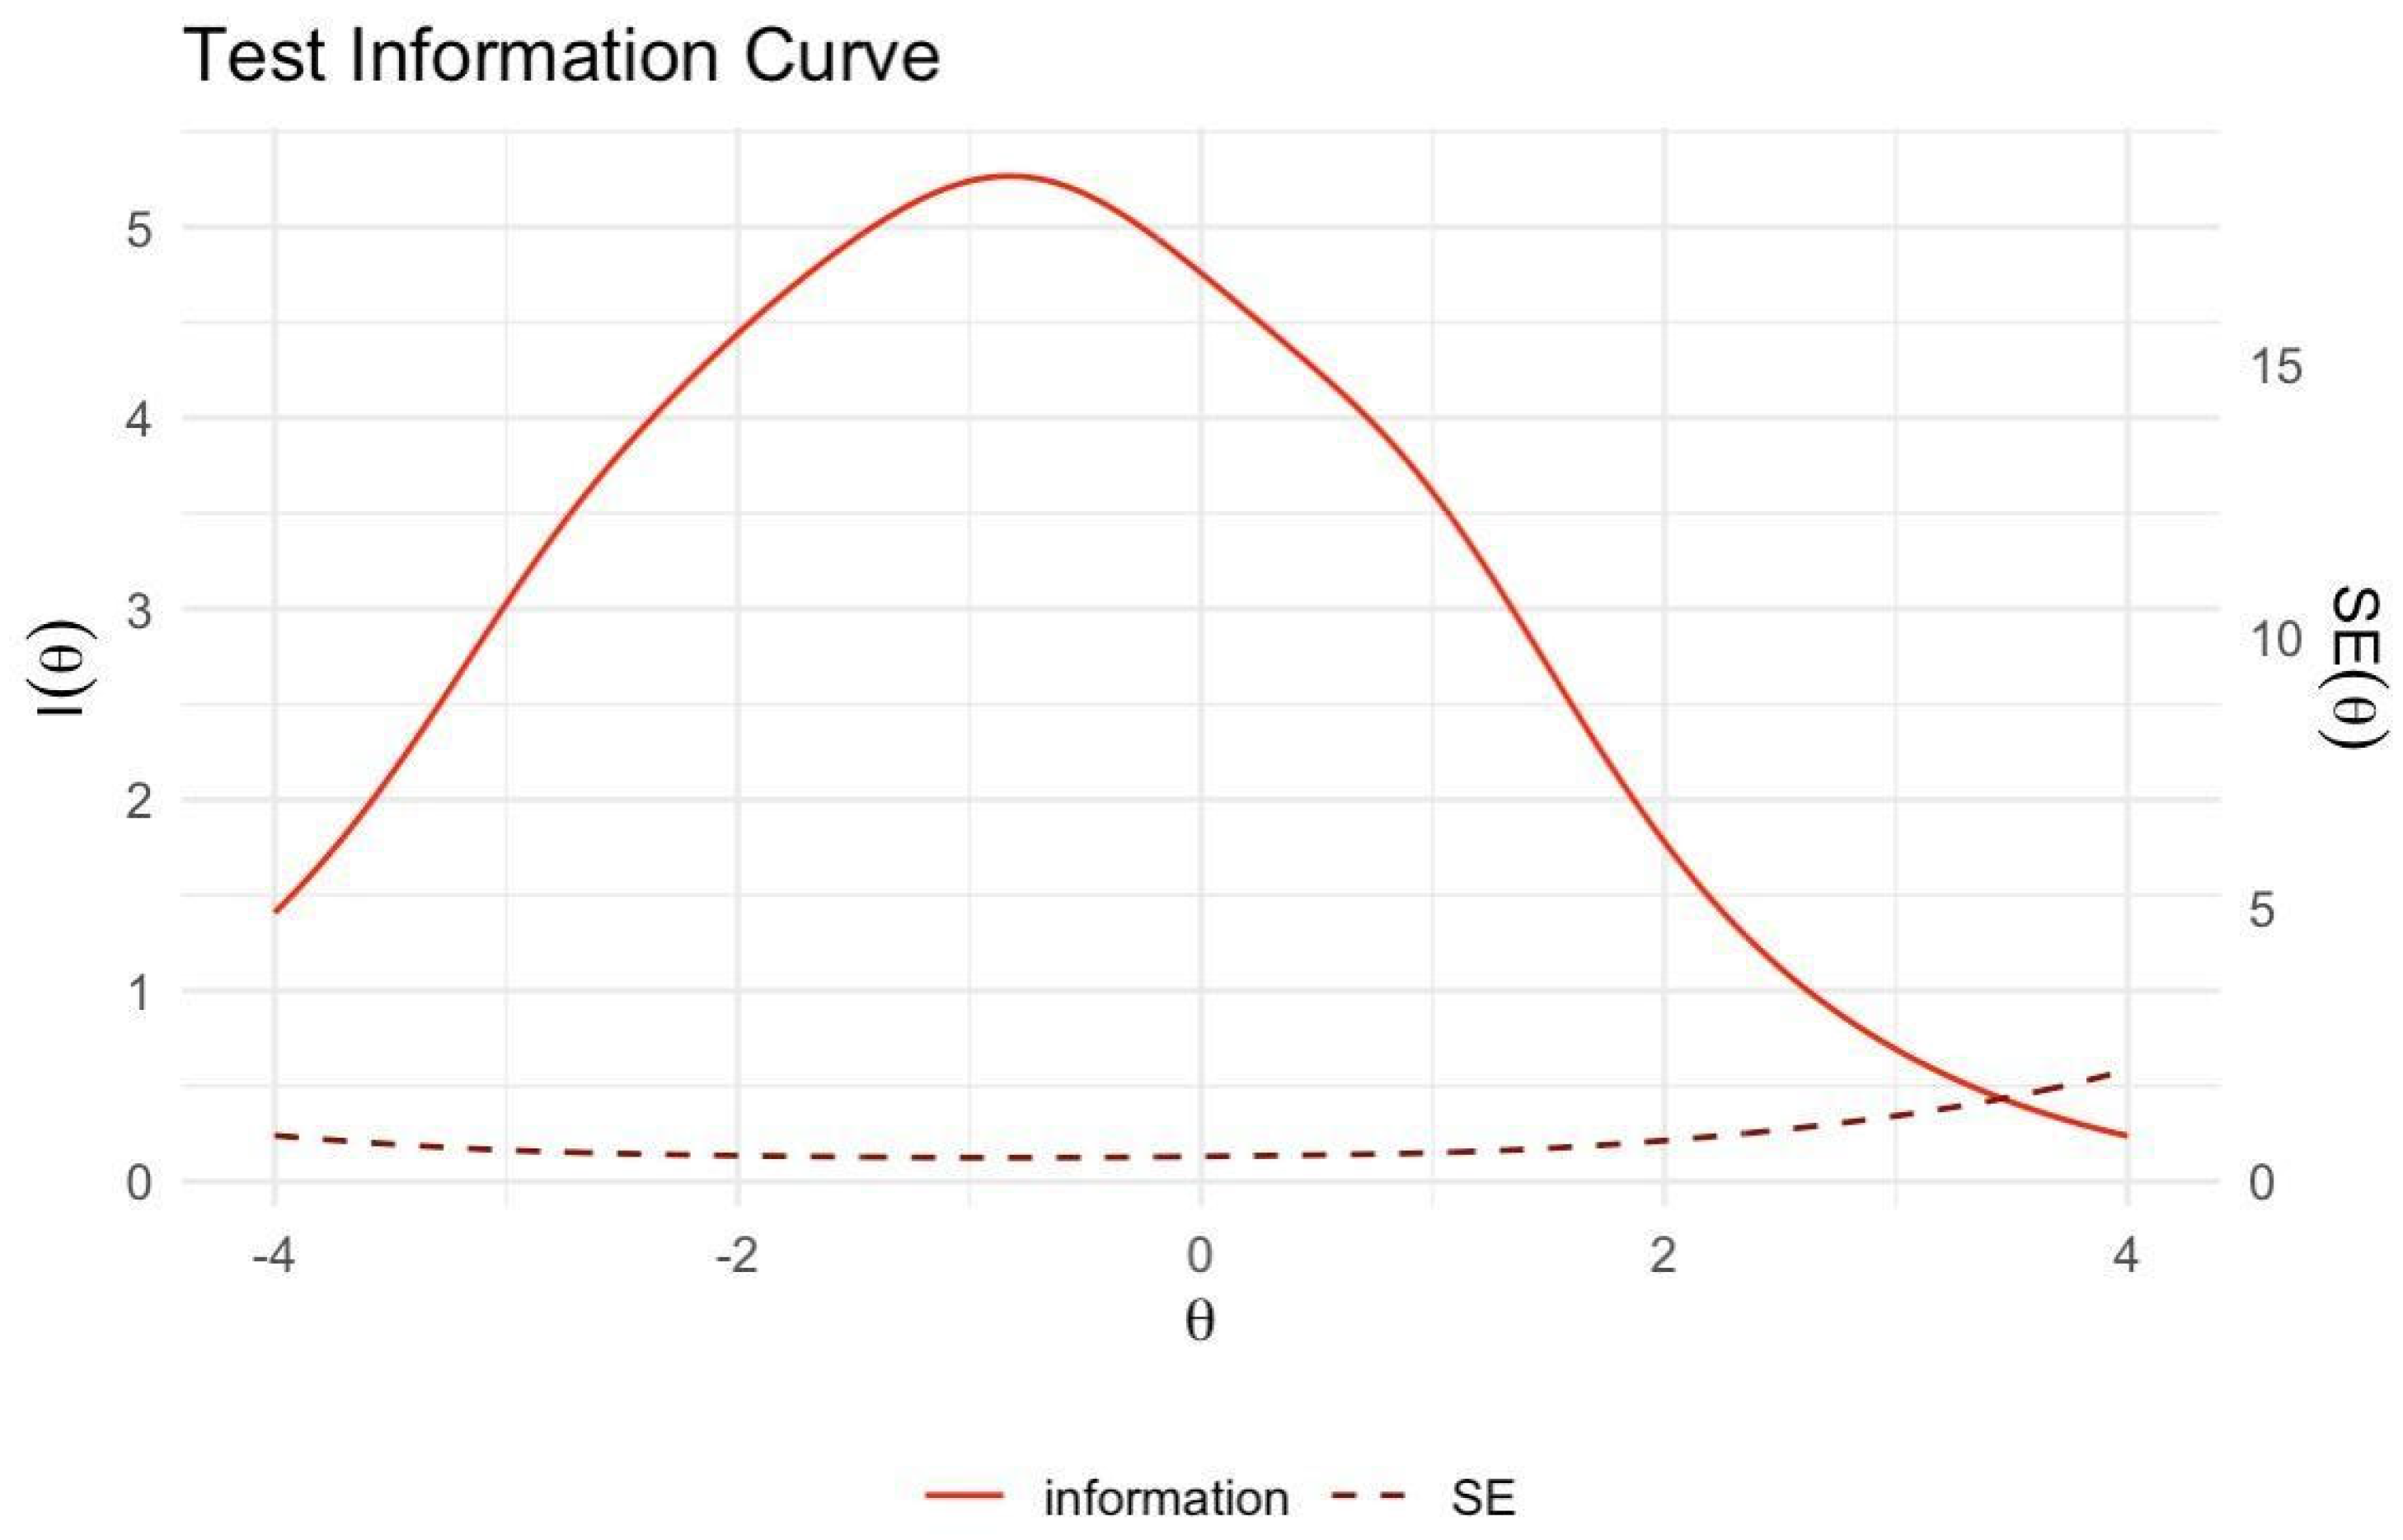
Figure 3 and Figure 4 offer insights into item and test information functions. Figure 3’s item information curves show the psychometric information each MoCA domain provides across the cognitive ability spectrum. Domains with higher peaks (e.g., Attention and Naming) offer more information, indicating greater reliability and discrimination at specific ability levels. Figure 4 displays the test information function, representing aggregate information from the entire MoCA. The curve’s peak indicates the ability level where MoCA provides the most precise measurement. It also illustrates the inverse relationship between test information and standard error of measurement.
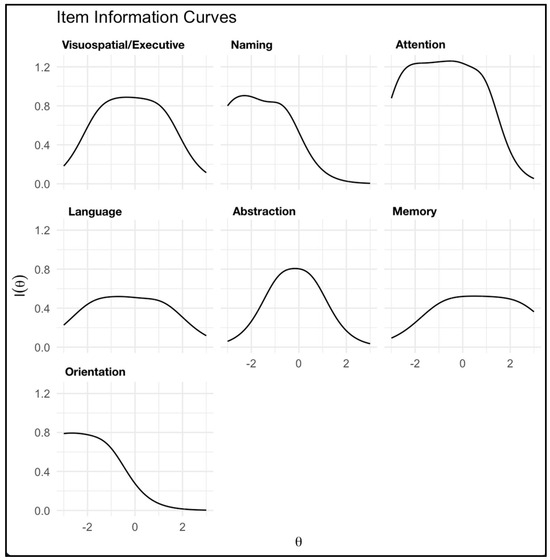
Figure 3.
Item information curves for MoCA domains. Legend. This figure illustrates the item information functions (IIFs) associated with the cognitive domains assessed by the Montreal Cognitive Assessment (MoCA). Each graph represents the sensitivity of the respective domain to detect changes in cognitive ability, denoted as theta (θ). The θ parameter is normatively scaled, ranging from −3 to +3, signifying low to high cognitive abilities, respectively. The acme of each curve symbolizes the juncture at which the domain is most informative, i.e., where it most accurately discerns between different levels of cognitive function. A steeper ascent and peak of the curve connote a higher information density, indicating a domain’s heightened precision in measuring cognitive abilities around its peak θ value. Conversely, flattening the curve at the tails suggests diminishing informational yield for extreme ability levels.
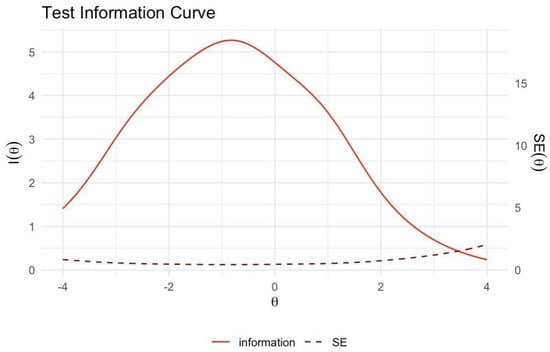
Figure 4.
Test information and standard error curves for the MoCA. Legend. The solid red line shows the test information function [I(θ)] across cognitive ability levels (θ). The peak indicates where the MoCA provides optimal measurement information. The dashed line represents the standard error of measurement [SE(θ)], which inversely relates to test information. Lower SE(θ) reflects greater precision in estimating θ. SE(θ) is minimized where test information is maximized, delineating the optimal range of measurement precision.
3.3. Multiple Indicators Multiple Causes (MIMIC) Modeling of Age and Education Effects on Latent Trait
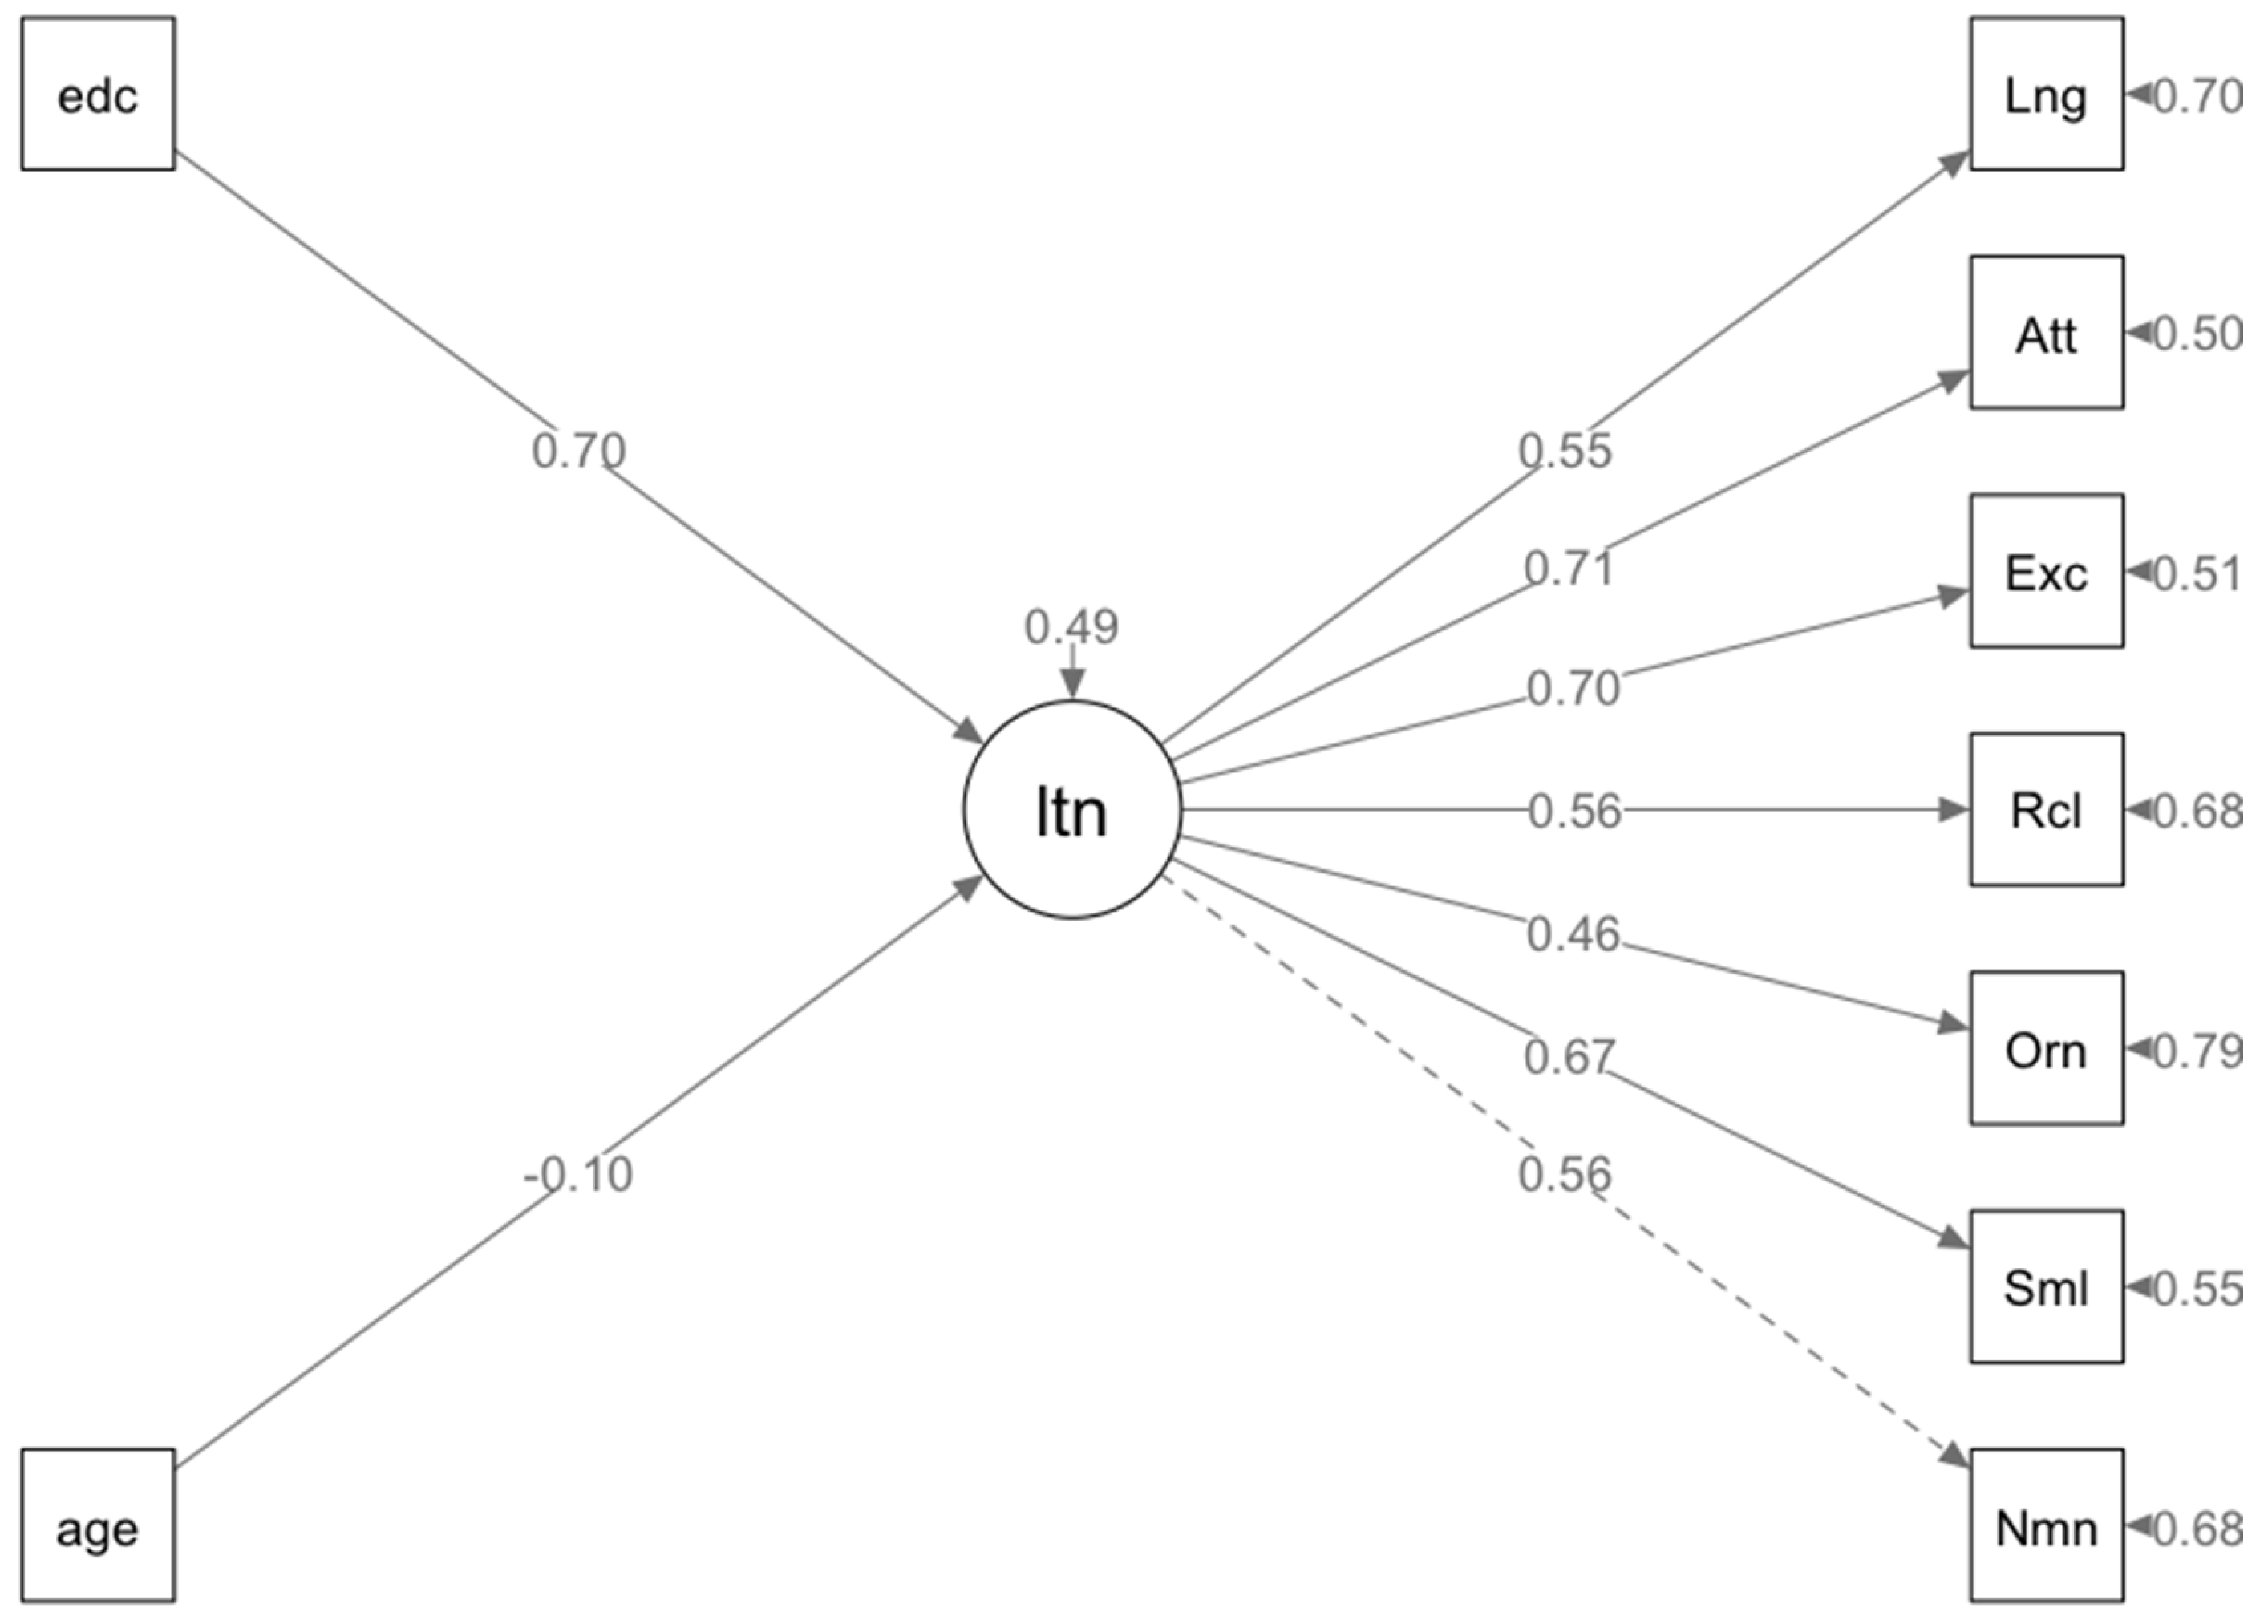
The Multiple Indicators Multiple Causes (MIMIC) model examined differential item functioning (DIF) across demographic variables (Figure 5). The model demonstrated adequate fit (χ2 p = 0.606, CFI and TLI > 0.95, RMSEA < 0.001 for the standard model, 0.050 for the scaled model). Regression analysis revealed significant associations between cognitive performance and demographics: age negatively impacted performance (β = −0.149, p = 0.016), while education showed a positive influence (β = 1.001, p < 0.001). Cognitive domains were differentially affected by age and education, with Memory Recall and Executive/Visuospatial tasks benefiting more from education, and Working Memory/Attention showing a moderate correlation with age but a stronger association with education. A negative correlation was observed between age and education (β = −0.126, p = 0.008). Educational attainment significantly affected the MoCA’s latent trait, accounting for 70% of its variance. These findings underscore the complex interplay between age and education in cognitive performance, emphasizing the need for age- and education-adjusted norms in MoCA interpretation.

Figure 5.
Influence of age and education on latent cognitive traits: a MIMIC model representation. Legend. In the presented model, ‘age’ and ‘education’ (edc) are depicted as influencing factors, represented by the rectangles labeled ‘age’ and ‘edc’. These factors impact the latent trait (ltn) of cognitive performance, represented by the central circle. The latent trait, in turn, influences various cognitive domains assessed by the Montreal Cognitive Assessment (MoCA), including Language (Lng), Attention (Att), Executive Functions (Exc), Recall (Rcl), Orientation (Orm), Similarities (Sml), and Naming (Nnm). These domains are represented by the squares connected to the latent trait by arrows, indicating the strength and direction of their relationships. Solid arrows reflect significant positive associations, while dashed arrows indicate non-significant or weaker associations. The numbers on the arrows represent the standardized path coefficients, reflecting the strength of the relationships. This model aims to illustrate how age and education affect overall cognitive abilities and their subsequent impact on specific cognitive domains within the MoCA framework.
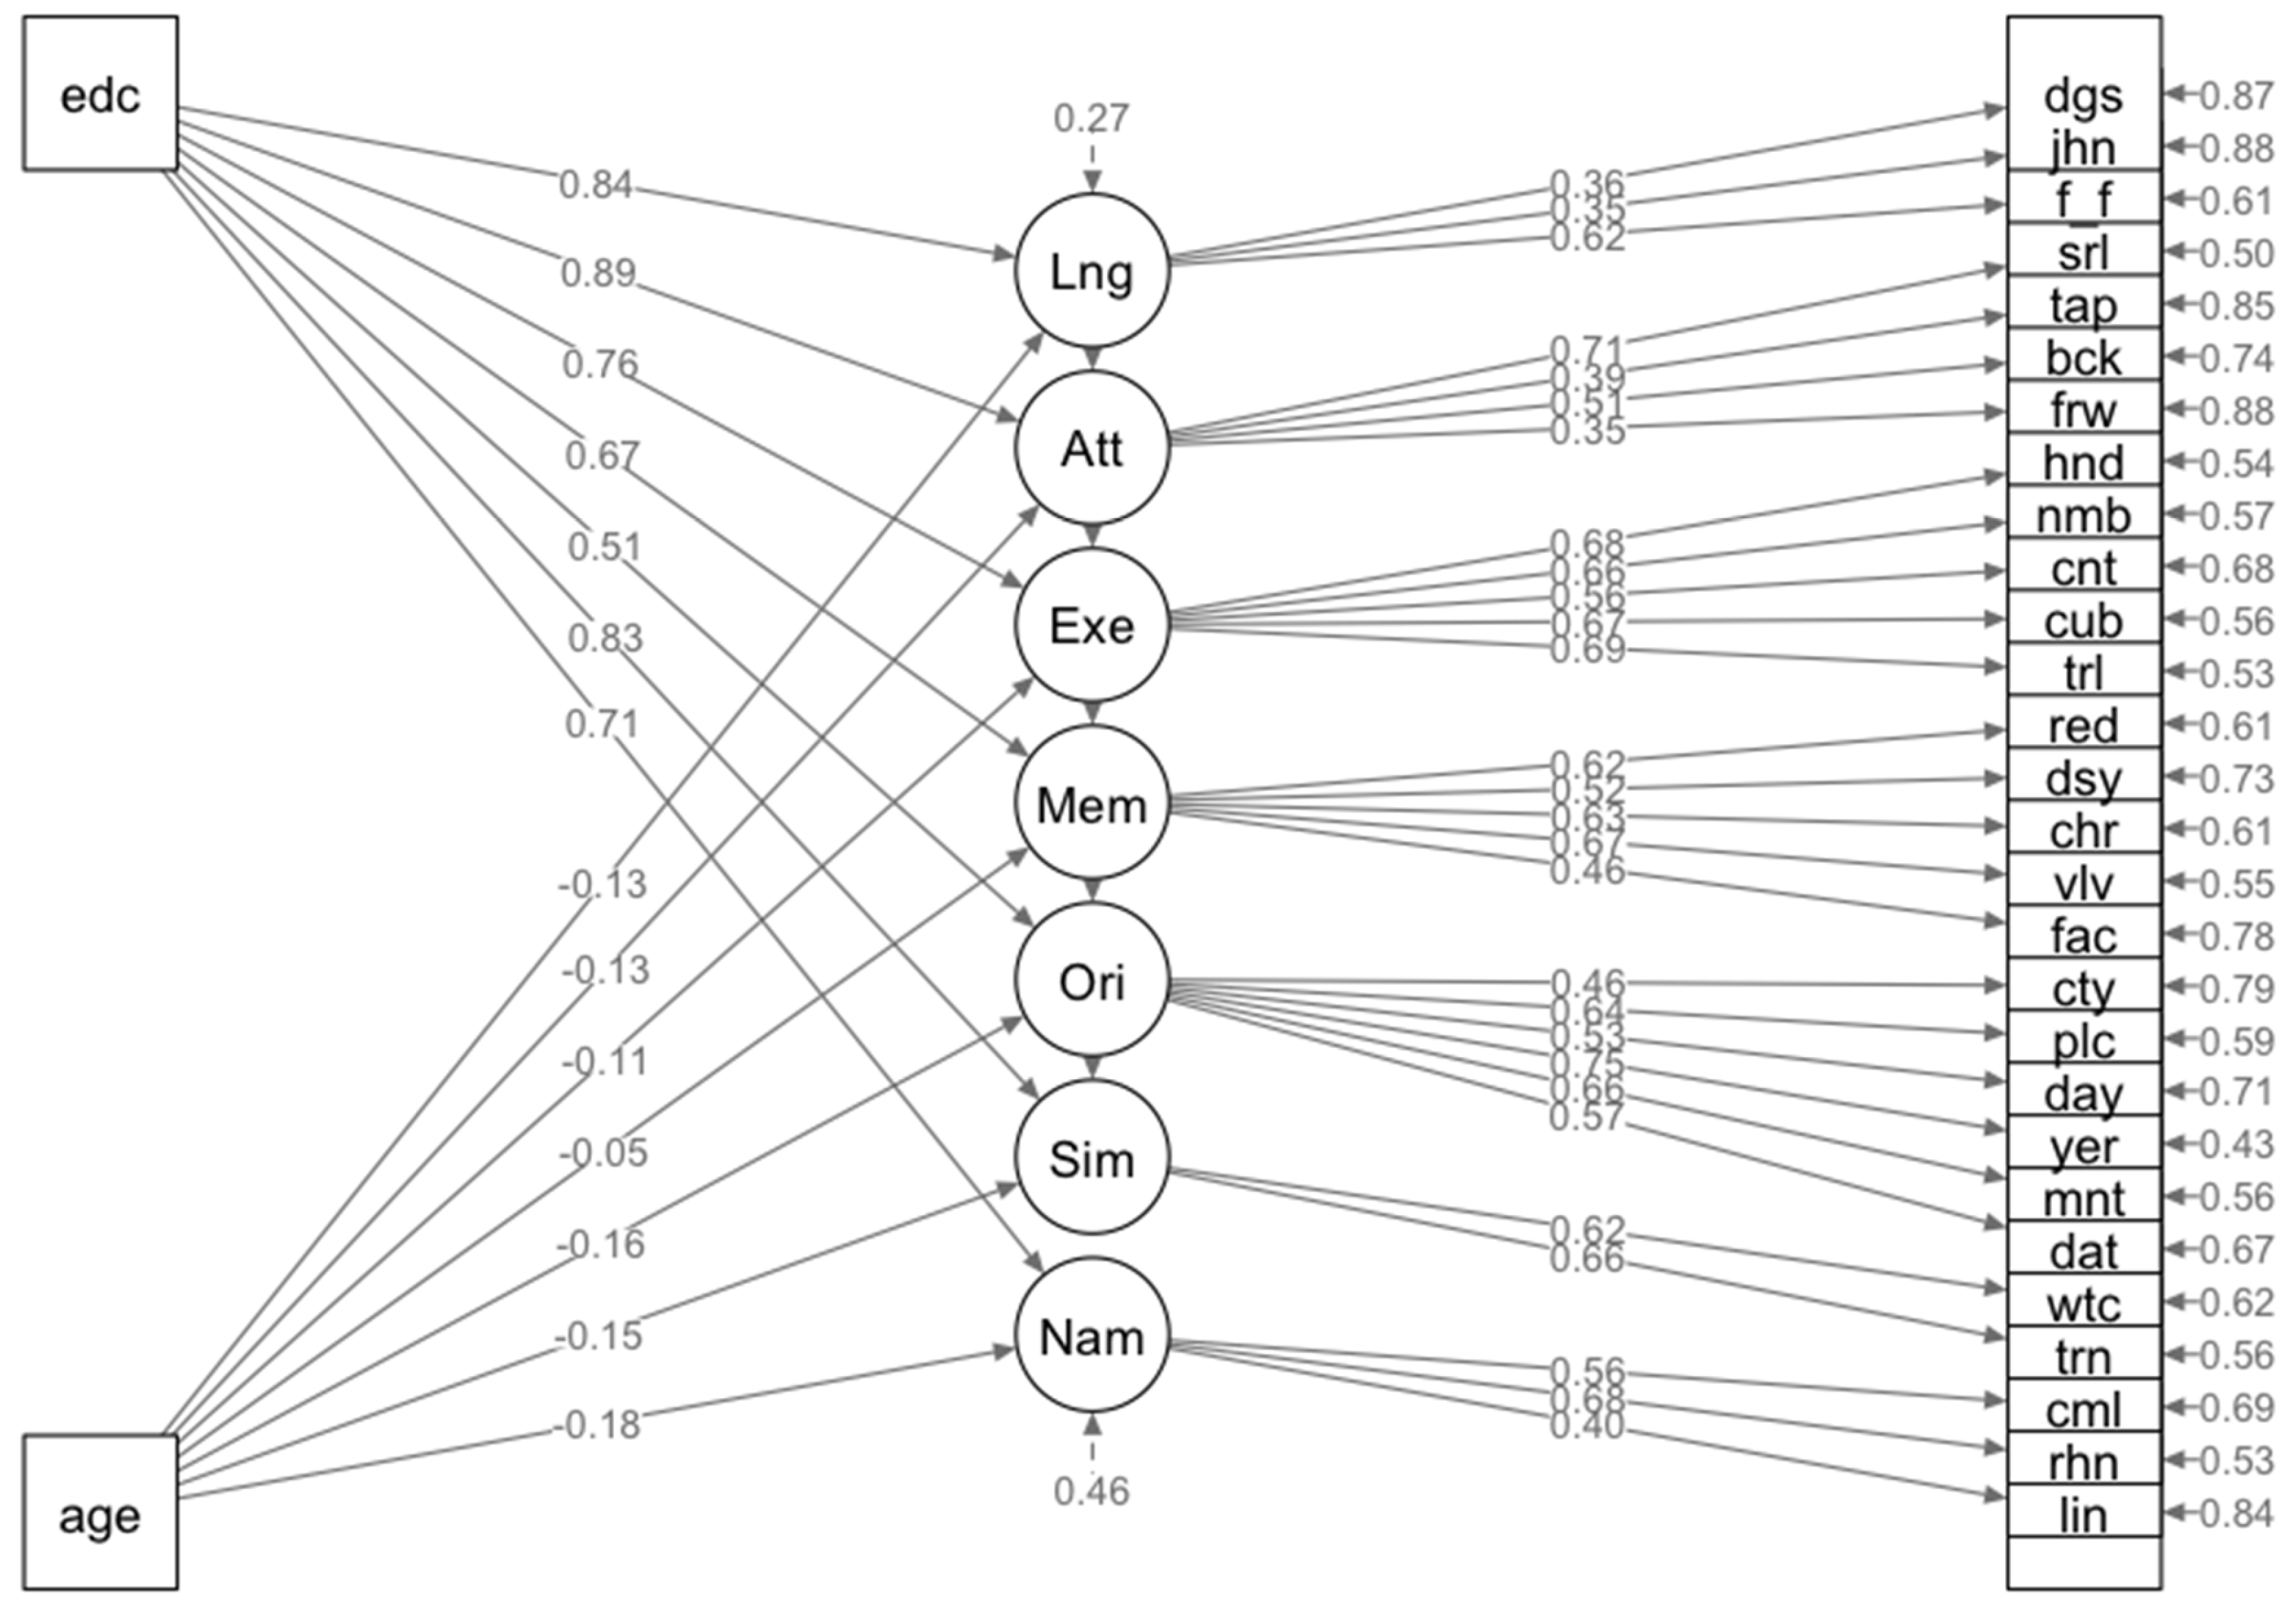
A second MIMIC model explored the influences of age and education on MoCA domain performance (Figure 6). The model demonstrated a strong fit (CFI and TLI ~0.99, RMSEA ≤ 0.035). Educational attainment significantly impacted Language, Attention, Executive Functions, and Similarities (Abstraction) domains (βs from 0.76 to 2.677, p < 0.05). At the same time, age had a smaller, negative effect on Naming, Similarities, Orientation, and Executive Functions (βs from −0.175 to −0.283, p < 0.05). Age’s impact on Memory, Attention, and Language was marginal (p > 0.05). These findings highlight the differential effect of age and education across cognitive domains, emphasizing the need for demographic-specific norms in MoCA interpretation to enhance assessment accuracy and fairness in diverse populations.
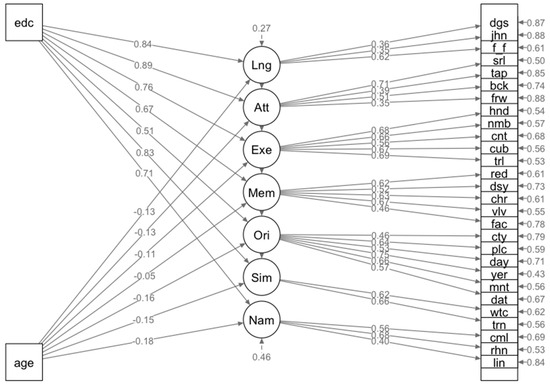
Figure 6.
The Multiple Indicators Multiple Causes (MIMIC) model quantifies age and education’s effects on MoCA domains rather than on a single latent trait. Legend. The model provides specific insights into how these variables impact different cognitive domains within the Montreal Cognitive Assessment (MoCA). Rectangles indicate the predictor variables (‘age’ and ‘edc’), and the circles represent the cognitive domains: Language (Lng), Attention (Att), Executive/Visuospatial (Exe), Memory Recall (Mem), Orientation (Ori), Abstraction/Similarities (Sim), and Naming (Nam). The numerical values next to the single-headed arrows from ‘age’ and ‘edc’ denote the strength and direction of the effects on each domain, with negative values indicating an inverse relationship. The right column displays individual MoCA test items with their corresponding factor loadings: dgs (dog sentence repetition), jhn (John sentence repetition), f_f (phonemic fluency), srl (serial 7s subtraction), tap (hand tapping), bck (backwards digit span), fnw (forward digit span), hnd (clock hands placement), nmb (clock numbers placement), cnt (clock contour drawing), cub (cube copying), trl (trail making), red (recall of "red" word), dsv (recall of "daisy" word), chr (recall of "church" word), vlv (recall of "velvet" word), fac (recall of "face" word), cty (naming of city/place), plc (naming of location), day (orientation to weekday), yer (orientation to year), mnt (orientation to month), dat (orientation to date), wtc (similarities between watch and ruler), trn (similarities between train and bicycle), cml (camel naming), rhn (rhinoceros naming), and lin (lion naming).
4. Discussion
Our investigation into the MoCA using the GRM within a Brazilian PD patient cohort offers detailed insights into the test’s psychometric attributes. The findings on dimensionality align with the MoCA’s design as a tool for globally assessing cognitive function, reinforcing its suitability as a comprehensive cognitive evaluation instrument. This aligns with previous research, such as a study from Portugal, which also upheld the MoCA’s unidimensional nature [20]. However, our study sets itself apart by employing the GRM to address the polytomous characteristics of the MoCA items, offering a distinct analytical perspective.
Contrasting with the findings of Smith et al., who were unable to definitively determine a factor structure for the MoCA in a large cohort of recent-onset PD patients (n = 1738) with normal to mildly impaired cognition [34], our results demonstrate a unidimensional factor structure for the Brazilian Portuguese MoCA in a PD context. The IRT analysis underpins the reliability of the MoCA, as evidenced by its adequate model fit and robust factor loadings. This suggests that, within our study’s framework, the MoCA effectively captures the cognitive dimensions it intends to measure in PD patients, offering a reliable assessment tool in this population.
The MIMIC model revealed significant effects of age and education on MoCA performance. Age negatively correlated with Naming domain scores (β = −0.175 to −0.283, p < 0.05), suggesting decreased semantic memory and language fluency with aging. Conversely, higher education positively influenced cognitive domains, including Executive Functions and Naming, indicating enhanced cognitive reserve. The pronounced impact of education on the Similarities (Abstraction) domain highlights its role in strengthening abstract reasoning. These findings emphasize the importance of considering age and educational background when interpreting MoCA results, as higher education may mask early cognitive decline. Clinicians should adjust their interpretations accordingly to ensure accurate cognitive assessments.
Our findings partially align with those of Luo et al. (2020) in Hong Kong [21], where an IRT analysis of the MoCA was conducted among older Cantonese-speaking individuals. Using a sample of 1873 participants and the Chinese version of the MoCA, the study implemented exploratory and confirmatory factor analyses along with the GRM. It revealed significant variation in MoCA item performance by educational background, particularly in Visuospatial items, and found a greater reliability of the MoCA among uneducated participants. This advocated for the broader use of IRT to improve the measurement precision of clinical scales.
However, this study also contrasts with Sala et al.’s research in Japan, which thoroughly examined the MoCA’s psychometric properties in a large elderly cohort [35]. With 2408 participants across three age groups, their study identified multidimensionality in initial tests, followed by a hierarchical EFA revealing a general factor and seven first-order factors. A confirmatory factor analysis confirmed this structure, and, importantly, measurement invariance was established across diverse demographics, including age, education, sex, and economic status, indicating the MoCA’s robustness across these variables. This finding differs from our study’s emphasis on the impact of age and education. These divergent findings could be due to several factors, including differences in sample characteristics (elderly Japanese vs. PD patients in Brazil), analytical approaches (hierarchical EFA vs. GRM), and the handling of item scores (dichotomous vs. polytomous). Further research is needed to clarify these discrepancies and establish the generalizability of the MoCA’s psychometric properties across different populations and contexts.
In Portugal, the MoCA’s analysis by Freitas et al. (2014) using the Rasch model for dichotomous items and DIF analysis also provides a relevant comparison [20]. Assessing the MoCA in 897 participants, including healthy individuals and a clinical group with various dementia forms, the study evaluated the test’s fit and reliability. It explored DIF related to pathology, gender, age, and education. The results showed good item and person fits with no severe misfit among items and strong discriminant validity, especially between control and clinical groups. Although some items exhibited DIF, it was balanced across variables, mitigating score bias concerns. This balanced DIF contrasts our findings, where educational background significantly influenced domain performance. These differences might stem from the use of distinct IRT models (Rasch vs. GRM), the handling of item scores (dichotomous vs. polytomous), and the focus on different clinical populations (dementia vs. PD). Future studies could directly compare these analytical approaches and populations to highlight these discrepancies.
Our study provides novel insights into the MoCA’s application in PD patients. The Attention and Naming domains demonstrated high discrimination ability, underscoring their importance in detecting cognitive impairments. However, the Orientation and Naming domains showed limitations in differentiating individuals with higher cognitive abilities, suggesting a potential ceiling effect. Clinicians should interpret perfect or near-perfect scores in these domains cautiously and consider supplementing the MoCA with more challenging tasks when assessing individuals with previously high cognitive functioning. The significant effect of educational attainment on MoCA scores necessitates careful consideration in clinical practice. Adjusting cutoff scores based on patients’ educational backgrounds could mitigate the risk of misdiagnosing cognitive impairment, while developing education-specific norms for PD populations could enhance diagnostic accuracy.
The MIMIC analysis elucidated the distinct effects of age and education on MoCA domain performance. Age exerted a modest negative influence on cognitive function, whereas education had a pronounced positive impact, particularly on Executive Functions (96%) and Naming (19%). These findings underscore the necessity of accounting for patients’ educational backgrounds when interpreting MoCA scores and suggest that education-based interventions may enhance cognitive resilience in PD. Moreover, the analysis revealed that age and education independently affected MoCA performance, with no significant covariance. This independence suggests that the cognitive benefits associated with higher education levels may persist throughout life, potentially mitigating age-related cognitive decline. Clinically, these results reinforce the importance of lifelong learning and cognitive stimulation in maintaining brain health, particularly in neurodegenerative conditions such as PD. Furthermore, the application of the MIMIC model provided a more precise delineation of the differential effects of age and education on MoCA subdomains, highlighting its superiority over analytical approaches that do not explicitly integrate these demographic factors.
Additionally, we have developed an electronic correction tool for the MoCA based on our MIMIC model (https://ibneuro.shinyapps.io/moca_mimic_new/, accessed on 1 May 2025). This web application allows clinicians to input a patient’s raw MoCA score, age, and education level to obtain an adjusted score that accounts for the differential item functioning identified in our research. This resource facilitates the immediate clinical application of our findings, enabling more accurate cognitive assessments in diverse PD populations.
To address the psychometric limitations of the MoCA identified in our study, we propose a refined approach for its application in PD patients. We advocate for calibrating test items using IRT to account for educational variability and developing tailored MoCA versions with reduced educational bias. Additionally, we recommend supplemental assessments to better evaluate high cognitive performers and the establishment of large sample demographic-specific norms for more accurate score interpretation. Integrating technology, such as a web-based application utilizing the GRM for automated MoCA scoring, could significantly enhance diagnostic precision by individualizing item weighting. These refinements could substantially improve the MoCA’s utility in diagnosing and tracking cognitive impairment in PD patients across diverse educational backgrounds.
We acknowledge the limitations of the study. The relatively small sample size and non-random participant selection may challenge the generalizability of our findings. Our sample from specialized clinics might not fully represent the broader PD population, potentially excluding patients with more severe cognitive or motor impairments. Future research should aim to recruit larger, more diverse PD samples using random sampling methods. Additionally, while our analysis focused on the impact of education and age on differential item functioning (DIF), it did not explore other potential contributing factors, such as gender or cultural influences. Future studies should investigate a broader range of sociodemographic and cultural variables on MoCA performance in PD and develop strategies to mitigate their impact. Furthermore, the cross-sectional design of our study limits causal inferences about the relationships between demographic factors and cognitive performance. Longitudinal studies are necessary to elucidate the temporal dynamics of these associations and investigate the protective role of education against cognitive decline in PD over time. The inclusion of patients with very-early-onset PD may have influenced the observed psychometric characteristics, although representing a small proportion of the sample. Therefore, the findings should be interpreted cautiously, and future studies might consider analyzing these subgroups separately.
Another limitation of the present study is the absence of a control cohort, which would have allowed for a more comprehensive comparison of the effects of demographic variables, such as sex, on MoCA performance. Although our focus was on the psychometric characterization of the instrument in patients with PD, we recognize that including control subjects and additional variables could further elucidate the underlying mechanisms of differential item functioning (DIF). Future studies should consider incorporating these variables to validate and expand upon our findings.
Furthermore, the lack of pathological confirmation of PD diagnoses restricts the generalizability of our results. Validation in independent cohorts is crucial to confirm the robustness of our findings. Comparisons with studies conducted in different linguistic and cultural contexts suggest similar patterns of DIF, yet methodological and demographic variations may influence the outcomes. These observations highlight the need for further research to strengthen the evidence supporting the applicability of the MoCA across diverse populations.
Our study focused on the MoCA as a global cognitive screening tool and did not include a comprehensive neuropsychological assessment battery. While the MoCA has demonstrated utility in detecting cognitive impairment in PD, it may not capture the full spectrum of cognitive deficits associated with the disease. Future research should explore the relationship between MoCA performance and more comprehensive cognitive assessments in PD and its predictive validity for clinical outcomes such as dementia risk and functional decline.
5. Conclusions and Future Perspectives
In conclusion, our study demonstrates the utility of the IRT GRM approach in assessing the MoCA test’s psychometric properties, revealing unidimensionality with variable domain discrimination and significant age and education influences. The findings highlight the necessity of considering these factors in MoCA score interpretation and advocate for refined education-adjusted norms in clinical practice. MIMIC analysis indicates a strong positive impact of education and a modest negative effect of age on MoCA performance, suggesting that education is a protective factor against cognitive decline in PD. Future research should expand DIF investigations, develop strategies to address measurement invariance, and conduct longitudinal studies to explore the protective role of education over time. Integrating IRT and MIMIC modeling in cognitive screening tool validation promises to enhance our understanding of socio-demographic influences on cognitive health, leading to more personalized and equitable cognitive assessments in PD and other neurological conditions.
Author Contributions
Conceptualization: B.L.S.-L., P.R.d.P.B. and D.A.P.; Methodology: B.L.S.-L., I.F.M., V.T., A.F.S.S., V.B., H.B.F., C.R.d.M.R., M.R.O. and B.H.B.K.; Formal analysis and investigation: B.L.S.-L., P.R.d.P.B., D.A.P., V.T. and I.F.M.; Writing—original draft preparation: B.L.S.-L., P.R.d.P.B. and D.A.P.; Writing—review and editing: B.L.S.-L., P.R.d.P.B., D.A.P., M.R.O., A.F.S.S. and V.T.; Funding acquisition: V.T. and I.F.M.; Supervision: I.F.M., B.L.S.-L., V.T., A.F.S.S. and C.R.d.M.R. All authors have read and agreed to the published version of the manuscript.
Funding
This study was supported by multiple funding agencies. Ignacio Mata (I.F.M.) received funding from the National Institutes of Health (NIH) (R01 1R01NS112499-01A1), the Parkinson’s Foundation (International Research Grants Program award), the Stanley Fahn Junior Faculty Award, the American Parkinson’s Disease Association, The Michael J. Fox Foundation, and the Aligning Science Across Parkinson’s Global Parkinson’s Genetics Program (ASAP-GP2). Additional support was provided by the Fundação de Amparo à Pesquisa do Distrito Federal (FAP-DF) (grant 193001612/2016) to P.R.d.P.B., and the Conselho Nacional de Desenvolvimento Científico e Tecnológico (CNPq) to B.L.S.-L. The funding sources had no role in the study design, data collection and analysis, manuscript preparation, or the decision to submit the article for publication.
Institutional Review Board Statement
This multicenter study was conducted in accordance with the Declaration of Helsinki and was approved by the Institutional Review Board of each participating center, as well as by the National Ethics Committee (CONEP) of the Ministry of Health (Parecer No. 7.324.862, CAAE: 25047219.0.1001.5440, on 15 May 2020). Additionally, the Centro Universitário de Brasília Research Ethics Committee (07073419.0.0000.0023) independently approved the Brasília Parkinson Study.
Informed Consent Statement
Informed consent was obtained from all subjects involved in the study.
Data Availability Statement
The anonymized datasets generated and analyzed during this study are available from the corresponding author upon reasonable request and are subject to institutional ethical policies and applicable legal regulations. Access to the data will be granted solely for legitimate research purposes and exclusively to qualified researchers, contingent upon approval on a case-by-case basis. Due to privacy, legal, and ethical considerations, data sharing is restricted, and requests must be evaluated in accordance with data protection regulations and institutional review board guidelines.
Acknowledgments
The authors gratefully acknowledge the Michael J. Fox Foundation, Conselho Nacional de Desenvolvimento Científico e Tecnológico (CNPq), and FAP-DF (Fundação de Apoio à Pesquisa do Distrito Federal) for funding the study.
Conflicts of Interest
The authors declare no conflicts of interest.
References
- Brandão, P.R.P.; Munhoz, R.P.; Grippe, T.C.; Cardoso, F.E.C.; Castro, B.M.D.A.E.; Titze-De-Almeida, R.; Tomaz, C.; Tavares, M.C.H. Cognitive impairment in Parkinson’s disease: A clinical and pathophysiological overview. J. Neurol. Sci. 2020, 419, 117177. [Google Scholar] [CrossRef] [PubMed]
- Aarsland, D.; Batzu, L.; Halliday, G.M.; Geurtsen, G.J.; Ballard, C.; Chaudhuri, K.R.; Weintraub, D. Parkinson disease-associated cognitive impairment. Nat. Rev. Dis. Primer. 2021, 7, 47. [Google Scholar] [CrossRef] [PubMed]
- Aarsland, D.; Creese, B.; Politis, M.; Chaudhuri, K.R.; Ffytche, D.H.; Weintraub, D.; Ballard, C. Cognitive decline in Parkinson disease. Nat. Rev. Neurol. 2017, 13, 217–231. [Google Scholar] [CrossRef] [PubMed]
- Bode, M.; Kalbe, E.; Liepelt-Scarfone, I. Cognition and Activity of Daily Living Function in people with Parkinson’s disease. J. Neural Transm. 2024, 131, 1159–1186. [Google Scholar] [CrossRef]
- Martinez-Horta, S.; Horta-Barba, A.; Kulisevsky, J. Cognitive and behavioral assessment in Parkinson’s disease. Expert Rev. Neurother. 2019, 19, 613–622. [Google Scholar] [CrossRef]
- Goldman, J.G.; Jagota, P.; Matar, E. Managing cognitive impairment in Parkinson’s disease: An update of the literature. Expert. Rev. Neurother. 2025, 25, 189–209. [Google Scholar] [CrossRef]
- Nasreddine, Z.S.; Phillips, N.A.; Bédirian, V.; Charbonneau, S.; Whitehead, V.; Collin, I.; Cummings, J.L.; Chertkow, H. The Montreal Cognitive Assessment, MoCA: A brief screening tool for mild cognitive impairment. J. Am. Geriatr. Soc. 2005, 53, 695–699. [Google Scholar] [CrossRef]
- Tumas, V.; Borges, V.; Ballalai-Ferraz, H.; Zabetian, C.P.; Mata, I.F.; Brito, M.M.; Foss, M.P.; Novaretti, N.; Santos-Lobato, B.L. Some aspects of the validity of the Montreal Cognitive Assessment (MoCA) for evaluating cognitive impairment in Brazilian patients with Parkinson’s disease. Dement. Neuropsychol. 2016, 10, 333–338. [Google Scholar] [CrossRef]
- Almeida, K.J.; Carvalho, L.C.L.d.S.; Monteiro, T.H.O.d.H.; Júnior, P.C.d.J.G.; Campos-Sousa, R.N. Cut-off points of the Portuguese version of the Montreal Cognitive Assessment for cognitive evaluation in Parkinson’s disease. Dement. Neuropsychol. 2019, 13, 210–215. [Google Scholar] [CrossRef]
- Camargo, C.H.F.; Tolentino, E.d.S.; Bronzini, A.; Ladeira, M.d.A.; Lima, R.; Schultz-Pereira, G.L.; Young-Blood, M.R. Comparison of the use of screening tools for evaluating cognitive impairment in patients with Parkinson’s disease. Dement. Neuropsychol. 2016, 10, 344–350. [Google Scholar] [CrossRef]
- Sarmento, A.L.R. Apresentação e Aplicabilidade Da Versão Brasileira Da MoCA (Montreal Cognitive Assessment) Para Rastreio de Comprometimento Cognitivo Leve. Universidade Federal de São Paulo (UNIFESP): São Paulo, Brazil. 2009. Available online: http://repositorio.unifesp.br/handle/11600/8967 (accessed on 30 November 2018).
- Cesar, K.G.; Yassuda, M.S.; Porto, F.H.G.; Brucki, S.M.D.; Nitrini, R. MoCA Test: Normative and diagnostic accuracy data for seniors with heterogeneous educational levels in Brazil. Arq. Neuropsiquiatr. 2019, 77, 775–781. [Google Scholar] [CrossRef] [PubMed]
- Wong, A.; Law, L.S.; Liu, W.; Wang, Z.; Lo, E.S.; Lau, A.; Wong, L.K.; Mok, V.C. Montreal Cognitive Assessment: One Cutoff Never Fits All. Stroke 2015, 46, 3547–3550. [Google Scholar] [CrossRef] [PubMed]
- Lu, J.; Li, D.; Li, F.; Zhou, A.; Wang, F.; Zuo, X.; Jia, X.-F.; Song, H.; Jia, J. Montreal cognitive assessment in detecting cognitive impairment in Chinese elderly individuals: A population-based study. J. Geriatr. Psychiatry Neurol. 2011, 24, 184–190. [Google Scholar] [CrossRef] [PubMed]
- Balsis, S.; Choudhury, T.K.; Geraci, L.; Benge, J.F.; Patrick, C.J. Alzheimer’s Disease Assessment: A Review and Illustrations Focusing on Item Response Theory Techniques. Assessment 2018, 25, 360–373. [Google Scholar] [CrossRef]
- Hays, R.D.; Morales, L.S.; Reise, S.P. Item response theory and health outcomes measurement in the 21st century. Med. Care 2000, 38, II28–II42. [Google Scholar] [CrossRef]
- Reise, S.P.; Waller, N.G. Item response theory and clinical measurement. Annu. Rev. Clin. Psychol. 2009, 5, 27–48. [Google Scholar] [CrossRef]
- Embretson, S.E.; Reise, S.P. Item Response Theory; Psychology Press: London, UK, 2000. [Google Scholar] [CrossRef]
- Tsai, C.-F.; Lee, W.-J.; Wang, S.-J.; Shia, B.-C.; Nasreddine, Z.; Fuh, J.-L. Psychometrics of the Montreal Cognitive Assessment (MoCA) and its subscales: Validation of the Taiwanese version of the MoCA and an item response theory analysis. Int. Psychogeriatr. 2012, 24, 651–658. [Google Scholar] [CrossRef]
- Freitas, S.; Prieto, G.; Simões, M.R.; Santana, I. Psychometric properties of the Montreal Cognitive Assessment (MoCA): An analysis using the Rasch model. Clin. Neuropsychol. 2014, 28, 65–83. [Google Scholar] [CrossRef]
- Luo, H.; Andersson, B.; Tang, J.Y.M.; Wong, G.H.Y. Applying Item Response Theory Analysis to the Montreal Cognitive Assessment in a Low-Education Older Population. Assessment 2020, 27, 1416–1428. [Google Scholar] [CrossRef]
- Samejima, F. Estimation of Latent Ability Using a Response Pattern of Graded Scores1. ETS Res. Bull. Ser. 1968, 1, i–169. [Google Scholar] [CrossRef]
- Sarihan, E.I.; Pérez-Palma, E.; Niestroj, L.; Loesch, D.; Inca-Martinez, M.; Horimoto, A.R.; Cornejo-Olivas, M.; Torres, L.; Mazzetti, P.; Cosentino, C.; et al. Genome-Wide Analysis of Copy Number Variation in Latin American Parkinson’s Disease Patients. Mov. Disord. 2021, 36, 434–441. [Google Scholar] [CrossRef] [PubMed]
- Brandão, P.R.d.P.; Pereira, D.A.; Grippe, T.C.; Bispo, D.D.d.C.; Maluf, F.B.; Yunes, M.P.; Filho, G.N.; Alves, C.H.L.; Pagonabarraga, J.; Kulisevsky, J.; et al. Parkinson’s Disease-Cognitive Rating Scale (PD-CRS): Normative Data and Mild Cognitive Impairment Assessment in Brazil. Mov. Disord. Clin. Pract. 2023, 10, 452–465. [Google Scholar] [CrossRef] [PubMed]
- Hughes, A.J.; Daniel, S.E.; Kilford, L.; Lees, A.J. Accuracy of clinical diagnosis of idiopathic Parkinson’s disease: A clinico-pathological study of 100 cases. J. Neurol. Neurosurg. Psychiatry 1992, 55, 181–184. [Google Scholar] [CrossRef] [PubMed]
- Brown, T.A. Confirmatory Factor Analysis for Applied Research; The Guilford Press: New York, NY, USA, 2006; p. 475. [Google Scholar]
- Chalmers, R.P. Mirt: A Multidimensional Item Response Theory Package for the R Environment. JSS J. Stat. Softw. 2012, 48, 1–29. [Google Scholar] [CrossRef]
- Masur, P.K. Ggmirt. Published online, 25 October 2023. Available online: https://github.com/masurp/ggmirt (accessed on 22 November 2023).
- Jöreskog, K.G.; Goldberger, A.S. Estimation of a Model with Multiple Indicators and Multiple Causes of a Single Latent Variable. J. Am. Stat. Assoc. 1975, 70, 631–639. [Google Scholar] [CrossRef]
- Posey, C.; Roberts, T.L.; Lowry, P.B.; Bennett, R.J. Multiple Indicators and Multiple Causes (MIMIC) Models as a Mixed-Modeling Technique: A Tutorial and an Annotated Example. Commun. Assoc. Inf. Syst. 2015, 36, 179–204. [Google Scholar] [CrossRef]
- Mast, B.T.; MacNeill, S.E.; Lichtenberg, P.A. A MIMIC Model Approach to Research in Geriatric Neuropsychology: The Case of Vascular Dementia. Aging Neuropsychol. Cogn. 2002, 9, 21–37. [Google Scholar] [CrossRef]
- Tsaousis, I.; Alahmandi, M.T.S.; Asiri, H. Uncovering Differential Item Functioning effects using MIMIC and mediated MIMIC models. Front. Psychol. 2023, 14, 1268074. [Google Scholar] [CrossRef]
- Rosseel, Y. lavaan: An R Package for Structural Equation Modeling. J. Stat. Softw. 2012, 48, 1–36. [Google Scholar] [CrossRef]
- Smith, C.R.; Cavanagh, J.; Sheridan, M.; Grosset, K.A.; Cullen, B.; Grosset, D.G. Factor structure of the Montreal Cognitive Assessment in Parkinson disease. Int. J. Geriatr. Psychiatry 2020, 35, 188–194. [Google Scholar] [CrossRef]
- Sala, G.; Inagaki, H.; Ishioka, Y.; Masui, Y.; Nakagawa, T.; Ishizaki, T.; Arai, Y.; Ikebe, K.; Kamide, K.; Gondo, Y. The Psychometric Properties of the Montreal Cognitive Assessment (MoCA). Swiss J. Psychol. 2020, 79, 155–161. [Google Scholar] [CrossRef]

Disclaimer/Publisher’s Note: The statements, opinions and data contained in all publications are solely those of the individual author(s) and contributor(s) and not of MDPI and/or the editor(s). MDPI and/or the editor(s) disclaim responsibility for any injury to people or property resulting from any ideas, methods, instructions or products referred to in the content. |
© 2025 by the authors. Licensee MDPI, Basel, Switzerland. This article is an open access article distributed under the terms and conditions of the Creative Commons Attribution (CC BY) license (https://creativecommons.org/licenses/by/4.0/).