Abstract
Natural fiber-reinforced unidirectional composites are increasingly adopted in modern industries due to their superior mechanical performance and desirable properties from both material and engineering perspectives. Among various approaches, representative volume element (RVE) generation and analysis is considered one of the most suitable and convenient methods for predicting the elastic moduli of composites. The main aim of this study is to investigate and compare the elastic moduli of natural fiber–reinforced unidirectional composite RVEs using theoretical, numerical, and machine learning models. The numerical predictions in this study were generated using the ANSYS Material Designer tool (version ANSYS 19). A comparison was made between experimental results reported in the literature and different theoretical models, showing high accuracy in validating these numerical outcomes. A dataset comprising 1600 samples was generated from numerical models in combination with the well-known theory of RVE, namely rule of mixture (ROM), to train and test two machine learning algorithms: Random Forest and Linear Regression, with the goal of predicting three major elastic moduli—longitudinal Young’s modulus (E11), in-plane shear modulus (G12), and major Poisson’s ratio (V12). To evaluate model performance, mean squared error (MSE), mean absolute error (MAE), mean absolute percentage error (MAPE), and coefficient of determination (R2) were calculated and compared against datasets with and without the theoretical values as input variables. The performance metrics revealed that with the theoretical values, both Linear Regression and Random Forest predict E11, G12, and V12 well, with a maximum MSE of 0.033 for G12 and an R2 score of 0.99 for all cases, suggesting they can predict the mechanical properties with excellent accuracy. However, the Linear Regression model performs poorly when theoretical values are not included in the dataset, while Random Forest is consistent in accuracy with and without theoretical values.
1. Introduction
Composite materials have become more advanced in modern applications due to their superior mechanical properties, including improved strength-to-weight ratios, enhanced performance, longer service life, and so on, compared to traditional materials. To fabricate composite materials different resources are adopted in composite industries, such as polymers, ceramics, metals, and natural fibers [1]. In recent years, natural fibers have been increasingly adopted compared to conventional fibers. This is primarily because they align with sustainability goals, being renewable, biodegradable, and cost-effective, while also meeting the criteria of a circular economy [2]. Based on the type of sources, natural fibers can be classified into three main categories: plant, animal, and mineral fibers. However, among them, plant fibers are more readily available and do not require extensive pre- and post-processing compared to animal-based fibers. As a result, the current composite industry is increasingly focused on fabricating plant-based composite materials [3]. Based on the fiber orientation, composites can be classified as unidirectional, woven, satin, and so on [4]. A unidirectional composite is a type of composite material in which the fibers are oriented in a single direction within the matrix. Compared to other types of composite materials, unidirectional composites can deliver superior mechanical properties, as they inherently improve the load-bearing capacity of internal structures, whereas in other composites the fibers are distributed in multiple directions [5]. Therefore, many high-tech industries have recently adopted these material embedding orientations, considering the above-mentioned features along with their high strength-to-weight ratio, light weight, design and fabrication flexibility, and significant mechanical properties [6].
Many theoretical models have been developed over the years to predict the mechanical properties of unidirectional composite materials. Among them, the Halpin-Tsai, rule of mixtures (ROM), modified rule of mixtures (MROM), Chamis, and bridging models are well known [6,7]. However, due to its straightforward approach, ROM is widely adopted to calculate the elastic properties of various unidirectional composite materials. In ROM, four elastic properties are mainly calculated: longitudinal Young’s modulus (E11), transverse Young’s modulus (E22), in-plane shear modulus (G12), and major Poisson’s ratio (V12) [7]. ROM is primarily divided into two models: the Voigt model and the Reuss model. The Voigt model, also known as the iso-strain model or the rule of mixtures, is used to calculate E11 and V12. Its major assumption is that all constituents undergo the same deformation in a given direction [8]. On the other hand, the Reuss model, also known as the inverse rule of mixtures or the iso-stress model, assumes that all constituents of the composite are subjected to equal stress [8]. Compared with experimental results, ROM can provide satisfactory predictions of elastic modulus [6,9]. In one study, a comparative approach between ROM and a proposed micromechanical model was evaluated using experimental validation. The results showed that both the proposed model and ROM produced similar predictions, while the experimental outcomes exhibited negligible discrepancies [10]. A similar comparison between ROM and the Halpin-Tsai model was also conducted. In this investigation, a hybrid composite made of banana, sisal, and a modified silica nanoparticle matrix was fabricated. The results indicated that ROM showed good agreement with experimental outcomes and the Halpin-Tsai model when the composites were manufactured with a volume fraction of 30%. However, at a volume fraction of 50%, the Halpin-Tsai model performed better in predicting the elastic properties of the hybrid composites [11]. Beyond unidirectional composites, ROM can also be applied to calculate the elastic modulus of plain-woven composites, as discussed in this study [12]. Moreover, ROM allows the prediction of elastic properties in different types of composites by considering fiber content, fiber length, fiber orientations, shear angle, yarn angle, and other variables through a straightforward mathematical formulation [13].
The finite element method (FEM) is a rigorous tool used to compute the mechanical properties and performance of composites. It allows researchers to compare and understand material behavior with reduced computation time while enabling the design of a virtual experimental environment similar to physical testing [6]. For unidirectional composites, representative volume element (RVE) generation is the most suitable and well-recognized method for estimating mechanical properties through elastic moduli. In many cases, RVE-generated results for elastic moduli have been validated to closely match both experimental and theoretical approaches [6,14]. However, slight and negligible deviations can occur due to variations in computational techniques, considered parameters, or theoretical assumptions [6,14,15]. For example, this study found that RVE size, fiber size ratio, and mesh type can significantly affect the elastic moduli [16]. Among all finite element techniques for RVE generation, ANSYS Material Designer is widely accepted because its predictions align well with both theoretical models such as ROM, MROM, Halpin-Tsai, Chamis, and Bridging, as well as experimental outcomes [6]. In ANSYS Design Modeler, the prediction accuracy is high, with typical deviations ranging between 5 and 10% [6]. Several factors in ANSYS Material Designer—such as fiber size, shape, volume fraction, mesh type, and boundary conditions—can significantly influence the elastic moduli of unidirectional composites [17]. With respect to fiber volume fraction, although the range can be selected between 0.1 and 1, the best results are generally obtained within the range of 0.1–0.7 for unidirectional composites [6,17]. This is because as the fiber volume fraction increases from 0.1 to 0.7, the elastic modulus increases linearly. Beyond this range, the dominant presence of the matrix in the composite makes it stiffer, which can lead to earlier failure [17]. For other types of composites—such as particulate composites, randomly oriented composites, and woven composites—RVE generation in ANSYS Material Designer has also been widely adopted by researchers due to its higher computational accuracy and design flexibility [18].
Mesh generation is one of the obligatory tasks in the FEM used to refine the solid body and create nodes, which help achieve better outcomes during simulations [19]. The quality of the mesh is always interconnected with the design model, which may affect the results when the model changes or when different types are considered [20]. Although different methods and mesh sizes may influence the outcomes, the results mainly depend on the computational techniques and the designed object [21]. In terms of ANSYS Material Designer tools, meshing is a default function where the sizes are automatically assigned and generated. Moreover, since the size of the RVE is at the microscale, the mesh size does not affect the outcomes, even slightly [17].
Machine learning (ML), a subset of artificial intelligence (AI), helps researchers learn from data to predict material properties, performance, and service life [17]. In recent years, ML-based prediction and analysis have been increasingly adopted in the composite industry [22]. Compared with conventional statistical methods, ML provides more precise and accurate predictions of material properties [23]. A variety of ML techniques are widely used in composites research and industry, including support vector machines (SVM), random forests, k-nearest neighbor (k-NN), decision trees, artificial neural networks (ANNs), and linear regression [23]. Specifically for unidirectional composites, this study investigated the elastic modulus (E) and yield strength using a gradient-boosted tree regression model combined with a 10-fold cross-validation strategy [24]. ML has also been integrated into RVE-based studies, particularly for failure analysis [25]. For example, one study developed a hybrid method combining ANNs and RVE modeling to predict carbon fiber failure under different triaxial loading conditions. The results showed that the ANN algorithm achieved a prediction accuracy of 97.5%, making it a robust tool for failure prediction in unidirectional composites [25]. Another study explored the influence of fiber shape on the elastic modulus of unidirectional composite RVEs using the ML bagging error method. The predictive performance of different ML models was evaluated through the R2 metric. The ensemble model achieved an R2 value of 1, the ANN model reached 0.9987, while linear regression yielded a comparatively lower but still reasonable R2 value of 0.8405 [26]. Similarly, this research investigated the key microstructural parameters of unidirectional and carbon fiber-reinforced polymer composites RVE using a random forest model and obtained R2 values greater than 0.9 [27]. To improve prediction accuracy, the random forest algorithm introduces mechanisms that help estimate outcomes in the shortest possible time. Moreover, the prediction accuracy is well-suited for the analysis of composite materials [23]. AI has also been applied to evaluate the effects of defects on the elastic modulus of RVEs [28]. For instance, a two-stage AI-based framework was developed to assess the influence of voids and regular defects in unidirectional composite RVEs. The study proposed that this framework could serve as a cost-effective tool for detecting crack patterns with minimal computation time, particularly in material design applications [29]. Furthermore, AI has been employed to analyze uncertainties in the elastic properties of RVEs, enabling refinement of composite designs that was previously unattainable using conventional methods or traditional FEM analysis [30]. Overall, the current applications of AI and ML are increasingly diverse in the context of unidirectional and other composite RVE generations. These approaches enable researchers to evaluate mechanical performance, life cycle, and failure behavior within the shortest possible time, delivering highly accurate predictions with minimal complications [31,32].
From the above literature review, it is evident that plant-based natural fiber-reinforced composites hold significant potential for industrial applications. Moreover, FEM- and AI-based prediction methods have gained considerable attention in composite research and design. However, to the best of the authors’ knowledge, no study has specifically focused on plant-based natural fibers with RVE investigations using machine learning models. Therefore, the aim of this study is to investigate the elastic modulus of plant-based natural fiber-reinforced unidirectional composite RVEs through two classical machine learning models, namely, Linear Regression and Random Forest. The study also outlines the importance of including theoretical values as an input feature in assisting the model predictions.
2. Material Properties
For this research, only plant-based natural fibers are considered. Fibers are generally classified into two types based on the orientation of their materials, such as isotropic and orthotropic. Accordingly, both isotropic and orthotropic materials are examined in this study for FEM and machine learning investigations. In some of the isotropic fibers and matrices, the shear modulus is not provided; in such cases, when entering the material properties into the ANSYS material library, the software generates a shear modulus value, which is presented in Table 1 and Table 2 and subsequently used in the theoretical calculations of the in-plane shear modulus. The isotropic and orthotropic material properties of plant-based natural fibers are provided in Table 1 and Table 2. In Table 1 and Table 2, most of the matrices are epoxy. However, Ecopoxy and ESO are two different types of matrices used in this study. Ecopoxy is a resin similar to epoxy, but the main distinction is that Ecopoxy is environmentally friendly. In contrast, the ESO matrix refers to Epoxidized Soybean Oil (ESO) matrix [33].

Table 1.
Isotropic material properties of plant-based natura fibers and matrixes.
Table 2.
Orthotropic material properties of plant-based natura fibers and matrixes.
3. Finite Element Set-Up and Numerical Validations
To validate the overall investigations conducted using Ansys Material Designer and to enhance the logical flow of this study, various theoretical approaches—such as Mori-Tanaka (M-T), ROM and Self-consistent (S-C)—along with experimental results, were considered and compared with the authors’ findings for different volume fractions of RVEs.
Prior to performing simulations, the material properties were first selected and inserted into the material library of ANSYS version 19 using the Ansys Material Designer tool. After selecting the fiber type (unidirectional composites) in Ansys Material Designer, three fiber shapes were available. Among these, the square shape was chosen over the hexagonal and diamond shapes due to its better accuracy in the outcomes [6]. In addition, for validation, this study used carbon fiber and an epoxy matrix from the referenced literature [6]. In Figure 1a–d, the ANSYS Material Designer square-shaped unidirectional composite RVE is presented for carbon-epoxy unidirectional composites, and in Figure 1e–g, the SEM analyses of the unidirectional composite RVE are illustrated.
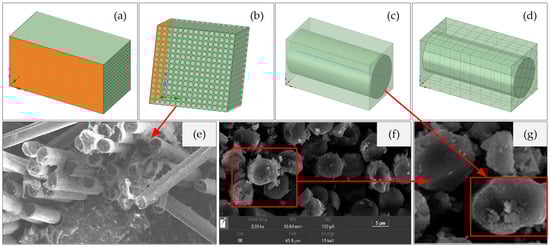
Figure 1.
(a,b) Sixteen-repeat-count unidirectional composites; (c) square-shaped unidirectional composite RVE; (d) meshed square-shaped unidirectional composite; (e–g) SEM analysis of square-shaped unidirectional composites [42].
The material properties of both fiber and matrix were then defined in the software. The fiber volume fraction was selected for specific investigations. In Ansys Material Designer, other parameters such as fiber diameter, aspect ratio (length-to-diameter ratio), and repeat count were kept constant since their influence was negligible. For mesh generation, block meshing and conformal meshing were adopted due to their faster operation compared to periodic meshing. In addition, the variation in mesh size does not significantly affect the RVE analysis in ANSYS Material Designer, particularly at the microlevel, as reported in the literature [17]. In the material properties options, anisotropy was defined as orthotropic with linear elasticity. For boundary conditions, periodic boundary conditions were applied, as this is the default feature in Ansys Material Designer. The temperature of the composite was kept constant at 22 °C in the software.
During the validation process, constant variable material properties were selected to obtain the outcomes corresponding to different volume fractions. After obtaining the simulation results, this study compared them with ANSYS Material Designer outcomes and found only negligible discrepancies of 5–10%. In Figure 2a–c, the longitudinal young’s modulus, in-plane shear modulus, and major Poisson’s ratio obtained from ANSYS Material Designer are compared with the theoretical models and experimental results.
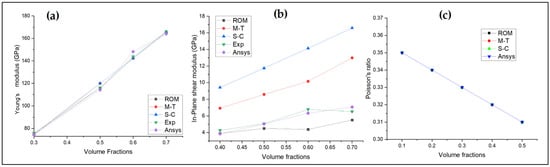
Figure 2.
(a) Comparison of the elastic modulus obtained from ROM, M-T, S-C, experiment, and ANSYS Design Modeler; (b) comparison of the in-plane shear modulus obtained from ROM, M-T, S-C, experiment, and ANSYS Design Modeler; (c) comparison of Poisson’s ratio obtained from ROM, M-T, S-C, experiment, and ANSYS Design Modeler.
After comparing the outcomes, this study further performed FEM analysis of the RVE for 17 plant fibers with different matrix materials. During the generation of the composites in ANSYS Material Designer, a total of 100 variants of fiber volume fractions, ranging from 0.1 to 0.7, were selected for each composite. In addition, the validation and FEM procedures were followed in the same manner to enhance the precision and accuracy of the study.
4. Theoretical Backgrounds and Boundary Conditions
In this research, the Rule of Mixtures (ROM) was used to calculate the elastic modulus [7]. For the longitudinal Young’s modulus (E11) of a unidirectional composite RVE, the ROM (Voigt) expression is:
E11= Vf·Ef11 + Vm·Em
However, for the major Poisson’s ratio, the calculations are as follows;
υ12 = Vf·υ11f + Vm·υm
The in-plane shear modulus (G12) is calculated as follows.
G12 = (G12f·Gm)/(Gm·Vf) + (G12f·Vm)
For the above calculations, the subscript f represents the fiber constituent properties, while the subscript m represents the matrix constituent properties.
Linear regression is one of the most straightforward and widely used machine learning models, primarily employed to predict dependent variables based on one or more independent variables. It plays a crucial role in establishing a linear relationship between predictors and responses. Although it is highly suitable for linear-type predictions and analyses, certain technical challenges may arise when dealing with nonlinear relationships [43]. On the other hand, the Random Forest model is another machine learning approach that constructs multiple decision trees and combines their outputs to improve prediction accuracy. Compared to other ML models, its main advantage lies in its ability to effectively capture nonlinear and complex relationships between input variables and outputs without significant complications. Moreover, it is capable of efficiently handling both large- and small-scale datasets [44].
To predict the performance of machine learning models such as Linear Regression and Random Forest, various performance evaluation metrics were used. In this study, the Mean Squared Error (MSE), Mean Absolute Error (MAE), Root Mean Squared Error (RMSE), and the Coefficient of Determination (R2) were employed [45]. The equations for these performance evaluation metrics are given below.
In Equation (7), SSR and SST represent the Sum of Squares for Regression and the Total Sum of Squares, respectively. The dataset is split into 80:20 ratio.
For the RVE generation in ANSYS Material Designer, although periodic boundary conditions are a default feature, the boundary conditions are also discussed in this study [6]. These conditions are primarily applied in three directions—k, m, and n—of the unidirectional composite RVE. The boundary conditions are presented in Equation (8) through (14).
The boundary conditions of unidirectional composite RVE in longitudinal composite RVE are as follows;
u11(k,m,0) = u22(k,m,0) = u33(k,m,0),u11(k,m,x) = ∂kk
u11(0,m,n) = u22(k,0,n) = u33(k,m,0),u22(k,x,n) = ∂mm
For the plane n the boundary conditions for unidirectional composites RVE are given below;
u11(0,m,n) = u22(k,0,cn) = u33(k,m,0),u33(k,m,x) = ∂nn
For the shear modulus, such as the in-plane and out-of-plane shear moduli (G12, G23, and G13), the periodic boundary conditions in the k, m, and n planes are discussed below.
u11(k,0,n) = u22(k,0,n) = u33(k,0,n) = 0,u11(k,x,n) = ∂l
u11(k,m,0) = u22(k,m,0) = u33(k,m,0) = 0,u22(k,m,x) = ∂t
u11(k,0,n) = u22(k,0,n) = u33(k,m,0) = 0,u22(x,m,n) = ∂l
In terms of Poisson’s ratios, both major and minor, the following equations are applied in all directions.
υ = −∂εtrans/∂εaxial
5. Results and Discussion
For this study, 1600 data samples were generated through FEM simulations. Among them, 320 samples were set aside to test the prediction accuracy. In this section, we present a detailed analysis of the results obtained using the random forest model—both with and without the inclusion of theoretical data—compared with the output from ANSYS Material Designer. Additionally, we analyze the results of linear regression, again with and without theoretical data, and compare them with the ROM results obtained from ANSYS Design Modeler. For both ML models, the performance metrics—MSE, MAE, R2, and MAPE—were calculated and compared.
5.1. E11 Predictions and Comparisons
Linear regression for E11 using the theoretical data yielded an R2 value of 0.9999996, an MSE of 3.95 × 10⁻⁵, an MAE of 0.00351, and a satisfactory MAPE of 0.0005, indicating that the predictions were, on average, within 0.1% of the actual values. In addition, the maximum absolute error observed was 0.0465, further demonstrating the model’s excellent consistency and prediction accuracy. As shown in Figure 3a, the linear regression–based E11 predictions closely align with the actual data, with the predicted values falling perfectly on the linear trend line and showing no noticeable deviations. Furthermore, Figure 4a illustrates that the errors are clustered within the same narrow region, reinforcing the reliability and precision of the model.
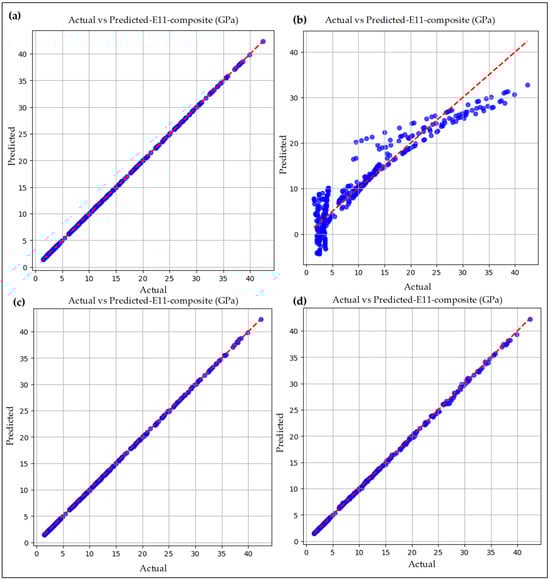
Figure 3.
Actual vs. predicted graphs for E11: (a) linear regression model with theoretical data, (b) linear regression model without theoretical data, (c) random forest model with theoretical data, and (d) random forest model without theoretical data.
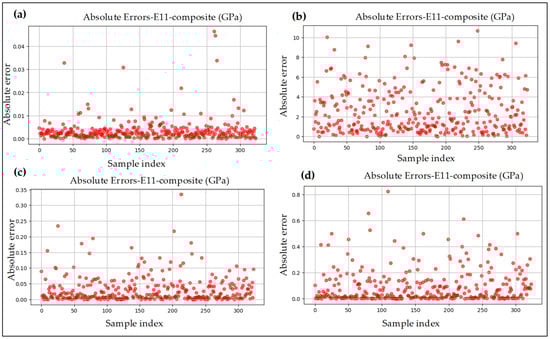
Figure 4.
Absolute error plots for E11: (a) linear regression model with theoretical data, (b) linear regression model without theoretical data, (c) random forest model with theoretical data, and (d) random forest model without theoretical data.
After removing the theoretical data, the performance of the linear regression model declined sharply. For instance, the R2 value dropped to 0.883, the MSE increased significantly to 12.02, and the MAE rose to 2.595. Moreover, the MAPE increased to 0.540—approximately 50% higher compared to the predictions made using theoretical values. This clearly indicates that linear regression with theoretical data yields more accurate predictions than without it. In Figure 3b, the predicted versus actual data for the linear regression model is presented. As observed in the figure, the line graph is not perfectly linear with respect to the predicted data, which indicates a slight deviation and reduced prediction accuracy. Figure 4b illustrates the absolute error for E11. The figure shows that the errors are widely spaced, further reflecting the prediction inaccuracy. For example, the highest absolute error observed was 10.69.
In comparison to linear regression, the random forest machine learning (ML) model demonstrated superior performance. The random forest achieved an R2 value of 0.99997, an MSE of 0.004, an MAE of 0.037, and an MAPE of 0.003, reflecting its excellent prediction accuracy. As shown in Figure 3c, the predicted values for E11 closely align with the actual values, with both lying almost perfectly on the same line. This indicates a much higher prediction accuracy compared to the linear regression model. Furthermore, Figure 4c presents the absolute errors produced by the random forest model. The figure illustrates that the errors are tightly clustered, rather than widely scattered, further confirming the model’s accuracy. The highest absolute error observed was only 0.33.
Table 3 presents the performance metrics used to evaluate whether the Random Forest model experiences overfitting or underfitting. The results indicate that the model performs exceptionally well on both the training and test datasets, with R2 values that are nearly identical and only minor discrepancies in test errors, such as Mean Squared Error (MSE), Mean Absolute Error (MAE), and Mean Absolute Percentage Error (MAPE). This suggests that the model generalizes effectively to unseen data, indicating that it neither overfits nor underfits.
Table 3.
Random Forest Performance.
Similarly to the results obtained with theoretical data, the random forest model without theoretical data exhibited a similar trend in predictions. The model achieved an R2 value of 0.9997, an MAE of 0.0916, an MSE of 0.024, and an MAPE of 0.0062, indicating high prediction accuracy. Furthermore, as shown in Figure 3d, the predicted values align closely with the actual values, reflecting the consistency of the model’s predictions. Figure 4d illustrates the absolute error distribution, showing a similar observation to that of the random forest model with theoretical data. Moreover, the highest absolute error obtained was below 1 MPa, further confirming the model’s reliability.
5.2. G12 Predictions and Comparisons
Similarly to E11, a prediction analysis was also performed for G12 using both machine learning models—linear regression and random forest—considering scenarios with and without theoretical data. For G12 with theoretical data, the linear regression model provided excellent predictive performance. The performance metrics were R2 = 0.99715, MAE = 0.033, MSE = 0.002, and MAPE = 0.0208, demonstrating high accuracy. As illustrated in Figure 5a, the predicted values closely align with the actual values, indicating the strong predictive capability of the model. Furthermore, the highest absolute error observed was 0.22, which further confirms the model’s reliability and accuracy. The absolute errors for this model are shown in Figure 6a.
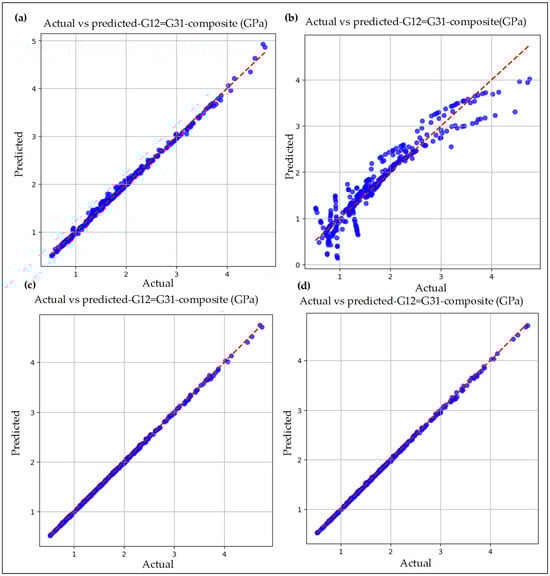
Figure 5.
Actual vs. predicted graphs for G12: (a) linear regression model with theoretical data, (b) linear regression model without theoretical data, (c) random forest model with theoretical data, and (d) random forest model without theoretical data.
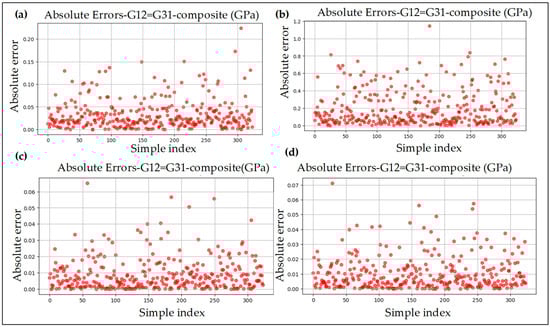
Figure 6.
Absolute error plots for G12: (a) linear regression model with theoretical data, (b) linear regression model without theoretical data, (c) random forest model with theoretical data, and (d) random forest model without theoretical data.
For the linear regression model without theoretical data, its predictive ability decreased significantly. For instance, the R2 value dropped to 0.8955, MAE increased to 0.20, MSE increased to 0.0805, and MAPE moderately increased to about 14%. As shown in Figure 5b, the G12 prediction graph illustrates that the actual and predicted values are moderately scattered around the reference line, indicating reduced prediction accuracy. The highest absolute error observed was 1.14. The absolute error distribution is depicted in Figure 6b.
In Figure 5c, the random forest regression analysis for G12 is presented. In this case, the FEM and theoretical analysis outcomes were considered. As shown in Figure 5c, the predicted values closely match the actual values, lying on the same line and demonstrating the model’s consistency and predictive accuracy. The performance metrics for this model are R2 = 0.99997, MAE = 0.0089, MSE = 0.0001, and MAPE = 0.0046, reflecting excellent prediction accuracy. The absolute error distribution is shown in Figure 6c, where the errors are spread across different zones; however, the deviations remain minimal, with the highest absolute error obtained at 0.06.
In Figure 5d, the actual and predicted values obtained from the random forest model without considering theoretical data are illustrated. It is evident that the predicted values closely follow the actual values, lying almost on the same line, with only slight deviations observed. Moreover, the prediction accuracy is nearly identical to that achieved with the random forest model using theoretical data. The performance metrics for this analysis are R2 = 0.99968, MSE = 0.00024, MAE = 0.0105, and MAPE = 0.005, all of which indicate excellent predictive performance. The highest absolute error observed was 0.07, which is minimal and further confirms the model’s accuracy. The absolute error distribution is presented in Figure 6d.
5.3. V12 Predictions and Comparisons
Similarly to the E11 predictions, a comparative analysis was also conducted for V12 using machine learning models, considering both scenarios—with and without theoretical data. For V12 with theoretical data, the linear regression model demonstrated strong predictive performance. The performance metrics were R2 = 0.9949, MSE = 1.90 × 10⁻⁵, MAE = 0.002, and MAPE = 0.0065, indicating high prediction accuracy. As shown in Figure 7a, the predicted values align closely with the actual values, with only negligible deviations. The highest absolute error observed was 0.03, further confirming the robustness of the model. Figure 8a illustrates the absolute error distribution, showing that most data points fall within the same narrow region, reinforcing the consistency of the predictions.
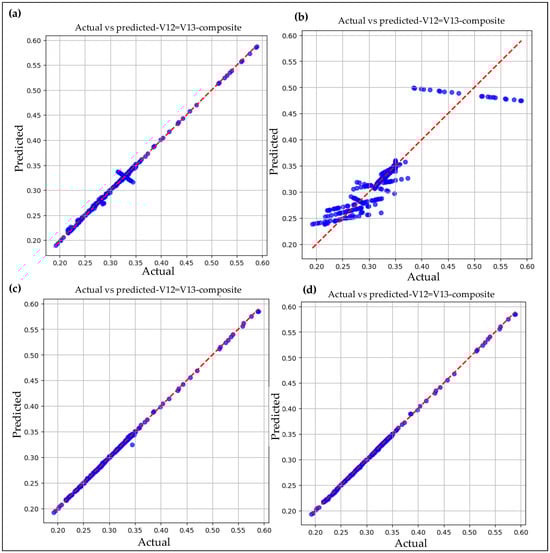
Figure 7.
Actual vs. predicted graphs for V12: (a) linear regression model with theoretical data, (b) linear regression model without theoretical data, (c) random forest model with theoretical data, and (d) random forest model without theoretical data.
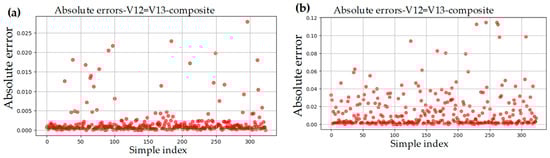
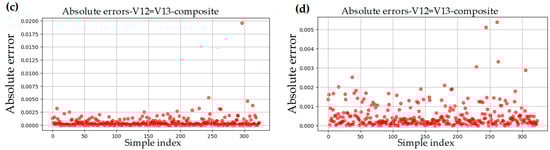
Figure 8.
Absolute error plots for V12: (a) linear regression model with theoretical data, (b) linear regression model without theoretical data, (c) random forest model with theoretical data, and (d) random forest model without theoretical data.
Without the theoretical data, the performance of the linear regression model for V12 dropped significantly. For instance, the R2 value decreased to 0.835, while MSE increased to 0.0006, MAE to 0.0139, and MAPE to 0.04, reflecting the reduced predictive capability of the model in the absence of theoretical values. As shown in Figure 7b, the actual versus predicted values no longer follow a clear linear trend and appear more scattered, indicating discontinuity in predictions. This observation is further supported by the highest absolute error of 0.11, which highlights the model’s imperfection compared with the linear regression model that included theoretical values. Figure 8b illustrates the absolute error distribution, further confirming the reduced accuracy and continuity of this model’s predictions.
However, when using the random forest model with theoretical data, the predictions were highly accurate for V12. The performance metrics for this model were R2 = 0.999, MAE = 0.0005, MSE = 2.004, and MAPE = 2.004, demonstrating excellent predictive capability. As shown in Figure 7c, the predicted values closely align with the actual values, further confirming the model’s accuracy. The highest absolute error observed was 0.019, which is very small and supports the reliability of the predictions. The absolute error distribution for this model is presented in Figure 8c.
Similarly to the random forest model with theoretical data, the model without theoretical data for V12 also performed exceptionally well. The performance metrics for this model were R2 = 0.9998, MSE = 6.78 × 10⁻⁷, MAE = 0.0004, and MAPE = 0.0016, indicating excellent predictive capability. As shown in Figure 7d, the actual versus predicted values align almost perfectly, further demonstrating the superior prediction accuracy of this model—slightly outperforming the random forest model with theoretical data. The absolute error distribution is presented in Figure 8d, where the highest absolute error recorded was only 0.005, reinforcing the consistency and reliability of this model.
6. Future Perspective
In this research, natural fiber-reinforced composites, particularly plant fiber unidirectional composites, have been investigated using ANSYS Material Designer and popular machine learning models. However, there are several future research directions that can be explored to promote sustainable materials, considering various aspects, including both material selection and methodological approaches.
In this study, plant fibers and epoxy, Ecopoxy, and ESO matrices were considered. However, future research could explore other materials, such as cement, geopolymer, and bio-resins, within both experimental and virtual experimentation systems to better understand material behavior and identify broader applications, such as in building and construction, aerospace, and other industries.
The mechanical properties of plant-based unidirectional composites were investigated for Representative Volume Element (RVE) generation and machine learning analysis. Future research could be extended to other composite architectures, such as woven, particulate, and randomly oriented systems, with a particular focus on natural fiber reinforcements.
This study exclusively investigated plant-derived natural fibers in unidirectional composites. However, subsequent research could incorporate other categories of natural fibers, such as animal-based unidirectional composites, to enable a broader comparison and deeper understanding of their mechanical performance.
In the present work, two machine learning models, Random Forest and Linear Regression, were utilized to predict the elastic modulus of unidirectional composite RVEs. Future investigations may consider additional algorithms, including k-Nearest Neighbors (k-NN), Decision Tree, and Category Boosting (CatBoost), to enhance prediction accuracy and model optimization.
Furthermore, the Rule of Mixtures (ROM) theoretical model was adopted for comparison with the results obtained from ANSYS Material Designer. Future studies could explore other well-established analytical models, such as the Halpin–Tsai model, Chamis model, and Bridging model, for a more comprehensive evaluation of RVE-based elastic modulus predictions in unidirectional composites.
Finally, this research focused primarily on Finite Element Method (FEM) analysis. Although FEM serves as a robust and reliable approach for evaluating the mechanical properties of RVEs, future work should aim to validate the ANSYS Material Designer outcomes against experimentally measured data to improve the prediction accuracy in the results for real-world applications.
7. Conclusions
This study conducted extensive simulations using the ANSYS Material Designer tool to investigate the mechanical properties and performance of plant-based natural fiber–reinforced composites. The elastic modulus of the designed unidirectional composites was further analyzed using two well-known machine learning models—linear regression and random forest—to evaluate predictive performance through standard metrics. The key findings of this AI-based study on plant-based natural fiber composites are summarized as follows:
ANSYS Material Designer proved to be a robust tool for computing the mechanical properties of plant-based natural fiber unidirectional composites without the need for physical experimentation. This approach can significantly reduce manufacturing costs by enabling virtual experiments prior to composite fabrication.
The theoretical model (ROM) produced outcomes that were almost identical to those from ANSYS simulations, both numerically and in the AI predictions. This consistency reflects the robustness of ANSYS Material Designer and ROM for future applications in predicting the mechanical or elastic moduli of natural fiber–reinforced composites, particularly plant-based ones.
Machine learning models performed well in predicting the elastic modulus of plant-based natural fiber composites. In particular, the random forest model demonstrated superior predictive accuracy compared to linear regression in both scenarios—using theoretical data and without theoretical data.
Linear regression generally did not achieve significant improvement or the highest prediction accuracy, especially when combined with the theoretical values from ROM.
In terms of the elastic modulus E11, the comparative analysis revealed that the random forest model provided excellent prediction accuracy (R2 =0.9997, MAE = 0.0916, MSE = 0.024, and MAPE = 0.0062) compared to the linear regression model (R2 = 0.883, MSE = 12.02, and MAE = 2.595) when the theoretical values were removed.
For G12, the random forest model outperformed the linear regression model both with and without theoretical values. With theoretical data, the model achieved R2 = 0.9997, MSE = 0.0001, MAE = 0.0089, and MAPE = 0.0046, while without theoretical data, the corresponding values were R2 = 0.99968, MSE = 0.00024, MAE = 0.0105, and MAPE = 0.005.
In terms of V12, the random forest model similarly demonstrated superior prediction accuracy both with and without theoretical data. The performance metrics were R2 = 0.999, MSE = 2.004, MAE = 0.0005, and MAPE = 2.004 with theoretical data, and R2 = 0.9998, MSE = 6.78 × 10⁻⁷, MAE = 0.0004, and MAPE = 0.0016 without theoretical data, confirming the model’s exceptional predictive capability and consistency.
Absolute error calculations provided strong validation of the performance metrics. In most cases, the errors remained within the same narrow range, supporting the strong agreement between actual and predicted values.
Overall, this study offers valuable insights for future researchers by enabling rapid screening and optimization of natural fiber–reinforced composite formulations. The combination of simulation tools and machine learning approaches supports the development of sustainable and cost-effective materials, contributing to a circular economy and promoting an environmentally friendly, cleaner future from a materials science perspective.
Author Contributions
Conceptualization, J.S. and M.M.R.; methodology, J.S.; software, J.S. and M.M.R.; validation, J.S., M.M.R., S.B.R., S.S. and G.V.; formal analysis, J.S., M.M.R., S.B.R., S.S. and G.V.; investigation, J.S., M.M.R., S.B.R., S.S. and G.V.; resources, J.S., M.M.R., S.B.R., S.S. and G.V.; data curation, J.S. and M.M.R.; writing—original draft preparation, J.S. and M.M.R.; writing—review and editing, J.S., M.M.R., S.B.R., S.S. and G.V.; supervision, G.V., S.B.R. and S.S.; project administration, S.S., S.B.R. and G.V. All authors have read and agreed to the published version of the manuscript.
Funding
This research received no external funding.
Data Availability Statement
All data have been shown in the paper.
Conflicts of Interest
The authors declare no conflicts of interest.
References
- Gonzalez-Gutierrez, J.; Cano, S.; Schuschnigg, S.; Kukla, C.; Sapkota, J.; Holzer, C. Additive Manufacturing of Metallic and Ceramic Components by the Material Extrusion of of Highly-Filled Polymers: A Review and Future Perspectives. Materials 2018, 11, 840. [Google Scholar] [CrossRef]
- Zwawi, M. A review on natural fiber bio-composites, surface modifications and applications. Molecules 2021, 26, 404. [Google Scholar] [CrossRef]
- Syduzzaman, M.; Al Faruque, M.A.; Bilisik, K.; Naebe, M. Plant-Based Natural Fibre Reinforced Composites: A Review on Fabrication, Properties and Applications. Coatings 2020, 10, 973. [Google Scholar] [CrossRef]
- Ahmed, U.; Tariq, A.; Nawab, Y.; Shaker, K.; Khaliq, Z.; Umair, M. Comparison of Mechanical Behavior of Biaxial, Unidirectional and Standard Woven Fabric Reinforced Composites. Fibers Polym. 2020, 21, 1308–1315. [Google Scholar] [CrossRef]
- Cai, R.; Jin, T. The effect of microstructure of unidirectional fibre-reinforced composites on mechanical properties under transverse loading: A review. J. Reinf. Plast. Compos. 2018, 37, 1360–1377. [Google Scholar] [CrossRef]
- Rayhan, S.B.; Rahman, M.M. Modeling elastic properties of unidirectional composite materials using ansys material designer. Procedia Struct. Integr. 2020, 28, 1892–1900. [Google Scholar] [CrossRef]
- Younes, R.; Hallal, A.; Chehade, F.; Fardoun, F. Comparative Review Study on Elastic Properties Modeling for Unidirectional Composite Materials. In Composites and Their Properties; INTECH Open Access: London, UK, 2012; pp. 391–408. [Google Scholar]
- Heidari-Rarani, M.; Bashandeh-Khodaei-Naeini, K.; Mirkhalaf, S.M. Micromechanical modeling of the mechanical behavior of unidirectional composites—A comparative study. J. Reinf. Plast. Compos. 2018, 37, 1051–1071. [Google Scholar] [CrossRef]
- Huang, Z.M. Micromechanical strength formulae of unidirectional composites. Mater. Lett. 1999, 40, 164–169. [Google Scholar] [CrossRef]
- Lee, C.; Hwang, W. Modified rule of mixtures for prediction of tensile strength of unidirectional fiber-reinforced composites. J. Mater. Sci. Lett. 1998, 17, 1601–1603. [Google Scholar] [CrossRef]
- Da Silva, L.J.; Panzera, T.H.; Christoforo, A.L.; Rubio, J.C.C.; Scarpa, F. Micromechanical analysis of hybrid composites reinforced with unidirectional natural fibres, silica microparticles and maleic anhydride. Mater. Res. 2012, 15, 1003–1012. [Google Scholar] [CrossRef]
- Zuo, Q.; Wang, C.; Pei, X.; Lin, L.; Li, Y.; Sun, W. Analysis and prediction of tensile properties based on rule of mixtures model for multi-scale ramie plain woven fabric reinforced composite. Compos. Struct. 2023, 311, 116785. [Google Scholar] [CrossRef]
- Tham, M.W.; Fazita, M.N.; Abdul Khalil, H.P.S.; Mahmud Zuhudi, N.Z.; Jaafar, M.; Rizal, S.; Haafiz, M.M. Tensile properties prediction of natural fibre composites using rule of mixtures: A review. J. Reinf. Plast. Compos. 2019, 38, 211–248. [Google Scholar] [CrossRef]
- Okereke, M.I.; Akpoyomare, A.I. A virtual framework for prediction of full-field elastic response of unidirectional composites. Comput. Mater. Sci. 2013, 70, 82–99. [Google Scholar] [CrossRef]
- Devireddy, S.B.R.; Biswas, S. Effect of Fiber Geometry and Representative Volume Element on Elastic and Thermal Properties of Unidirectional Fiber-Reinforced Composites. J. Compos. 2014, 2014, 629175. [Google Scholar] [CrossRef]
- Riaño, L.; Belec, L.; Joliff, Y. Validation of a Representative Volume Element for unidirectional fiber-reinforced composites: Case of a monotonic traction in its cross section. Compos. Struct. 2016, 154, 11–16. [Google Scholar] [CrossRef]
- Rayhan, S.B.; Rahman, M.M.; Sultana, J.; Varga, G. Predicting the Elastic Moduli of Unidirectional Composite Materials Using Deep Feed Forward Neural Network. J. Compos. Sci. 2025, 9, 278. [Google Scholar] [CrossRef]
- Mali, R.; Pise, U. Modeling elastic properties of biocomposites using various analytical models and ansys material designer. Mater. Today Proc. 2023, 72, 1372–1378. [Google Scholar] [CrossRef]
- Kaminsky, J.; Rodt, T.; Gharabaghi, A.; Forster, J.; Brand, G.; Samii, M. A universal algorithm for an improved finite element mesh generation: Mesh quality assessment in comparison to former automated mesh-generators and an analytic model. Med. Eng. Phys. 2005, 27, 383–394. [Google Scholar] [CrossRef]
- Marcé-Nogué, J.; Fortuny, J.; Gil, L.; Sánchez, M. Improving mesh generation in finite element analysis for functional morphology approaches. Span. J. Palentol. 2020, 30, 117–132. [Google Scholar] [CrossRef]
- Lie, S.T.; Lee, C.K.; Wong, S.M. Model and mesh generation of cracked tubular Y-joints. Eng. Fract. Mech. 2003, 70, 161–184. [Google Scholar] [CrossRef]
- Berladir, K.; Antosz, K.; Ivanov, V.; Mitaľová, Z. Machine Learning-Driven Prediction of Composite Materials Properties Based on Experimental Testing Data. Polymers 2025, 17, 694. [Google Scholar] [CrossRef] [PubMed]
- Kibrete, F.; Trzepieciński, T.; Gebremedhen, H.S.; Woldemichael, D.E. Artificial Intelligence in Predicting Mechanical Properties of Composite Materials. J. Compos. Sci. 2023, 7, 364. [Google Scholar] [CrossRef]
- Pathan, M.V.; Ponnusami, S.A.; Pathan, J.; Pitisongsawat, R.; Erice, B.; Petrinic, N.; Tagarielli, V.L. Predictions of the mechanical properties of unidirectional fibre composites by supervised machine learning. Sci. Rep. 2019, 9, 13964. [Google Scholar] [CrossRef] [PubMed]
- Chen, J.; Wan, L.; Ismail, Y.; Ye, J.; Yang, D. A micromechanics and machine learning coupled approach for failure prediction of unidirectional CFRP composites under triaxial loading: A preliminary study. Compos. Struct. 2021, 267, 113876. [Google Scholar] [CrossRef]
- Huang, H.; Hadigheh, S.A.; Aghabalaei Baghaei, K. Influences of fibre shape on the transverse modulus of unidirectional fibre reinforced composites using finite element and machine learning methods. Compos. Struct. 2023, 312, 116872. [Google Scholar] [CrossRef]
- Su, M.; Liu, L.; Xie, Y.; Peng, H.; Kang, C. Prediction of the elastic properties and strength of unidirectional carbon fiber reinforced polymers based on representative volume element simulation. Case Stud. Constr. Mater. 2025, 23, e04963. [Google Scholar] [CrossRef]
- Ding, X.; Gu, Z.; Hou, X.; Xia, M.; Ismail, Y.; Ye, J. Effects of defects on the transverse mechanical response of unidirectional fibre-reinforced polymers: DEM simulation and deep learning prediction. Compos. Struct. 2023, 321, 117301. [Google Scholar] [CrossRef]
- Wang, B.; Huang, K.; Guo, L. A two-stage deep learning framework for predicting crack patterns and mechanical properties of unidirectional composites with void defects. Compos. Sci. Technol. 2025, 271, 111357. [Google Scholar] [CrossRef]
- Akash, S.S.; Tiwari, S.; Bijudas, C.R.; Santhosh, B.; Sunil, P. Deep Learning Based Uncertainty Analysis on Elastic Properties of Unidirectional Composites. Procedia Struct. Integr. 2025, 71, 180–187. [Google Scholar] [CrossRef]
- Ghane, E.; Fagerström, M.; Mirkhalaf, S.M. A multiscale deep learning model for elastic properties of woven composites. Int. J. Solids Struct. 2023, 282, 112452. [Google Scholar] [CrossRef]
- Liang, Y.; Wei, X.; Peng, Y.; Wang, X.; Niu, X. A review on recent applications of machine learning in mechanical properties of composites. Polym. Compos. 2025, 46, 1939–1960. [Google Scholar] [CrossRef]
- Jagath Narayana, K.; Burela, R.G. Multi-scale modeling and simulation of natural fiber reinforced composites (Bio-composites). J. Phys. Conf. Ser. 2019, 1240, 012103. [Google Scholar] [CrossRef]
- Alhijazi, M.; Safaei, B.; Zeeshan, Q.; Asmael, M. Modeling and simulation of the elastic properties of natural fiber-reinforced thermosets. Polym. Compos. 2021, 42, 3508–3517. [Google Scholar] [CrossRef]
- Javanbakht, Z.; Hall, W.; Virk, A.S.; Summerscales, J.; Öchsner, A. Finite element analysis of natural fiber composites using a self-updating model. J. Compos. Mater. 2020, 54, 3275–3286. [Google Scholar] [CrossRef]
- Potluri, R.; Diwakar, V.; Venkatesh, K.; Srinivasa Reddy, B. Analytical Model Application for Prediction of Mechanical Properties of Natural Fiber Reinforced Composites. Mater. Today Proc. 2018, 5, 5809–5818. [Google Scholar] [CrossRef]
- Shivprateek, S.; Jain, S.C. Unidirectional RVE analysis and simulation of Natural Fiber Reinforced Composites. SSRN Electron. J. 2023. [Google Scholar] [CrossRef]
- Saigal, A.; Pochanard, P. The Application of a Representative Volume Element (RVE) Model for the Prediction of Rice Husk Particulate-Filled Polymer Composite Properties. Mater. Sci. Appl. 2019, 10, 78–103. [Google Scholar] [CrossRef]
- Rahman, M.M.; Sultana, J. Design and Optimization of Natural Fiber Reinforced Hybrid Composite RVE: A Finite Element Analysis. In Proceedings of the 2023 International Conference on Engineering, Science and Advanced Technology (ICESAT), Mosul, Iraq, 21–22 June 2023; pp. 204–209. [Google Scholar] [CrossRef]
- De Joardar, S.; Neog, A.; Parvez, S.; Kirtania, S.; Kashyap, S.; Banerjee, S. Micromechanics Based Finite Element Analysis of Effective Elastic Properties of Natural Fiber Reinforced Composites. J. Nat. Fibers 2022, 19, 15790–15807. [Google Scholar] [CrossRef]
- Xiong, X.; Hua, L.; Miao, M.; Shen, S.Z.; Li, X.; Wan, X.; Guo, W. Multi-scale constitutive modeling of natural fiber fabric reinforced composites. Compos. Part A Appl. Sci. Manuf. 2018, 115, 383–396. [Google Scholar] [CrossRef]
- Wang, N.; Li, Z.; Peng, Y.; Jiang, Z.; Li, H. Micro–Macro Coupling Study on the Mechanical Properties of Continuous Fiber-Reinforced Composites. Polymers 2024, 16, 2995. [Google Scholar] [CrossRef]
- Hope, T.M.H. Linear Regression; Academic Press: Cambridge, MA, USA, 2019. [Google Scholar] [CrossRef]
- Steven, J.; Rigatti, M.D.; Dbim, D. Random Forest. In Proceedings of the 2018 Second International Conference on Intelligent Computing and Control Systems (ICICCS), Madurai, India, 14–15 June 2018; IEEE: New York, NY, USA, 2019; pp. 587–588. Available online: https://easyai.tech/en/ai-definition/random-forest/ (accessed on 1 January 2020).
- Chicco, D.; Warrens, M.J.; Jurman, G. The coef fi cient of determination R-squared is more informative than SMAPE, MAE, MAPE, MSE and RMSE in regression analysis evaluation. PeerJ Comput. Sci. 2021, 7, e623. [Google Scholar] [CrossRef]


Disclaimer/Publisher’s Note: The statements, opinions and data contained in all publications are solely those of the individual author(s) and contributor(s) and not of MDPI and/or the editor(s). MDPI and/or the editor(s) disclaim responsibility for any injury to people or property resulting from any ideas, methods, instructions or products referred to in the content. |
© 2025 by the authors. Licensee MDPI, Basel, Switzerland. This article is an open access article distributed under the terms and conditions of the Creative Commons Attribution (CC BY) license (https://creativecommons.org/licenses/by/4.0/).