Article

Evaluating the Environmental Footprint of Steel-Based Bottle Closures: A Life Cycle Assessment Approach

by
Irini Spyrolari
,
Alexandra Alexandropoulou
*,
Eleni Didaskalou
and
Dimitrios Georgakellos
Department of Business Administration, University of Piraeus, 185 34 Pireas, Greece
*
Author to whom correspondence should be addressed.
J. Exp. Theor. Anal. 2025, 3(4), 35; https://doi.org/10.3390/jeta3040035
Submission received: 1 August 2025 / Revised: 12 September 2025 / Accepted: 10 October 2025 / Published: 7 November 2025

Abstract

This research presents a detailed Life Cycle Assessment (LCA) of 26 mm Crown cork metal closures used in glass bottle packaging, with the objective of quantifying and comparing their environmental impacts across all life cycle stages. This study adheres to ISO 14040 and ISO 14044 standards and utilizes Microsoft Excel for structuring and documenting input–output data across each phase. The LCA encompasses three primary stages: raw material production (covering iron ore extraction and steel manufacturing), manufacturing processes (including metal sheet printing, forming, and packaging of closures), and the transport phase (distribution to bottling facilities). During the Life Cycle Inventory (LCI), steel production emerged as the most environmentally burdensome phase. It accounted for the highest emissions of carbon dioxide (CO2), carbon monoxide (CO), nitrogen oxides (NOx), and sulphur oxides (SOx), while emissions of heavy metals and volatile organic compounds were found to be negligible. The Life Cycle Impact Assessment (LCIA) was carried out using the Eco-Indicator 99 methodology, which organizes emissions into impact categories related to human health, ecosystem quality, and resource depletion. Final weighting revealed that steel production is the dominant contributor to overall environmental impact, followed by the manufacturing stage. In contrast, transportation exhibited the lowest relative impact. The interpretation phase confirmed these findings and emphasized steel production as the critical stage for environmental optimization. This study highlights the potential for substantial environmental improvements through the adoption of low-emission steel production technologies, particularly Electric Arc Furnace (EAF) processes that incorporate high percentages of recycled steel. Implementing such technologies could reduce CO2 emissions by up to 68%, positioning steel production as a strategic focus for sustainability initiatives within the packaging sector.

1. Introduction

Packaging LCAs have largely concentrated on primary containers such as PET and glass bottles, with far fewer studies focusing on the component level (e.g., closures and liners). Comparative assessments often show that material choice, mass-per-functional-unit, and end-of-life (EoL) assumptions drive hotspots across climate change, particulate matter formation, acidification/eutrophication, human toxicity, and resource use. Within the EU policy context, the Environmental Footprint (EF) method and PEF Category Rules (PEFCR) for packaging promote harmonized category indicators and data quality requirements that facilitate comparability across systems [1,2]. More recent LCIA practice also favours ReCiPe 2016 midpoint/endpoint indicators to complement or replace legacy methods such as Eco-Indicator 99, broadening the coverage of toxicity and ecosystem impacts [3]. Steel decarbonization pathways—such as higher-scrap Electric Arc Furnace (EAF) routes, renewable electricity procurement, and process efficiency—have been documented to materially reduce the cradle-to-gate GHG intensity of steel components [4]. However, published closure-level LCAs remain sparse; inventories typically aggregate closures into broader ‘metal packaging’ groups, which obscures closure-specific hotspots such as liner and coating chemistries, printing/curing energy, and small-mass transport effects. This study addresses that gap by (i) establishing a closure-level system model consistent with ISO 14040/14044 [5,6]; (ii) reporting stage contributions (steel, manufacturing, transport) at the functional unit scale; and (iii) exploring the improvement potential of high-scrap EAF steel under transparent assumptions. Where possible, we align with EF/PEF guidance and discuss how ReCiPe 2016 complements EI99 to better contextualize toxicity and ecosystem categories [1,2,3,4,6].
In 2008, the Food and Agriculture Organization of the United Nations (FAO) issued an alarming forecast for global food and beverage production, predicting that if the world population reaches 9.1 billion by 2050, global food production will need to increase by 70% and almost double in developing countries [7]. The absolute environmental impacts of such a massive expansion of food systems will inevitably increase if current dietary trends and related production and supply chains remain unchanged [8].
The beverage industry is an important industrial sector that includes a variety of beverages, such as carbonated drinks, water, and juices. However, this sector is one of the largest consumers of packaging [9]. Packaging plays a fundamental role in the production and supply chain of food and beverages. In addition to informing and attracting end consumers, packaging protects and preserves the quality of food and beverages [10].
The global food packaging market was estimated at USD 363.8 billion in 2022 and is expected to reach USD 511.99 billion by 2028 [11]. The choice of packaging material has a significant impact on the overall beverage value chain. The environmental impact of beverage packaging depends on the characteristics of the bottle and is a fundamental question from an environmental analysis perspective [12].
Globally, due to widespread concern about marine plastic pollution, demand for glass packaging has increased significantly. Many consider glass packaging to be more sustainable than plastic or multi-layer packaging [13].
The manufacture of glass bottles requires significant amounts of heat and, therefore, fossil fuels, in addition to the need for water and chemicals during the washing process [9]. The use of plastic in packaging has both positive and negative impacts. The positive impact comes from the low weight of plastic, which reduces transport costs [14]. The negative impact is related to high production volumes, short service life (mainly single use), disposal and waste management problems [15]. In addition, plastic production contributes to greenhouse gas (GHG) emissions and will contribute further to the increase in these emissions in the coming years [16,17].
In terms of greenhouse gas emissions, four sectors—iron, steel, cement, and plastics—are responsible for 66% of global industrial CO2 emissions [18]. Annual global plastic production reached 367 million tons in 2020, compared to 1.5 million tons in 1950, the year of its discovery [19]. If this trend continues, plastic production is projected to be responsible for 1.22 billion tons of greenhouse gas emissions annually by 2030 [17]. In 2015, the plastics industry accounted for 4.5% of global greenhouse gas emissions [20], corresponding to 1.7 Gt of CO2 equivalent, and these emissions are projected to reach 6.5 Gt of CO2 equivalent by 2050 [21].
Europe produces nearly 30 million tons of plastic waste annually, and this amount is increasing. Food packaging waste accounts for nearly 60% of plastic waste [22]. The environmental problems associated with packaging waste have led to both regulations and research focusing on preventing the use of packaging [23]. Although there has been a steady increase in the volume of recycled and recovered waste in the European Union (EU) in recent years, the volume of packaging waste generated per citizen increased from 163.3 kg in 2007 to 169.7 kg per citizen in 2016 [22].
Furthermore, the European Commission (EC) paved the way for the establishment of the Product Environmental Footprint (PEF) as a multi-criteria measure of the environmental performance of a goods item or service throughout its life cycle [24]. One of the objectives of this initiative is to create PEF class rules for different product categories that perform the same function, which can be used in the Life Cycle Assessment (LCA) methodology for a more accurate calculation of environmental impacts [25].
Growing awareness of environmental issues related to production and consumption activities has gradually led companies to assess the environmental impacts of their product manufacturing, both for internal decision-making and external communication of their performance [26].
To mitigate these impacts, efforts to reduce the harmful environmental impacts of food production will be increasingly necessary. These include the use of methodologies such as the Life Cycle Assessment (LCA), which is commonly used by industry and the scientific community to assess the environmental impacts of food and beverage packaging [5]. Life Cycle Assessment (LCA) is one of the most recognized and widely used tools for assessing the environmental sustainability of a product and supporting decision-making and policymaking [27]. The Life Cycle Thinking (LCT) approach and the methods that support it, especially the Life Cycle Assessment (LCA), allow organizations to evaluate the environmental impacts of a product or process holistically throughout all stages of its life cycle [27].
Since its introduction, LCA has evolved from a specialized activity carried out by academics and a few pioneering companies to a widely used practice. This is because it is a functional tool for implementing European policies, such as the European Green Deal, and for achieving the United Nations Sustainable Development Goals (SDGs) [26].

Literature Review

Life-cycle assessment has become the standard approach to quantify packaging impacts across climate change, resource use, toxicity and other midpoint/endpoint indicators guided by the ISO standards 14040 and 14044 and, in Europe, by the Environmental Footprint (EF) framework and sector Product Environmental Footprint Category Rules (PEFCR) [6,28,29,30]. Within beverage systems, a large empirical base compares PET bottles, glass bottles, aluminum cans and cartons with results highly sensitive to system boundaries (cradle-to-gate vs. cradle-to-grave), regional electricity mixes, transport scales and End-of-Life (EoL) modelling choices [31,32,33,34,35,36,37,38]. Relevant meta-analyses and reviews emphasize that study design and allocation choices can dominate conclusions, underscoring the need to report assumptions transparently for reproducibility and policy relevance [32,33,34,39,40].
Across formats, comparative LCAs frequently find that material production and EoL fate dominate impacts. For example, aluminum can benefit strongly from closed-loop recycling, while single-use glass often performs worst on climate unless high reuse rates and short distribution loops [32,33,34,39,40] are achieved [33,34,35,36,37,38]. Several sector studies confirm these patterns and highlight geographical differences and data vintage effects. Carton systems can outperform reusable glass in some conditions, while PET often outperforms glass and, in some studies, aluminum at prevailing recycling levels for water or soft drinks [33,34,35,36,37,38,41,42,43]. Importantly, these comparisons depend on consistent Functional Unit (FU) definitions, bottle mass, fill volumes, transport and return logistics for reuse scenarios [32,33,34,35,36,37,38,41,43].
For metal packaging specifically, recent Europe-wide LCAs document that recycling credits for steel and aluminum substantially reduce net burdens relative to virgin production, with results hinging on how avoided burden is allocated and on realistic capture/sorting rates for small components in mixed packaging streams [30,31,32,33,34,35,36,37,38,39,44,45,46]. Method guidance for metals recommends attributing benefits primarily at EoL substitution rather than front-loading recycled content where scrap supply is constrained: an approach aligned with many policy tools and consistent with circular economy logic when quality is maintained [1,39,44]. Nonetheless, there remains a gap at the component level: while cans and rigid containers are well studied, closure-specific LCAs are scarce; available studies on caps/lids/panels indicate strong sensitivity to liner/coating chemistries, curing energy and small-mass logistics that are often averaged out in container-level inventories [31,37,46,47].
Decarbonizing steel is central to metal closures. Global assessments and industry datasets indicate that scrap-based Electric Arc Furnace (EAF) routes typically exhibit much lower cradle-to-cast GHG intensity than Blast Furnace–Basic Oxygen Furnace (BF-BOF) routes, with the magnitude depending on grid carbon intensity, scrap availability and alternative iron sources [29,30,48,49,50,51,52]. Sector tracking shows uneven progress: while EAF shares rise in some regions, new coal-based BF capacity elsewhere risks locking in emissions [49,50,51]. For component-scale LCAs, representing supplier route shares (EAF/BOF), regional electricity mixes, and scrap quality effects is critical to avoid biasing hotspot attribution to downstream steps [29,30,48,49,50,51].
Finally, data quality and transparency remain persistent challenges. Contemporary practice encourages triangulating EI99 results with ReCiPe 2016 and EF 3.x to contextualize findings across methods and to align with European comparability requirements—especially where study conclusions may inform product policy, eco design or recycled-content mandates [28,29,30,32,39].
The central research question of this study is: “What are the main environmental hot spots in the life cycle of 26 mm steel crown caps”? The answer to this question can be relative to a diverse group of stakeholders such as packaging manufacturers—to understand where the biggest environmental burden occurs and align strategies, beverage companies and brand owners—to discuss new sustainability reporting and packaging strategies, policymakers—to support policy regulations/eco-design standards/recycling targets, consumers and NGOs—to allow for transparency and awareness for more sustainable packaging solutions.

2. Materials and Methods

Growing awareness of environmental issues related to production and consumption activities has gradually led companies to assess the environmental impact of their products, both for internal decision-making and for external communication of their performance [26].
To mitigate these impacts, efforts to reduce the harmful environmental impacts of food production will be increasingly necessary. These include the use of methodologies such as Life Cycle Assessment (LCA), which is commonly used by industry and the scientific community to assess the environmental impacts of food and beverage packaging [22].

2.1. Life Cycle Analysis

Life Cycle Assessment (LCA) is one of the most recognized and widely used tools for assessing the environmental sustainability of a product and supporting decision-making and policymaking [1]. The Life Cycle Thinking (LCT) approach and the methods that support it, especially Life Cycle Assessment (LCA), allow organizations to evaluate the environmental impacts of a product or process holistically throughout all stages of its life cycle [27].
Life Cycle Assessment (LCA) is a comprehensive method that aims to record and evaluate all inputs and outputs of a product system from the beginning to the end of its life cycle, with the aim of assessing its potential environmental impacts [27,52]. According to the US Environmental Protection Agency, LCA is used to assess the potential environmental impacts of a product, material, process or activity [53] and is now emerging as a powerful tool to this end. The method involves assessing the total energy consumed and waste generated at all stages of a product or service’s life cycle [54]. LCA considers both environmental impacts and resource use from raw material extraction and production to use and disposal (Figure 1). This allows us to comprehend how changes in one part of the life cycle affect the rest [55].
Compared to carbon footprint calculation, LCA assesses broader environmental impacts across multiple categories, providing a more comprehensive picture of the environmental performance of a product or system [56].
To maintain data quality and present results, the product life cycle is divided into three stages (models):
  • Upstream processes—Initial processes from resource extraction (“cradle”) to the factory gate (“gate”) before being transferred to the consumer (“cradle to gate”).
  • Core processes—Main processes from gate to gate (“gate to gate”).
  • Downstream processes—Final processes from the factory gate to the use and disposal phase (“grave”) (“gate to grave”) [57].

2.2. Crown Cork Metal Caps—Production and Characteristics

Lids are used to seal containers. They can be reusable or disposable. The inside of the lids is covered with a plastic liner, which must be flexible enough to achieve the desired tightness, while its raw materials must have minimal migration into the product. In some cases, both the inner coating and the plastic insert come into contact with the food. In some cases, only the plastic insert comes into contact with the food [58].
The categories of closures are as follows:
  • Crown caps;
  • Vacuum lug closures;
  • Aluminum bottle caps.
Caps for glass containers are usually metal or plastic, although cork is still widely used for wines and spirits. All caps are applied to the part of the container called the “finish”. It may sound like a strange name for the part of the container that is formed first, but the name comes from the days when glass containers were made by hand using a blowpipe—at that time, the rim of the container was the last part to be formed, and so it was called the ‘finish’. The ‘finish’ is determined by four basic dimensions. There are standardized specifications for these dimensions throughout the industry.
Choosing the right glass mouth for each type of cap is crucial. If it is too large, leakage may occur due to internal pressure exerted on it, either from gases contained in the product or from increased pressure during heat treatment. Conversely, if the stopper is too small, it may cause application and sealing problems [59].
The 26 mm diameter metal caps consist of a metal shell (usually steel) with a corrugated rim and an inner rubber gasket (plastic). They are mainly used on glass bottles with an external mouth diameter of 25.4 mm. The caps are secured by placing them on the rim of the bottle and applying pressure using a special sealing mechanism to ensure that the contents are completely sealed. Metal crown caps are used to seal glass beverage bottles, such as beer and soft drinks, ensuring an airtight seal and preventing the loss of carbon dioxide in carbonated beverages, such as mineral water and beer [58].
The 26 mm metal caps are available in two basic types:
  • Pry off: Can only be opened with a cap opener.
  • Twist off: Can be opened by twisting while applying slight pressure with the hand.
The most common variants of these caps are profiles 916 (pry off) and 917 (twist off). The main difference between them lies in the shape of the plastic liner profile. There may be one or two sealing rings around the perimeter of the plastic liner of the cap.
  • Pry off: With two sealing rings, which offer better tightness as they come into contact with both the inside and outside of the bottle neck.
  • Twist off: With one sealing ring.
  • In the case of the double ring, the gasket comes into contact with both the inside and outside of the bottle neck [60].
The 26 mm crown caps are manufactured in accordance with industry standards, specifically [61].
Standard crown caps have 21 ribs and an outer diameter of 32.1 mm, an inner diameter of 26.75 mm and a height of 6.0 mm. The most common crown cap has twenty-one ‘teeth’. The advantage of having a single number of teeth is that they are not directly opposite each other, which reduces the likelihood of them tilting during transport in conveyor systems on beverage bottling production lines. The standard liner is PVC-free or PVC and must maintain the pressure inside the bottle until it is opened, preventing gas exchange with the atmosphere [62]. The plastic gasket is the only part of the cap that comes into direct contact with the bottled product. Before being formed into a cap, the material is coated with special varnishes, which vary depending on the surface. The outer surface mainly serves as a base for printing the product design, and the inner surface comes into contact with the inner plastic liner [63].
The main materials used in the production process are as follows:
  • Processed steel.
  • Internal varnish for improved impermeability.
  • Varnish substrate on the outer surface for better paint adhesion.
  • Inks on the outer surface.
  • Outer varnish for protection and durability.
  • Plastic gasket on the inner side for waterproofing
The production of 26 mm diameter metal caps follows a similar process in all industrial plants, with minor variations depending on their production capacity. This process involves many stages, the most important of which are printing the designs and adding the plastic to the inside of the cap.
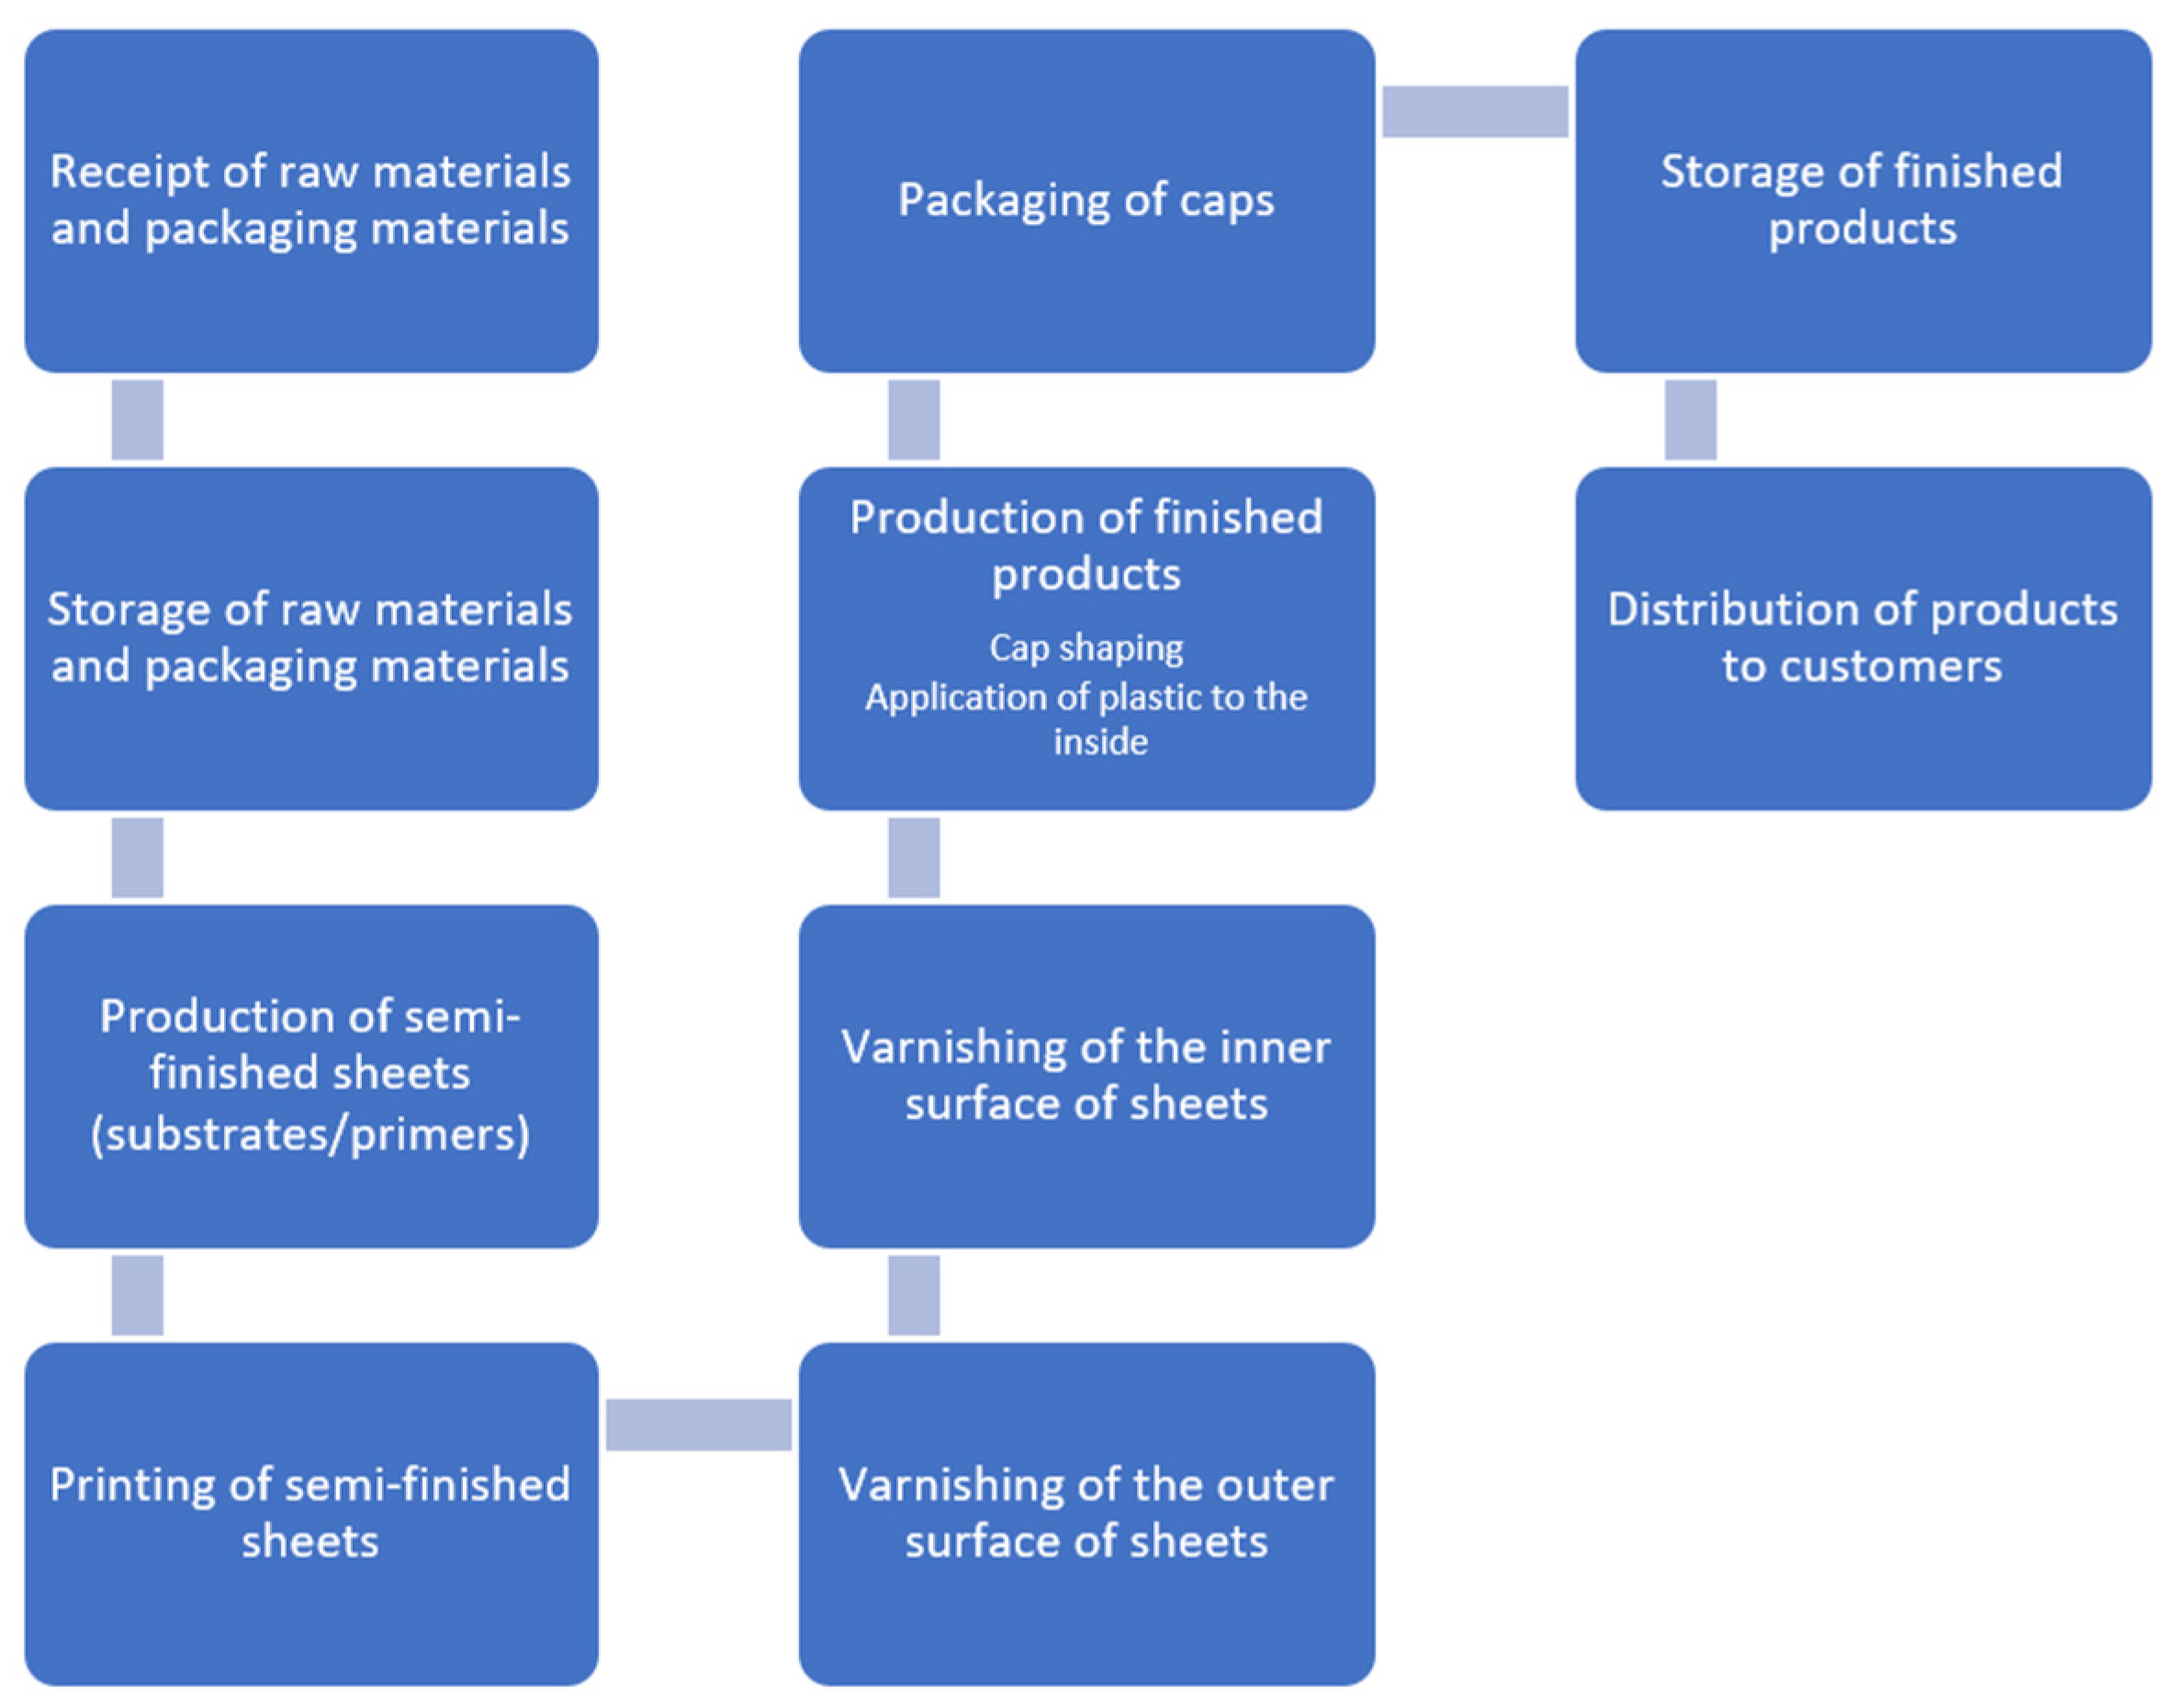
A typical production line is structured into four main areas, which include the following stages (Figure 2):
A. Raw Materials and Packaging Materials Receiving and Storage
  • Receipt of raw materials and packaging materials.
  • Storage of raw materials and packaging materials.
B. Lithography
3.
Production of semi-finished sheets (substrates/primers).
4.
Printing of semi-finished sheets.
5.
Varnishing of the outer surface of sheets.
6.
Varnishing of the inner surface of sheets.
C. Metal Cap Production
7.
Production of finished products.
7a Cap shaping.
7b. Application of plastic to the inside.
8.
Packaging of caps.
D. Storage and Shipping of Finished Products
9.
Storage of finished products.
10.
Distribution of products to customers.

2.3. Crown Cork Metal Caps Life Cycle Assessment Methodology

A significant number of LCA studies have been conducted internationally by specialized researchers, covering various sectors and materials. Many of these studies focus on the entire life cycle of products, from production to final disposal, contributing to the understanding and promotion of sustainable development. When reviewing the existing literature on life cycle assessment of metal closures and food packaging in general, the literature includes previous studies in the field of packaging, such as the life cycle assessment of PET bottles, and a small number of studies on caps.
In the field of food packaging, Agarski et al. [62] examined the life cycle assessment of multi-component plastic caps, while Donahue et al. [63] analyzed the life cycle of reusable and single-use surgical caps.
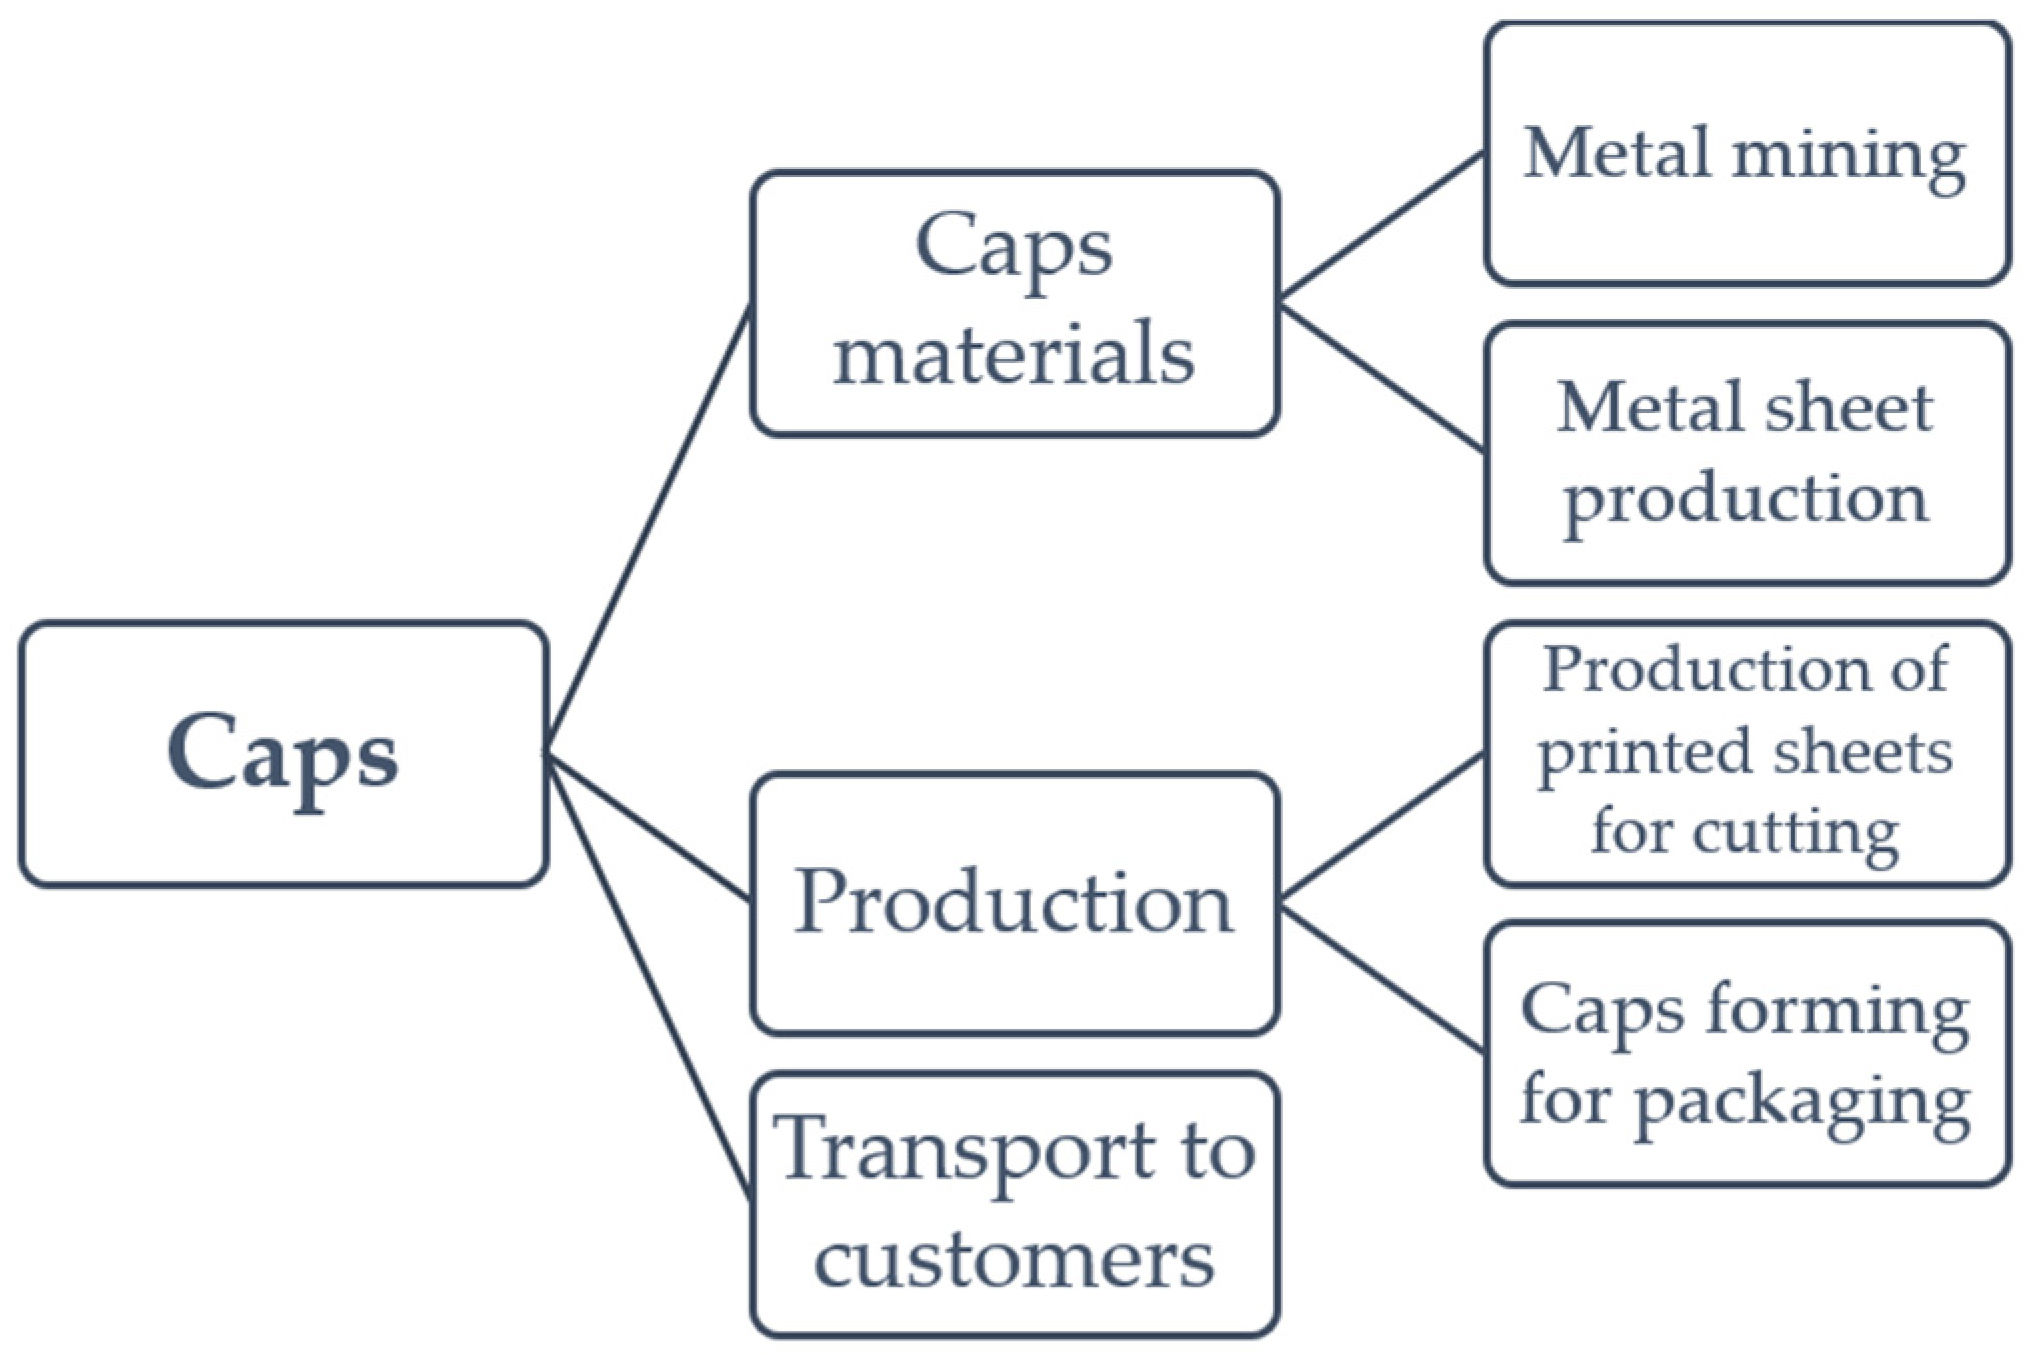
The present study is implemented following the Life Cycle Assessment (LCA) framework. In this context, the environmental impacts arise from the production of raw materials (including the extraction of raw materials), the production process of the caps and the transport of the final packaged caps to the customer (bottling companies for soft drinks, beverages, etc.).

2.3.1. Objectives and Research Questions

The aim of this study is to investigate pollutant emissions at each stage of the life cycle of steel crown corks, to determine the overall environmental impact at each stage and to examine which processes contribute most to environmental impacts and how areas for further optimization can be identified in future research.

2.3.2. Assumptions of the Study and Input Data

  • Given the complexity of the manufacture of seals, some elements of this study are based on data and parameters drawn from the literature and studies related to steel production.
  • Furthermore, due to the lack of data on the production of raw materials, only steel, which is the main component of the plugs, accounting for approximately 90%, has been analyzed.
  • The transport of the final products is assumed to take place within Greece.
Data were obtained from a Greek company specialized in the production of steel crown corks, which is a major producer on a European-wide scale.

3. Results

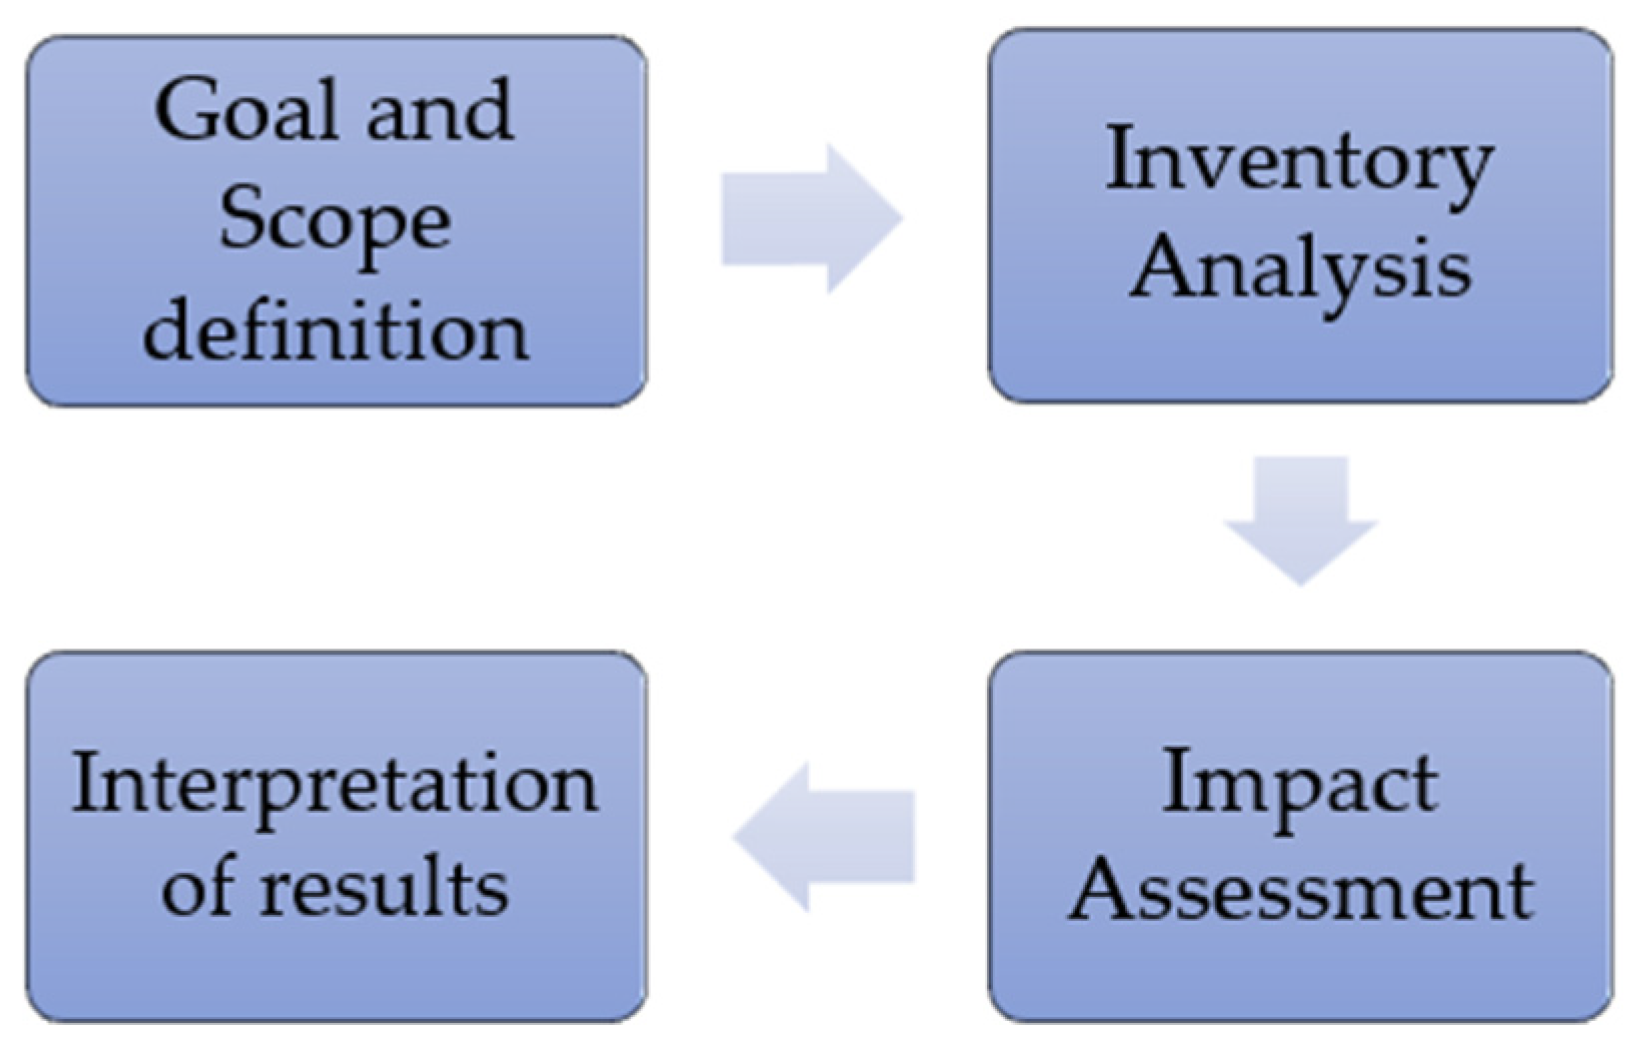
The results of this study are being presented below using the four different steps of an LCA analysis (Figure 3).

3.1. Scope

This LCA study of 26 mm diameter crown cork metal closures focuses on assessing the environmental impacts arising from the production of a specific number of closures, as well as on the comprehensive analysis of the life cycle of the materials used to produce the caps, covering the entire supply chain. The process begins with the extraction of raw materials and ends either in landfills or in recycling plants for the recovery of steel through thermal treatment. The final disposal stage of the caps will not be examined due to the limited availability of information.
The Functional Unit (FU), for the purpose of this study, has been defined as 1.000 compliant 26 mm steel crown caps delivered to the bottler in accordance with EN17177 performance (quality and sealing) requirements. A reject rate of 2–5% at forming/lining is included in the mass and energy balances to ensure that the FU always represents 1.000 usable closures.
Particular emphasis is placed on studying the interaction of the system under consideration with the environment, focusing on energy and raw material inputs, as well as outputs that entail environmental impacts.
The study provides critical information that facilitates informed decision-making, either at the level of specific applications or at individual stages of a product’s life cycle. In the context of this research, an analysis of the environmental impacts associated with the life cycle stages of corks is carried out through the application of the LCA tool, with the aim of calculating pollutant emissions and overall impacts [64].
An additional objective of the study is to identify the processes that contribute significantly to pollutant emissions and highlight those that require optimization in the future [60]. The basic technical characteristics of the plug-ins to be studied are presented in Table 1 with a specified lifetime of one year.
The functional unit is the basic reference point around which an LCA study is structured. In this analysis, the functional unit is defined as 10,000 caps with a diameter of 26 mm and a total weight of 20 kg or 0.02 t. The caps examined are made of 0.21 mm thick metal and have up to two colours printed on their outer surface.
The collection of life cycle inventory (LCI) data and the assessment of environmental impacts are based on this unit, ensuring that all results refer accurately to the specific product quantity [35].
The system boundaries are defined in the diagram below (Figure 4), which shows the processes involved in the LCA of the waste to be examined.

3.1.1. A. Raw Materials and Packaging Materials Receiving and Storage

The production process for metal caps begins with the receipt and storage of raw materials and packaging materials. Steel sheets, which are the basic raw material (dimensions 1038 mm × 894 mm and thickness 0.18, 0.20, 0.21 or 0.22 mm), which are divided into two types: ETP (Electrolytic Tinplate) and TFS (Tin Free Steel), are received and initially inspected visually for any damage to the packaging, incomplete labelling or unsuitable pallets. Six categories of plastic materials are examined, including PVC Free and PVC Twist Off in different variants and, finally, the remaining raw materials, such as varnishes, paints and packaging materials (cardboard boxes, bags and pallets), which are checked for condition and characteristics, with spot checks focusing mainly on pre-use.

3.1.2. Lithography

The lithography sector includes the processing stages related to the production of semi-finished metal sheets, the printing of designs on them and the application of protective varnishes to both their external and internal surfaces. The production infrastructure includes three printing machines and one varnishing machine. One varnishing machine and two printing machines use natural gas as a fuel, while one printing machine is powered by electricity.
In lithography, the first stage of processing is the production of semi-finished sheets, where a substrate is applied to the metal sheets according to the customer’s requirements. There are three types of substrates: white lacquer, transparent substrate and aluminum substrate. The quality control department checks both the characteristics of the raw materials and the substrate, as well as the quality of the application, the oven temperature and the correct operation of the machines.
The semi-finished sheets are then sent for printing. The factory has three printing machines: two that use conventional inks and one with UV inks that prints two colours simultaneously. After printing, the sheets undergo external varnishing, where varnish is applied to the surface of the print to protect it and prevent metal oxidation.
This is followed by the internal varnishing of the sheets, where PVC or PVC-free varnishes are used depending on the customer’s specifications.
At the end of the process, all sheets that have completed printing and varnishing are marked appropriately and transferred to production for the next stage. To produce the seals, one layer of substrate, one layer of internal varnish and one layer of external varnish are used. There are 1–5 colour options, which make up less than 1% of the seal components. The quantities of varnishes required for the calculations were taken from the technical specifications of the varnish suppliers.

3.1.3. Metal Cap Production

  • Seal formation
The production of the final product, i.e., the formation of the seals, takes place in two basic stages. First, the sheets are cut, and then the plastic is applied to the inner side of the seals. The factory has seven production lines, which are powered by electricity. Sheets that have been internally coated with PVC-free varnish are processed on lines PMC–PTC 1-7, while those coated with PVC are sent exclusively to line PMC–PTC 5. All lines produce pry-off caps (916), with the exception of line PMC–PTC 5, which can also produce twist-off caps (917).
  • Sheet cutting and shaping
The caps are cut and shaped using special presses. The sheets are fed into the presses, where the caps are formed using suitable moulds. Each sheet measuring 894 × 1038 mm produces 729 caps, with each press stroke yielding 27 caps. Therefore, 27 consecutive presses are required to completely process a sheet. To produce 10,000 caps, as defined by the operating unit, 14 sheets are required. With each sheet weighing 1.53 kg, the total weight of the sheets is 21.42 kg. 13% of the sheet ends up as waste for recycling.
  • Application and bonding of plastic
After moulding, the caps pass through the “mill”, where unwanted bodies are removed, and are conveyed by conveyor belts to the filling machines for the application and bonding of the plastic to their inner side. The plastic is initially fed in a thick form into each cap and then, as the cap passes through the plastic moulding and cooling nozzles, the plastic takes its final shape. Each filling machine has 24 or 36 moulds, depending on the production line. The 10,000 caps weigh 20 kg, with each cap weighing approximately 2 g.
After gluing, the caps are checked on both sides, and the outer and inner surfaces are evaluated by inspection cameras. Next, the caps that meet the specifications are counted and pass through a gradual cooling chamber to reduce their temperature before being packed in cardboard boxes with plastic bags with a capacity of 10,000–11,000 pieces per box. The 10,000 caps are packed in a carton weighing 0.07 kg. In total, the caps and their packaging weigh 20.07 kg.
  • Packaging
The cartons are transported via an automated line to the labelling station. There, a label is affixed with basic product information, such as the customer’s name, the product name, the production line, the LOT number, the production date and the corresponding barcode. The cartons are then transported via an automated packaging line to the palletizer, where they are stacked on wooden pallets, with each pallet containing up to 50 cartons.
A large label with the corresponding product identification details is affixed to each pallet. The pallet is completely covered with stretch film, and protective plastic is placed on top to ensure the integrity of the final product during transport and storage.

3.1.4. Storage and Shipping of Finished Products

The pallets with the final products are picked up from the palletizer exit point and moved to pre-set spots in the final product storage area.
The quality control department checks the integrity of the finished products and the condition of the storage area, focusing on cleanliness, organization and the suitability of environmental conditions such as temperature and humidity.
During the distribution process, the warehouse manager loads the transport vehicles with the pallets of finished products.
In order to limit the complexity of the analysis, this study adopts certain exceptions. Although ideally a complete LCA would include all stages and all relevant processes, practical constraints make it necessary to focus on the most important components.
Specifically, the following have been excluded:
  • The environmental impacts of the construction of factories and production equipment;
  • The impacts of the construction and operation of means of transport;
  • Human resource activities during production;
  • Production equipment is used during the processing of raw materials, as in the case of the production of cork.
In addition, the production of raw materials that account for less than 10% of the total mass, such as inks, varnishes and plastic, have an environmental impact that is considered negligible compared to steel, which accounts for 90% of the composition of caps. The printing of three or more colours on caps that account for less than 1% of the caps’ composition during the production process is also ignored.
This practice is widely accepted in the literature, as the effort to incorporate these minor parameters would disproportionately increase the difficulty and scope of the analysis without substantially improving the accuracy of the results.

3.2. Inventory Analysis

For the LCI phase, the following raw steel source and logistics assumptions have been made: unless specified by the supplier, steel sheets are modelled as EU-average production with a blended route split (BOF/EAF) and transported to the plant by truck over an average distance of 300 km. Non-steel materials included explicitly in the LCI comprise liner, inner and outer varnishes, primer/substrate and inks. Mass-per-cap values are based on supplier datasheets and plant records (g/cap) and are included to improve coverage of toxicity/resource categories.

3.2.1. Inputs

A. Steel Production Phase
The steel production process begins with the extraction of iron ore and continues with further processing for use either in the form of sintered ore or pellets. Metallurgical coke, which comes from coal, serves both as a fuel and as a reducing agent in the blast furnace process, converting the ore into pig iron. The pig iron is then sent to a basic oxygen furnace (BOF), an electric arc furnace (EAF) or an old-style open-hearth furnace (OHF), where the final steel is produced [4].
Carbon dioxide (CO2) emissions
Emissions from the extraction and conversion of iron ore into pellets are estimated at 0.124 tonnes of CO2e/t of ore [61]. Carbon dioxide emissions from the iron and steel industry were calculated based on the IPCC Guidelines for National Greenhouse Gas Inventories [65]. For the CO2 emission factors, the IPCC Guidelines have been used. To determine CO2 emissions, an emission factor of 0.56 t CO2/t coke was used. Similarly, for sinter production units, the average emission factor was determined to be 0.2 t CO2/t of sintered ore. For pig iron production, it was calculated that CO2 emissions from the combustion of blast furnace gases range between 400 and 900 kg CO2/t, with an additional 300–700 kg CO/t of pig iron, which is estimated to be completely oxidized to CO2 within the plant. This leads to a final emission factor of 1.35 t CO2/t pig iron. To calculate emissions during steel production, the global average factor (65% BOF, 30% EAF, 5% OHF) is used in tonnes of CO2 per tonne of steel produced. The factor is based on international data from 2003, according to which BOF (Basic Oxygen Furnace) blast furnaces accounted for approximately 63% of global steel production, Electric Arc Furnaces (EAF) accounted for 33%, while old Open-Hearth Furnaces (OHF) accounted for the remaining 4%, a percentage that is declining. The emission factor for steel production via EAF does not include emissions from iron production, while the factors for BOF and OHF methods include the corresponding emissions from the use of blast furnaces for iron production. To convert these individual stages into final steel production, the following conversion factors were used:
  • 0.94 t pig iron/t steel;
  • 0.358 t coke/t pig iron and;
  • 1.16 t sinter/t pig iron.
These factors allow the emissions from the individual stages of the production process to be reduced to the final steel product [4].
Methane (CH4) emissions
The emission factors for methane resulting from the production of coke and sinter were taken from the IPCC Guidelines. According to data from European plants, average CH4 emissions from coke production are 0.1 g CH4 per tonne of coke and 0.07 kg CH4/tonne of sinter [4].
Nitrous oxide (N2O) emissions
Recent studies indicate that CH4 and N2O may contribute up to 5% of CO2 emissions. However, estimates of N2O emissions are characterized by significant uncertainty, so no specific methodology is provided for the iron and steel industry [4].
NOx, SOx, CO emissions
Emissions of pollutants such as NOx, SOx and CO are mainly considered to be combustion products and were taken from the Guidance Document on the Inventory of Air Pollutants from Combustion in Industry and Construction for category 1.A.2.a of the iron and steel manufacturing industry. These factors are default (Tier 2) and cover sinter and cowper units (air reheating for blast furnaces) [66].
Emissions of other pollutants
The emission factors for suspended particulate matter (TSP, PM10, PM2.5) during iron ore mining were taken from Table 3-1 of 2.A.5.a Guidance on the reporting of air pollutant emissions from quarrying and mining of minerals other than coal [66].
Assuming that all production processes (sinter production, pig iron production, final steel production) take place within the same integrated facility, the emission factors for NMVOC, total suspended particulate matter (TSP), PM10 and PM2.5, heavy metals, organic pollutants and the total of four polycyclic aromatic hydrocarbons (PAHs) were taken from the Air Pollutant Emission Reference Guide for Iron and Steel Production [66]. Emissions of PCDD/F and BC (Black Carbon) were not taken into account due to their low environmental impact.
The total emission factors for steel production are listed in Table A1 in Appendix A.
Pollutant emissions for the production of steel raw materials were calculated using the average-data method of the GHG Protocol Scope 3 Emission Calculation Methodology [67]. In this study, a total of 21.42 kg of steel was required to produce 10,000 caps.
Emissions from steel production were calculated using the following equation, listed in category 1 of the GHG Protocol.
B. Manufacturing Phase—Metal Sheet Printing Process
To calculate gas and pollutant emissions from natural gas combustion, the emission factor for carbon dioxide (CO2) was taken from the data in Greece’s National Inventory Report [68]. For the remaining greenhouse gases, namely methane (CH4) and nitrous oxide (N2O), the values were taken from the coefficients for calculating greenhouse gas emissions in the National Climate Law [68].
For the remaining pollutants, the emission factors were taken from the Guide to the Recording of Air Pollutant Emissions for Small Combustion Plants [66]. Heavy metal pollutants have not been taken into account due to their low emission factor.
The total emission factors for natural gas consumption are listed in Table A2 in Appendix A.
The methodology for calculating emissions from natural gas combustion for metal sheet printing was based on the Usage Guidelines for Calculating Greenhouse Gas Emissions in accordance with ISO 14064-1:2018 [69] published in 2023 for the calculation of GHG emissions under the National Climate Law [68].
The results refer to the total surface area of 14 steel sheets, weighing a total of 21.42 kg, required for the production of 10,000 caps. For the purposes of the calculation, it was assumed that each steel sheet underwent four coatings: internal varnishing, external varnishing, substrate coating (primer) and application of one colour. The data shows that energy consumption per m2 is approximately 0.0006 GJ/m2.
C. Manufacturing phase—Metal cap forming and packaging process
During the manufacturing phase, the process of shaping and packaging the plugs is examined. The energy consumed during the process is electricity.
CO2 emissions from electricity consumption were based on the official CO2 emission factor from the data of the National Inventory Report of Greece [68].
For CH4 and N2O, the factors were derived by processing the available data from the National Inventory Report (NIR) for 2021, and their use was based on the assumption that the relevant uncertainty is negligible.
The coefficients for NOx, SOx, CO, NMVOC and PM pollutants were taken from SimaPro.
The total emission factors for electricity consumption are listed in Table A3 in Appendix A. The calculation of emissions from electricity consumption for the production and packaging of 10,000 final caps with a total weight of 20 kg was carried out in accordance with the standard method for recording and reporting emissions under the GHG Protocol [70].
In terms of energy consumption, according to data from the production process of the plugs, the formation of 1 kg of plugs requires approximately 0.14 kWh. Multiplying this value by the total weight of 10,000 plugs (20 kg) gives a total energy consumption of 2.7 kWh.
D. Transport phase of metal caps
During this phase, the transport of the seals within Greek territory is being examined. Transport will be carried out using heavy goods vehicles (22–23 tonnes, diesel-powered).
In accordance with the guidelines of the Inventory of Air Emissions from Road Transport, emission factors for heavy-duty trucks are given in g/kg of fuel [66]. The emission factors according to the Tier 1 methodology were used for the calculation.
The emission factor for methane was taken from the factors for calculating greenhouse gas emissions in the National Climate Law [68]. To convert the methane (CH4) emission factor from units of kg CH4/TJ to g CH4/kg of fuel, the Lower Calorific Value (NCV) of diesel fuel was used, which is 0.043 TJ/t, resulting in average emissions of 0.16 g of methane for each kg of diesel consumed.
The total emission factors for crown cork transportation are listed in Table A4 in Appendix A.
For transport emissions of final products, data on fuel consumption for road transport were used in accordance with the category 9 method—Transport and distribution after sale of the technical guidance for calculating Scope 3 emissions [67].
The calculation was based on the method using the amount of fuel (in kg) multiplied by the corresponding emission factor (kg CO2/kg). Fuel consumption for heavy-duty commercial vehicles of 22–23 tonnes is 30 L/100 km, which corresponds to 25 kg, based on the average density of diesel of 0.8325 kg/L [66]. This way, kilometres (km) were converted into litres (L), and then litres into kilograms (kg) of fuel.
Once the fuel consumption has been calculated, the total emissions of each pollutant are obtained by simple multiplication, separately for each pollutant. The oil consumption for transporting 10,000 caps was calculated at 0.12 kg, which is an average value derived from the total kilometres travelled to transport all steel caps within Greece.

3.2.2. Outputs

A. Steel Production Phase
In the steel production phase, which requires 21.45 kg of steel, there is a marked difference between the quantities of pollutants emitted. CO2 emissions are the highest at 53,550 g, exceeding all other pollutants and dominating total emissions. This is followed by CO emissions at 421 g, while NOx (13.8 g) and NMVOC (3.2 g) emissions are also noteworthy, which are recorded at significantly higher levels than other pollutants in steel production. SOx (11.6 g) and NMVOC (3.2 g) emissions, which are recorded at significantly higher levels than other steel production pollutants.
The concentration of suspended particles is also significant, with 9.5 g TSP, 5.4 g PM10 and 3.1 g PM2.5. The remaining pollutants occur in smaller quantities with 1.64 g CH4 and very low levels of heavy metals such as Pb, Cr (0.1 g) and Zn (0.09 g), as well as traces of Cd, Hg, As, Cu, Ni and Se. The organic pollutants PCB, PAHs and HCB appear in extremely low values, below 0.01 g.
B. Manufacturing Phase—Metal Sheet Printing Process
During the printing phase, which is based on natural gas combustion, CO2 emissions are highest, at 1773 g for printing the sheets, and dominate the total printing load. NOx emissions (2.4 g), CO (0.9 g) and NMVOC (0.7 g) follow at much lower levels. CH4 and N2O emissions remain at much lower levels, at 0.03 g and 0.003 g, respectively, with N2O being the pollutant with the lowest value in this phase. SOx emissions are limited (0.02 g) and are at the same level as particulate emissions (PM10, PM2.5 and TSP), which are also recorded at 0.02 g for each category.
Overall, the distribution of pollutants in the printing phase shows a high concentration of gaseous pollutants related to natural gas combustion, while the remaining pollutants are minor in size.
C. Manufacturing phase—Metal cap forming and packaging process
During the manufacturing and packaging phase, the largest number of emissions is CO2, with 1009 g. The second largest pollutant is SOx, with 6.1 g. CO and NOx emissions are more limited, at 0.8 g and 0.3 g, respectively, while NMVOCs appear at the same level as NOx (0.3 g).
Particulate matter (PM) emissions amount to 0.6 g, placing this pollutant also higher than the smaller-scale pollutants. The values for CH4 (0.02 g) and N2O (0.007 g) are the lowest.
D. Transport phase of metal caps
During transport, the largest number of emissions is CO2 with 372 g, followed by NOx with 3.0 g, which are the highest emissions after CO2. The remaining pollutants occur at much lower levels: CO reaches 0.7 g, while NMVOC and particulate matter (PM) are recorded at 0.1 g.
CH4 (0.020 g) and N2O (0.010 g) emissions are low, while NH3 emissions are even lower, at 0.002 g. Pb and SO2 are recorded as the pollutants with the lowest impact, with quantities of 0.0001 g and 0.00004 g, respectively.

3.3. Impact Assessment

3.3.1. Introduction to the Eco-Indicator 99 Methodology

The allocation of emissions to the individual categories of intermediate impacts was carried out in accordance with the Eco-Indicator 99 method, which is one of the most widely used impact assessment tools in the context of Life Cycle Assessment.
The Eco-Indicator 99 methodology is based on a structured three-step approach, which can be summarized as follows:
  • Input and Output Accounting: A complete record is made of all emissions, natural resource consumption and land use associated with the entire life cycle of the product under study. This stage forms the basis of every Life Cycle Assessment.
  • Environmental Impact Assessment: The Eco-Indicator 99 method groups environmental impacts into three basic categories of damage. The environmental impacts resulting from the data obtained in the previous stage are classified and quantified in the following categories:
    • Effects on human health (Human Health): The impact on human lives is assessed using the DALY (Disability Adjusted Life Years) indicator, which expresses the total number of years of life lost due to disability or premature death from exposure to toxic substances or other environmental burdens. The calculation is based on the number of years of disability, adjusted by a severity coefficient (0 for full health, 1 for death).
    • Degradation of ecosystem quality (Ecosystem Quality): The degradation of natural ecosystems is expressed as the potential extinction of species (plants, animals, insects, etc.) due to environmental impacts. The unit of measurement is PDF·m2·year (Potentially Disappeared Fraction), which indicates the percentage of species threatened with extinction per unit of area and period.
    • Consumption of natural resources (Resources): The impact in this category relates to the additional energy required to extract raw materials, such as metals and fossil fuels. It is expressed in MJ and reflects the difficulty of accessing resources due to depletion.
  • Weighting and Integration of Impacts: The three impact categories above are weighted according to their relative importance in order to derive a consolidated environmental indicator that allows for comparative assessment between different products or scenarios [66].
Table A5 in Appendix A summarizes the impact of emissions on human health using the Eco-Indicator 99 method.
Emissions were initially allocated to the individual intermediate impact categories selected based on the Eco-Indicator 99 methodology, which are as follows:
  • Impact of Carcinogenic Substances;
  • Impact of Climate Change;
  • Impact of Respirable Substances (inorganic);
  • Impact of Respirable Substances (organic);
  • Impact of Acidification/Eutrophication;
  • Impact of Toxic Emissions on the Ecosystem;
  • Impact of additional energy needed to extract minerals in the future.

3.3.2. Classification

The substances contributing to each impact category are then placed in the impact categories for which impact factors were available based on the Eco-Indicator 99 method:
  • Impact of Carcinogenic Substances: As, Cd, HCB, Ni, PCB, Total 4 PAHs;
  • Impact of Climate Change: CH4, CO2, N2O;
  • Impact of Respirable Substances (inorganic): CO, NH3, NOx, PM10, PM2.5, SOx, TSP;
  • Impact of Respirable Substances (organic): CH4, NMVOC;
  • Impact of Acidification/Eutrophication: NH3, NOx, SOx;
  • Impact of toxic emissions on the ecosystem: As, Cd, Cr, Cu, HCB, Hg, Ni, Pb, PCB, Total 4 PAHs, Zn;
  • Impact of the additional energy needed to extract minerals in the future: Amount of iron extracted.

3.3.3. Characterization

The process involves the quantitative determination of environmental damage.
The impact was calculated using the following general formula:
Impact = Emission Quantity × Characterization Coefficient

3.3.4. Emissions’ Impact on Human Health

The first column of Table A5 lists the total quantities of emissions for which impact factors were available based on the Eco-Indicator 99 method, while the third column lists the corresponding characterization factors, which express the intensity of the impact of each emission. The fourth column shows the final assessed impact, which is obtained by multiplying the quantity of emissions by the corresponding factor.
Based on the application of the Eco-Indicator 99 methodology, it appears that the emissions examined lead, through their impact on human health, to a total loss of 2.08 × 10⁻⁵ years of healthy life, expressed in DALY units (Disability Adjusted Life Years)—i.e., years of life lost due to disability or premature death.
Greenhouse gases (GHG) are linked to climate change and, according to estimates, lead to a total loss of 1.19 × 10⁻⁵ healthy life years (DALY) due to premature deaths and health deterioration.
Emissions of respirable organic compounds were assessed based on the corresponding coefficients provided by the Eco-Indicator 99 method and are presented in the corresponding table. These substances are associated with respiratory problems and, according to the assessment, lead to a total loss of 5.53 × 10⁻⁹ healthy life years (DALY) due to premature deaths and health deterioration.
Similarly, respirable inorganic compounds are also assessed for their impact on human health. The results show that emissions of these substances cause a total loss of 8 × 10⁻⁶ years of life (DALY).
The difference in magnitude between the effects of organic and inorganic compounds is significant, mainly due to the contribution of TSP (total suspended particles) and PM (particulate matter). Particles have higher size-class characterization factors than other substances and are known to contribute significantly to respiratory diseases and health problems in the human population.

3.3.5. Impact of Emissions on the Ecosystem

Pollutant emissions also contribute to the degradation of ecosystem quality.In the case of impacts such as water eutrophication and soil acidification, the main contributing substances are nitrogen oxides (NOx) and sulphur oxides (SOx and SO2), which affect both categories of effects through common factors. In the Eco-Indicator 99 methodology, it is not possible to distinguish precisely whether environmental damage is caused by an increase in nutrients or by changes in acidity. For this reason, the two effects are combined into a single category.
The units of measurement in the ecosystem impact section are differentiated and expressed as PDF·m2·year, i.e., as the potential extinction of species per unit area per year. In this analysis, the total environmental impact corresponds to a value of 1.09 PDF·m2·yr, which is estimated over the entire life cycle of the corks. Specifically, the environmental impact due to acidification and eutrophication corresponds to a value of 1.30 × 10⁻¹ PDF·m2·yr, while that due to emissions of toxic substances to the ecosystem corresponds to a value of 9.62 × 10⁻¹ PDF·m2·yr.
According to Eco-Indicator 99, the impact on the ecosystem due to climate change has not been determined [62].

3.4. Interpretation of Results

3.4.1. Total Impact on Human Health

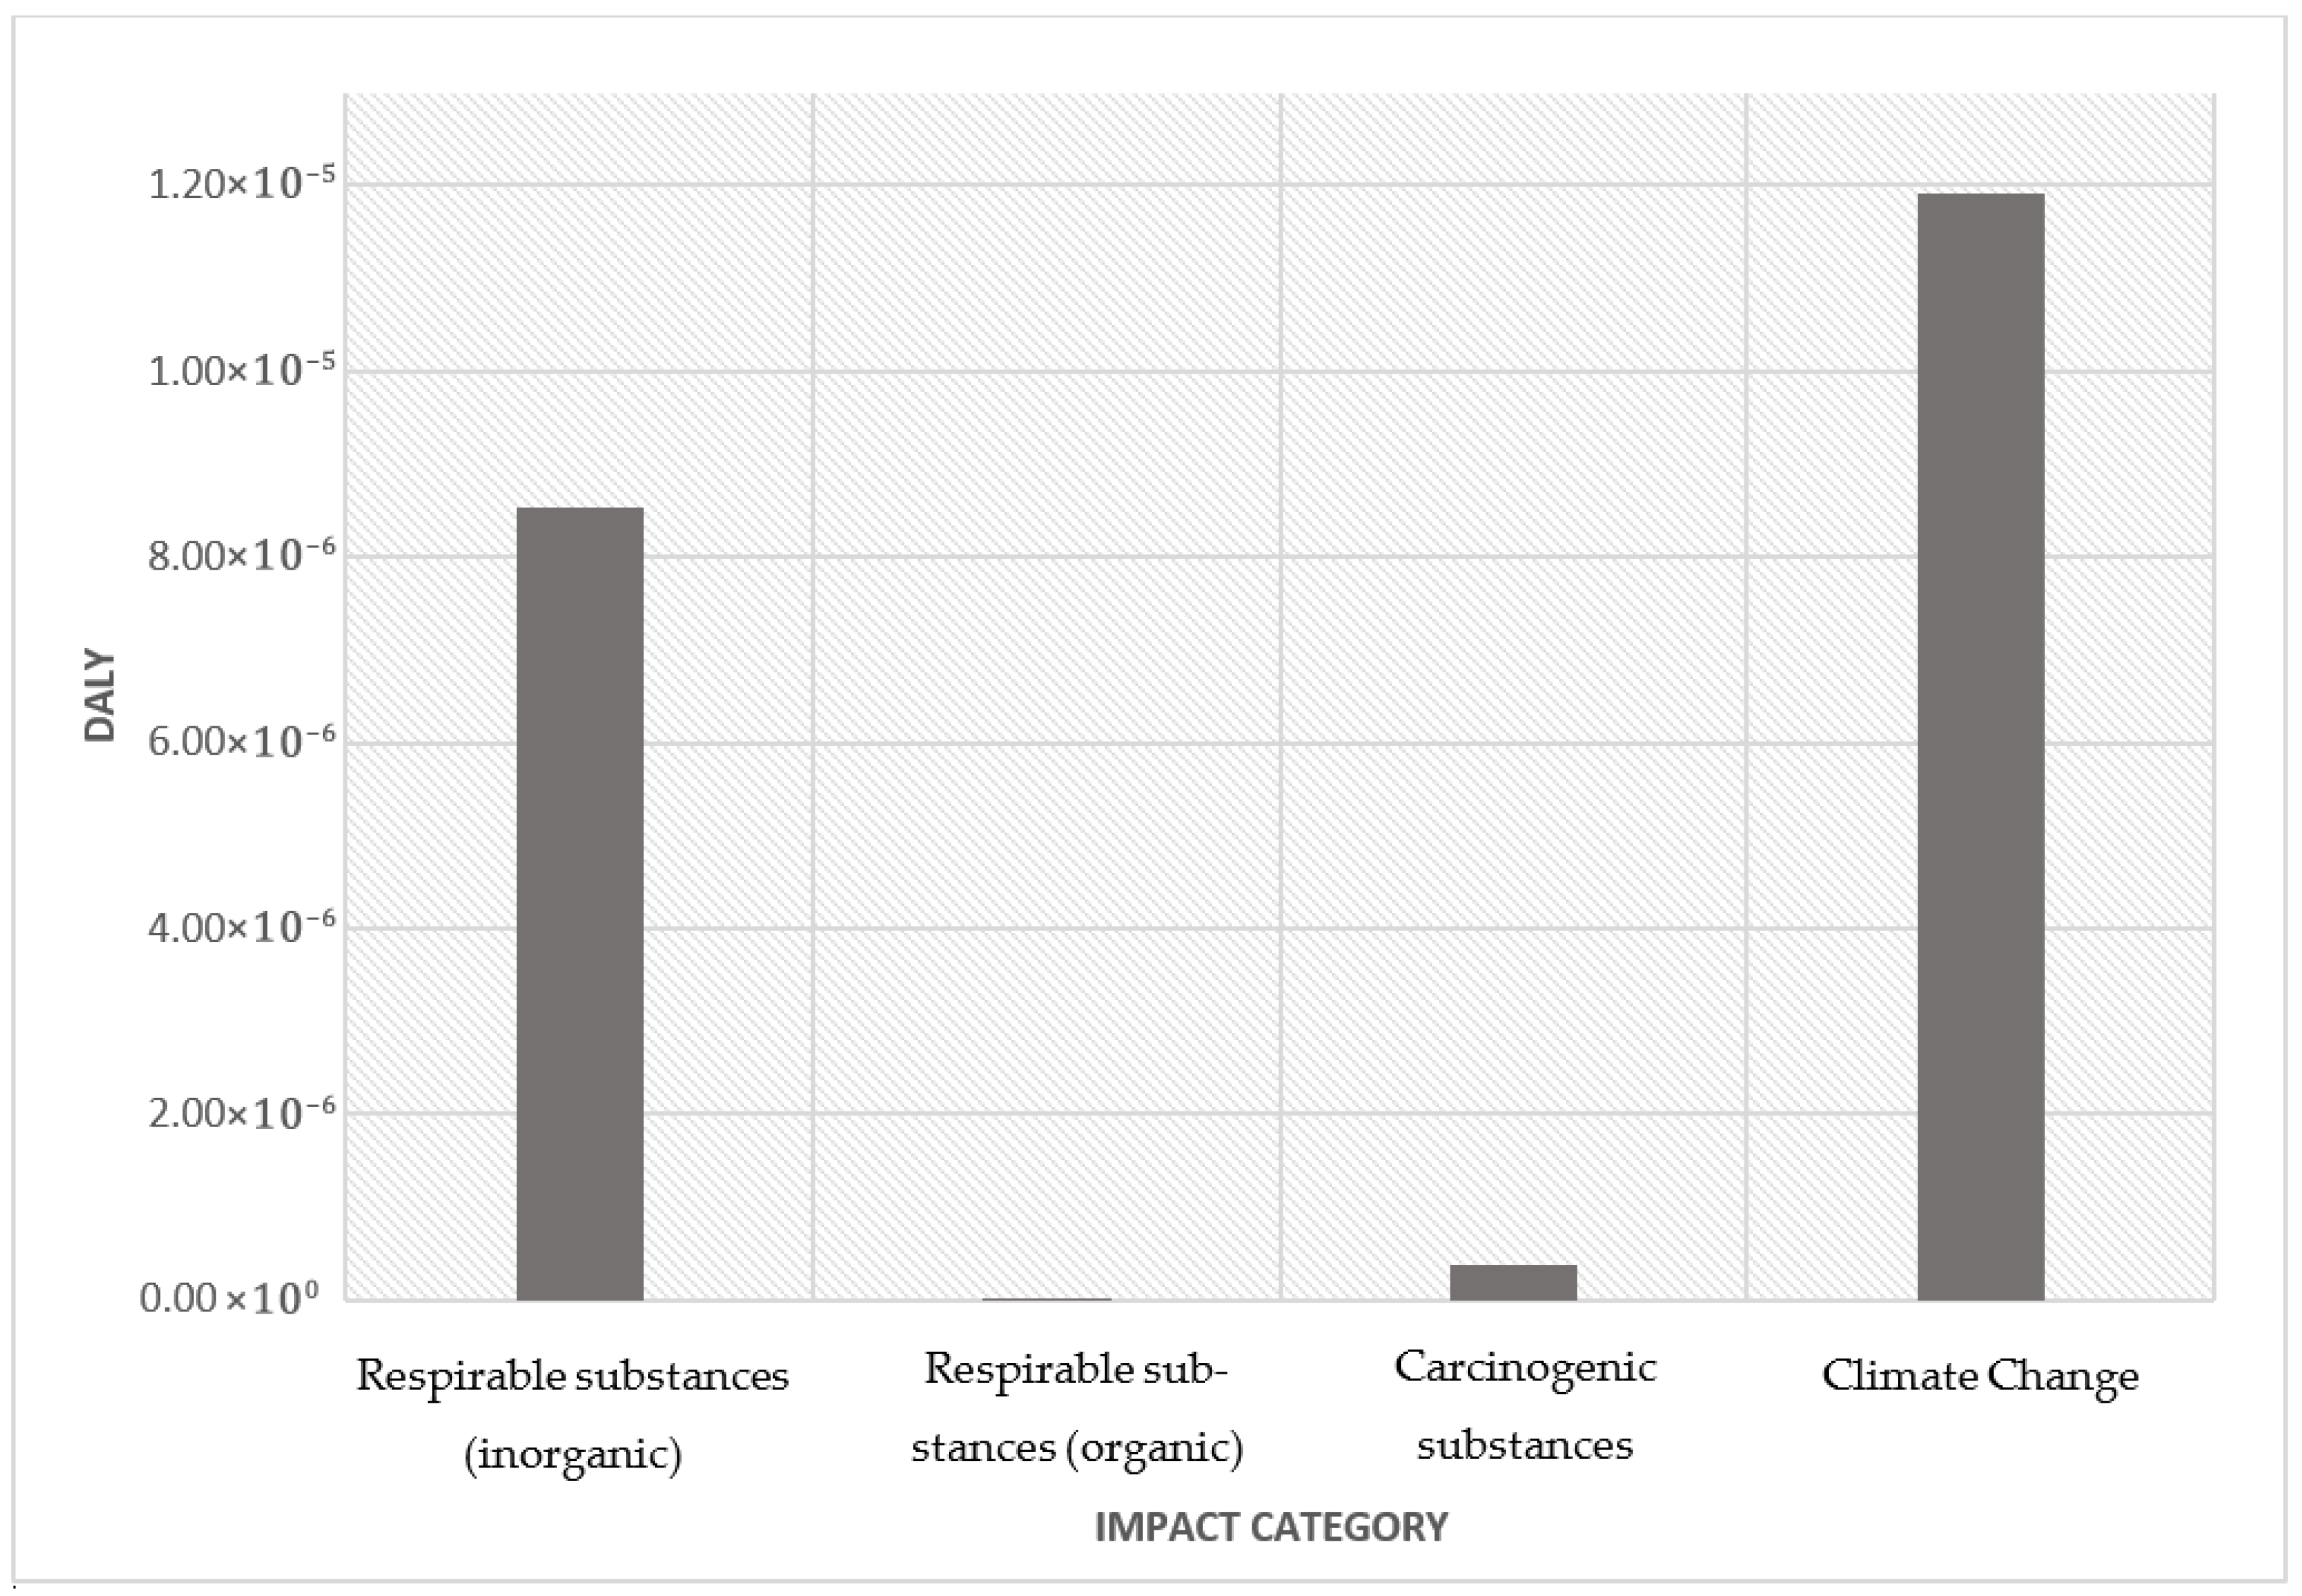
Figure 5 shows the total impact of the life cycle of corks on human health, calculated in DALY (Disability-Adjusted Life Years) units. Four main categories of impacts are analyzed, which are directly related to damage to human health, climate change, emissions of inorganic and organic air pollutants, and emissions of carcinogenic substances.
In terms of results, the impact of climate change on human health is the highest of all categories, with a value of 1.19 × 10⁻⁵ DALY, making it the dominant category. CO2 dominates significantly, despite having a low characterization factor (0.00000021). This is due to its high emission level (56.7 kg) compared to other pollutants. The second largest contribution to the impact of climate change comes from CH4, with an impact of 7.35 × 10⁻⁹ DALY. The smallest impact is found in N2O, with a value of 1.38 × 10⁻⁹ DALY. Although CO2 and CH4 have low characterization factors, in large quantities they have serious impacts on the human population (e.g., spread of disease, heat waves, etc.). The result highlights the importance of the quantity of emissions, even when the pollutant has relatively low toxicity.
Next are inorganic respirable substances, with a total impact of 8.53 × 10⁻⁶ DALY, which include pollutants such as PM2.5, PM10, NOx, SOx and CO. It is noteworthy that while CO emissions amount to 0.4 kg and are the second largest total emissions after CO2, their overall impact on the respiratory system remains relatively small. This is due to its low characterization factor, which is 7.31 × 10⁻⁷ DALY/kg. The most harmful pollutants are PM2.5 and PM10 particles, which are responsible for over 50% of the total impact in this category. These are harmful particles for respiratory health, which is reflected in their high characterization factor. The second largest impact in this category comes from NOx with a value of 1.73 × 10⁻⁶ DALY. The smallest impact is recorded by NH3, with a total value of 1.70 × 10⁻¹⁰ DALY.
Carcinogens have a lower overall impact, with 3.73 × 10⁻⁷ DALY, but it is worth noting that even this low value indicates a serious risk in case of long-term exposure, due to the high toxicity of the substances involved (As, Cd, Ni, PCB, etc.). Of the pollutants, arsenic (As) contributes the most (2.46 × 10⁻⁷ DALY), accounting for approximately 66% of the category. Also noteworthy is the contribution of nickel (Ni), which has the second largest impact on human health, with a total impact of 7.05 × 10⁻⁸ DALY, highlighting the strong toxicity of these substances. The smallest impact is recorded by hexachlorobenzene (HCB), with a total value of 4.95 × 10⁻¹¹ DALY. Although carcinogenic substances have a lower contribution, their high coefficients indicate high toxicity even in small quantities.
Organic respirable substances have the lowest impact, with approximately 5.53 × 10⁻⁹ DALY, either due to the small amount emitted or due to the low toxicity of NMVOCs and CH4 in this category. NMVOCs dominate here, but they have very little impact on human health according to the present methodology. The second largest impact is attributed to methane, with a value of 2.14 × 10⁻¹¹ DALY, which is also the lowest in the category. This category is relatively negligible, mainly due to low quantities and low coefficients.
The overall impact for all categories is 2.08 × 10⁻⁵ DALY, with the largest contribution coming from climate change (57%), followed by inorganic respirable substances (41%). The results highlight the dual nature of environmental risks. Pollutants such as CO2 have a high impact due to their high concentrations, while trace pollutants such as As, Cr and PM2.5 have a disproportionate impact due to their high toxicity (higher coefficients).
The analysis concludes that greenhouse gases (CO2, CH4, N2O) and inorganic particulate matter are the two main factors affecting human health in the life cycle of caps.

3.4.2. Overall Impact on Ecosystem Quality

Figure 6 shows the overall impact on the natural environment caused by the life cycle of adhesives, expressed in PDF·m2·yr units. The two main categories of impacts are analyzed, which are directly related to the degradation of biodiversity and ecological balances, emissions of toxic substances, and the eutrophication–acidification category. The additional energy required for iron mining in the future is also analyzed.
The total environmental impact on ecosystem quality is estimated at 1.09 PDF·m2·yr, with toxic emissions being the dominant category.
The toxic substance emissions category has a total impact of 0.962 PDF·m2·yr and accounts for approximately 88% of the total ecological load. These are pollutants such as heavy metals, which, even in small quantities, have a strong and lasting effect on natural ecosystems. Chromium (Cr) is the dominant toxic agent, with a high quantity and high coefficient (4130 PDF·m2·yr/kg). It is followed by zinc (Zn) and lead (Pb), which account for approximately 50% of the impact. Nickel (Ni) and mercury (Hg) also contribute significantly, despite relatively low emission levels. It is noteworthy that some pollutants (such as cadmium and arsenic) have very low emissions but extremely high coefficients, indicating serious toxicity even in trace amounts. The smallest impact is found in the total of four polycyclic aromatic hydrocarbons (Total 4 PAHs), with a total value of 7.80 × 10⁻⁹ PDF·m2·yr.
This is followed by the eutrophication–acidification category with a total impact of 0.13 PDF·m2·yr, with chemical changes in soil and water, leading to species loss and changes in ecosystem composition. The main pollutants are nitrogen oxides (NOx), which account for 85% of the category. Although the quantity (1.95 × 10⁻² Kg) of the pollutant is not large, the high characterization factor (5.713 PDF·m2·yr/kg) translates into significant ecological degradation. These are followed by sulphur oxides (SOx) with a value of 1.84 × 10⁻² PDF·m2·yr, and ammonia (NH3), with a lower impact (3.11 × 10⁻⁵ PDF·m2·yr). Ammonia in particular, although released in small quantities (2.00 × 10⁻⁶ Kg), has a high eutrophication potential, as shown by the high coefficient (15.57 PDF·m2·yr/kg).
This category is mainly related to the transport of pollutants through the atmosphere and their deposition on land and water bodies, leading to changes in pH, a reduction in biodiversity and disruptions to natural cycles.
The additional energy required for iron mining in the future is approximately 0.6 MJ, which is linked to the extensive impacts of raw material extraction (steel production).

3.5. End-of-Life Modelling

End-of-Life was modelled to reflect EU-typical pathways for small metal components: recycling (50–60%), incineration with energy recovery (10–20%) and disposal to landfill for the remaining percentage. We apply a substitution approach whereby recovered steel displaces primary steel on a 1:1 mass basis, with conservative quality adjustment for downcycling losses. Given the low mass of individual caps and common co-collection with glass bottles, capture rates are uncertain; therefore, we provide scenario ranges and discuss drivers qualitatively. EoL modelling does not alter the hotspot ranking (steel production > manufacturing > transport), but it reduces net GWP via recycling credits and can influence toxicity categories depending on liner/coating chemistry [1,2,3,4].

4. Discussion

The Life Cycle Assessment (LCA) of 10,000 Crown cork metal caps shows that the largest environmental footprint comes from steel production, which accounts for approximately 94% of total carbon dioxide emissions (53,550 kg CO2) and for the majority of the remaining pollutants, such as nitrogen oxides (NOx), sulphur oxides (SOx), particulate matter (PM), heavy metals and organic compounds. The manufacturing and packaging process contributes approximately 2%, while natural gas-powered printing accounts for approximately 3% of CO2 emissions, affecting overall air quality. Transport, although necessary, has a small share in the overall carbon footprint due to CO2 emissions of approximately 1% and limited impact on other pollutants, suggesting that improvements at this stage are supportive rather than decisive.
Overall, the most critical and targeted interventions concern steel production, while secondary but essential measures, such as the use of cleaner energy in the manufacturing and transport phases, can enhance the overall environmental performance of the product.
The intensity of emissions in the steel production phase highlights the polluting nature of the metallurgical industry and the importance of using recycled raw materials and more environmentally friendly technologies.
Taking into account the Greenhouse Gas Emissions Index (GGI) for crude steel produced in electric arc furnaces (Electric Arc Furnace—EAF), as presented in a relevant study, it appears that steel production via EAF results in significantly lower emissions. Specifically, when 75% of the raw materials consist of recycled steel and the remaining 25% of cast iron or iron, the emissions related to production amount to 0.848 t CO2e/t steel.
Considering that this type of production replaces traditional methods such as blast furnaces, the environmental footprint of production is significantly reduced. The use of an emission factor of 0.8 t CO2e/t steel results in a reduction of almost three times compared to the case of this study for the life cycle assessment of plugs. Specifically, the total reduction in emissions is approximately 68%, highlighting the environmental superiority of EAF technology. This significant difference makes it important to adopt low greenhouse gas emission technologies in the life cycle of plugs.
Finally, it is worth noting that if the emission recording system does not adequately incorporate the benefits of recycling, then the real environmental contribution of recyclable materials is not recognized, limiting the effectiveness of overall emission reduction measures.
During the study, one of the most significant challenges was collecting reliable and sufficient data to determine the life cycle of crown cork closures. This process proved to be particularly demanding and time-consuming, as the aim was to obtain as realistic a picture as possible of emissions and impacts, based on data from actual production. The contribution of the production unit in providing relevant information was crucial for the completeness of the results.
However, there was a significant lack of data on the final disposal phase of the caps, which meant that this stage could not be included in the overall analysis. Furthermore, the limited availability of published LCA studies focusing specifically on food packaging applications prevented the findings from being cross-checked or validated through comparative assessment. A comparison with an existing study entitled Life Cycle Analysis of Metal Packaging in Europe, carried out by RDC Environment in 2022, was not possible as the caps examined in that analysis are not limited exclusively to the Crown cork type, but also include other types of metal caps, meaning that the data are not fully comparable with those obtained in the present study.
When selecting a method for assessing environmental impacts, no approximate tool specifically tailored to the requirements of metal caps or food packaging, in general, was identified. Therefore, the Eco-Indicator 99 method was selected, which is one of the most widely used in the literature for LCA applications.
In general, the implementation of an LCA study of this kind requires particular care in defining the boundaries of the system and careful selection of data.

Limitations

This study’s scope and data entail a series of limitations since they are based on specific assumptions mentioned in the previous sections. As far as the system boundaries are concerned, these exclude the construction and depreciation of buildings, production equipment and vehicles and human resource activities consistent with ISO cut-off guidance. They were not quantified because their contribution is expected to be minor per functional unit.
Another limitation involves some of the inventories, especially for coatings/inks and long-range logistics, that rely on secondary sources. Nevertheless, the study reports them transparently and notes that toxicity/resource category precision is lower than for climate endpoints. Finally, as End-of-Life capture for small metal components is uncertain, the paper employs EU-average scenarios and provides qualitative ranges.
The above-mentioned limitations do not affect the main conclusions presented in the next section but do qualify the precision of non-climate categories.

5. Conclusions

The life cycle assessment (LCA) of 10,000 metal Crown cork caps reveals that steel production is by far the stage with the greatest impact on the environment, contributing to approximately 94% of total carbon dioxide emissions (53,550 kg CO2) and dominating emissions of various pollutants such as nitrogen and sulphur oxides, particulate matter, heavy metals and organic compounds. Other stages, such as manufacturing and packaging (2%), natural gas printing (3%) and transport (1%), play a relatively minor role in the overall footprint. Consequently, the greatest potential for reducing emissions lies in improving steel production processes. The transition from traditional blast furnaces to electric arc furnace (EAF) technology, especially when using 75% recycled steel, can reduce emissions by almost 68%, demonstrating a significant environmental advantage. However, the full benefits of recycling are often underestimated in emissions reference systems, undermining the effectiveness of sustainability strategies. Conducting this LCA presented several challenges, mainly in terms of securing accurate and comprehensive data to map the product’s full life cycle. Cooperation with the production facility was crucial to obtaining realistic and representative data. However, there was a significant gap in the assessment of the end-of-life disposal phase, which could not be analyzed due to limited data. The scarcity of published LCA studies focusing specifically on food packaging—particularly cork caps—further hampered comparative assessment. Existing studies, such as the 2022 report by the RDC Environment, covered a broader range of metal caps, making direct comparisons inappropriate. In the absence of a specifically tailored assessment tool for metal food caps, the Eco-Indicator 99 methodology was adopted as a reliable and widely recognized approach. Overall, the study highlights the need for precision in defining system boundaries and selecting data when assessing environmental impacts through LCAs.
In addition to EI99, we discuss results in the context of ReCiPe 2016 midpoints and EF 3.x indicators to align with current European practice. These more recent methods expand the coverage of toxicity and ecosystem categories and reflect ongoing harmonization efforts in the EU. While recalculation under ReCiPe/EF was not performed in this study, we note that the narrative hotspot ranking remained the same (steel production > manufacturing > transport). Future work could extend this analysis by recalculating results under ReCiPe 2016 and EF 3.x methods to provide quantitative comparisons.
Given that the main obstacle identified in this study was the collection of specific data, it is necessary to create a targeted database on the life cycle of Crown cork metal closures. Such a development would provide greater accuracy and speed in future assessments. Especially for the environmental impact assessment stage, it is important to develop characterization factors that reflect the specificities of the material and its application in order to reduce dependence on general or unrelated data.
At the same time, comprehensive studies covering a wide range of production processes and waste management scenarios need to be carried out in order to establish a reliable basis for future comparisons. The incorporation of higher percentages of recycled steel in its production in subsequent studies would provide a more complete picture of the life cycle of plugs and contribute to a better assessment of the potential environmental benefits of using secondary raw materials.

Author Contributions

Conceptualization, I.S.; methodology, I.S. and D.G.; software, I.S.; validation, E.D.; formal analysis, I.S.; investigation, I.S.; resources, I.S. and E.D.; data curation, I.S. and E.D.; writing—original draft preparation, I.S. and E.D.; writing—review and editing, A.A. and D.G.; visualization, A.A.; supervision, D.G.; project administration, A.A. and D.G. All authors have read and agreed to the published version of the manuscript.

Funding

This research received no external funding.

Data Availability Statement

The datasets presented in this article are not readily available because they are part of an ongoing study.

Conflicts of Interest

The authors declare no conflicts of interest.

Appendix A

Table A1. Emission factors for steel production.
PollutantEmission FactorUnitEmission FactorUnit
CO22.5t/Mg steel2500g/kg
CH476.336g/Mg steel0.076336g/kg
NOx643.94g/Mg steel0.64394g/kg
CO19,660g/Mg steel19.66g/kg
SOx540.39g/Mg steel0.54039g/kg
NMVOC150g/Mg steel0.15g/kg
TSP442.8g/Mg steel0.4428g/kg
PM10250g/Mg steel0.25g/kg
PM2.5147g/Mg steel0.147g/kg
Pb4.6g/Mg steel0.0046g/kg
Cd0.02g/Mg steel0.00002g/kg
Hg0.1g/Mg steel0.0001g/kg
As0.4g/Mg steel0.0004g/kg
Cr4.5g/Mg steel0.0045g/kg
Cu0.07g/Mg steel0.00007g/kg
Ni0.14g/Mg steel0.00014g/kg
Se0.02g/Mg steel0.00002g/kg
Zn4g/Mg steel0.004g/kg
PCB2.5mg/Mg steel0.0000025g/kg
Total 4 PAHs0.48g/Mg steel0.00048g/kg
HCB0.03mg/Mg steel0.00000003g/kg
Table A2. Emission factors for natural gas consumption.
PollutantEmission FactorUnitEmission FactorUnit
CO255.68kg/GJ55.68kg/GJ
CH41kg/TJ0.001kg/GJ
N2O0.1kg/TJ0.0001kg/GJ
NOx74g/GJ0.074kg/GJ
CO29g/GJ0.029kg/GJ
NMVOC23g/GJ0.023kg/GJ
SOx0.67g/GJ0.00067kg/GJ
PM100.78g/GJ0.00078kg/GJ
PM2.50.78g/GJ0.00078kg/GJ
TSP0.78g/GJ0.00078kg/GJ
Table A3. Emission factors for electricity consumption.
PollutantEmission FactorUnitEmission FactorUnit
CO2371.68g/kWh371.68g/kWh
CH40.006322g/kWh0.006322g/kWh
N2O0.0026031g/kWh0.0026031g/kWh
NOx128.89mg/kWh0.12889g/kWh
CO303.68mg/kWh0.30368g/kWh
NMVOC101.97mg/kWh0.10197g/kWh
SOx2.23g/kWh2.23g/kWh
PM212.74mg/kWh0.21274g/kWh
Table A4. Emission factors for crown cork transportation.
PollutantEmission FactorUnit
CO23180g/kg
CH40.16g/kg
N2O0.07g/kg
NOx25.95g/kg
CO6.1g/kg
SO20.000384g/kg
NMVOC0.9g/kg
PM0.55g/kg
Pb0.000966g/kg
NH30.02g/kg
Table A5. Impact of emissions on human health using the Eco-Indicator 99 method mission.
Categories (Damage and Impact)Total Emissions—LCI (Kg)Characterization Factors (DALY/Kg)Impact (DALY)
Harm to Human Health
Impact from Carcinogenic Substances
As1.00 × 10−50.02462.46 × 10−7
Cd4.00 × 10−70.1355.40 × 10−8
HCB6.00 × 10−100.08254.95 × 10−11
Ni3.00 × 10−60.02357.05 × 10−8
PCB5.00 × 10−80.02041.02 × 10−9
Total 4 PAHs1.00 × 10−50.000171.70 × 10−9
Total2.35 × 10−5 3.73 × 10⁻⁷
Impact from Climate Change
CH41.67 × 10−30.00000447.35 × 10−9
CO25.67 × 1010.000000211.19 × 10−5
N2O2.00 × 10−50.0000691.38 × 10−9
Total5.67 × 101 1.19 × 10⁻⁵
Impact from Respirable Substances (Inorganic)
CO4.23 × 10−10.0000007313.10 × 10−7
NH32.00 × 10−60.0000851.70 × 10−10
NOx1.95 × 10−20.00008871.73 × 10−6
PM106.12 × 10−30.0003752.30 × 10−6
PM2.53.12 × 10−30.00072.18 × 10−6
SOx1.77 × 10−20.00005469.68 × 10−7
TSP9.52 × 10−30.000111.05 × 10−6
Total4.79 × 10−1 8.53 × 10⁻⁶
Impact from Respirable Substances (Organic)
CH41.67 × 10−31.28 × 10−82.14 × 10−11
NMVOC4.30 × 10−30.000001285.50 × 10−9
Total5.97 × 10−3 5.53 × 10⁻⁹
Grand total 5.72 × 101 2.08 × 10⁻⁵

References

  1. Huijbregts, M.A.J.; Steinmann, Z.J.N.; Elshout, P.M.F.; Stam, G.; Verones, F.; Vieira, M.; Zijp, M.; Hollander, A.; Zelm, R. ReCiPe2016: A harmonized life cycle impact assessment method at midpoint and endpoint level. Int. J. Life Cycle Assess. 2017, 22, 138–147. [Google Scholar] [CrossRef]
  2. European Commission, Joint Research Centre (JRC). Environmental Footprint (EF) 3.0 Method—Overview and Detailed Guidance; Publications Office of the EU: Luxembourg, 2021; Available online: https://data.jrc.ec.europa.eu (accessed on 23 June 2025).
  3. Hughes, A.E.; Haque, N.; Northey, S.A.; Giddey, S. Platinum Group Metals: A Review of Resources, Production and Usage with a Focus on Catalysts. Resources 2021, 10, 93. [Google Scholar] [CrossRef]
  4. Flannery, B.P.; Mares, J.W. Greenhouse Gas Index for Products in 39 Industrial Sectors: Iron, Steel, and Ferroalloys (NAICS 331110); Working Paper 22-16 M6, updated February 2023; Resources for the Future: Washington, DC, USA, 2022; Available online: https://media.rff.org/documents/WP_22-16_M6_Feb_2023_Update.pdf (accessed on 16 July 2025).
  5. ISO 14040; Environmental Management—Life Cycle Assessment—Principles and Framework. International Organization for Standardization: Geneva, Switzerland, 2006.
  6. ISO 14044:2006; Environmental Management—Life Cycle Assessment—Requirements and Guidelines. International Organization for Standardization: Geneva, Switzerland, 2006.
  7. FAO. How to Feed the World in 2050? Food and Agriculture Organization of the United Nations: Rome, Italy, 2008. [Google Scholar]
  8. Tilman, D.; Clark, M. Global diets link environmental sustainability and human health. Nature 2014, 515, 518–522. [Google Scholar] [CrossRef]
  9. Boutros, M.; Saba, S.; Manneh, R. Life cycle assessment of two packaging materials for carbonated beverages (polyethylene terephthalate vs. glass): Case study for the Lebanese context and importance of the end-of-life scenarios. J. Clean. Prod. 2021, 314, 128289. [Google Scholar] [CrossRef]
  10. Wansink, B. Household food waste solutions for behavioral economists and marketers. J. Food Prod. Mark. 2018, 24, 500–521. [Google Scholar] [CrossRef]
  11. FPM (Food Packaging Market). Global Industry Trends, Share, Size, Growth, Opportunity and Forecast 2023–2028. 2023. Available online: https://www.imarcgroup.com/food-packaging-market (accessed on 29 December 2024).
  12. Boesen, S.; Bey, N.; Niero, M. Environmental sustainability of liquid food packaging: Is there a gap between Danish consumers’ perception and learnings from life cycle assessment? J. Clean. Prod. 2019, 210, 1193–1206. [Google Scholar] [CrossRef]
  13. Schulze, G. Growth within: A Circular Economy Vision for a Competitive Europe; Ellen MacArthur Foundation and McKinsey Center for Business and Environment: London, UK, 2016; pp. 1–22. [Google Scholar]
  14. Geueke, B.; Groh, K.; Muncke, J. Food packaging in the circular economy: Overview of chemical safety aspects for commonly used materials. J. Clean. Prod. 2018, 193, 491–505. [Google Scholar] [CrossRef]
  15. Sæter, F.; Alvarado, I.O.; Pettersen, I.N. Reuse principle for primary packaging circularity in the food system. In Proceedings of the NordDesign 2020, Lyngby, Denmark, 11–14 August 2020; pp. 1–12. [Google Scholar]
  16. Mufarrij, F.; Ashrafi, O.; Navarri, P.; Khojasteh, Y. Development and lifecycle assessment of various low- and high-density polyethylene production processes based on CO2 capture and utilization. J. Clean. Prod. 2023, 414, 137624. [Google Scholar] [CrossRef]
  17. Tiseo, I. Global Plastic Production. Statista. 2022, pp. 1950–2020. Available online: https://www.statista.com/statistics/282732/global-production-of-plastics-since-1950/ (accessed on 8 June 2025).
  18. Ghaib, K.; Ben-Fares, F.-Z. Power-to-Methane: A state-of-the-art review. Renew. Sustain. Energy Rev. 2018, 81, 433–446. [Google Scholar] [CrossRef]
  19. Cabernard, L.; Pfister, S.; Oberschelp, C.; Hellweg, S. Growing environmental footprint of plastics driven by coal combustion. Nat. Sustain. 2021, 5, 139–148. [Google Scholar] [CrossRef]
  20. Zheng, J.; Suh, S. Strategies to reduce the global carbon footprint of plastics. Nat. Clim. Change 2019, 9, 374–378. [Google Scholar] [CrossRef]
  21. Eurostat. Packaging Waste Statistics; Eurostat: Luxembourg, 2019; Available online: https://ec.europa.eu/eurostat/statistics-explained/index.php?title=Packaging_waste_statistics (accessed on 29 May 2025).
  22. Beitzen-Heineke, E.F.; Balta-Ozkan, N.; Reefke, H. The prospects of zero-packaging grocery stores to improve the social and environmental impacts of the food supply chain. J. Clean. Prod. 2017, 140, 1528–1541. [Google Scholar] [CrossRef]
  23. Sazdovski, I.; Bala, A.; Fullana-i-Palmer, P. Linking LCA literature with circular economy value creation: A review on beverage packaging. Sci. Total Environ. 2021, 771, 145322. [Google Scholar] [CrossRef]
  24. Manfredi, S.; Allacker, K.; Chomkhamsri, K.; Pelletier, N.; Maia de Souza, D. Product Environmental Footprint (PEF) Guide; European Commission: Brussels, Belgium; Joint Research Centre: Brussels, Belgium; Institute for Environment and Sustainability: Ispra, Italy, 2012; Available online: https://www.vliz.be/imisdocs/publications/396125.pdf (accessed on 16 June 2025).
  25. Tascione, V.; Simboli, A.; Taddeo, R.; Del Grosso, M.; Raggi, A. A comparative analysis of recent life cycle assessment guidelines and frameworks: Methodological evidence from the packaging industry. Environ. Impact Assess. Rev. 2024, 108, 107590. [Google Scholar] [CrossRef]
  26. Ferrara, C.; De Feo, G. Comparative life cycle assessment of alternative systems for wine packaging in Italy. J. Clean. Prod. 2020, 259, 120888. [Google Scholar] [CrossRef]
  27. Curran, M.A. Assessing environmental impacts of biofuels using lifecycle-based approaches. Manag. Environ. Qual. Int. J. 2013, 24, 34–52. [Google Scholar] [CrossRef]
  28. Zampori, L.; Pant, R. Suggestions for Updating the Product Environmental Footprint (PEF) Method; EUR 29682 EN; Publications Office of the European Union: Luxembourg, 2019; ISBN 978-92-76-00654-1. [Google Scholar] [CrossRef]
  29. World Steel Association. Life Cycle Inventory Data and Eco-Profiles (2020 Dataset). Available online: https://worldsteel.org/steel-topics/life-cycle-thinking/life-cycle-inventory (accessed on 28 June 2025).
  30. European Commission, Joint Research Centre (JRC). PEFCR Guidance v6.3; Publications Office of the European Union: Luxembourg, 2019; Available online: https://eplca.jrc.ec.europa.eu/permalink/PEFCR_guidance_v6.3-2.pdf (accessed on 23 June 2025).
  31. Metal Packaging Europe; RDC Environment. Life Cycle Assessment of Metal Packaging in Europe. In Executive Summary and Methodological Report; Metal Packaging Europe: Brussels, Belgium, 2022; Available online: https://www.metalpackagingeurope.org/wp-content/uploads/2025/06/Metal-Packaging-Europe_LCA_Executive-Summary_2022.pdf (accessed on 23 June 2025).
  32. Bher, A.; Auras, R. Life cycle assessment of packaging systems: A meta-analysis to evaluate the root of consistencies and discrepancies. J. Clean. Prod. 2024, 476, 143785. [Google Scholar] [CrossRef]
  33. UNEP. Single-Use Plastic Bottles and Their Alternatives: Recommendations from Life Cycle Assessments. United Nations Environment Programme. 2020. Available online: https://www.lifecycleinitiative.org/resources/single-use-plastic-bottles (accessed on 22 June 2025).
  34. Shadar, H.; Shach-Pinsly, D. Maintaining Community Resilience through Urban Renewal Processes Using Architectural and Planning Guidelines. Sustainability 2024, 16, 560. [Google Scholar] [CrossRef]
  35. IBWA; Trayak. Life Cycle Assessment of Common Drink Packaging; International Bottled Water Association: Alexandria, VA, USA, 2024; Available online: https://bottledwater.org/wp-content/uploads/2024/04/IBWA-Trayak-Full-Report-32321.pdf (accessed on 2 July 2025).
  36. International Aluminium Institute. Comparing the Carbon Footprints of Beverage Containers; International Aluminium Institute: London, UK, 2024; Available online: https://international-aluminium.org/wp-content/uploads/2024/04/Comparing-the-carbon-footprints-of-beverage-containers.pdf (accessed on 22 June 2025).
  37. Garcia, E.S.; Huysveld, S.; Nhu, T.T.; Meester, S.D.; Dewulf, J. Technical substitutability of recycled materials in life cycle assessment. Waste Manag. 2023, 164, 182–193. [Google Scholar] [CrossRef]
  38. Marrucci, L.; Daddi, T.; Iraldo, F. Identifying the most sustainable beer packaging through a Life Cycle Assessment. Sci. Total Environ. 2024, 948, 174941. [Google Scholar] [CrossRef] [PubMed]
  39. Bergsma, G.; Sevenster, M. End-of-Life Best Approach for Allocating Recycling Benefits in LCAs of Metal Packaging. Delft: CE Delft, February 2013. Available online: https://kidv.nl/media/engelse_rapporten/end-of-life-best-approach-for-allocating-recycling-benefits-in-lcas-of-metal-packaging.pdf?development (accessed on 2 July 2025).
  40. Dolci, G.; Puricelli, S.; Cecere, G.; Daddi, T.; Iraldo, F. How does plastic compare with alternative materials in the packaging sector? A systematic review of LCA studies. Waste Manag. Res. 2024, 43, 339–357. [Google Scholar] [CrossRef]
  41. Closed Loop Partners. Accelerating Circular Supply Chains for Plastics: The Molecular Recycling Landscape; Closed Loop Partners: New York, NY, USA, 2022; Available online: https://www.closedlooppartners.com/reports/molecular-recycling-landscape (accessed on 9 September 2025).
  42. Kang, D.H.; Auras, R.; Singh, J. Life-cycle assessment of non-alcoholic single-serve polyethylene terephthalate beverage bottles in the state of California. Resour. Conserv. Recycl. 2017, 116, 45–52. [Google Scholar] [CrossRef]
  43. Sauer, B.; Absar, M.; Cornell, D.; Quay, B.; Selke, S.; Keoleian, G. Life Cycle Assessment of Predominant U.S. Beverage Container Systems for Carbonated Soft Drinks and Domestic Still Water: Final Peer Reviewed Report. Franklin Associates (A Division of Eastern Research Group, Inc.), Submitted to The National Association for PET Container Resources (NAPCOR), February 4 2023. Available online: https://positivelypet.org/wp-content/uploads/2023/03/NAPCOR-Beverage-Container-LCA-Report-2023.pdf (accessed on 9 September 2025).
  44. Niero, M.; Olsen, S.I. Circular economy: To be or not to be in a closed product loop? A life-cycle assessment of aluminium cans with inclusion of alloying elements. Resour. Conserv. Recycl. 2017, 114, 18–31. [Google Scholar] [CrossRef]
  45. Vendries, J.; Hawkins, T.R.; Mosley, J.; Hottle, T.; Allaway, D.; Canepa, P.; Rivin, J.; Mistry, M. The Significance of Environmental Attributes as Indicators of the Life Cycle Environmental Impactsof Packaging and Food Service Ware; State of Oregon Department of Environmental Quality: Portland, OR, USA, 2018. Available online: https://www.oregon.gov/deq/FilterDocs/MaterialAttributes.pdf (accessed on 9 September 2025).
  46. Oliveira, P.; Kilchert, S.; May, M.; Panzera, T.; Scarpa, F.; Hiermaier, S. Environmental assessment of discarded plastic caps as a honeycomb core: An eco-mechanical perspective. J. Ind. Ecol. 2021, 26, 643–654. [Google Scholar] [CrossRef]
  47. World Steel Association. World steel LCI Datasets and Access Information. Available online: https://worldsteel.org/steel-by-topic/sustainability/life-cycle-assessment (accessed on 9 September 2025).
  48. Reuters. Global Steel Sector Lagging on Green Transition as Coal-Powered Production Rises, Research Shows. Reuters (Sustainability/COP). 20 May 2025. Available online: https://www.reuters.com/sustainability/cop/global-steel-sector-lagging-green-transition-coal-powered-production-rises-2025-05-20/ (accessed on 9 September 2025).
  49. Shen, X.; Schäpe, B. Closing the Loop: From Stalled Green Steel Targets to a Strategic Reset in China—China Steel Industry Decarbonisation Biannual Review H1 2025. Centre for Research on Energy and Clean Air (CREA), Helsinki, 22 July 2025. Available online: https://energyandcleanair.org/wp/wp-content/uploads/2025/07/CREA_China_Steel-Industry-Decarbonisation-Biannual-Review_H1-2025.pdf (accessed on 9 September 2025).
  50. Reuters. ArcelorMittal, MHI Launch Pilot CO2-Capture Unit at Gent Blast Furnace. Reuters (Sustainability/COP), 21 May 2024. Available online: https://www.reuters.com/sustainability/arcelormittal-mhi-launch-pilot-co2-capture-unit-gent-blast-furnace-2024-05-21 (accessed on 9 September 2025).
  51. Xue, B.; Wei, G.; Dong, B.; Conejo, A.N.; Wang, H.; Zhu, R. Analysis of energy consumption and carbon emissions of electric arc furnace steelmaking using hydrogen-based direct reduced iron. Process Saf. Environ. Prot. 2025, 201, 107617. [Google Scholar] [CrossRef]
  52. Brusseau, M.L. Sustainable development and other solutions to pollution and global change. In Global Systems and the Human Dimensions to Environmental Pollution; Elsevier: Amsterdam, The Netherlands, 2019; pp. 585–603. [Google Scholar]
  53. Barbosa, A.J.D.; Santos, V.H.P.; Araújo, P.C.; Medeiros, F.L.; Otaviano, L.Y.S. Eco product development combining eco design and life cycle assessment. Benchmarking 2021, 28, 502–516. [Google Scholar] [CrossRef]
  54. Laurin, L. Overview of LCA—History, Concept, and Methodology. In Encyclopedia of Sustainable Technologies; Elsevier: Amsterdam, The Netherlands, 2017; pp. 217–228. [Google Scholar]
  55. Rebitzer, G.; Ekvall, T.; Frischknecht, R.; Hunkeler, D.; Norris, G.; Rydberg, T.; Schmidt, W.-P.; Suh, S.; Weidema, B.P.; Pennington, D.W. Life cycle assessment Part 1: Framework, goal and scope definition, inventory analysis, and applications. Environ. Int. 2004, 30, 701–720. [Google Scholar] [CrossRef]
  56. EPD International System. Product Category Rules (PCR) 2019:13, Version 1.1: Packaging; EPD International AB: Stockholm, Sweden, 2020. [Google Scholar]
  57. Oldring, P.K.T.; Nehring, U. Metal Packaging for Foodstuffs; ILSI Europe: Brussels, Belgium, 2007. [Google Scholar]
  58. Coles, R.; McDowell, D.; Kirwan, M.J. (Eds.) Food Packaging Technology; Blackwell Publishing: Oxford, UK, 2003. [Google Scholar]
  59. Turan, D.; Poulis, J.A. The influence of surface roughness, creep and relaxation on the performance of elastomeric liners for sustainable glass bottle closures. Food Packag. Shelf Life 2022, 32, 100840. [Google Scholar] [CrossRef]
  60. Briggs, D.E.; Boulton, C.A.; Brookes, P.A.; Stevens, R. Brewing: Science and Practice; Woodhead Publishing and CRC Press: Cambridge, UK, 2004. [Google Scholar]
  61. EN 17177:2020; Glass Packaging—Crown Cap—26 mm Diameter, 6 mm Height Crown Cap. European Committee for Standardization (CEN): Brussels, Belgium, 2020. [CrossRef]
  62. Agarski, B.; Budak, I.; Micunovic, M.I.; Vukelic, D. Life cycle assessment of injection moulding tools and multicomponent plastic cap production. J. Clean. Prod. 2023, 413, 137639. [Google Scholar] [CrossRef]
  63. Donahue, L.M.; Petit, H.J.; Thiel, C.L.; Sullivan, G.A.; Gulack, B.C.; Shah, A.N. A life cycle assessment of reusable and disposable surgical caps. J. Surg. Res. 2024, 299, 112–119. [Google Scholar] [CrossRef] [PubMed]
  64. IPCC. Chapter 4: Metal Industry Emissions. In 2006 IPCC Guidelines for National Greenhouse Gas Inventories, Volume 3: Industrial Processes and Product Use; Intergovernmental Panel on Climate Change: Geneva, Switzerland, 2006. [Google Scholar]
  65. Marathe, K.V.; Chavan, K.R.; Nakhate, P. Life Cycle Assessment (LCA) of PET bottles. In Recycling of Polyethylene Terephthalate Bottles; Elsevier: Amsterdam, The Netherlands, 2019; pp. 149–165. [Google Scholar]
  66. European Environment Agency (EEA). 2.A.5.a Quarrying and Mining of Minerals Other than Coal. In EMEP/EEA Air Pollutant Emission Inventory Guidebook 2023; EEA: Copenhagen, Denmark, 2023. [Google Scholar]
  67. World Resources Institute (WRI); World Business Council for Sustainable Development (WBCSD). Technical Guidance for Calculating Scope 3 Emissions, Version 1.0; WRI and WBCSD: Washington, DC, USA, 2013. [Google Scholar]
  68. Hellenic Ministry of Environment and Energy. National Inventory Report for Greenhouse Gas Emissions; Ministry of Environment and Energy: Athens, Greece, 2023. [Google Scholar]
  69. ISO 14064-1:2018; Greenhouse Gases—Part 1: Specification with Guidance at the Organization Level for Quantification and Reporting of Greenhouse Gas Emissions and Removals. International Organization for Standardization (ISO): Geneva, Switzerland, 2018. Available online: https://www.iso.org/obp/ui/en/#iso:std:iso:14064:-1:ed-2:v1:en (accessed on 9 September 2025).
  70. World Resources Institute (WRI); World Business Council for Sustainable Development (WBCSD). The Greenhouse Gas Protocol: A Corporate Accounting and Reporting Standard; WRI and WBCSD: Geneva, Switzerland, 2004. [Google Scholar]
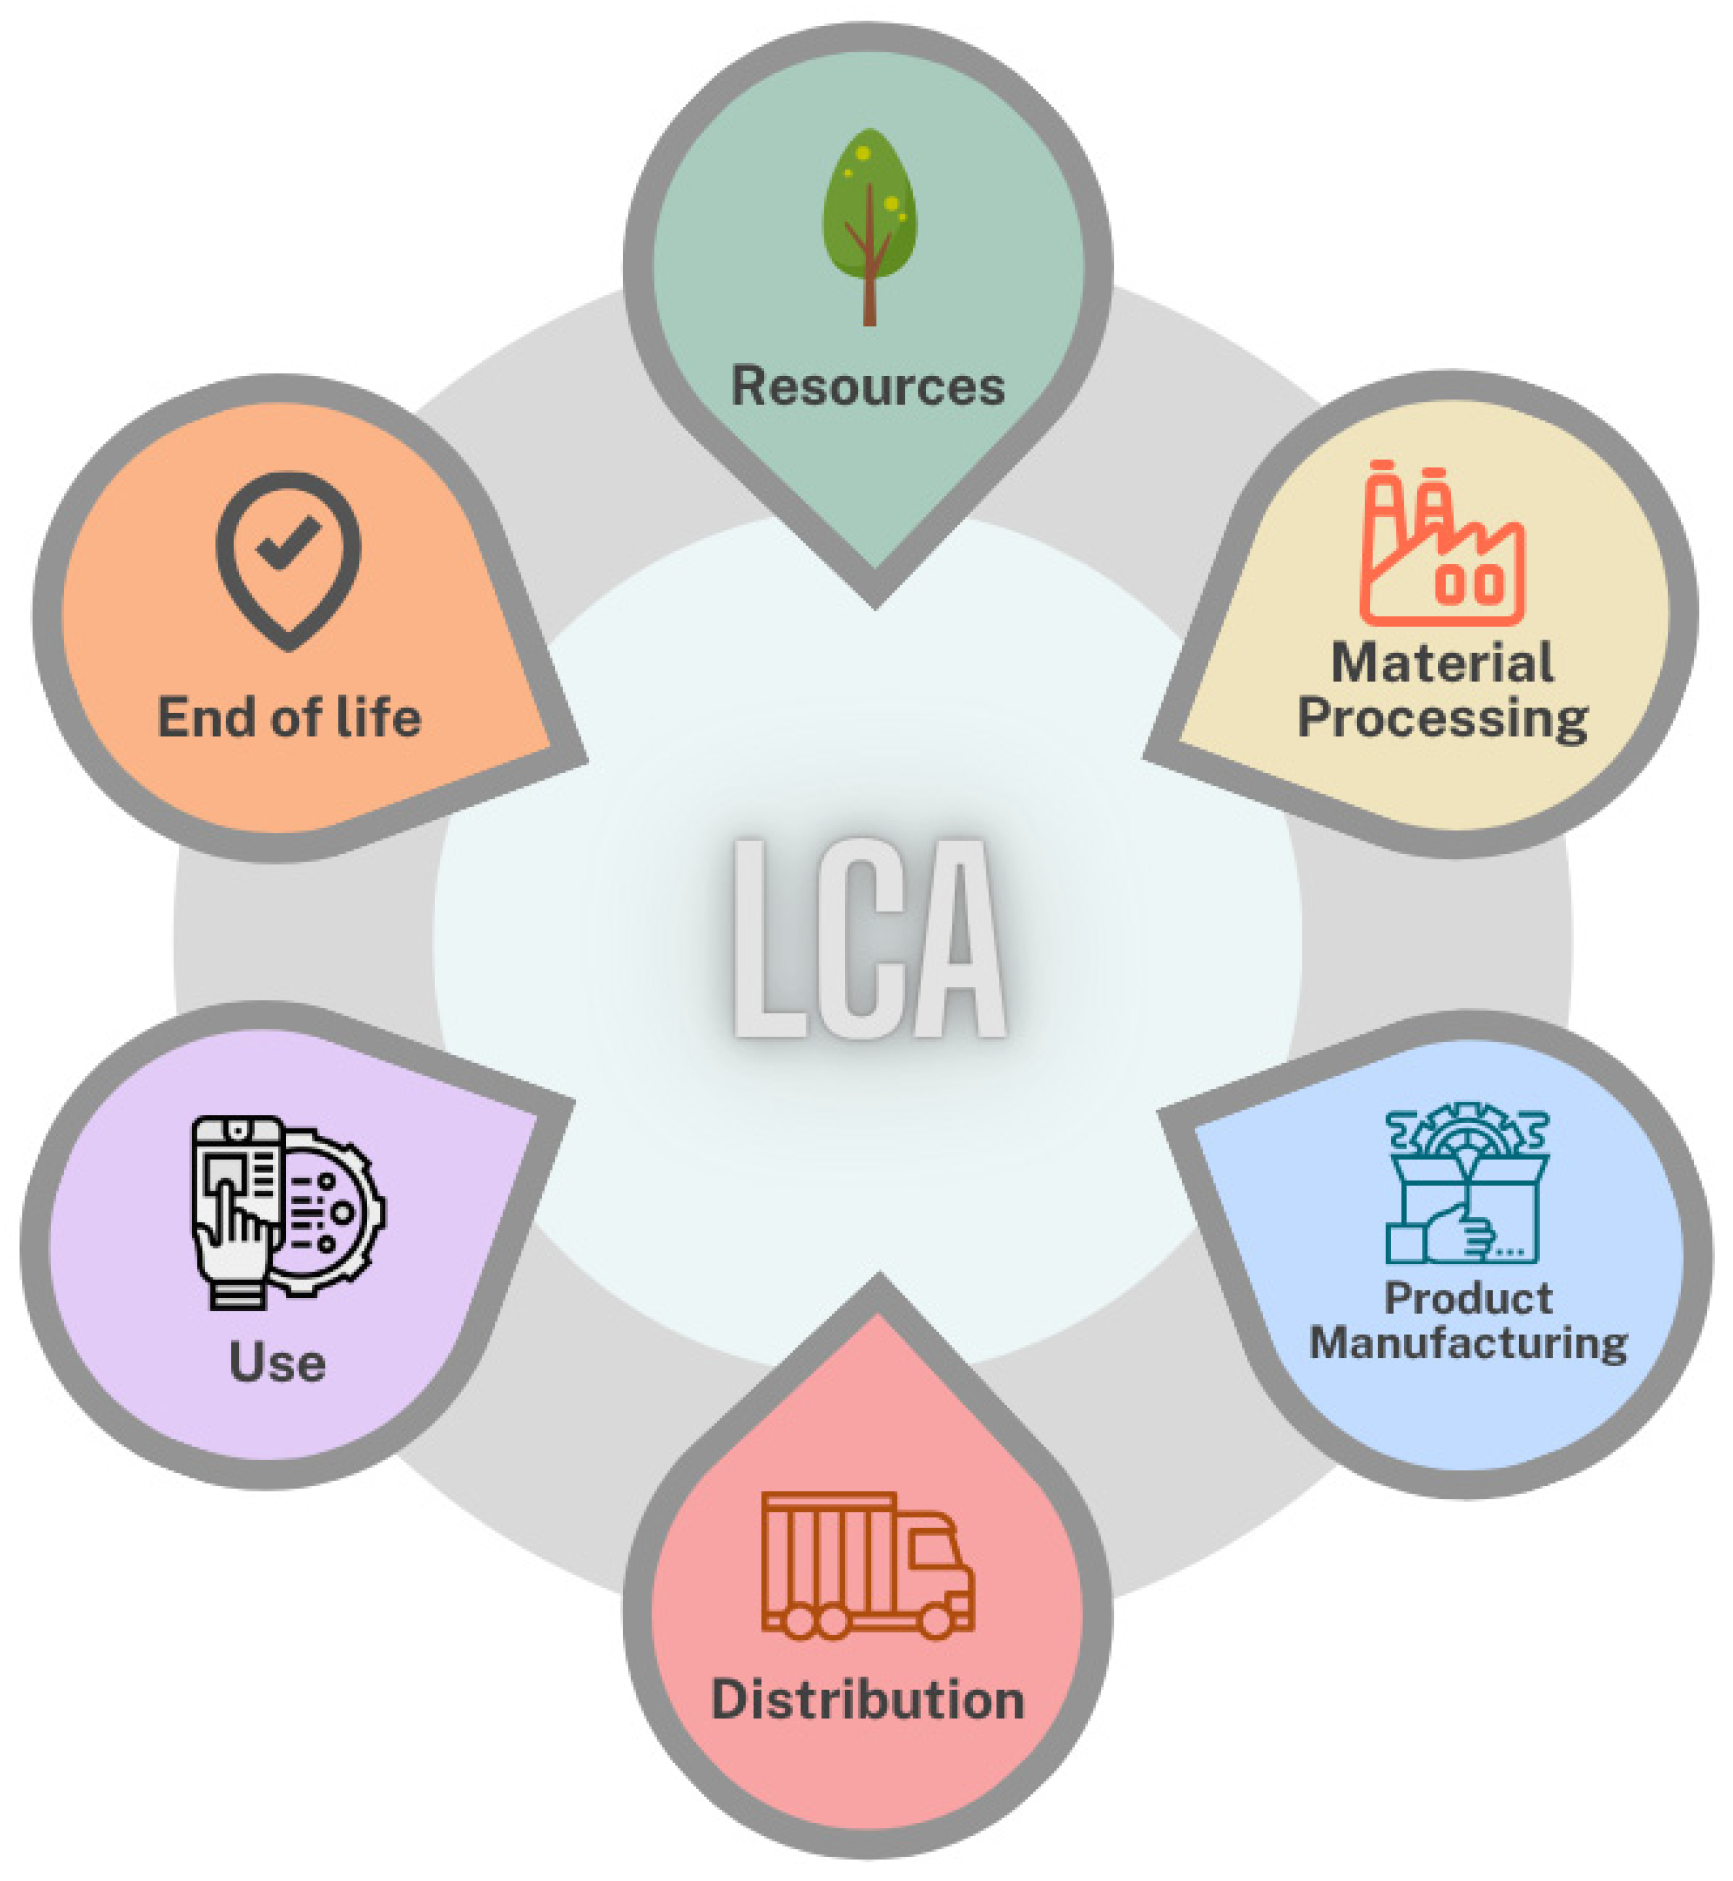
Figure 1. Life Cycle Assessment.
Jeta 03 00035 g001
Figure 2. Typical phases in the production of the 26 mm steel crown corks.
Jeta 03 00035 g002
Figure 3. LCA Methodology Phases.
Jeta 03 00035 g003
Figure 4. System boundaries and processes.
Jeta 03 00035 g004
Figure 5. Impact of Pollutants on Impact Categories—Human Health (DALY).
Jeta 03 00035 g005
Figure 6. Impact of Pollutants Effect of Pollutants on Impact Categories—Ecosystem Quality (PDF × m2 × yr).
Jeta 03 00035 g006
Table 1. Technical characteristics of metal ‘Crown cork’ caps with a diameter of 26 mm.
CapHeight (mm)Outer Diameter (mm)Metal Thickness (mm)Weight of Sheet (Dimensions 894 × 1038 mm) (kg)Weight of Cap (g)
26 mm (capped on bottle)6.00 ± 0.1532.1 ± 0.20.21 ± 0.011.532.0 ± 5%
The material predominantly used in the manufacture of metal closures is steel, although it is not the only material used. For the purposes of this analysis, the focus is limited to steel.
Disclaimer/Publisher’s Note: The statements, opinions and data contained in all publications are solely those of the individual author(s) and contributor(s) and not of MDPI and/or the editor(s). MDPI and/or the editor(s) disclaim responsibility for any injury to people or property resulting from any ideas, methods, instructions or products referred to in the content.