Abstract
Platform-enabled governance is reshaping destination management, yet subnational destinations still lack replicable dashboards that combine key performance indicators (KPIs) with efficiency analysis. This study examines whether a compact KPI stack coupled with longitudinal Data Envelopment Analysis (DEA) can provide actionable targets for destination development management and marketing organizations (DDMMOs). Using 2020–2024 administrative data for five regional units of the Peloponnese, an output-oriented CRS DEA model is specified with one input (room capacity) and two outputs (tourism revenue and overnight stays), complemented by a VRS specification that decomposes Overall Technical Efficiency into Pure Technical and Scale Efficiency. The results show a clear differentiation in trajectories: one regional unit remains consistently on the efficiency frontier, and others exhibit gradual convergence towards best practice, while at least one unit displays persistent underperformance that is driven primarily by scale rather than managerial inefficiency. These distances to frontier are transformed into proportional, output-specific targets and dynamically updated peer sets, which are integrated into a KPI dashboard to support a continuous measure–act–learn loop on pricing, promotion, and capacity allocation. Overall, the article proposes a transparent, reproducible template that links destination competitiveness frameworks with a multi-input, multi-output efficiency lens and embeds KPIs and dynamic DEA insights in a continuous governance loop for destination management.
1. Introduction
Destination management increasingly depends on digital infrastructures that coordinate public and private actors while safeguarding resident well-being and environmental limits [1]. Beyond traditional planning, destinations increasingly compete on how effectively they orchestrate the core elements of tourism by offering attractions, facilities and services, accessibility, destination image, and price, and they also compete over the speed with which they translate data into governance responses that prevent overtourism and sustain social licenses [2,3,4,5]. The smart tourism literature shows that platforms, analytics, and organizational capabilities are reshaping these coordination dynamics, with destination management/marketing organizations (DMMOs) shifting from campaign-centric roles to the orchestration of information flows and stakeholder collaboration [6,7,8,9]. At the same time, structural distinctions between self-contained and non-self-contained destinations, and the prevalence of co-creation and coopetition practices, continue to shape competitiveness strategies and branding outcomes [10,11,12,13,14,15,16,17]. In this context, the regional units of the Peloponnese represent an illustrative subnational destination system, combining coastal and inland tourism products under a single regional authority and shared strategic priorities, which makes them a suitable testbed for platform-enabled destination management.
Established frameworks provide the theoretical scaffolding for indicator choice and managerial action. Buhalis’ 6As profile the destination offering, while the World Economic Forum’s Travel and Tourism Development Index (TTDI) captures enabling conditions across sustainability, resources, infrastructure, policy, safety/hygiene, and the business environment [18,19,20,21,22,23,24,25,26,27,28,29,30]. Building on these, recent practice encourages KPI dashboards to create transparency across economic, social, and environmental dimensions [31,32,33,34,35,36] and to trigger timely policy adjustment [37,38,39,40]. However, single indicators cannot capture the inherently multi-input/multi-output nature of destination performance. Data Envelopment Analysis (DEA) provides a non-parametric method to benchmark relative efficiency without a pre-specified production function and to derive peer-referenced improvement targets [41,42,43,44,45,46,47,48,49,50], and applications range from national and sectoral studies to destination-level sustainability and competitiveness assessments [51,52,53]. Despite this progress, two gaps remain. First, prior studies rarely integrate theory-aligned KPI stacks (such as the 6As and TTDI) with DEA inside an operational governance loop that quantifies shortfalls and feeds targets back into platform-enabled decision processes and peer-learning mechanisms. Second, evidence for Greece is fragmented and predominantly subsectoral rather than destination level, limiting the decision usefulness of existing analyses for DDMMOs; even recent Greek work on KPIs and DEA as strategic planning tools [54,55,56,57,58,59] does not implement a dashboard-ready, subnational destination benchmark based on harmonized administrative data [60,61,62].
This article addresses these gaps by testing whether embedding DEA within a KPI dashboard grounded in the 6As and the TTDI enhances decision usefulness for destination managers. Using 2020–2024 panel data for five Peloponnesian regional units (Greece), the analysis examines three questions motivated by the literature: (RQ1) which units maintain efficiency over the 2020–2024 period, and how stable is the efficiency frontier [41,42,43]; (RQ2) what are the primary sources of efficiency shortfall and how do these sources evolve over time [41,42,43,51,52,53]; and (RQ3) what output-specific proportional uplifts and peer references are consistently required for underperformers, and how can these dynamic DEA targets be operationalized within a destination data platform to inform evidence-based DDMMO strategies [6,7,8,9,37,38,39,40]? Figure 1 links the visitor journey (pre-travel, on-site, post-travel), the 6As configuration of the destination offering, and a data platform stack emphasized in the smart tourism literature to show how data ingestion and governance flow into KPI visualization and managerial intervention [6,7,8,9,18,19,31,32,33,34,35].
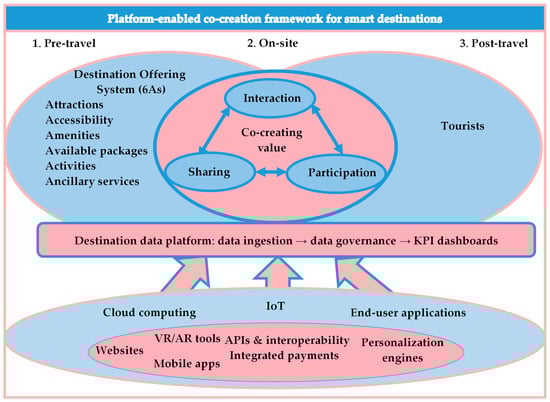
Figure 1.
Platform-enabled co-creation in smart destinations across the visitor journey (pre-travel, on-site, and post-travel). Source: Created by the authors, and grounded in smart tourism and smart DMO literature [6,7,8,9,31,32,33,34,35] and destination offering and competitiveness frameworks [18,19,30].
The contribution is twofold. Conceptually, the study aligns destination competitiveness frameworks (6As, TTDI, and related models) with a multi-input and multi-output efficiency lens to propose a measurable, platform-enabled governance approach for DDMMOs. Practically, it delivers a replicable template that integrates DEA outputs, namely efficiency scores, peer sets, and output-specific percentage uplifts, into dashboard-ready targets for destination-level management in Greece, with the intention that these tools support ongoing peer-learning and governance automation. While the empirical focus is subnational, the methodology generalizes and can be replicated at national or multi-regional scales (countries or destination systems) using public administrative data.
2. Literature Review
2.1. The Role of DDMMOs in the Destination Management Process
Destination management is increasingly understood as a platform-enabled coordination task in which multiple actors align through shared information infrastructures to deliver a coherent visitor experience while safeguarding resident well-being and environmental limits [1]. Beyond traditional planning, destinations compete on how effectively they orchestrate five interdependent components (attractions, facilities, services and infrastructure, accessibility, and destination image and price), ensuring that improvements in one dimension are not offset by bottlenecks elsewhere [2]. As market pressures intensify, destinations that institutionalize data-informed governance, including regular outcome measurement, sensing of emerging trends, and stakeholder alignment, are better positioned to prevent overtourism and maintain social license [3,4]. This logic underpins “smart governance” in tourism, where digital infrastructures and analytics reconfigure coordination between public and private actors and enable adaptive policy responses [5,6,7]. In this setting, platform-enabled tools, such as KPI dashboards and data analytics, become not only reporting devices but core technologies for steering destination development.
Within this shift, destination management/marketing organizations (DMMOs) are evolving from campaign-centric marketing units to platform orchestrators that convene stakeholders, steward data flows, and translate dashboard insights into operational and policy adjustments [8,9]. In several contexts, this evolution is framed as the transition from destination management organizations toward destination development, management, and marketing organizations (DDMMOs) with expanded mandates and digital capabilities [10]. Evidence from digital service research further shows that website quality and immersive tools strengthen destination image and intention to engage with novel environments such as the metaverse, underscoring the strategic role of DDMMOs in curating the platform layer of the destination [11]. These findings position the now evolved DDMMOs as natural users and governors of destination data platforms in which KPIs, efficiency metrics, and decision rules can be embedded.
These developments do not negate foundational distinctions among destination types. Self-contained destinations, where tourism is a primary economic activity, tend to offer a complete bundle of products and services with clearer administrative boundaries and brand identity, and competitiveness is mediated by travelers’ perceptions of that bundle [12,13]. Non-self-contained destinations treat tourism as complementary to other productive activities and often follow non-touristic development logics, which condition governance priorities and data needs [14]. Across both types, co-creation and coopetition function as core coordination mechanisms: they enable shared learning, reduce transaction costs for joint initiatives, and support continuous innovation in the visitor offering [15,16,17]. For regional systems such as the Peloponnese, these mechanisms operate across coastal and inland areas, reinforcing the need for shared indicators and benchmarking tools that can be coordinated through a common platform.
Theoretically, this platform-orchestration view of DMMOs can be situated within established destination competitiveness models that the present study later operationalizes. Buhalis’ 6As (attractions, accessibility, amenities, available packages, activities, and ancillary services) provide a modular architecture of the supply-side offering to be measured and improved, the Travel and Tourism Development Index (TTDI) captures enabling conditions that regulate frictions along the visitor journey (infrastructure, policy, safety/hygiene, business environment, and sustainability) [18,19,20,21,22,23,24,25,26,27,28,29,30], and smart destination scholarship explains how data infrastructures and analytics convert these architectures into ongoing coordination and feedback [31,32,33,34,35]. In the design adopted here, DDMMOs sit at the nexus of these strands: they curate the 6As bundle, monitor TTDI-consistent conditions via KPIs, and use the platform layer to implement and evaluate interventions [5,6,7,8,9,18,19,30,31,32,33,34,35]. This theoretical anchoring motivates the measurement choices and the governance loop depicted in Figure 1 and provides the conceptual bridge between smart destination ideas and the use of DEA-based efficiency metrics in a dashboard environment.
Building on this theoretical scaffold, the next subsection (Section 2.2) specifies how competitiveness frameworks (6As, TTDI, and related models) inform KPI selection and why DEA is appropriate to integrate multiple indicators into peer-referenced efficiency benchmarks that are actionable within the DDMMO platform.
2.2. Capturing Destination Performance
Selecting and interpreting destination KPIs requires explicit theoretical scaffolding. Two lenses remain foundational: Buhalis’ 6As, which profile the modular architecture of the destination offering [19], and the World Economic Forum’s Travel and Tourism Development Index (TTDI), which captures enabling conditions across sustainability, resources, infrastructure, policy, safety/hygiene, and the business environment to guide medium- and long-term strategy [30]. In parallel, Porter’s diamond, adapted from national and regional competitiveness to places, structures analysis around demand conditions, related and supporting industries, firm strategy, structure and rivalry, and factor endowments [18,20,21,22,23,24,25]. Tourism-specific competitiveness models (De Keyser and Vanhove; Dwyer et al.; Dwyer and Kim; Ritchie and Crouch) integrate resources and attractions with supporting activities, management methods, demand conditions, situational factors, and quality of life, offering comprehensive architectures within which performance can be situated and compared [26,27,28,29]. Taken together, these frameworks indicate which aspects of the destination system should be monitored, and they provide the conceptual basis for selecting a core set of KPIs for platform-based governance.
Within a platform-centric governance logic, these frameworks become actionable once they are translated into KPI dashboards that track economic, social, and environmental outcomes. Destination-level systems typically monitor digitalization and resident–visitor interfaces, support for eco practices, resource intensity, and local value added, enabling early detection of imbalances and timely policy adjustment [37,38]. A pragmatic scaffold groups indicators into four sustainability pillars: local economy, resident support, workforce satisfaction, and environmental health, while KPI adoption is also linked to progress on the UN SDGs [39,40]. Given the growing role of the platform layer, digital engagement metrics are increasingly material, which is consistent with evidence that DDMMO website quality and immersive tools shape destination image and behavioral intention [11]. KPI salience is segment-specific: for example, coastal destinations often hinge on natural attractions, accommodation capacity, and accessibility, which jointly condition demand formation and positioning [36]. This theory-driven selection enhances construct validity and, crucially for DDMMOs, aligns what is measured with what can be managed. It also clarifies that not all theoretically relevant dimensions need to be modeled within DEA, as some can remain dashboard indicators that contextualize efficiency scores.
Single indicators cannot resolve the inherently multi-input and multi-output nature of destination performance. Data Envelopment Analysis (DEA) offers a non-parametric benchmarking approach that evaluates relative efficiency without a pre-specified production function, accommodates multiple inputs and outputs, and can be oriented either to maximize outputs for a given capacity or to minimize inputs for given outcomes [41,42,43]. Applications span national tourism efficiency, hotel and subsector productivity, and pricing diagnostics linked to electronic word of mouth [44,45,46,47,48,49,50]. At the destination scale, studies in urban sustainability, cultural heritage, and smart destinations demonstrate DEA’s relevance for policy-oriented benchmarking and target setting [51,52,53]. For Greece, however, evidence remains comparatively scarce and fragmented: prior work emphasizes regional hotel efficiency, decentralized development needs, the managerial value of DEA, and technical efficiency in wine tourism, highlighting the practical gap for destination-level analyses by DDMMOs [54,55,56]. Recent Greek research that combines KPIs and DEA for tourism planning [59] reinforces the potential of this pairing but still operates at a more aggregated or sectoral level and does not embed DEA outputs in a dashboard-ready governance loop for a coherent system of subnational destinations.
The literature, therefore, supports a two-layer approach pursued here: (i) use established competitiveness frameworks (diamond, 6As, TTDI, and related tourism models) to structure a theory-aligned, platform-enabled KPI dashboard, and (ii) apply DEA to integrate those indicators into peer-referenced efficiency benchmarks that translate “distance to frontier” into proportional, output-specific improvement targets. In the present study, these frameworks guide the construction and interpretation of the KPI dashboard, while the DEA model focuses on capacity-to-demand efficiency based on room capacity and demand-side outputs (tourism revenue and overnight stays); extensions could incorporate additional 6As and TTDI-related variables, as well as undesirable outputs, into more elaborate DEA formulations. This pairing yields transparent targets and governance feedback loops consistent with smart destination and sustainability objectives and provides the conceptual foundation for the empirical framework tested at the destination level in Greece.
2.3. Study Area: Peloponnese Regional Units
The empirical analysis focuses on the five regional units of the Peloponnese Region in southern Greece—Argolis, Arcadia, Corinthia, Laconia, and Messenia. Geographically, the Peloponnese forms a large peninsula connected to mainland Greece via the Isthmus of Corinth and is characterized by an extensive coastline, mountainous inland areas, and a network of small- and medium-sized cities and towns. The selected regional units combine coastal zones with strong tourism orientation and interior areas where tourism is more closely linked to rural landscapes, cultural heritage, and nature-based activities, drawing on harmonized regional statistics on accommodation capacity and tourism flows [60,61,62]. Administratively, they fall under a single regional authority that is responsible for coordinating development priorities and destination branding, which provides a coherent governance frame for subnational benchmarking and regional strategy implementation [61,62].
Tourism in the Peloponnese exhibits a diversified profile that reflects this geography. Coastal areas in Argolis, Corinthia, Laconia, and Messenia host predominantly sun-and-sea tourism, resort and second-home development, and a mix of domestic and international visitors, consistent with broader patterns documented for Mediterranean coastal destinations [60]. Cultural and heritage tourism is anchored in historic towns and archeological sites, Byzantine and Venetian monuments, and traditional settlements, attracting short breaks and educational visits throughout the year [61]. Mountainous and rural parts of Arcadia and the hinterlands of the coastal units sustain nature-based tourism, outdoor recreation, and emerging forms of agritourism and wine tourism linked to local agricultural production [62]. Religious, gastronomic, and event-based tourism complement this portfolio, leading to marked seasonal patterns and differences in demand intensity across the five regional units, as reflected in regional statistics on arrivals, overnight stays, and revenue [57,58,60,62].
From a destination management perspective, these characteristics make the Peloponnese regional units a suitable testing ground for a dashboard-oriented, DEA-based framework. They share common regional branding and policy priorities but differ in product mix, capacity, and demand levels, allowing relative efficiency to be meaningfully compared [61]. At the same time, all units are covered by a unified system of administrative statistics on accommodation capacity and tourism flows, which facilitates the construction of a consistent input–output dataset for subnational benchmarking [57,58,60]. The combination of coastal and inland tourism products, varied degrees of specialization, and a common regional governance structure aligns with the platform-enabled, DDMMO-centered approach adopted in this study and provides a realistic context in which KPI dashboards and efficiency metrics can support coordinated decision-making and regional development policies [5,7,9,10,11,60,61,62].
3. Methodology
The study’s main methodological tool is Data Envelopment Analysis (DEA), used to benchmark the relative efficiency of the Peloponnesian regional units and to generate dashboard-ready improvement targets aligned with the study’s research questions. DEA is appropriate because destination performance is inherently multi-input and multi-output, and destination managers typically aim to raise outcomes for a given capacity; for this reason, the present study adopts an output-oriented specification that is consistent with the strategic focus on demand generation and utilization of existing room stock. Given the objective to analyze temporal stability and scale effects, the analysis uses an annual, output-oriented model over the 2020–2024 period and computes two sets of efficiency scores for robustness: Constant Returns to Scale (CRS) is used as the baseline technology to capture Overall Technical Efficiency, and Variable Returns to Scale (VRS/BCC) checks for Pure Technical Efficiency. Scale efficiency scores and returns to scale classifications derived from the CRS and VRS runs are reported and interpreted in the empirical section to document whether units operate under increasing, constant, or decreasing returns to scale.
The decision-making units (DMUs) are the five regional units of the Peloponnese (Greece). Indicators refer to the five-year panel period (2020–2024) and were created by the authors, using consistent administrative data from the Greek Tourism Confederation (INSETE) (accommodation capacity and tourism revenue) and the Bank of Greece (tourism flows) [57,58]. Source tables were harmonized (naming, units), year coverage was verified, and no imputation was required. To minimize redundancy and keep the outputs directly interpretable for managers, the analysis uses one capacity input and two demand-side outputs: the input is room capacity (annual average available rooms), and the outputs are tourism revenue and overnight stays (annual totals). This choice explicitly focuses the DEA block on capacity-to-demand efficiency, while other dimensions highlighted by competitiveness and smart destination frameworks (for example, accessibility, amenities, and environmental indicators) remain in the wider KPI dashboard rather than being modeled within the production technology. Bed occupancy is used only descriptively (to interpret underutilization and seasonality) and is not included among optimization targets to avoid collinearity with level outputs. The constraints imposed by a small number of decision-making units (n = 5) remain; however, by using a five-year longitudinal panel instead of a single cross-section, the analysis moves beyond a single-year snapshot. The model is now positioned as a longitudinal diagnostic tool that is capable of identifying patterns and the stability of efficiency over time, which enhances discrimination power by highlighting consistent performance or persistent inefficiency.
The CRS, output-oriented DEA, is estimated in the standard envelopment form. For a focal destination 0 with input vector and output vector , the problem maximizes a common output expansion factor subject to feasibility against a convex combination of peers:
Under CRS, the efficiency score is (frontier = 1 or 100%). For each output , the proportional uplift required to reach the frontier equals . The reference (peer) set for DMU 0 consists of those units with . The full formal specification and notation for auditability are reproduced in Appendix A, including the primal formulation with explicit slack variables and the corresponding dual.
Implementation followed a transparent pipeline: assemble and harmonize the 2020–2024 panel dataset from [57,58], construct the input and outputs and validate distributions; solve the CRS and VRS output-oriented models for each DMU and for each year and record , , output-specific uplifts, and peer weights to check primal and dual feasibility and slacks; and export per-DMU and per-year metrics (efficiency, target uplifts, and peer references) to the KPI dashboard. The model is a linear program and can be reproduced with the solver module in Excel, relevant applications like Fronter Analyst (Version 4.0 was used in this study), widely used software in R (for example, Benchmarking, deaR), Python (for example, pyDEA), GAMS, and equivalent simplex implementations using the constraints above [41,42]. Numerical tolerances of were sufficient for stable peer identification. The data sources are public [57,58], and the exact variable definitions match those reported here.
Including occupancy as an additional output did not materially change frontier results (as expected due to redundancy), and leave-one-out checks confirmed that no single DMU unduly shaped the frontier. These diagnostics align with best practice for tourism DEA applications [41,42,43,51,52,53]. More advanced robustness procedures, such as bootstrap bias correction, cross efficiency analysis, super efficiency models, and two stage (for example, Simar–Wilson type) specifications, are recognized as relevant extensions but are beyond the scope of this five-unit, one-year pilot design, and they are, therefore, discussed as methodological avenues for future work rather than implemented in the present empirical analysis.
It should be stated that DEA is deterministic and evaluates relative efficiency within this five-unit, one-year sample, and it does not model random noise or exogenous shocks. Therefore, interpreting scores as diagnostic targets should be combined with micro-KPIs (seasonality, campaign return on investment, and product mix) before operational deployment. The study uses public, aggregate data and does not involve human or animal subjects, and no ethics approval was required. Environmental and social aspects discussed in the literature review enter the analysis through the surrounding KPI dashboard and governance interpretation rather than as explicit undesirable outputs in the DEA block; modeling such undesirable outputs in directional or slacks-based DEA is identified as a promising extension in the limitations section.
4. Results
4.1. Temporal Evolution of Overall Technical Efficiency (CRS)
The analysis of Overall Technical Efficiency (CRS) reveals a spectrum of performance stability across the regional units. Argolis is the sole unit that consistently defined the efficiency frontier, achieving a 100% Technical Efficiency score in every year from 2020 to 2024, underscoring its stable operational excellence and serving as the primary benchmark for the region. Conversely, Arcadia persistently lagged, exhibiting the lowest Technical Efficiency across the entire period, with scores ranging narrowly from a maximum of 61.80% (2020) down to a minimum of 46.89% (2023). This sustained, deep inefficiency signals a structural, unresolved mismatch between capacity and generated demand. A distinct positive temporal trend is observed in Corinthia, which commenced the period with low efficiency at 75.23% in 2020 but demonstrated successful convergence towards the frontier, culminating in near-perfect scores of 99.67% in 2022 and 98.95% in 2023 before slightly receding to 93.16% in 2024. Messenia remained close to the frontier throughout, with full efficiency in 2020 and 2022 and high, but slightly sub-frontier, scores in 2021 (93.53%), 2023 (97.47%), and 2024 (96.44%), indicating generally effective use of capacity with modest, recurring scope for improvement. Finally, Laconia exhibited significant performance volatility, achieving 100% efficiency in 2021 and 2024 but dropping substantially to 85.47% in 2022, suggesting that while the potential for efficiency exists, the unit’s success is not consistently sustained year-over-year.
The corresponding efficient frontiers, which reflect these Technical Efficiency patterns in terms of tourism revenue and overnight stays, are depicted in Figure 2.
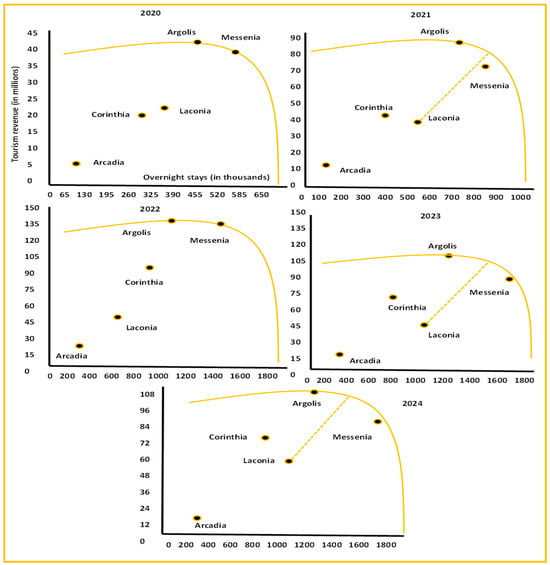
Figure 2.
Efficient frontiers assuming CRS.
4.2. Decomposing Inefficiency: Pure Technical vs. Scale Effects
Decomposition of the Technical Efficiency score using the Variable Returns to Scale (VRS) model identifies the critical sources of efficiency shortfall. A key diagnostic finding is the consistent nature of inefficiency for the major laggard: Arcadia achieved 100% Pure Technical Efficiency (VRS) in all five years, meaning its observed inefficiency is almost entirely attributable to operating at a sub-optimal scale (Scale Efficiency is numerically very close to the CRS score in all years). This indicates that Arcadia’s internal management and utilization of existing capacity are technically sound relative to its peers of similar size, but the unit’s overall scale is fundamentally incorrect for maximizing output. Messenia’s occasional shortfalls in 2021, 2023, and 2024 were also purely scale-driven, as it maintained 100% PTE in those years. In contrast, Corinthia initially suffered from mixed inefficiency in 2020 (PTE of 77.78%), indicating both managerial and scale problems, but successfully addressed the internal utilization issues by achieving 100% PTE from 2022 onward. Laconia’s dip in 2022 reflected a mixture of both Pure Technical Inefficiency (PTE of 97.31%) and Scale Inefficiency (88%), confirming that it requires attention to both internal management and optimal size. Analysis of the returns to scale reveals that the majority of units, including Arcadia and Corinthia, consistently operated under decreasing returns to scale (DRS), suggesting they are operating above their most productive scale size. Conversely, Messenia frequently exhibited Increasing Returns to Scale (IRS), indicating potential benefits from measured expansion to reach the optimal scale.
4.3. Longitudinal Uplift Targets and Dynamic Peer Sets
The DEA model translates the time-varying “distance to frontier” into specific output targets required for annual efficiency. The targets for inefficient units show high inter-annual variability, necessitating a dynamic dashboard approach. The largest required uplift observed was for Arcadia in 2022, demanding a 147.50% increase in tourism revenue and a 99.80% increase in overnight stays to achieve the CRS frontier, underscoring the severity of the capacity–demand mismatch. This contrasts sharply with Corinthia, where the required increase dropped precipitously from 32.90% in 2020 to a minimal 0.30% in 2022, which is consistent with its trajectory of efficiency convergence. The composition of the peer set—the efficient units (DMUs) that serve as dynamic benchmarks—also changes annually, reinforcing the need for continuous target recalibration. For instance, while Arcadia’s sole peer in 2020 was Messenia, by 2024, its efficiency target was a composite projection based on the performance of Argolis and Laconia. These fluctuating peer sets and targets convert efficiency diagnostics into specific, measurable, and dynamically updated goals for DDMMO teams.
4.4. Substantive Interpretation Against Prior Literature
The pattern in Table 1 and Figure 2 is consistent with theory and prior evidence. First, frontier performance suggests tighter alignment of the 6As bundle, especially attractions, amenities, and accessibility, with market demand, supporting higher utilization at a given room capacity [19,31,32,33,34,35]. From a TTDI perspective, enabling conditions (infrastructure, policy, safety/hygiene, and business environment) likely reduce frictions along the visitor journey [30]. Conversely, shortfalls in the inefficient regional units align with under-utilization typically observed when one or more “As” are binding (for example, accessibility or product packaging) or when seasonality compresses demand [19,30,36]. This pattern is also consistent with smart destination perspectives that emphasize the data-driven orchestration of accessibility, amenities, and demand across interconnected places [31,32,33,34,35].

Table 1.
DEA results.
Second, the composition of peer sets matches DEA benchmarking logic: efficient units serve as realistic comparators, and proportional output increases derive mechanically from the frontier projection [41,42,43]. Destination-scale applications report similar use of DEA to surface sustainability and competitiveness gaps and to quantify improvement paths [51,52,53]. Compared with recent Greek research that combines KPIs and DEA as a strategic planning tool at a more aggregated tourism scale [59], these results show how the same logic can be applied to a coherent system of subnational destinations and linked directly to an operational dashboard environment for DDMMOs.
Third, relative to Greece-focused studies that emphasize sectoral efficiency (hotels, restaurants, and wine tourism) and advocate geographically tailored strategies [54,55,56], the proposed destination-level lens converts diagnostic gaps into implementable actions through dashboard integration (campaign ROI tracking, channel mix, and seasonality smoothing), thereby operationalizing the “measure–act–learn” loop recommended in KPI practice [37,38,39,40].
5. Discussion
The findings address the study’s expanded longitudinal objectives directly. The annual DEA scores for 2020–2024 indicate that only one regional unit maintains stable frontier efficiency (Argolis), while the others exhibit varying degrees of temporal volatility or persistent shortfalls in capacity utilization. The required percentage uplifts implied by the model, ranging from minor annual adjustments to substantial increases (up to 147.50% in Arcadia in 2022), translate relative efficiency over time into actionable, peer-referenced management targets for the DDMMOs. Embedding these dynamic targets in a KPI dashboard supports a continuous measure–act–learn feedback loop consistent with smart DMO and platform-enabled governance approaches.
Set against prior research, the pattern of results is broadly consistent with the modular logic of the 6As and the multi-factor perspective of the TTDI. Efficient destinations appear to combine a well-configured offering and accessibility with effective orchestration of demand, rather than merely larger room stock [19,30]. Argolis’s stable frontier performance suggests a consistent alignment of its 6As bundle (attractions, amenities, accessibility, etc.) with market demand, supported by effective enabling conditions (TTDI) that reduce friction along the visitor journey. Corinthia’s observable trend of convergence from 75.23% in 2020 to near-efficiency by 2023 suggests that targeted DDMMO strategies related to the orchestration of the destination offering and improvement in operational practices were effective over the period. By contrast, the larger gap observed for Arcadia points to deficits in selected “As” (for example, accessibility or amenities) and to capacity–demand mismatches that are documented as structural competitiveness constraints in the literature [18,19,27,28,29,31,32,33,34,35]. This interpretation is in line with destination-scale DEA studies that link underperformance to bottlenecks in access, product packaging, and seasonality rather than to capacity alone [51,52,53]. At the same time, the reliance on one capacity input and two demand-side outputs means that the present framework should be read as a capacity-to-demand efficiency lens, and not as a full representation of performance.
Methodologically, the study’s use of DEA is consistent with international applications in tourism that capture technical efficiency without assuming a specific production function and that produce peer-referenced targets for decision makers [41,42,43,51,52,53]. The main added value lies in situating these longitudinal DEA outputs within an operational platform environment and linking them explicitly to KPI goal setting and policy feedback across multiple years. This dynamic integration is largely missing from Greek literature, where DEA has been used mainly at the subsector level (hotels, food service, and wine) or at more aggregated tourism scales [54,55,56]. Recent Greek research that combines KPIs and DEA as a strategic planning tool for destinations [59] reinforces the potential of this pairing, but it does not embed efficiency scores, peer sets, and uplift targets inside a dashboard-ready governance loop for a coherent group of subnational destinations. By contrast, the present study converts distance to frontier into a set of trackable, output-specific uplifts and named peers that can be visualized and monitored in a destination data platform.
Theoretically, the results bridge three strands. First, the 6As provide a design lens for configuring the supply-side bundle that is to be measured and improved. Second, the TTDI offers a composite framework of enabling conditions that regulate frictions along the visitor journey [18,19,30]. Third, DEA functions as a multi-input, multi-output efficiency method that translates observed input–output combinations into frontier-based benchmarks [41,42,43]. Taken together, these elements advance a measurable governance perspective for DDMMOs, in which competitiveness reflects not only resource endowments but also the capability to orchestrate data and coordinate stakeholders, with KPIs and DEA acting as complementary instruments inside a smart destination architecture [6,7,8,9,19,30,37,38,39,40].
The decomposition of technical inefficiency provides a critical managerial insight that extends beyond a single-year analysis. The finding that Arcadia’s severe inefficiency coincides with 100% Pure Technical Efficiency (VRS) over 2020–2024 indicates that its shortfall is driven predominantly by scale effects rather than by internal management weaknesses (Scale Efficiency is numerically very close to the CRS score in all years). This diagnosis suggests that the DDMMO’s internal resource utilization and management practices are technically sound, but the unit’s overall scale of operation (capacity) is fundamentally mismatched to the demand it can attract. Policy recommendations for Arcadia should therefore focus less on micro-optimizations (like pricing or campaign timing) and more on structural interventions: either significant demand stimulation (for example, new product lines and major cooperative campaigns) or an active rationalization of excess capacity to realign inputs with achievable outputs. This pattern aligns with destination-scale DEA studies that link underperformance to structural bottlenecks rather than management alone.
In contrast, the mixed inefficiency observed in units such as Corinthia (in 2020) and Laconia (in 2022) indicates that both internal management (Pure Technical Inefficiency) and scale must be addressed simultaneously. Corinthia’s later shift to 100% PTE demonstrates that focusing on internal operations and management practices can successfully resolve Pure Technical gaps over time, leaving only relatively modest scale adjustments. Laconia’s temporary dip in 2022, driven by both PTE and Scale Inefficiency, similarly points to the need for coordinated action on operational practices and the configuration of capacity.
From a managerial and public policy perspective, the temporal benchmarks support differentiated, risk-adjusted interventions. For stable frontier units like Argolis, which maintained 100% Technical Efficiency, the managerial priority is not improvement but stability and micro-optimization. The DMMO can use the platform dashboard to track granular leading indicators such as seasonality and digital engagement, ensuring that marginal gains in campaign timing and segmentation are pursued to defend the frontier against stochastic noise. Argolis also functions as the primary peer reference in regional learning mechanisms (coopetition), disseminating best practices in the orchestration of the 6As bundle and effective capacity utilization.
For units operating under persistent decreasing returns to scale (for example, Arcadia and, in most years, Corinthia), the Scale Efficiency results caution against indiscriminate capacity expansion: investment should prioritize quality and “soft” infrastructure digitalization, amenities, and workforce development over additional room stock. By contrast, Messenia’s frequent classification under Increasing Returns to Scale suggests that carefully targeted capacity expansion, coupled with improvements in accessibility and product packaging, could yield proportionally larger output gains.
The integration of DEA outputs into the destination data platform transforms governance by converting the static “distance to frontier” into dynamic, measurable management targets. Peer sets and λ-weights must be updated annually as the efficient frontier and its constituents fluctuate, ensuring that uplift targets remain realistic and auditable. These targets, expressed as proportional percentage increases (for example, +3.70% in overnight stays), should then be disaggregated and assigned to specialized operational teams, for instance, pricing teams focusing on average revenue per stay and promotion teams focusing on international bookings, thus operationalizing a continuous measure–act–learn–feedback loop for pricing, promotion, and capacity allocation.
The long-term DEA results, therefore, provide a clear justification for differentiated regional policy and funding. Regional authorities can use Scale Efficiency and returns-to-scale diagnostics to prioritize infrastructure and support measures: investment in hard infrastructure and capacity expansion is justified for IRS units, whereas for DRS units, investment should be channeled toward improving product quality, accessibility, and supporting services. By combining DEA-based targets with broader KPIs (digital engagement, resident support, and environmental indicators), regional authorities can align economic competitiveness objectives with broader sustainability and social policy goals.
Overall, the results suggest that the platformization of destination management can turn efficiency metrics from static diagnostics into everyday coordination and learning mechanisms. When embedded in a data platform, clear and auditable DEA-based targets can support a continuous cycle of measuring, intervening, evaluating, and feeding back, thereby aligning competitiveness objectives with broader sustainability and policy goals.
6. Conclusions
This study demonstrates how theory-aligned KPI dashboards, coupled with an output-oriented CRS DEA model applied across a five-year panel (2020–2024), can be embedded in destination data platforms to yield peer-referenced, actionable targets for subnational destinations [19,30,37,38,39,40,41,42,43]. The longitudinal analysis applied to five Peloponnese regional units reveals that only one unit maintains consistent 100% Technical Efficiency throughout the period, establishing the stable frontier, while the remaining units exhibit either significant performance volatility or persistent structural shortfalls in capacity utilization. In particular, the finding that one major laggard’s entire efficiency shortfall is driven exclusively by scale effects across all five years (100% Pure Technical Efficiency in the VRS model) is a crucial managerial insight for guiding resource allocation and strategic positioning. Translating distance to frontier into percentage uplift targets and explicit peer references converts diagnostic efficiency scores into operational guidance for pricing, promotion, and capacity allocation within a dashboard-driven governance loop for DDMMOs [6,7,8,9,37,38,39,40].
Theoretically, the findings advance a measurable governance perspective that links the 6As (destination offering) and the TTDI (enabling conditions) with DEA as a multi- input, multi-output efficiency framework [18,19,30,41,42,43]. This alignment connects destination competitiveness theory with day-to-day performance management by positioning DDMMOs as platform orchestrators that curate indicators, monitor distance to frontier, and coordinate responses across stakeholders [5,6,7,8,9,29,37,38,39,40]. In contrast to earlier Greek applications that focus mainly on sectoral efficiency (hotels, restaurants, and wine tourism) [54,55,56], and to recent work that combines KPIs and DEA at a more aggregated level [59], the present approach embeds DEA outputs directly in a destination-level dashboard for a coherent system of regional units. The empirical framework should therefore be interpreted explicitly as a capacity-to-demand efficiency lens, to be read alongside broader sustainability- and stakeholder-oriented KPIs rather than as a complete representation of destination performance.
The limitations are clear. The DEA model is deterministic and evaluates relative capacity-to-demand efficiency within this five-year-five-unit sample; it does not accommodate statistical noise or exogenous shocks, and it does not by itself capture the full spectrum of sustainability outcomes [41,42,43,51,52,53]. Consequently, the scores should be interpreted as diagnostic targets that must be combined with finer-grained KPIs and contextual knowledge before policy decisions are taken.
Future research should therefore introduce stochastic and bootstrapped DEA to assess score stability, enrich the input set (for example, staffing, transport access, and cost data) and outputs (for example, digital engagement and resident sentiment), and model seasonality and product mix heterogeneity [41,42,43,47,51,52,53]. Moreover, incorporating undesirable outputs, such as congestion or environmental pressures, into directional or slacks-based DEA would explicitly integrate sustainability into the efficiency frontier [46,51,52,53].
Overall, integrating KPIs with DEA inside a platform-enabled feedback loop can shift destination management from periodic reporting to continuous, evidence-based coordination. By providing realistic peer benchmarks, clear improvement targets, and transparent links between efficiency, competitiveness, and sustainability, the proposed framework offers a practical tool for DDMMOs, regional authorities, and national tourism organizations seeking to align destination performance with long-term competition and resident well-being [5,6,7,8,9,19,30,37,38,39,40,51,52,53].
Author Contributions
Conceptualization, G.T., I.A., S.V. and E.E.A.; methodology, G.T., I.A., S.V. and E.E.A.; validation, G.T., I.A., S.V. and E.E.A.; formal analysis, G.T., I.A., S.V. and E.E.A.; investigation, G.T., I.A., S.V. and E.E.A.; resources, G.T., I.A., S.V. and E.E.A.; data curation, G.T., I.A., S.V. and E.E.A.; writing—original draft preparation, G.T., I.A., S.V. and E.E.A.; writing—review and editing, G.T., I.A., S.V. and E.E.A.; visualization, G.T., I.A., S.V. and E.E.A. All authors have read and agreed to the published version of the manuscript.
Funding
This research received no external funding.
Data Availability Statement
The analysis can be conducted using raw data (inputs, etc.) from https://insete.gr/wp-content/uploads/2020/05/25-09_Peloponnese.xlsx (accessed on 14 September 2025) (Greek Tourism Confederation’s 2025 csv report for the Peloponnese).
Conflicts of Interest
The authors declare no conflicts of interest.
Appendix A. Formal Specification of the Output-Oriented DEA Model
This appendix provides the formal specification of the output-oriented, Data Envelopment Analysis (DEA) model used in Section 4.
Decision-Making Units (DMUs): The five regional units of the Peloponnese (Greece), observed over a five-year (2020–2024) panel dataset.
Variables:
- Input: Room capacity.
- Outputs: (i)Tourism revenue (annual total) and (ii) overnight stays (annual total).
Model (envelopment form; output orientation):
Output-Oriented DEA (Envelopment Form)
For a focal destination 0 with input vector and output vector , the CRS DEA problem is formulated as follows:
The efficiency score is given by (where frontier = 1 or 100%).
Values indicate proportional output shortfalls for the given capacity.
The reference (peer) set for DMU 0 consists of those with .
Targets and Shortfalls.
For each output , the proportional uplift required to reach the frontier is as follows:
These uplifts are those reported in Table 1 for tourism revenue and overnight stays.
Assumptions and Alternatives.
The CRS model assumes scale proportionality across DMUs. As a robustness check, a Variable Returns to Scale (VRS/BCC) specification can be estimated by adding the convexity constraint as follows:
from which Pure Technical Efficiency and Scale Efficiency are derived. Additional inputs (for example, staffing or cost variables) and outputs (for example, digital engagement or resident sentiment) can be incorporated in extended formulations, as discussed in the main text.
Computation.
The model is a linear program and can be implemented using standard DEA software or generic linear programming solvers (for example, Excel Solver, Frontier Analyst, R, Python, and GAMS). All results presented in Section 4 are reproducible with the public data sources, variable definitions, and model specification stated above.
References
- Edgell, D.L., Sr. Managing Sustainable Tourism: A Legacy for the Future, 3rd ed.; Routledge: London, UK, 2020. [Google Scholar]
- Morrison, A.M. Marketing and Managing Tourism Destinations, 2nd ed.; Routledge: London, UK, 2023. [Google Scholar] [CrossRef]
- Møgelhøj, H.v.M. Overtourism: The Role of Effective Destination Management; Business Expert Press: New York, NY, USA, 2021. [Google Scholar]
- Page, S.J. Tourism Management, 6th ed.; Routledge: London, UK, 2019. [Google Scholar] [CrossRef]
- Mandić, A.; Kennell, J. Smart governance for heritage tourism destinations: Contextual factors and destination management organization perspectives. Tour. Manag. Perspect. 2021, 39, 100862. [Google Scholar] [CrossRef]
- Gretzel, U.; Sigala, M.; Xiang, Z.; Koo, C. Smart tourism: Foundations and developments. Electron. Mark. 2015, 25, 179–188. [Google Scholar] [CrossRef]
- Gretzel, U. The Smart DMO: A new step in the digital transformation of destination management organizations. Eur. J. Tour. Res. 2022, 30, 3002. [Google Scholar] [CrossRef]
- Martins, C.A.; Carneiro, M.J.A.; Pacheco, O.R. Key factors for implementation and success of destination management systems: Empirical evidence from European countries. Ind. Manag. Data Syst. 2021, 121, 1287–1324. [Google Scholar] [CrossRef]
- Sorokina, E.; Wang, Y.; Fyall, A.; Lugosi, P.; Torres, E.; Jung, T. Constructing a smart destination framework: A destination marketing organization perspective. J. Destin. Mark. Manag. 2022, 23, 100688. [Google Scholar] [CrossRef]
- Katemliadis, I. Improving the Effectiveness and Efficiency of Destination Development, Management and Marketing Organisations (DDMMOs): A Systemic Approach. Ph.D. Thesis, Hellenic Open University, Patras, Greece, 2024. [Google Scholar] [CrossRef]
- Deirmentzoglou, G.A.; Vlassi, E.; Anastasopoulou, E.E. DDMMO website quality, destination image and intention to use metaverse platforms. Platforms 2024, 2, 180–192. [Google Scholar] [CrossRef]
- Koščak, M.; O’Rourke, T. (Eds.) Ethical and Responsible Tourism: Managing Sustainability in Local Tourism Destinations; Taylor & Francis: Abingdon, UK, 2023. [Google Scholar] [CrossRef]
- Jauhari, V. (Ed.) Managing Sustainability in the Hospitality and Tourism Industry: Paradigms and Directions for the Future; CRC Press: Boca Raton, FL, USA, 2014. [Google Scholar] [CrossRef]
- Legrand, W.; Chen, J.S.; Laeis, G.C. Sustainability in the Hospitality Industry: Principles of Sustainable Operations; Routledge: London, UK, 2022. [Google Scholar] [CrossRef]
- Giannopoulos, A.; Piha, L.; Skourtis, G. Destination branding and co-creation: A service ecosystem perspective. J. Prod. Brand Manag. 2021, 30, 148–166. [Google Scholar] [CrossRef]
- Melis, G.; McCabe, S.; Atzeni, M.; Del Chiappa, G. Collaboration and learning processes in value co-creation: A destination perspective. J. Travel Res. 2023, 62, 699–716. [Google Scholar] [CrossRef]
- Chim-Miki, A.F.; Batista-Canino, R.M. Development of a tourism coopetition model: A preliminary Delphi study. J. Hosp. Tour. Manag. 2018, 37, 78–88. [Google Scholar] [CrossRef]
- Evans, N. Strategic Management for Tourism, Hospitality and Events, 4th ed.; Routledge: London, UK, 2024. [Google Scholar]
- Buhalis, D. Marketing the competitive destination of the future. Tour. Manag. 2000, 21, 97–116. [Google Scholar] [CrossRef]
- Zhu, Z.; Isa, S.S.; Ramlan, M.A. Creative tourism competitiveness in Chongqing City using diamond model. Int. J. Bus. Technol. Manag. 2023, 5, 118–132. Available online: https://mysitasi.mohe.gov.my/journal-website/get-meta-article?artId=a89eeed7-611a-11ef-a699-005056a6a970&formatted=true#:~:text=This%20paper%20uses%20Porter%E2%80%99s%20diamond%20model%20to%20analyze,competitiveness%20of%20Chongqing%E2%80%99s%20cultural%20and%20creative%20tourism%20development (accessed on 26 September 2025).
- Mior Shariffuddin, N.S.; Azinuddin, M.; Hanafiah, M.H.; Wan Mohd Zain, W.M.A. A comprehensive review on tourism destination competitiveness (TDC) literature. Compet. Rev. 2023, 33, 787–819. [Google Scholar] [CrossRef]
- Faur, M.; Ban, O. Models of tourism destination competitiveness. In Proceedings of the 39th International Business Information Management Association (IBIMA), Seville, Spain, 30–31 May 2022. [Google Scholar]
- Bouchra, N.H.; Hassan, R.S. Application of Porter’s diamond model: A case study of tourism cluster in UAE. In Industry Clusters and Innovation in the Arab World; Emerald Publishing: Bingley, UK, 2023; pp. 129–156. [Google Scholar] [CrossRef]
- Purwaningsih, M.; Purwandari, B.; Sunarso, F.P.; Setiadi, F. Harnessing e-collaboration for rural tourism recovery after COVID-19: Dual analysis using SWOT and Porter’s diamond model. Emerg. Sci. J. 2021, 5, 559–575. [Google Scholar] [CrossRef]
- Fernando, I.N. Tourism amid Covid-19 pandemic in Sri Lanka: Way-forwarding strategies through the Porter’s diamond model. Sri Lanka J. Mark. 2021, 7, 22–45. [Google Scholar] [CrossRef]
- De Keyser, R.; Vanhove, N. The competitive situation of tourism in the Caribbean area: Methodological approach. Tour. Rev. 1994, 49, 19–22. [Google Scholar] [CrossRef]
- Dwyer, L.; Kim, C. Destination competitiveness: Determinants and indicators. Curr. Issues Tour. 2003, 6, 369–414. [Google Scholar] [CrossRef]
- Dwyer, L.; Mellor, R.; Livaic, Z.; Edwards, D.; Kim, C. Attributes of destination competitiveness: A factor analysis. Tour. Anal. 2004, 9, 91–101. [Google Scholar] [CrossRef]
- Ritchie, J.R.B.; Crouch, G.I. The Competitive Destination: A Sustainable Tourism Perspective; CABI: Wallingford, UK, 2003. [Google Scholar]
- World Economic Forum. Travel & Tourism Development Index 2024. Available online: https://www.weforum.org/publications/travel-tourism-development-index-2024/ (accessed on 26 September 2025).
- Agustan, R.; Rianse, U.; Sukotjo, E.; Faslih, A. Exploration and implementation of a smart tourism destination with the 6As framework & TOPSIS (Case Study: Wakatobi, Indonesia). Sci. Rev. Eng. Environ. Sci. 2024, 33, 419–442. [Google Scholar] [CrossRef]
- Zhandilla, B.D.; Shokhan, R.; Mamrayeva, D.G. Conceptual foundations of the category of tourist destination. Buketov Bus. Rev. 2022, 108, 135–143. [Google Scholar] [CrossRef]
- Muthuraman, S.; Al Haziazi, M. Smart tourism destination—New exploration towards sustainable development in Sultanate of Oman. In Proceedings of the 2019 5th International Conference on Information Management (ICIM), Cambridge, UK, 24–27 March 2019; pp. 332–335. [Google Scholar] [CrossRef]
- Boes, K.; Buhalis, D.; Inversini, A. Smart tourism destinations: Ecosystems for tourism destination competitiveness. Int. J. Tour. Cities 2016, 2, 108–124. [Google Scholar] [CrossRef]
- Baggio, R.; Micera, R.; Del Chiappa, G. Smart tourism destinations: A critical reflection. J. Hosp. Tour. Technol. 2020, 11, 407–423. [Google Scholar] [CrossRef]
- Hassan, M.K.; Mondal, A.K.M.G.R.; Saha, S.K. Factors affecting the choice of Cox’s Bazar sea beach of Bangladesh as a tourist destination. Int. J. Manag. 2013, 2, 1–28. [Google Scholar]
- Araújo, L. Measuring tourism success: How European National Tourism Organisations are shifting the paradigm. Worldw. Hosp. Tour. Themes 2022, 14, 79–84. [Google Scholar] [CrossRef]
- Gössling, S. New performance indicators for water management in tourism. Tour. Manag. 2015, 46, 233–244. [Google Scholar] [CrossRef]
- Crotts, J.C.; Magnini, V.P.; Calvert, E. Key performance indicators for destination management in developed economies: A four pillar approach. Ann. Tour. Res. Empir. Insights 2022, 3, 100053. [Google Scholar] [CrossRef]
- Hussain, S.; Ahonen, V.; Karasu, T.; Leviäkangas, P. Sustainability of smart rural mobility and tourism: A key performance indicators-based approach. Technol. Soc. 2023, 74, 102287. [Google Scholar] [CrossRef]
- Cooper, W.; Seiford, L.; Zhu, J. Handbook on Data Envelopment Analysis; Springer: New York, NY, USA, 2011. [Google Scholar]
- Emrouznejad, A.; Petridis, K.; Charles, V. Data Envelopment Analysis with GAMS. In International Series in Operations Research and Management Science; Springer: Cham, Switzerland, 2023. [Google Scholar] [CrossRef]
- Derpanis, D. Data Envelopment Analysis. Master’s Thesis, National Technical University of Athens, Athens, Greece, 2009. Available online: https://thesis.ekt.gr/thesisBookReader/id/18453?lang=el#page/82/mode/2up (accessed on 26 September 2025).
- Hadad, S.; Hadad, Y.; Malul, M.; Rosenboim, M. The economic efficiency of the tourism industry: A global comparison. Tour. Econ. 2012, 18, 931–940. [Google Scholar] [CrossRef]
- Soysal-Kurt, H. Measuring tourism efficiency of European countries by using data envelopment analysis. Eur. Sci. J. 2017, 13, 31–49. [Google Scholar] [CrossRef]
- Lozano-Ramírez, J.; Jiménez, M.A.; Lozano, S. A pre-pandemic data envelopment analysis of the sustainability efficiency of tourism in EU-27 countries. Curr. Issues Tour. 2023, 26, 1669–1687. [Google Scholar] [CrossRef]
- Nurmatov, R.; Lopez, X.L.F.; Millan, P.P.C. Tourism, hospitality, and DEA: Where do we come from and where do we go? Int. J. Hosp. Manag. 2021, 95, 102883. [Google Scholar] [CrossRef]
- Sigala, M. Using data envelopment analysis for measuring and benchmarking productivity in the hotel sector. J. Travel Tour. Mark. 2004, 16, 39–60. [Google Scholar] [CrossRef]
- Neves, J.C.; Lourenço, S. Using data envelopment analysis to select strategies that improve the performance of hotel companies. Int. J. Contemp. Hosp. Manag. 2009, 21, 698–712. [Google Scholar] [CrossRef]
- Boccali, F.; Mariani, M.M.; Visani, F.; Mora-Cruz, A. Innovative value-based price assessment in data-rich environments: Leveraging online review analytics through data envelopment analysis. Technol. Forecast. Soc. Chang. 2022, 182, 121807. [Google Scholar] [CrossRef]
- Wu, D.; Li, H.; Wang, Y. Measuring sustainability and competitiveness of tourism destinations with data envelopment analysis. J. Sustain. Tour. 2023, 31, 1315–1335. [Google Scholar] [CrossRef]
- Gómez-Vega, M.; Herrero-Prieto, L.C.; López, M.V. Clustering and country destination performance at a global scale: Determining factors of tourism competitiveness. Tour. Econ. 2022, 28, 1605–1625. [Google Scholar] [CrossRef]
- Wu, D.; Li, H.; Huang, Q.; Li, C.; Liang, S. Measurement and determinants of smart destinations’ sustainable performance: A two-stage analysis using DEA–Tobit model. Curr. Issues Tour. 2024, 27, 529–545. [Google Scholar] [CrossRef]
- Manasakis, C.; Apostolakis, A.; Datseris, G. Using data envelopment analysis to measure hotel efficiency in Crete. Int. J. Contemp. Hosp. Manag. 2013, 25, 510–535. [Google Scholar] [CrossRef]
- Karakitsiou, A.; Kourgiantakis, M.; Mavrommati, A.; Migdalas, A. Regional efficiency evaluation by input-oriented data envelopment analysis of hotel and restaurant sector. Oper. Res. 2020, 20, 2041–2058. [Google Scholar] [CrossRef]
- Mavrommati, A.; Pliakoura, A. Performance dynamics in Greek wine sector: A study of technical efficiency and strategic implications. Oper. Res. 2025, 25, 17. [Google Scholar] [CrossRef]
- Greek Tourism Confederation (SETE Intelligence). Regional & National Data. 2025. Available online: https://insete.gr/districts/?lang=en (accessed on 26 September 2025).
- Bank of Greece. Tourism—Travel Receipts and Overnight Stays. 2025. Available online: https://www.bankofgreece.gr/en/statistics/external-sector/balance-of-payments/travel-services (accessed on 26 September 2025).
- Varelas, S.; Tsoupros, G. Key Performance Indicators and Data Envelopment Analysis in Greek Tourism: A Strategic Planning Tool for Destinations and DMMOs. Sustainability 2024, 16, 3453. [Google Scholar] [CrossRef]
- Greek Tourism Confederation (SETE Intelligence). Annual Report on Greek Tourism 2023; SETE: Athens, Greece, 2024. Available online: https://insete.gr/studies/annual-report-of-greek-tourism-2023/?lang=en (accessed on 26 September 2025).
- Metaxas, T.; Karagiannis, D. Peloponnesus: A Unique Example of Unorthodox Regional Development: Can the Gastronomic Tradition Show the Right Path? Munich Personal RePEc Archive: Munich, Germany, 2015. Available online: https://mpra.ub.uni-muenchen.de/66829/ (accessed on 26 September 2025).
- Hellenic Statistical Authority. Hotels, Rooms for Rent and Tourism Campsites, 2023. Available online: https://www.statistics.gr/en/statistics/-/publication/STO12/2023 (accessed on 26 September 2025).
Disclaimer/Publisher’s Note: The statements, opinions and data contained in all publications are solely those of the individual author(s) and contributor(s) and not of MDPI and/or the editor(s). MDPI and/or the editor(s) disclaim responsibility for any injury to people or property resulting from any ideas, methods, instructions or products referred to in the content. |
© 2025 by the authors. Licensee MDPI, Basel, Switzerland. This article is an open access article distributed under the terms and conditions of the Creative Commons Attribution (CC BY) license (https://creativecommons.org/licenses/by/4.0/).