
Enabling Early Prediction of Side Effects of Novel Lead Hypertension Drug Molecules Using Machine Learning


Abstract
1. Introduction
1.1. Background
- Curating a dataset that links side effects of antihypertensive drugs to their chemical and molecular properties.
- Developing and evaluating machine learning models—random forest, gradient boosting, and XGBoost—for side effect prediction.
- Using the developed AI-based prediction model to analyse the side effect profile of a set of computationally synthesised novel lead hypertension drug molecules.
1.2. Related Work
2. Experimental Results and Discussion
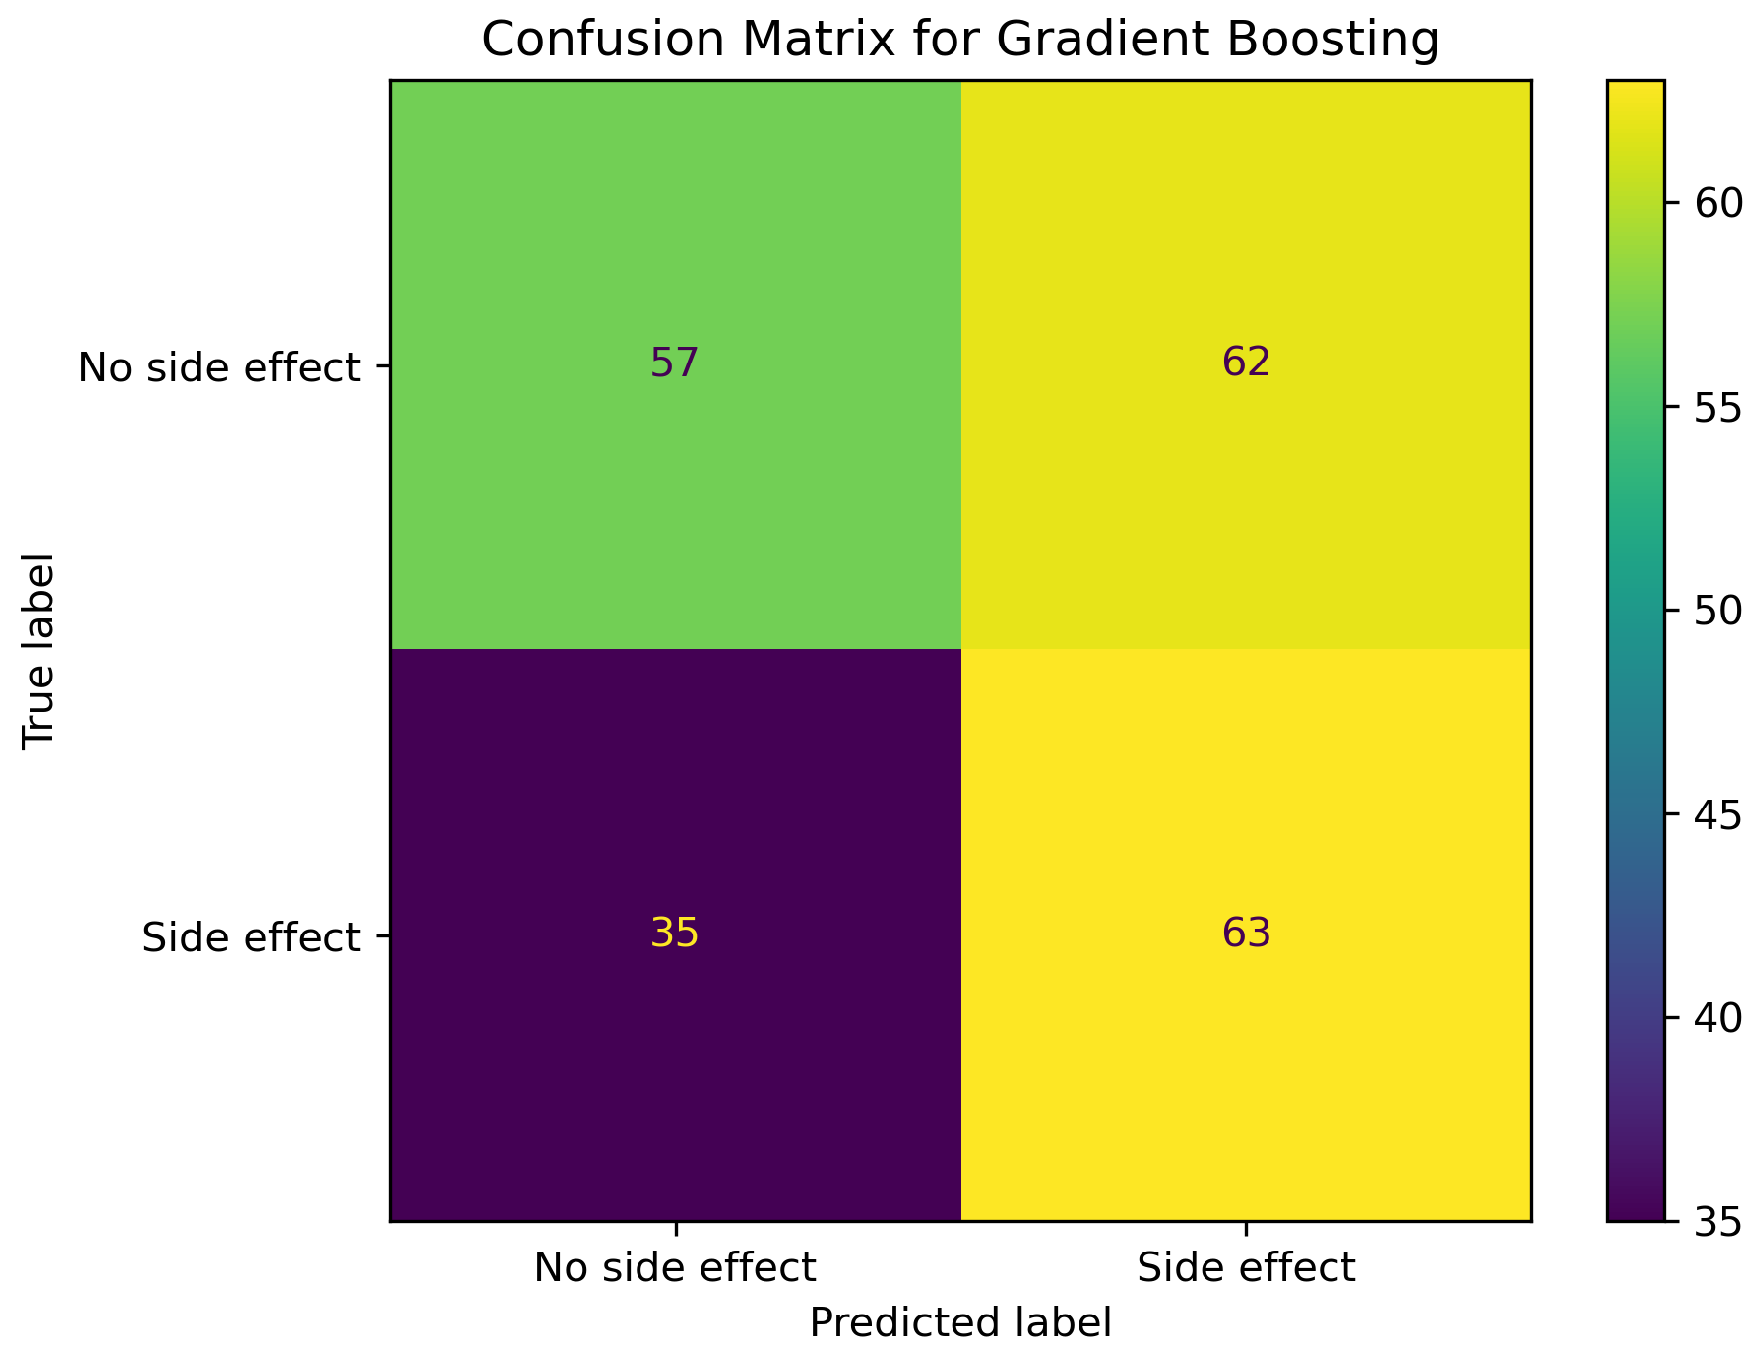
2.1. Model Performance Comparison
2.2. Impact of SMOTE on Model Performance

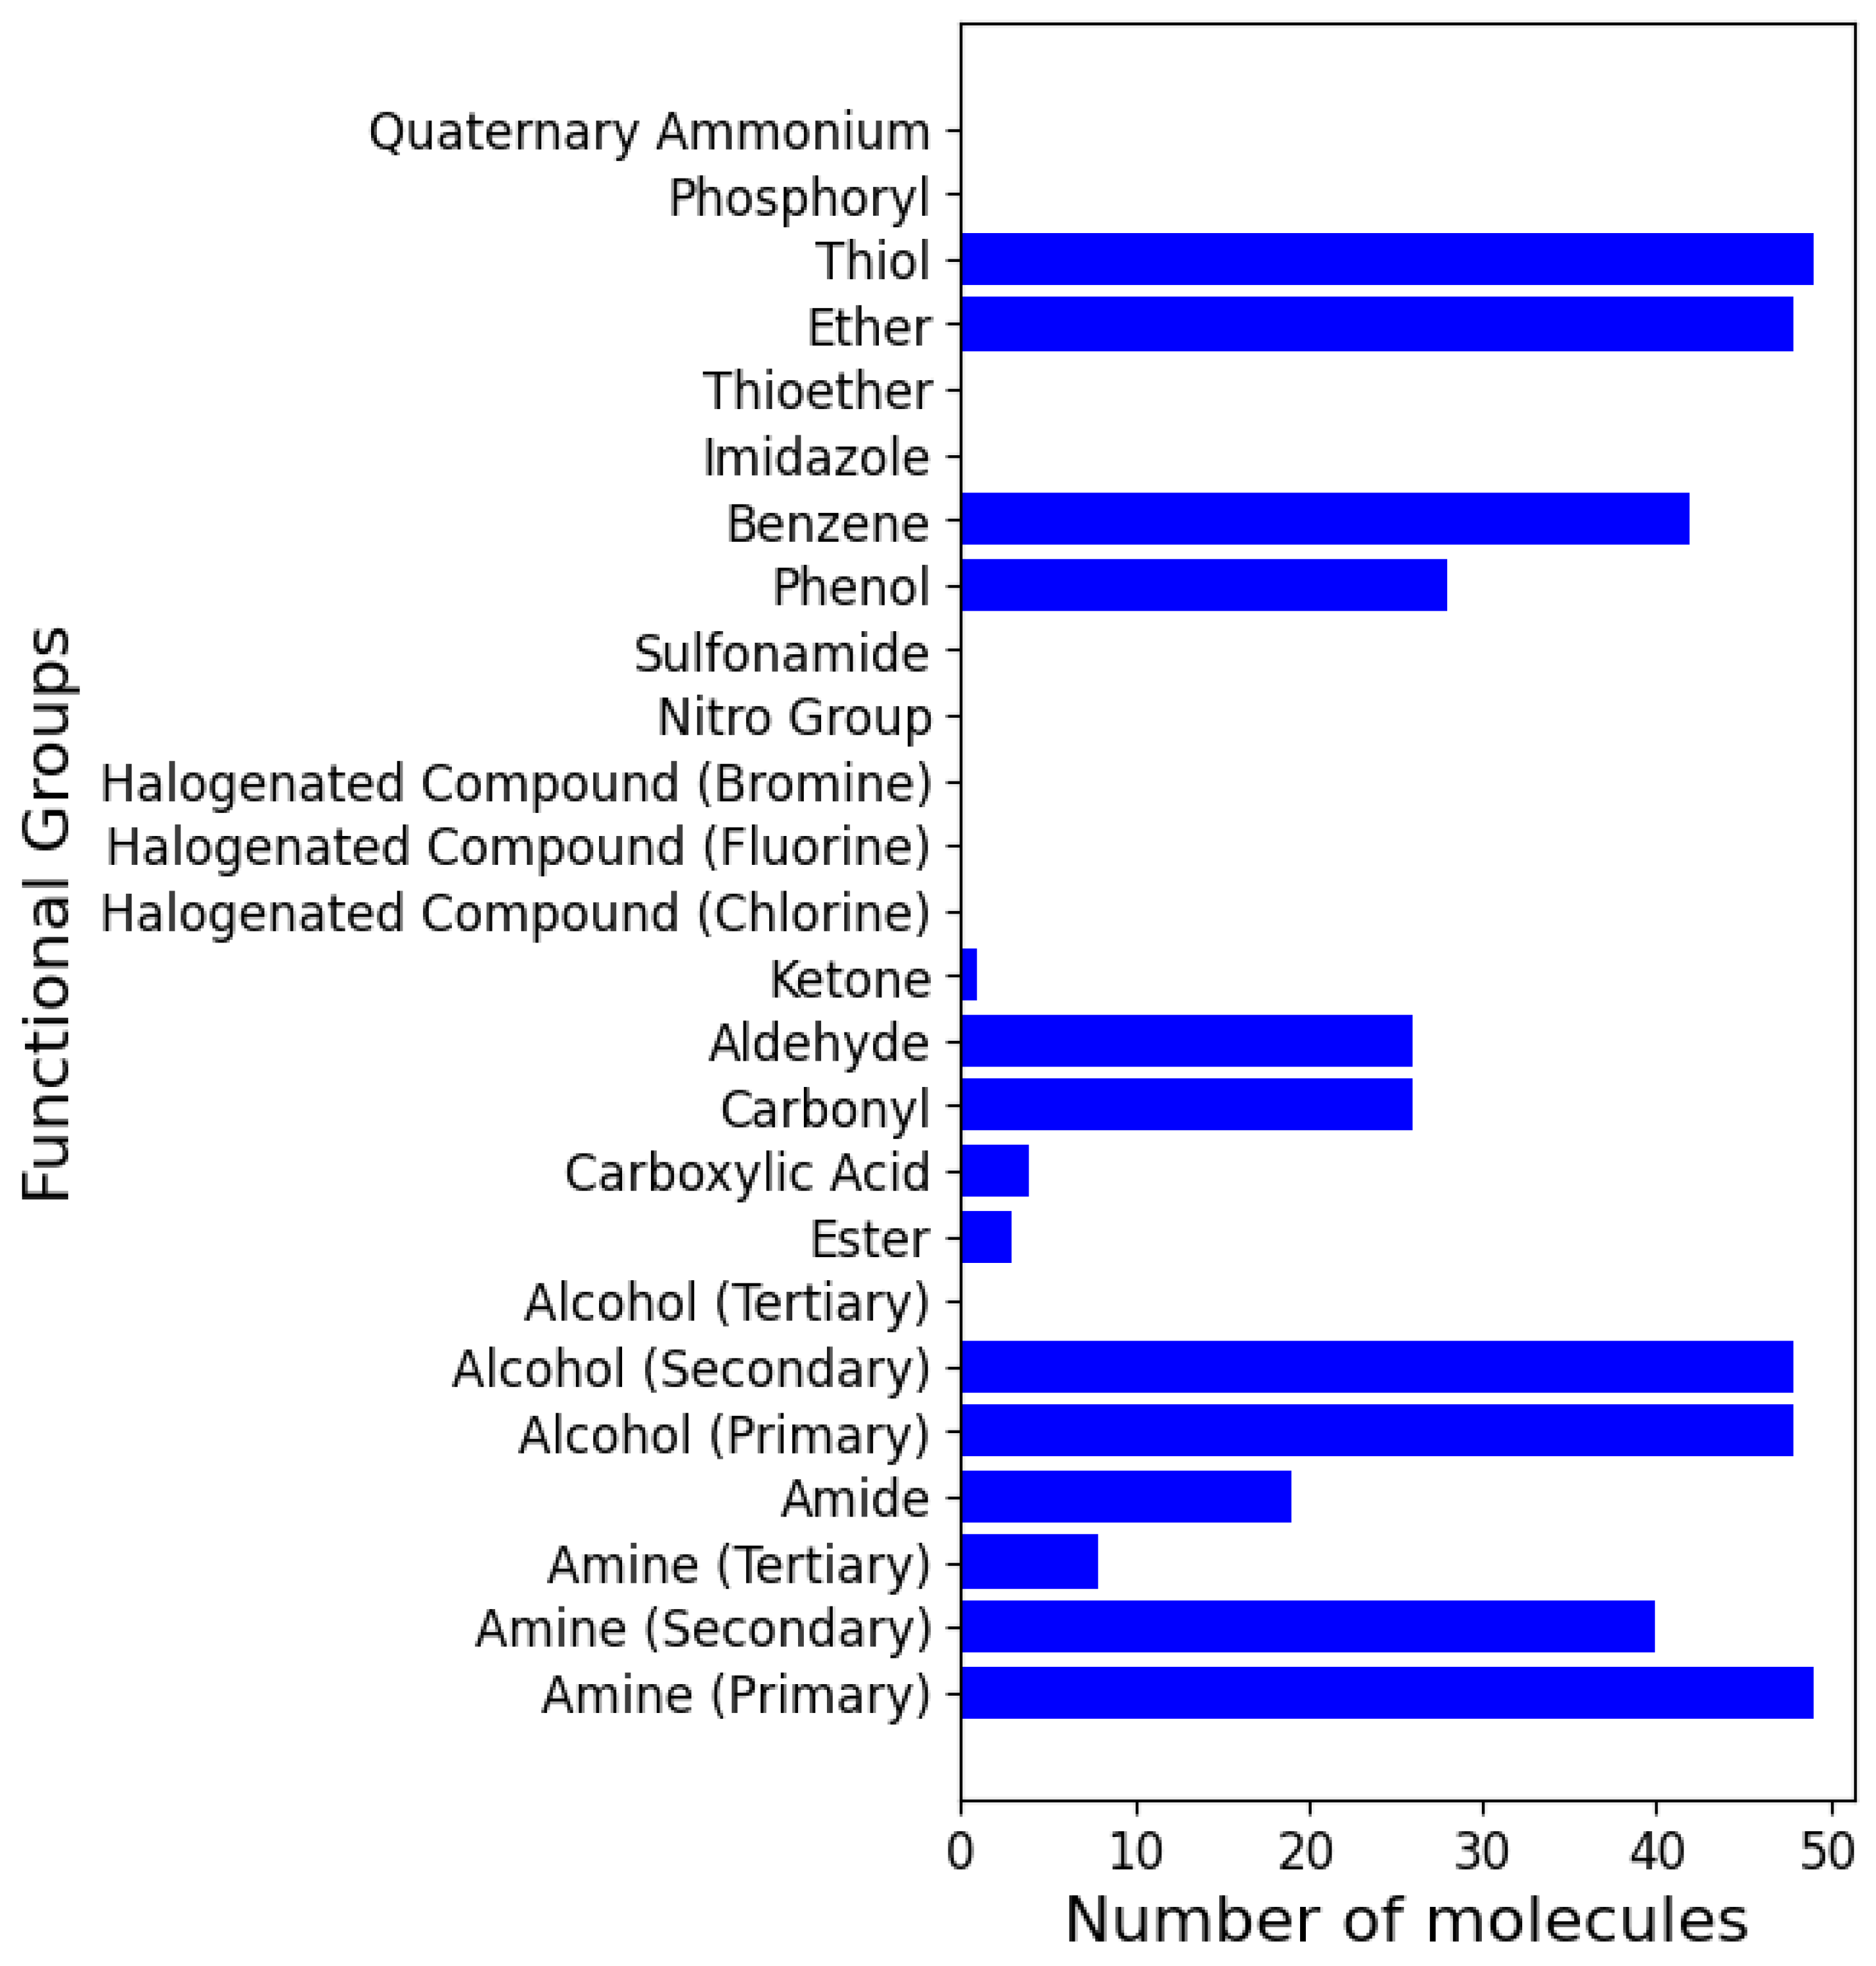
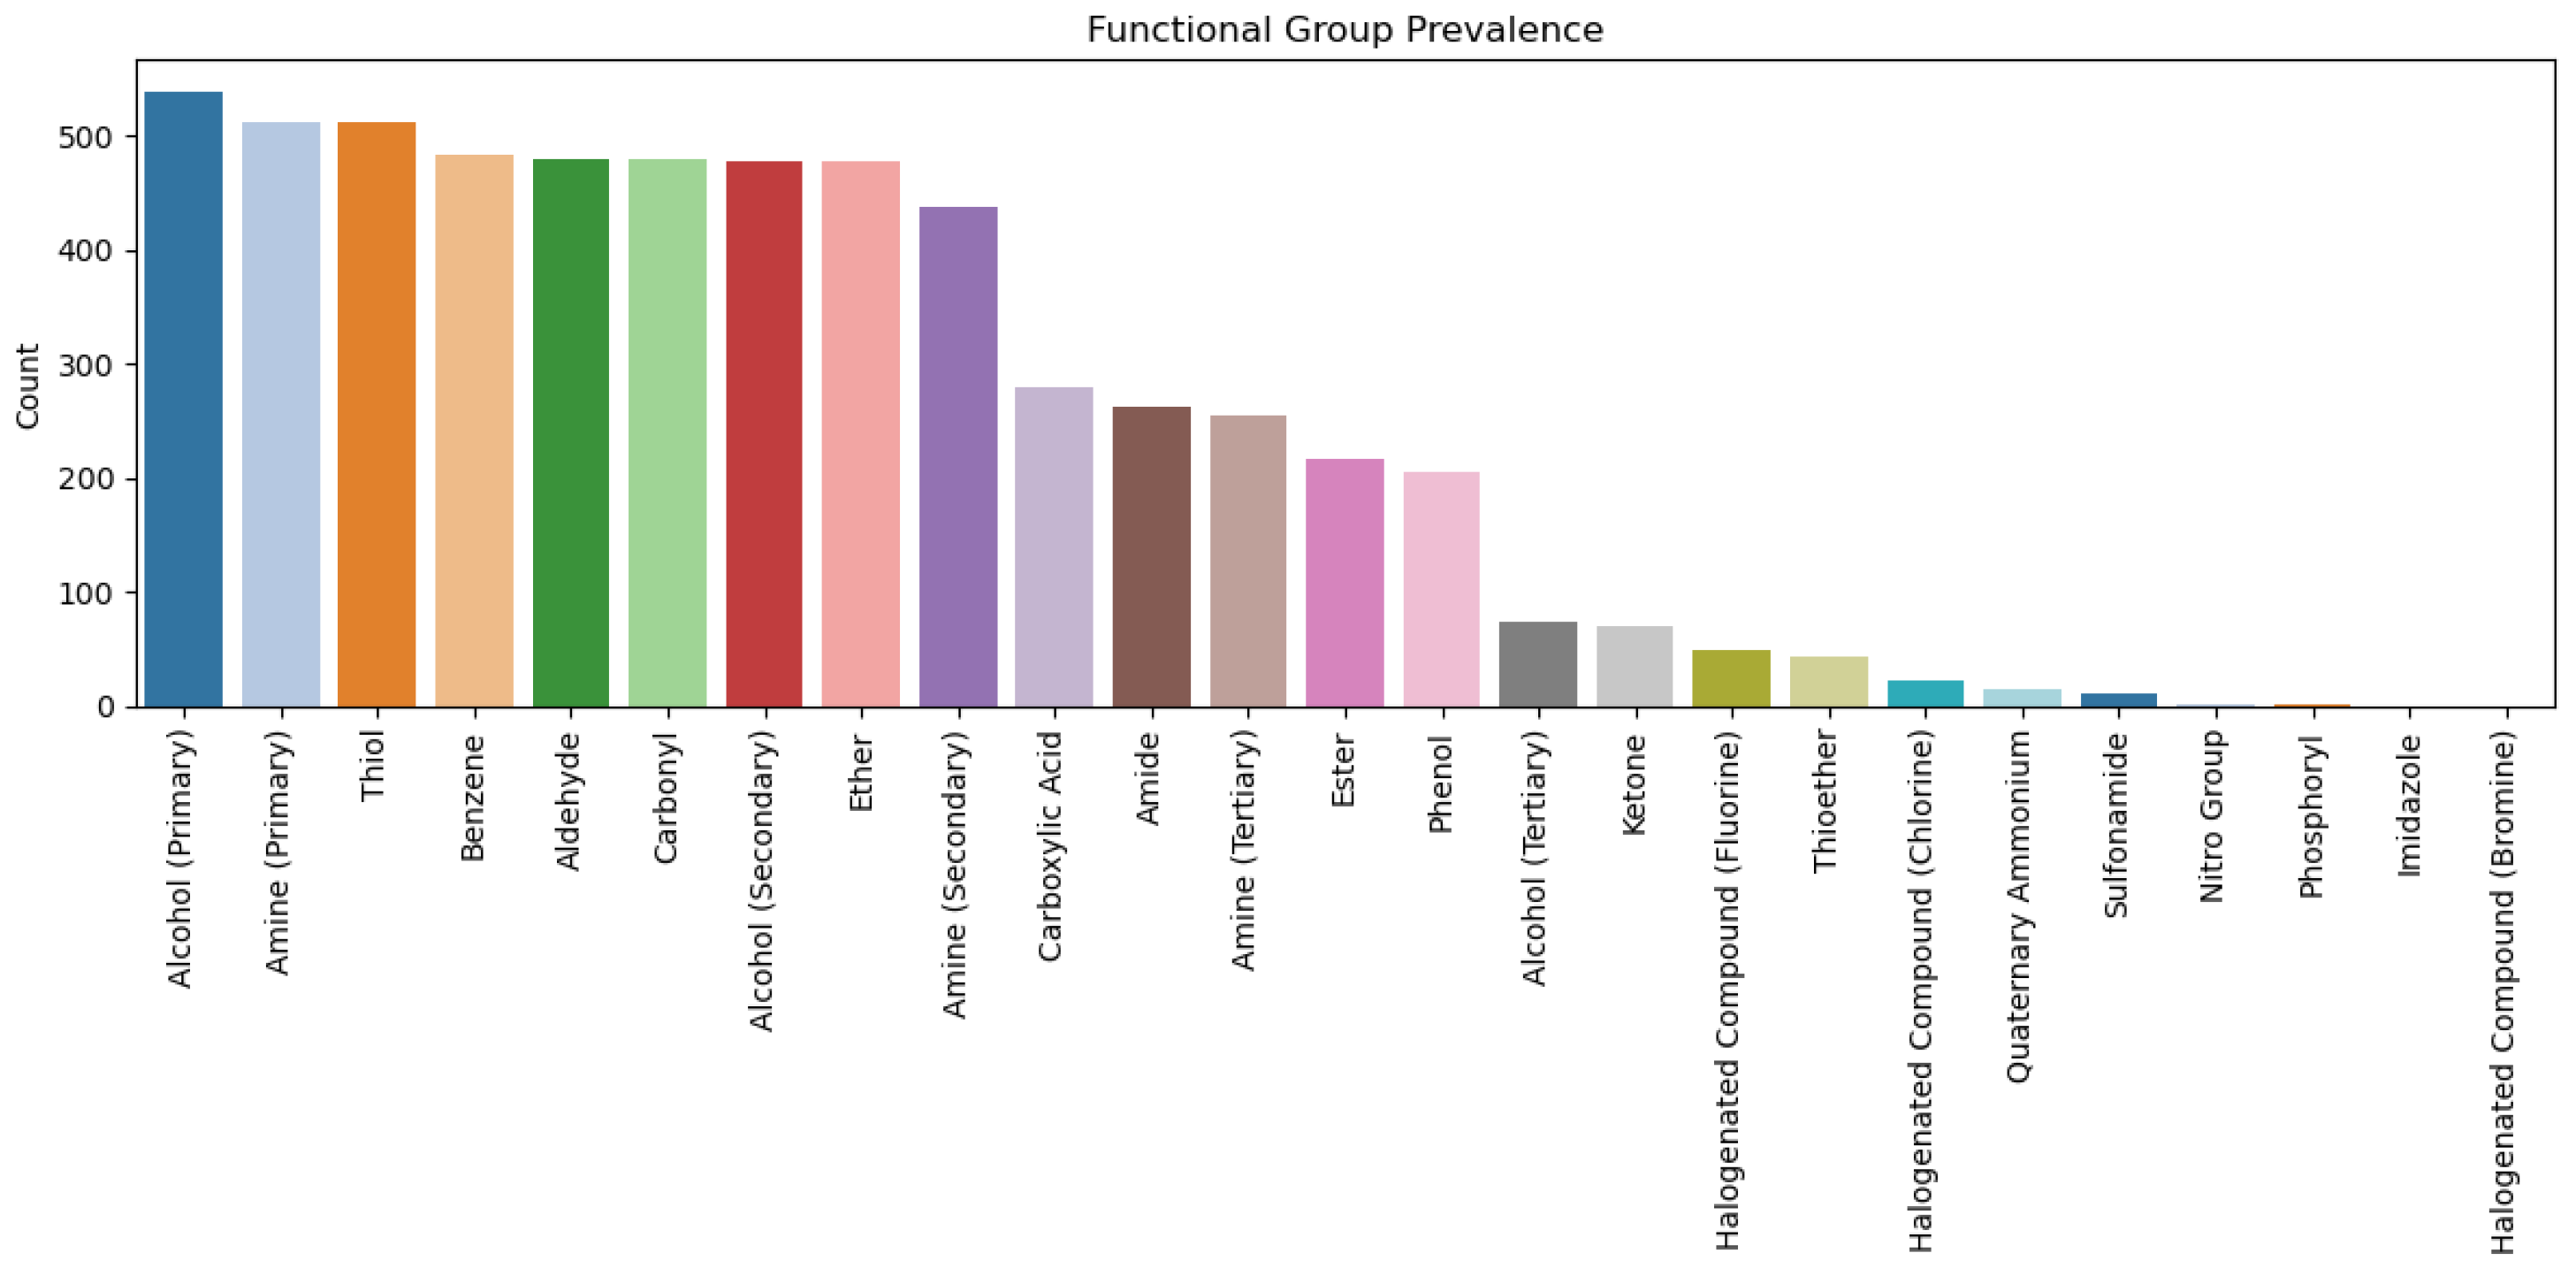
2.3. Analysis of Functional Groups and ADMET Properties

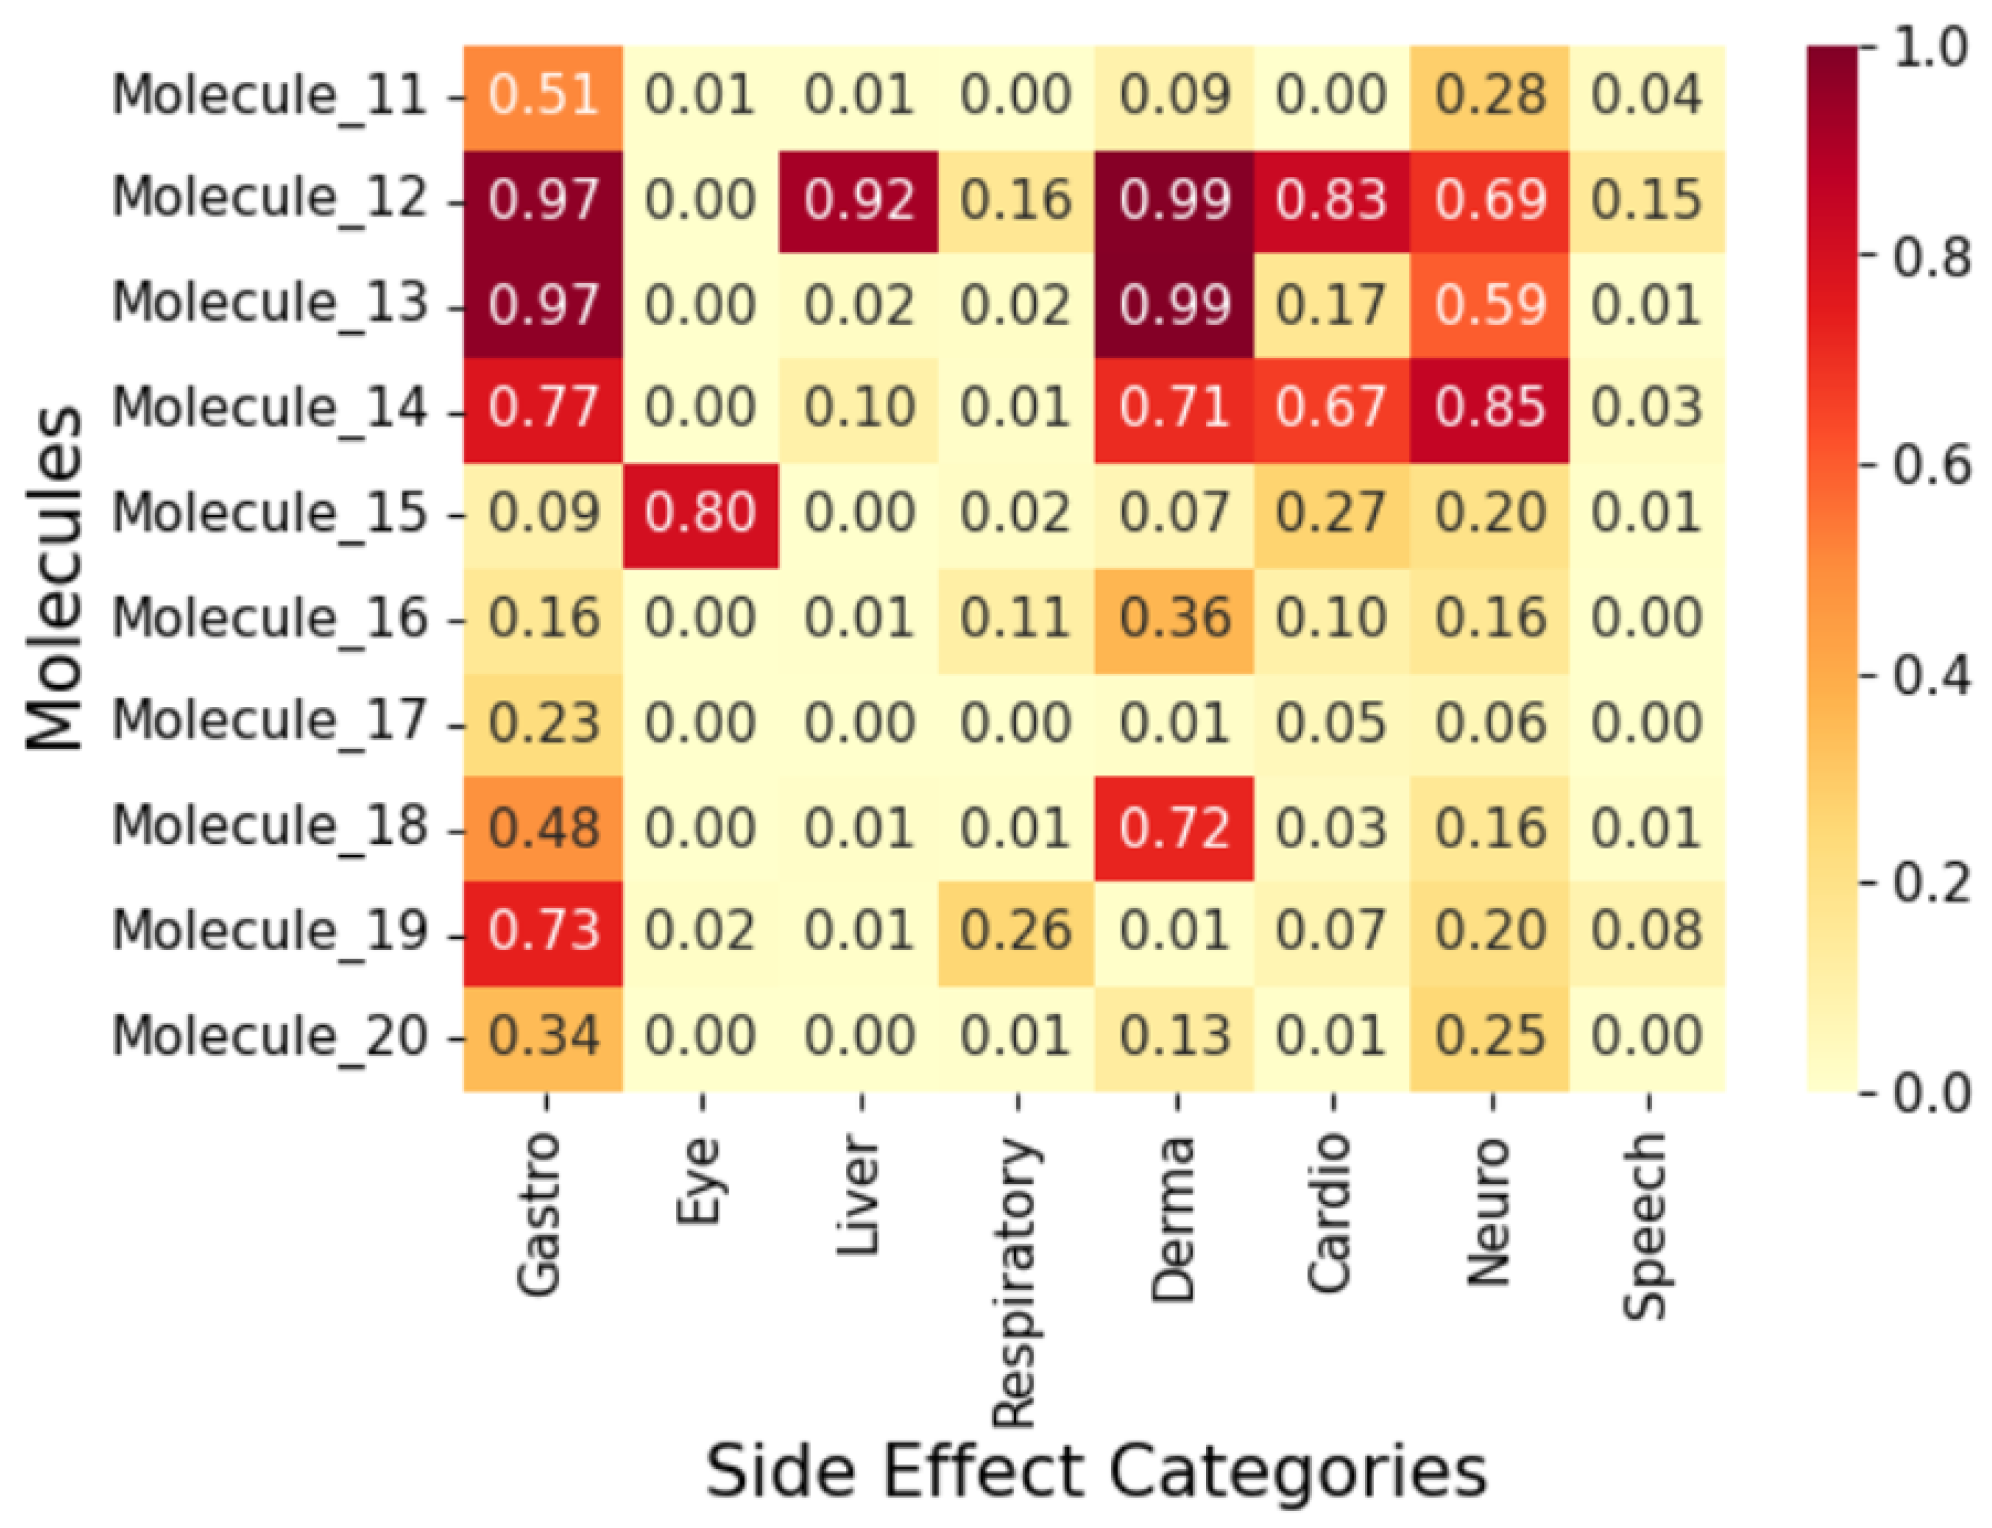
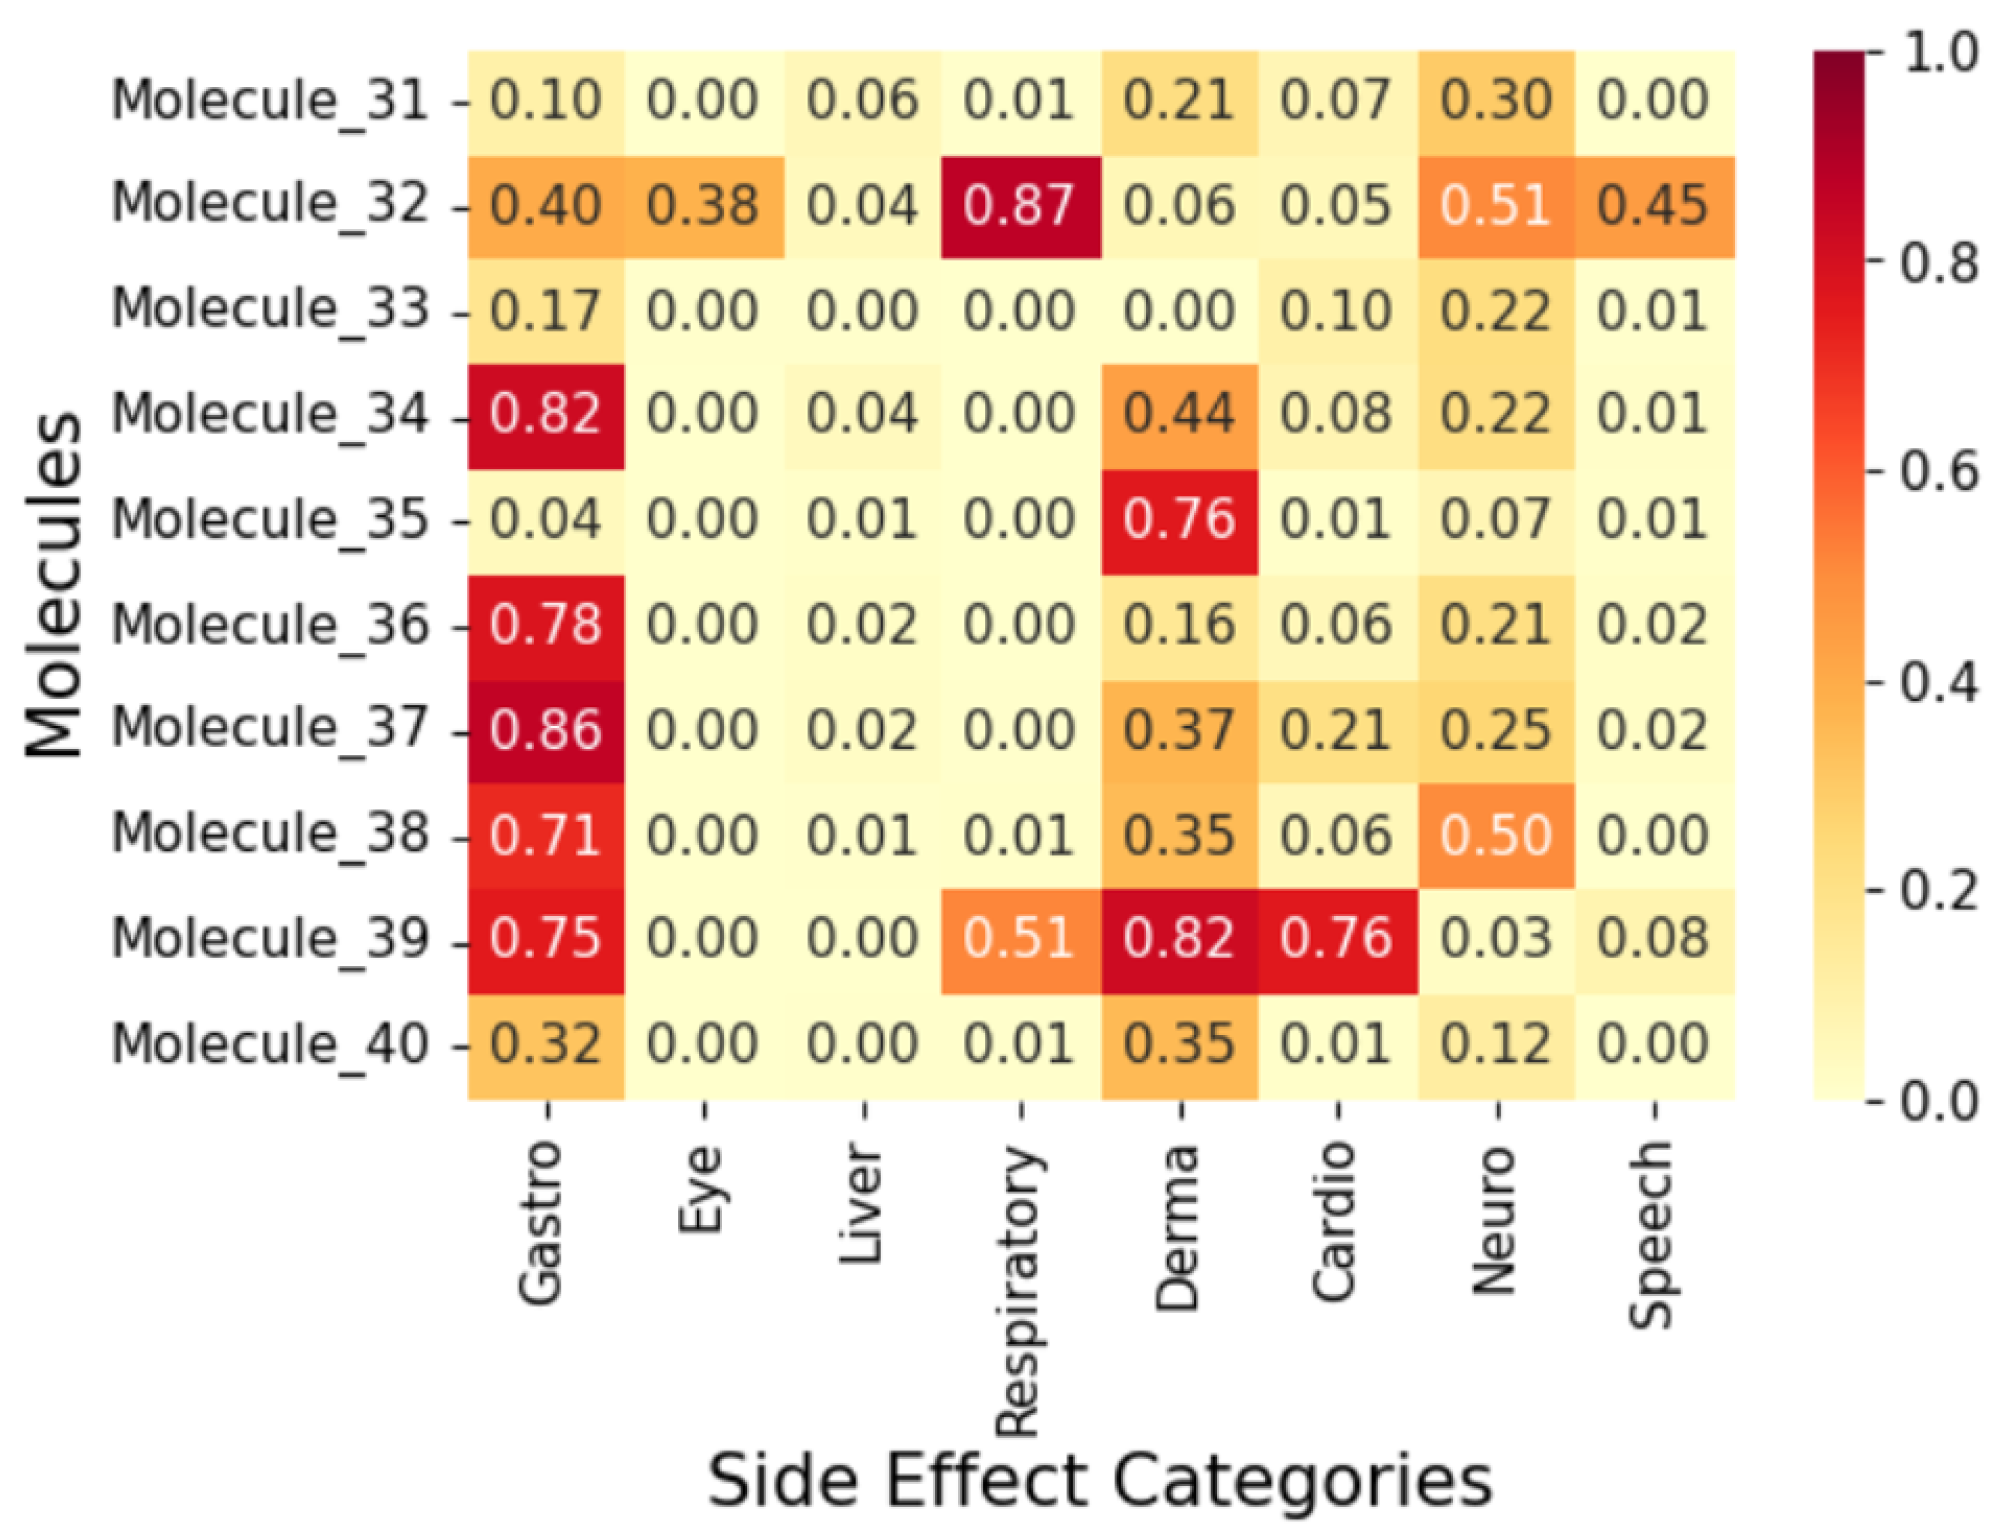
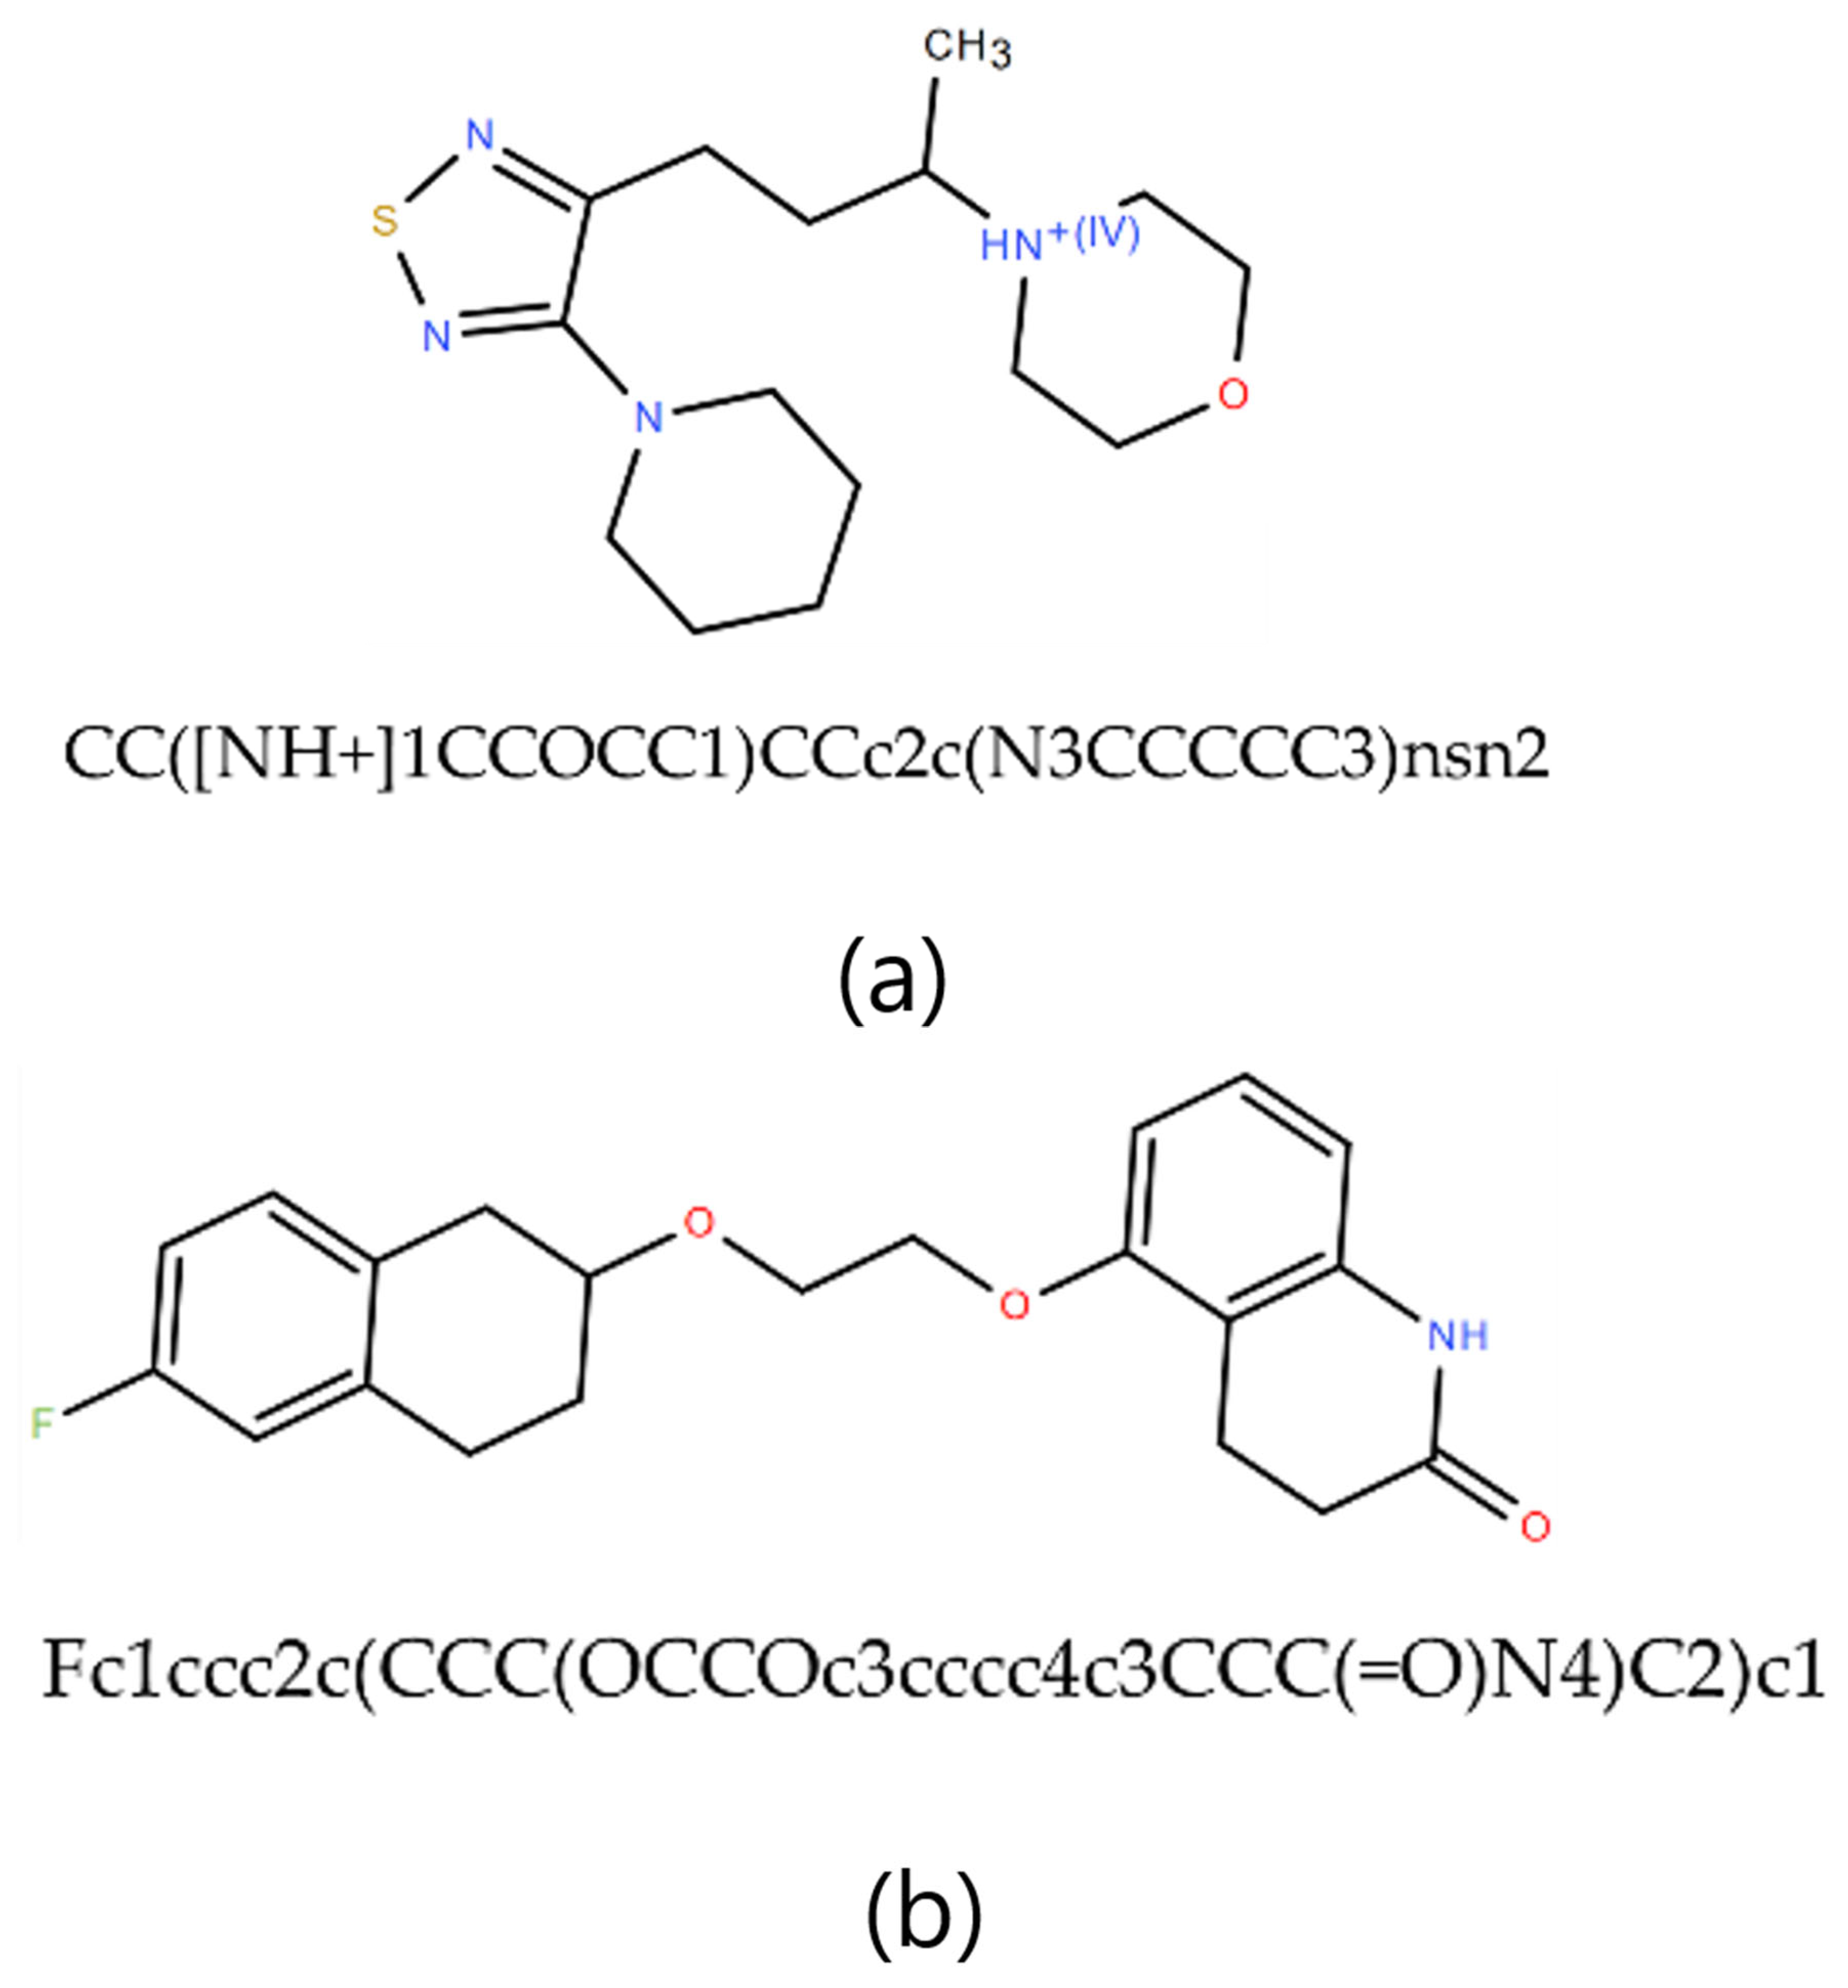
2.4. Exploratory Case Study on Fifty AI-Generated Leads


3. Methodology
3.1. Data Curation

| Functional Groups |
|---|
| Amine (Primary, secondary, and tertiary) |
| Amide |
| Alcohol (Primary, secondary, and tertiary) |
| Ester |
| Carboxylic Acid |
| Carbonyl |
| Aldehyde |
| Ketone |
| Halogenated Compound (Chlorine, Fluorine, and Bromine) |
| Nitro Group |
| Sulfonamide |
| Phenol |
| Benzene |
| Imidazole |
| Thioether |
| Ether |
| Thiol |
| Phosphoryl |
| Quaternary Ammonium |
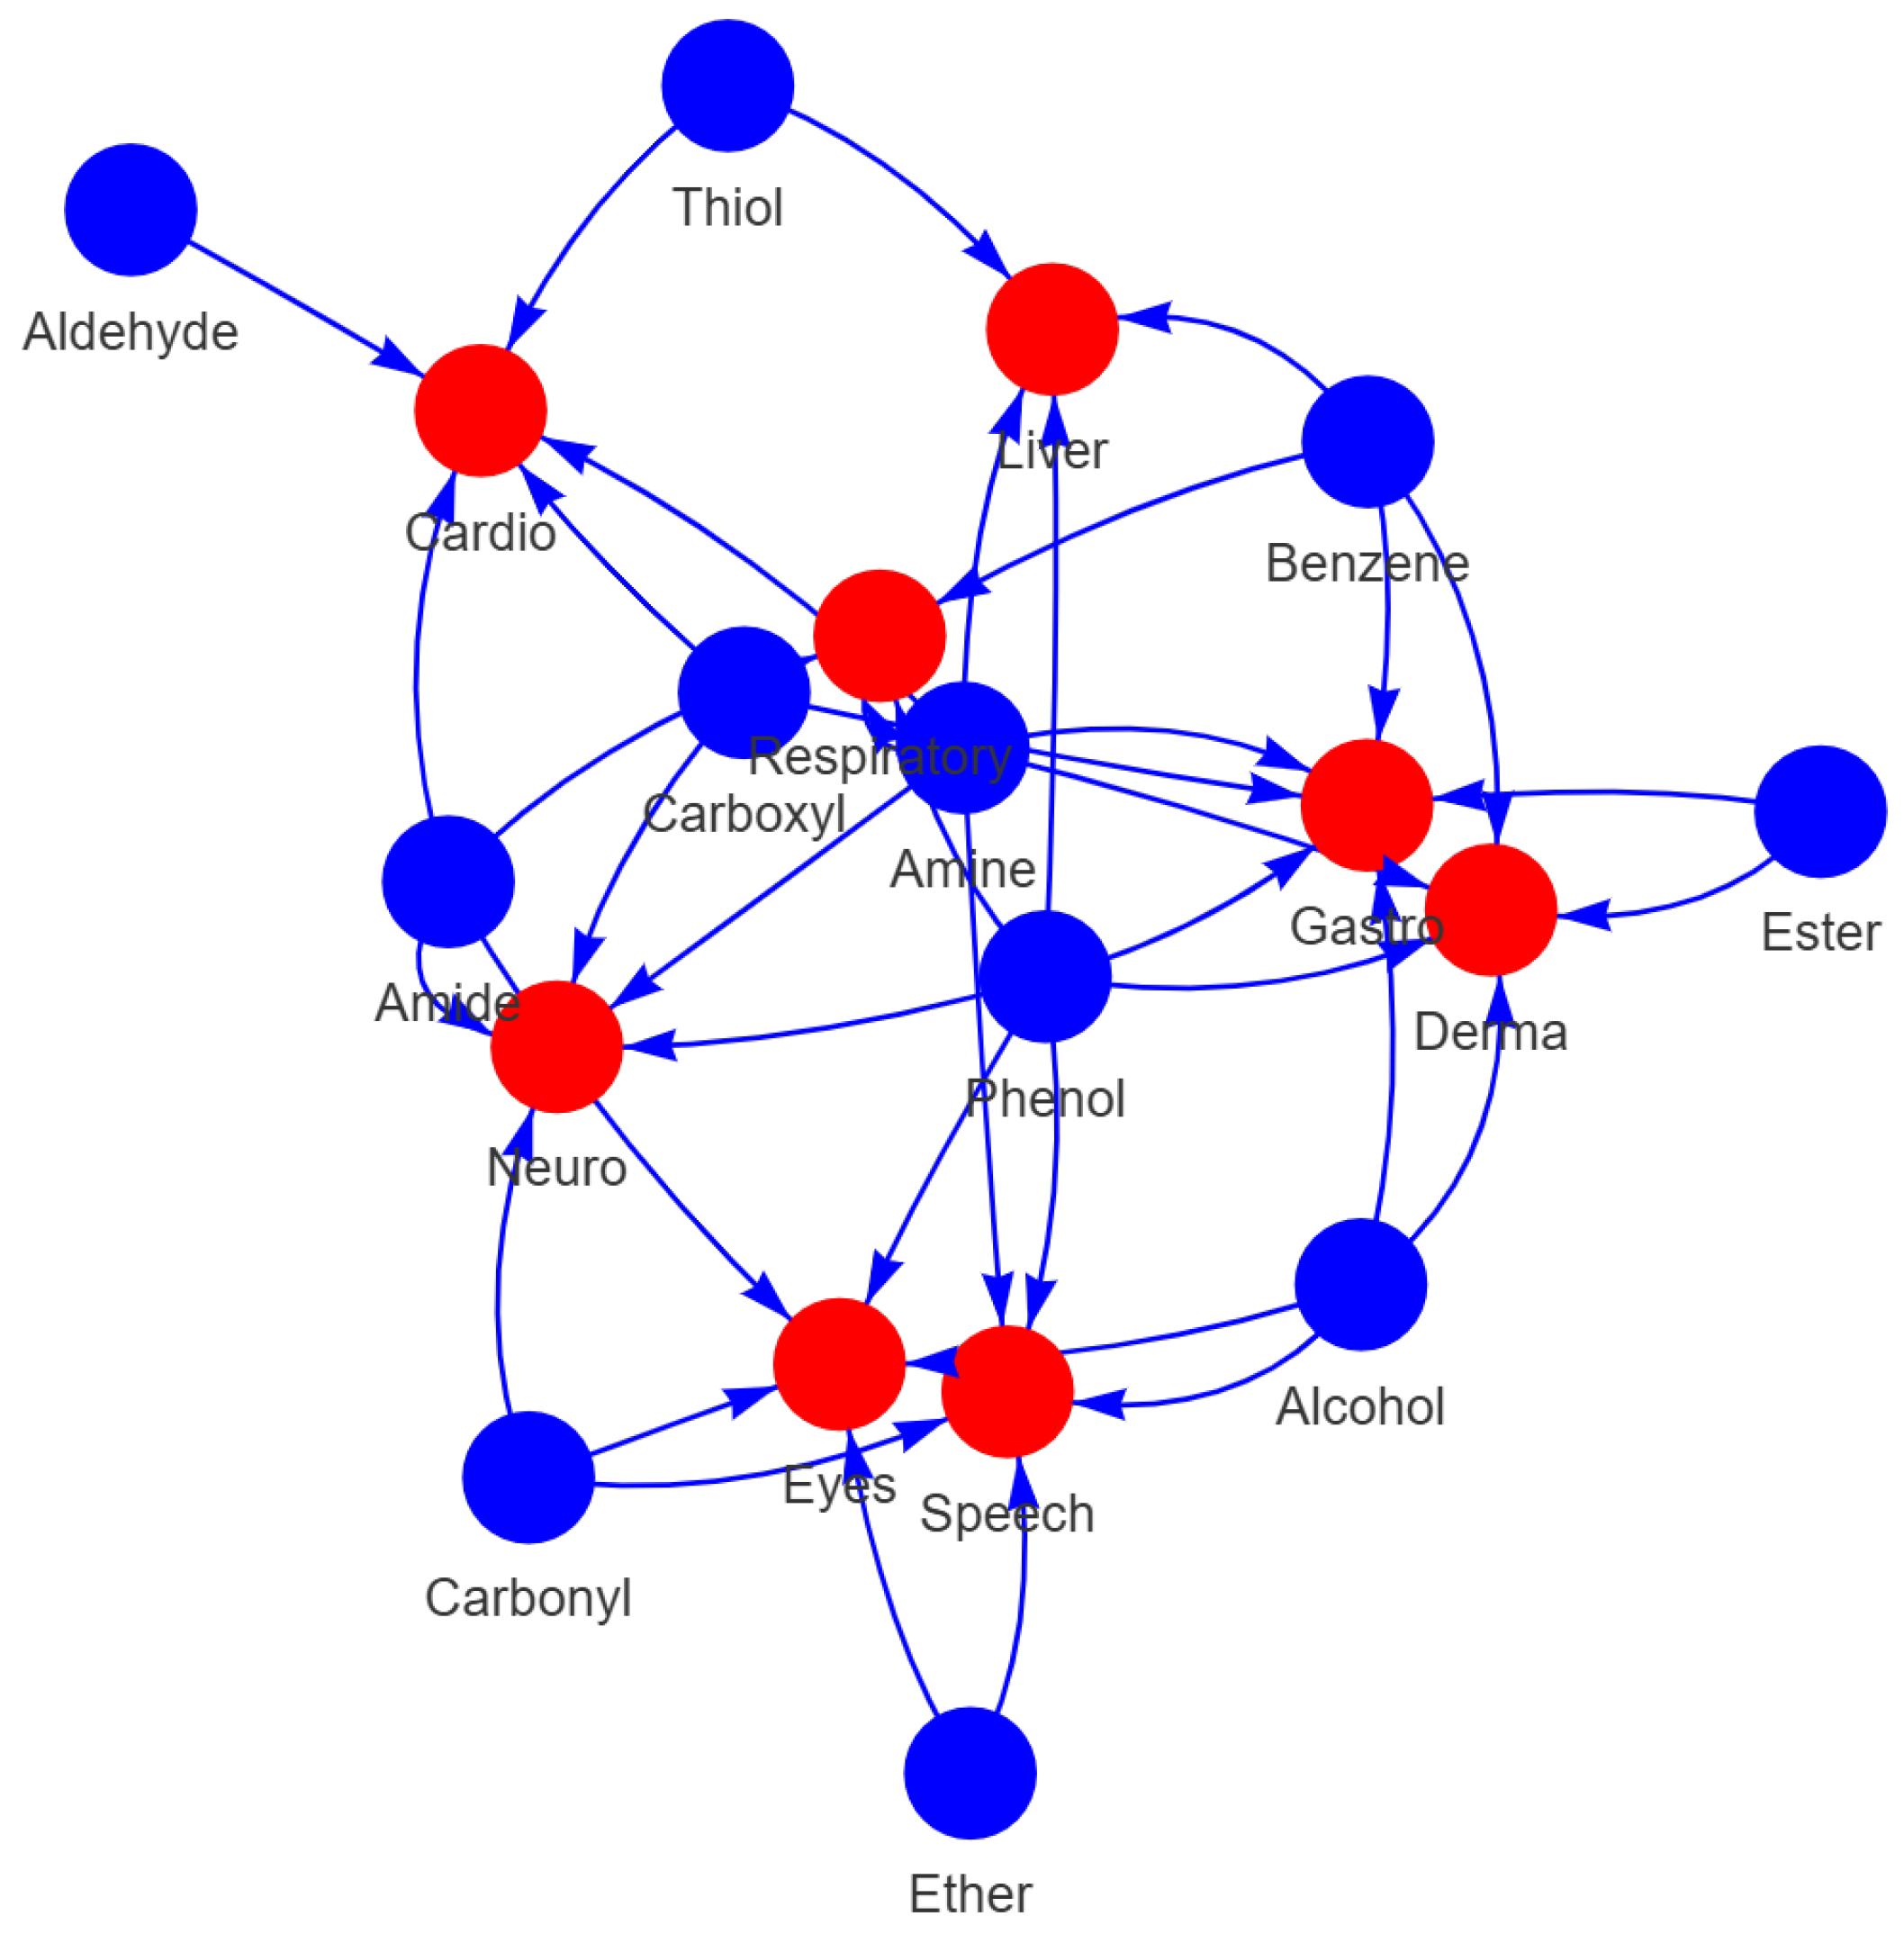
| Group | Affected Organ/System |
|---|---|
| Gastrointestinal and Eating-related Conditions | Gastrointestinal System |
| Eye Conditions | Eyes |
| Liver and Pancreatic Conditions | Liver, Pancreas |
| Respiratory and Lung Conditions | Respiratory System |
| Dermatological Conditions | Skin |
| Cardiovascular Conditions | Heart, Blood Vessels |
| Neurological and Cognitive Conditions | Brain, Nervous System |
| Speech and Otolaryngological Conditions | Mouth, Throat, Ears |
3.2. Exploratory Data Analysis
3.3. Handling Data Imbalance
3.4. Model Development and Evaluation
3.4.1. Random Forest (Baseline Model)
3.4.2. Gradient Boosting Classifier
3.4.3. XGBoost (State-of-the-Art Model)
3.4.4. Thresholding and Calibration
3.4.5. Evaluation Methods
- Accuracy: Overall correctness of the model.
- F1-score: Harmonic mean of precision and recall which is important for imbalanced datasets.
- AUC-ROC Score: Measures the model’s ability to distinguish between classes.
- Matthews Correlation Coefficient (MCC): A metric to measure the model’s ability to generalise due to its robustness to class imbalance.
3.4.6. Cross-Validation and Out-of-Bag Assessment
| Model | CV AUC–ROC | CV MCC | OOB MCC | Best Hyperparameters |
|---|---|---|---|---|
| Random Forest | 0.979 | 0.947 | 0.90 | balanced_sub |
| GradientBoosting | 0.953 | 0.911 | – | |
| XGBoost | 0.958 | 0.940 | – |
| Model | Split | Accuracy (%) | F1 (Weighted) | AUC–ROC | MCC |
|---|---|---|---|---|---|
| Random Forest | Train | 72.0 | 0.70 | 0.927 | 0.51 |
| Test | 83.0 | 0.79 | 0.636 | 0.10 | |
| Gradient Boosting | Train | 79.0 | 0.79 | 0.921 | 0.61 |
| Test | 81.0 | 0.80 | 0.616 | 0.15 | |
| XGBoost | Train | 92.0 | 0.92 | 0.977 | 0.84 |
| Test | 81.0 | 0.80 | 0.619 | 0.13 |
4. Conclusions
Author Contributions
Funding
Institutional Review Board Statement
Informed Consent Statement
Data Availability Statement
Conflicts of Interest
References
- World Health Organization. A Global Brief on Hypertension: Silent Killer, Global Public Health Crisis: World Health Day 2013; World Health Organization: Geneva, Switzerland, 2013; Available online: https://apps.who.int/iris/handle/10665/79059 (accessed on 21 August 2024).
- Mills, K.T.; Stefanescu, A.; He, J. The global epidemiology of hypertension. Nat. Rev. Nephrol. 2020, 16, 223–237. [Google Scholar] [CrossRef] [PubMed]
- Lehasa, O.M.-E.; Chude-Okonkwo, U.A.K. Dataset for discovering new hypertension small molecules using machine learning-aided computational fragment-based design. Data Brief 2024, 55, 110677. [Google Scholar] [CrossRef] [PubMed]
- Olowofela, A.O.; Isah, A.O. Profile and predictors of antihypertensive adherence among patients in a tertiary care setting in Southwestern Nigeria. Am. J. Hypertens. 2017, 30, 919–927. [Google Scholar]
- Takuathung, M.N.; Sakuludomkan, W.; Khatsri, R.; Dukaew, N.; Kraivisitkul, N.; Ahmadmusa, B.; Mahakkanukrauh, C.; Wangthaweesap, K.; Onin, J.; Srichai, S.; et al. Adverse Effects of Angiotensin-Converting Enzyme Inhibitors in Humans: A Systematic Review and Meta-Analysis of 378 Randomized Controlled Trials. Int. J. Environ. Res. Public Health 2022, 19, 8373. [Google Scholar] [CrossRef]
- Mao, F.; Ni, W.; Xu, X.; Wang, H.; Wang, J.; Ji, M.; Li, J. Chemical Structure-Related Drug-Like Criteria of Global Approved Drugs. Molecules 2016, 21, 75. [Google Scholar] [CrossRef]
- Zanders, E.D. Preclinical Development. In The Science and Business of Drug Discovery; Springer: Cham, Switherland, 2020. [Google Scholar] [CrossRef]
- Lehasa, O.M.-E.; Chude-Okonkwo, U.A.K. Machine Learning-aided Computational Fragment-based Design of Small Molecules for Hypertension Treatment. Intell.-Based Med. 2024, 10, 100171. [Google Scholar] [CrossRef]
- Blanco-González, A.; Cabezón, A.; Seco-González, A.; Conde-Torres, D.; Antelo-Riveiro, P.; Piñeiro, Á.; Garcia-Fandino, R. The Role of AI in Drug Discovery: Challenges, Opportunities, and Strategies. Pharmaceuticals 2023, 16, 891. [Google Scholar] [CrossRef]
- Olson, H.; Betton, G.; Robinson, D.; Thomas, K.; Monro, A.; Kolaja, G.; Lilly, P.; Sanders, J.; Sipes, G.; Bracken, W.; et al. Concordance of the toxicity of pharmaceuticals in humans and in animals. Regul. Toxicol. Pharmacol. 2000, 32, 56–67. [Google Scholar] [CrossRef]
- Hartung, T. Toxicology for the twenty-first century. Nature 2009, 460, 208–212. [Google Scholar] [CrossRef]
- Valerio, L.G. In silico toxicology for the pharmaceutical sciences. Toxicol. Appl. Pharmacol. 2009, 241, 356–370. [Google Scholar] [CrossRef]
- Mostafa, F.; Chen, M. Computational models for predicting liver toxicity in the deep learning era. Front. Toxicol. 2023, 5, 1340860. [Google Scholar] [CrossRef] [PubMed]
- Uner, O.C.; Kuru, H.I.; Cinbis, R.G.; Tastan, O.; Cicek, A.E. DeepSide: A Deep Learning Approach for Drug Side Effect Prediction. IEEE/ACM Trans. Comput. Biol. Bioinform. 2022, 5, 1340860. [Google Scholar] [CrossRef] [PubMed]
- Di, L.; Kerns, E.H. Drug-like Properties: Concepts, Structure Design and Methods: From ADME to Toxicity Optimization; Academic Press: Cambridge, MA, USA, 2015. [Google Scholar]
- Kuhn, M.; Letunic, I.; Jensen, L.J.; Bork, P. The SIDER database of drugs and side effects. Nucleic Acids Res. 2015, 44, D1075–D1079. [Google Scholar] [CrossRef]
- Galeano, D.; Paccanaro, A. Machine learning prediction of side effects for drugs in clinical trials. Cell Rep. Methods 2022, 2, 100358. [Google Scholar] [CrossRef]
- Soffer, A.; Viswas, S.J.; Alon, S.; Rozenberg, N.; Peled, A.; Piro, D.; Vilenchik, D.; Akabayov, B. MolOptimizer: A Molecular Optimization Toolkit for Fragment-Based Drug Design. Molecules 2024, 29, 276. [Google Scholar] [CrossRef]
- Gupta, S.; Sharma, A.; Singh, R. Application of artificial intelligence and machine learning in early detection of adverse drug reactions (ADRs) and drug-induced toxicity. Front. Pharmacol. 2024, 15, 1497397. [Google Scholar] [CrossRef]
- Licata, A. Adverse drug reactions and organ damage: The liver. Eur. J. Intern. Med. 2016, 28, 9–16. [Google Scholar] [CrossRef]
- Willson, C. Sympathomimetic amine compounds and hepatotoxicity: Not all are alike—Key distinctions noted in a short review. Toxicol. Rep. 2018, 6, 26–33. [Google Scholar] [CrossRef]
- Guengerich, F.P. Common and Uncommon Cytochrome P450 Reactions Related to Metabolism and Chemical Toxicity. Chem. Res. Toxicol. 2001, 14, 611–650. [Google Scholar] [CrossRef]
- Sumbul, S.; Ahmad, M.A.; Mohd, A.; Mohd, A. Role of phenolic compounds in peptic ulcer: An overview. J. Pharm. Bioallied Sci. 2011, 3, 361–367. [Google Scholar] [CrossRef]
- El-Salhy, M.; Solomon, T.; Hausken, T.; Gilja, O.H.; Hatlebakk, J.G. Gastrointestinal neuroendocrine peptides/amines in inflammatory bowel disease. World J. Gastroenterol. 2017, 23, 5068–5085. [Google Scholar] [CrossRef] [PubMed]
- Chang, Y.S.; Wu, C.L.; Tseng, S.H.; Kuo, P.Y.; Tseng, S.Y. In vitro benzyl alcohol cytotoxicity: Implications for intravitreal use of triamcinolone acetonide. Exp. Eye Res. 2008, 86, 942–950. [Google Scholar] [CrossRef] [PubMed]
- Davies, N.M.; Anderson, K.E. Clinical pharmacokinetics of naproxen. Clin. Pharmacokinet. 1997, 32, 268–293. [Google Scholar] [CrossRef]
- El-Maghrabey, M.H.; El-Shaheny, R.; El Hamd, M.A.; Al-Khateeb, L.A.; Kishikawa, N.; Kuroda, N. Aldehydes’ sources, toxicity, environmental analysis, and control in food. In Organic Pollutants: Toxicity and Solutions; Springer International Publishing: Cham, Switherland, 2021; Volume 32, pp. 117–151. [Google Scholar]
- Floss, M.A.; Fink, T.; Maurer, F.; Volk, T.; Kreuer, S.; Müller-Wirtz, L.M. Exhaled Aldehydes as Biomarkers for Lung Diseases: A Narrative Review. Molecules 2022, 27, 5258. [Google Scholar] [CrossRef]
- He, W.; Ding, J.; Gao, N.; Zhu, L.; Zhu, L.; Feng, J. Elucidating the toxicity mechanisms of organophosphate esters by adverse outcome pathway network. Arch. Toxicol. 2024, 98, 233–250. [Google Scholar] [CrossRef]
- Baldo, B.A.; Pham, N.H. Non-steroidal Anti-inflammatory Drugs. In Drug Allergy; Springer: Cham, Switherland, 2021. [Google Scholar] [CrossRef]
- National Institute for Occupational Safety and Health. Occupational Exposure to Phenol. Criteria for a Recommended Standard; DHEW Publication: No. (NIOSH) 76-196, 1976. U.S. Department of Health, Education, and Welfare. Available online: https://stacks.cdc.gov/view/cdc/19369 (accessed on 24 August 2024).
- Downs, J.W.; Wills, B.K. Phenol Toxicity; StatPearls [Internet] Series; StatPearls Publishing: Treasure Island, FL, USA, 2023; (updated 13 March 2023); Available online: https://www.statpearls.com/ (accessed on 24 August 2024).
- Chastain, G. Alcohol, neurotransmitter systems, and behavior. J. Gen. Psychol. 2006, 133, 329–335. [Google Scholar] [CrossRef]
- Ertl, P.; Rohde, B.; Selzer, P. Fast Calculation of Molecular Polar Surface Area as a Sum of Fragment-Based Contributions and Its Application to the Prediction of Drug Transport Properties. J. Med. Chem. 2000, 43, 3714–3717. [Google Scholar] [CrossRef]
- Lipinski, C.A.; Lombardo, F.; Dominy, B.W.; Feeney, P.J. Experimental and computational approaches to estimate solubility and permeability in drug discovery and development settings. Adv. Drug Deliv. Rev. 2012, 64, 4–17. [Google Scholar] [CrossRef]
- Gaulton, A.; Bellis, L.J.; Bento, A.P.; Chambers, J.; Davies, M.; Hersey, A.; Light, Y.; McGlinchey, S.; Michalovich, D.; Al-Lazikani, B.; et al. ChEMBL: A large-scale bioactivity database for drug discovery. Nucleic Acids Res. 2012, 40, D1100–D1107. [Google Scholar] [CrossRef]
- Landrum, G. RDKit. Q2. 2010. Available online: https://www.rdkit.org/ (accessed on 9 July 2024).
- Waring, M.J. Lipophilicity in drug discovery. Expert Opin. Drug Discov. 2010, 5, 235–248. [Google Scholar] [CrossRef] [PubMed]
- Kenny, P.W. Hydrogen-Bond Donors in Drug Design. J. Med. Chem. 2022, 65, 14261–14275. [Google Scholar] [CrossRef] [PubMed]
- Ertl, P.; Altmann, E.; McKenna, J.M. The Most Common Functional Groups in Bioactive Molecules and How Their Popularity Has Evolved over Time. J. Med. Chem. 2020, 63, 8408–8418. [Google Scholar] [CrossRef] [PubMed]
- Tsoumakas, G.; Katakis, I. Multi-label classification: An overview. Int. J. Data Warehous. Min. 2007, 3, 1–13. [Google Scholar] [CrossRef]
- U.S. Environmental Protection Agency. Appendix F. SMILES Notation Tutorial. Available online: https://www.epa.gov/sites/default/files/2015-05/documents/appendf.pdf (accessed on 25 September 2024).
- Chawla, N.V.; Bowyer, K.W.; Hall, L.O.; Kegelmeyer, W.P. SMOTE: Synthetic minority over-sampling technique. J. Artif. Intell. Res. 2002, 16, 321–357. [Google Scholar] [CrossRef]
- Golbraikh, A.; Tropsha, A. Beware of q2! Validating QSAR models properly. J. Mol. Graph. Model. 2002, 20, 269–276. [Google Scholar] [CrossRef]
- Sahigara, F.; Mansouri, K.; Ballabio, D.; Mauri, A.; Tropsha, A.; Consonni, V.; Todeschini, R. Comparison of different approaches to define the applicability domain of QSAR models. Mol. Inform. 2012, 31, 1–13. [Google Scholar] [CrossRef]
- James, G.; Witten, D.; Hastie, T.; Tibshirani, R. An Introduction to Statistical Learning with Applications in R. In Springer Texts in Statistics, 1st ed.; Springer: New York, NY, USA, 2013; ISBN 978-1-4614-7138-7. [Google Scholar]
- He, Z.; Lin, D.; Lau, T.; Wu, M. Gradient Boosting Machine: A Survey. arXiv 2019. arXiv:1908.06951. [Google Scholar] [CrossRef]
- Niculescu-Mizil, A.; Caruana, R. Predicting good probabilities with supervised learning. In Proceedings of the 22nd International Conference on Machine Learning (ICML), Bonn, Germany, 7–11 August 2005; pp. 625–632. [Google Scholar] [CrossRef]
- Friedman, J. Greedy Function Approximation: A Gradient Boosting Machine. Ann. Stat. 2001, 29, 1189–1232. [Google Scholar] [CrossRef]
- Breiman, L. Random Forests. Mach. Learn. 2001, 45, 5–32. [Google Scholar] [CrossRef]
Disclaimer/Publisher’s Note: The statements, opinions and data contained in all publications are solely those of the individual author(s) and contributor(s) and not of MDPI and/or the editor(s). MDPI and/or the editor(s) disclaim responsibility for any injury to people or property resulting from any ideas, methods, instructions or products referred to in the content. |
© 2025 by the authors. Licensee MDPI, Basel, Switzerland. This article is an open access article distributed under the terms and conditions of the Creative Commons Attribution (CC BY) license (https://creativecommons.org/licenses/by/4.0/).
Share and Cite
Ndhlovu, T.; Chude-Okonkwo, U.A.K. Enabling Early Prediction of Side Effects of Novel Lead Hypertension Drug Molecules Using Machine Learning. Drugs Drug Candidates 2025, 4, 35. https://doi.org/10.3390/ddc4030035
Ndhlovu T, Chude-Okonkwo UAK. Enabling Early Prediction of Side Effects of Novel Lead Hypertension Drug Molecules Using Machine Learning. Drugs and Drug Candidates. 2025; 4(3):35. https://doi.org/10.3390/ddc4030035
Chicago/Turabian StyleNdhlovu, Takudzwa, and Uche A. K. Chude-Okonkwo. 2025. "Enabling Early Prediction of Side Effects of Novel Lead Hypertension Drug Molecules Using Machine Learning" Drugs and Drug Candidates 4, no. 3: 35. https://doi.org/10.3390/ddc4030035
APA StyleNdhlovu, T., & Chude-Okonkwo, U. A. K. (2025). Enabling Early Prediction of Side Effects of Novel Lead Hypertension Drug Molecules Using Machine Learning. Drugs and Drug Candidates, 4(3), 35. https://doi.org/10.3390/ddc4030035