Author Contributions
L.B., Conceptualization, Writing—original draft, Methodology, Software. H.C.T., Conceptualization, Supervision, Writing—review & editing. All authors have read and agreed to the published version of the manuscript.
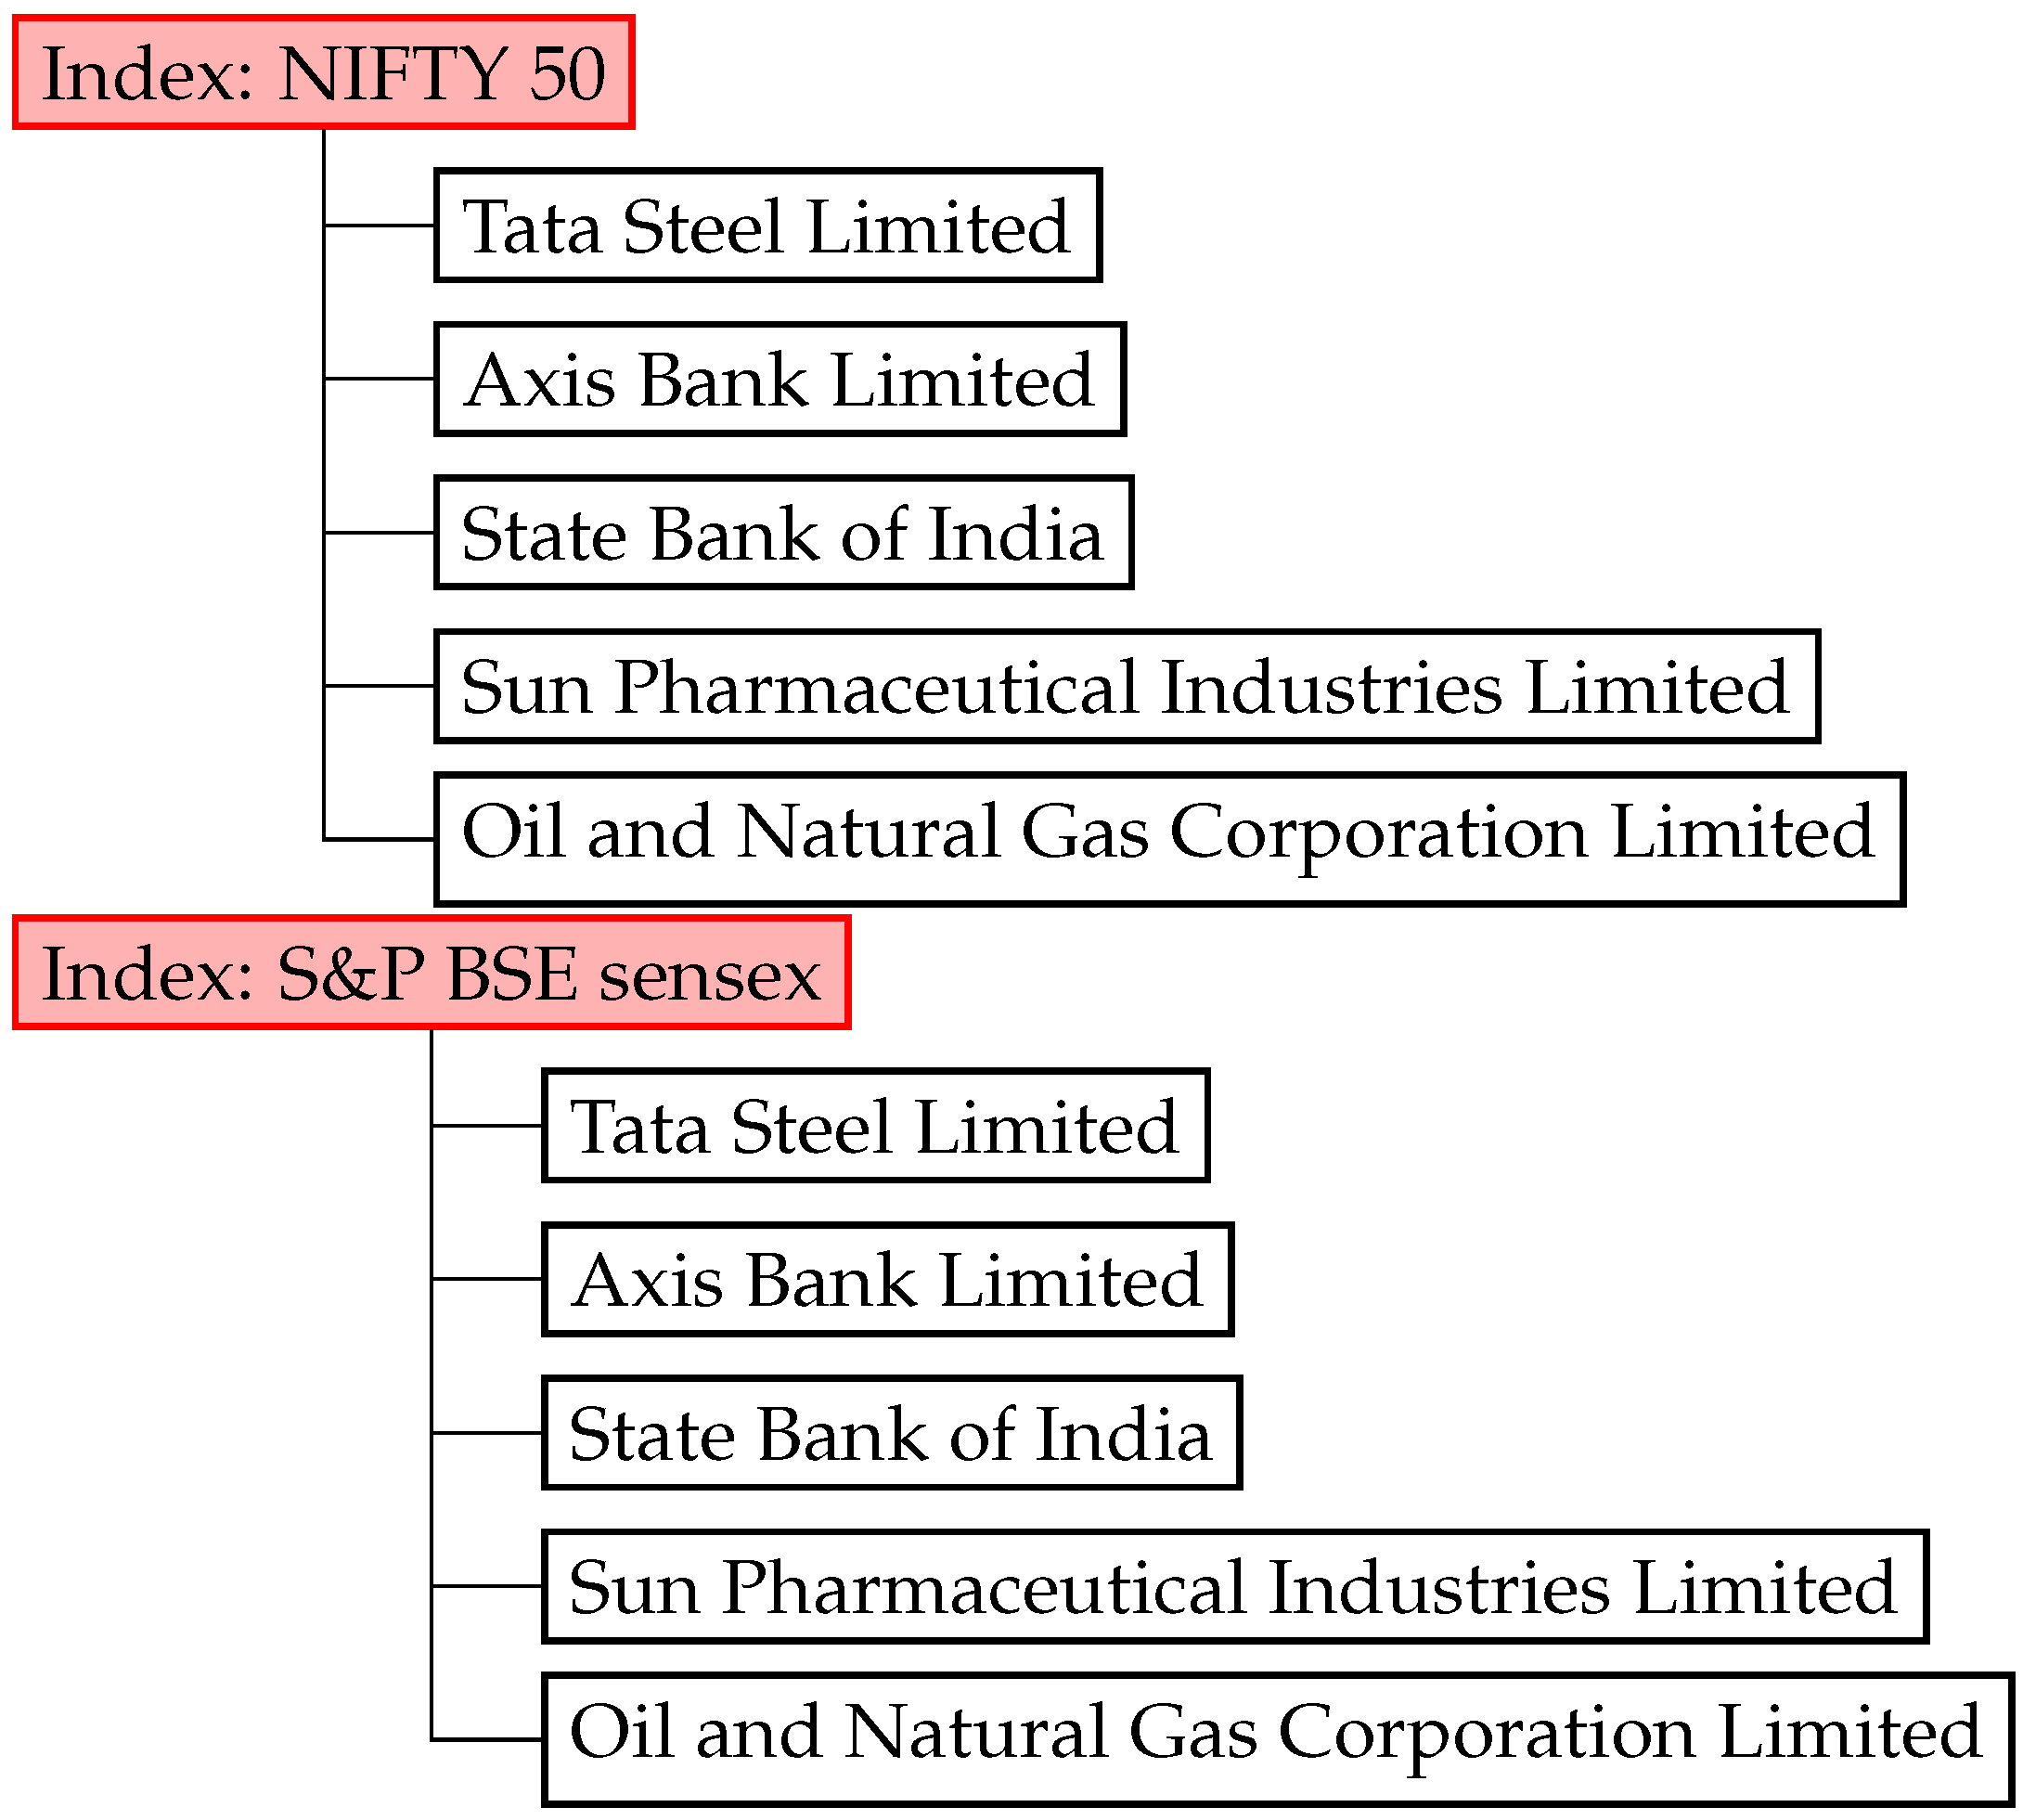
Figure 1.
Distribution of Indian market indices with their stocks.
Figure 1.
Distribution of Indian market indices with their stocks.
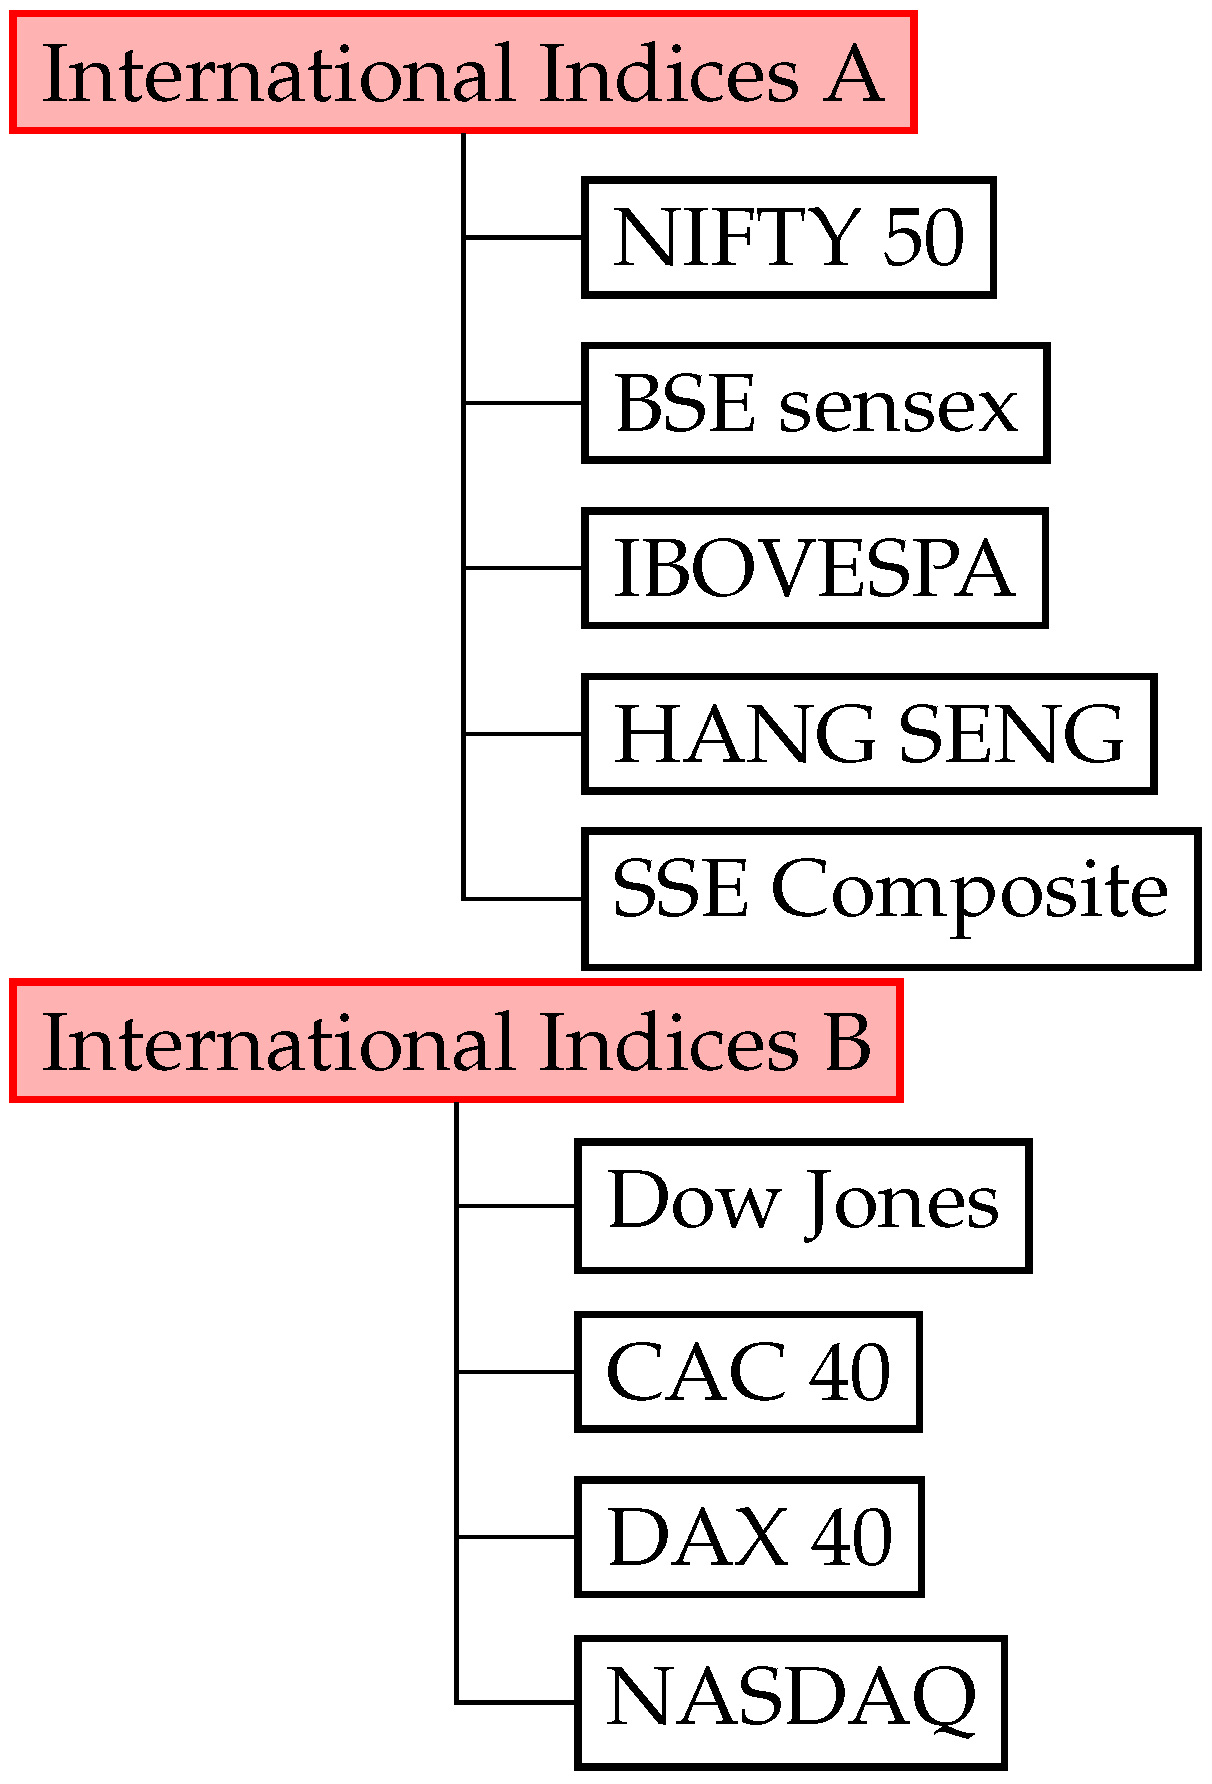
Figure 2.
Distribution of International market indices.
Figure 2.
Distribution of International market indices.
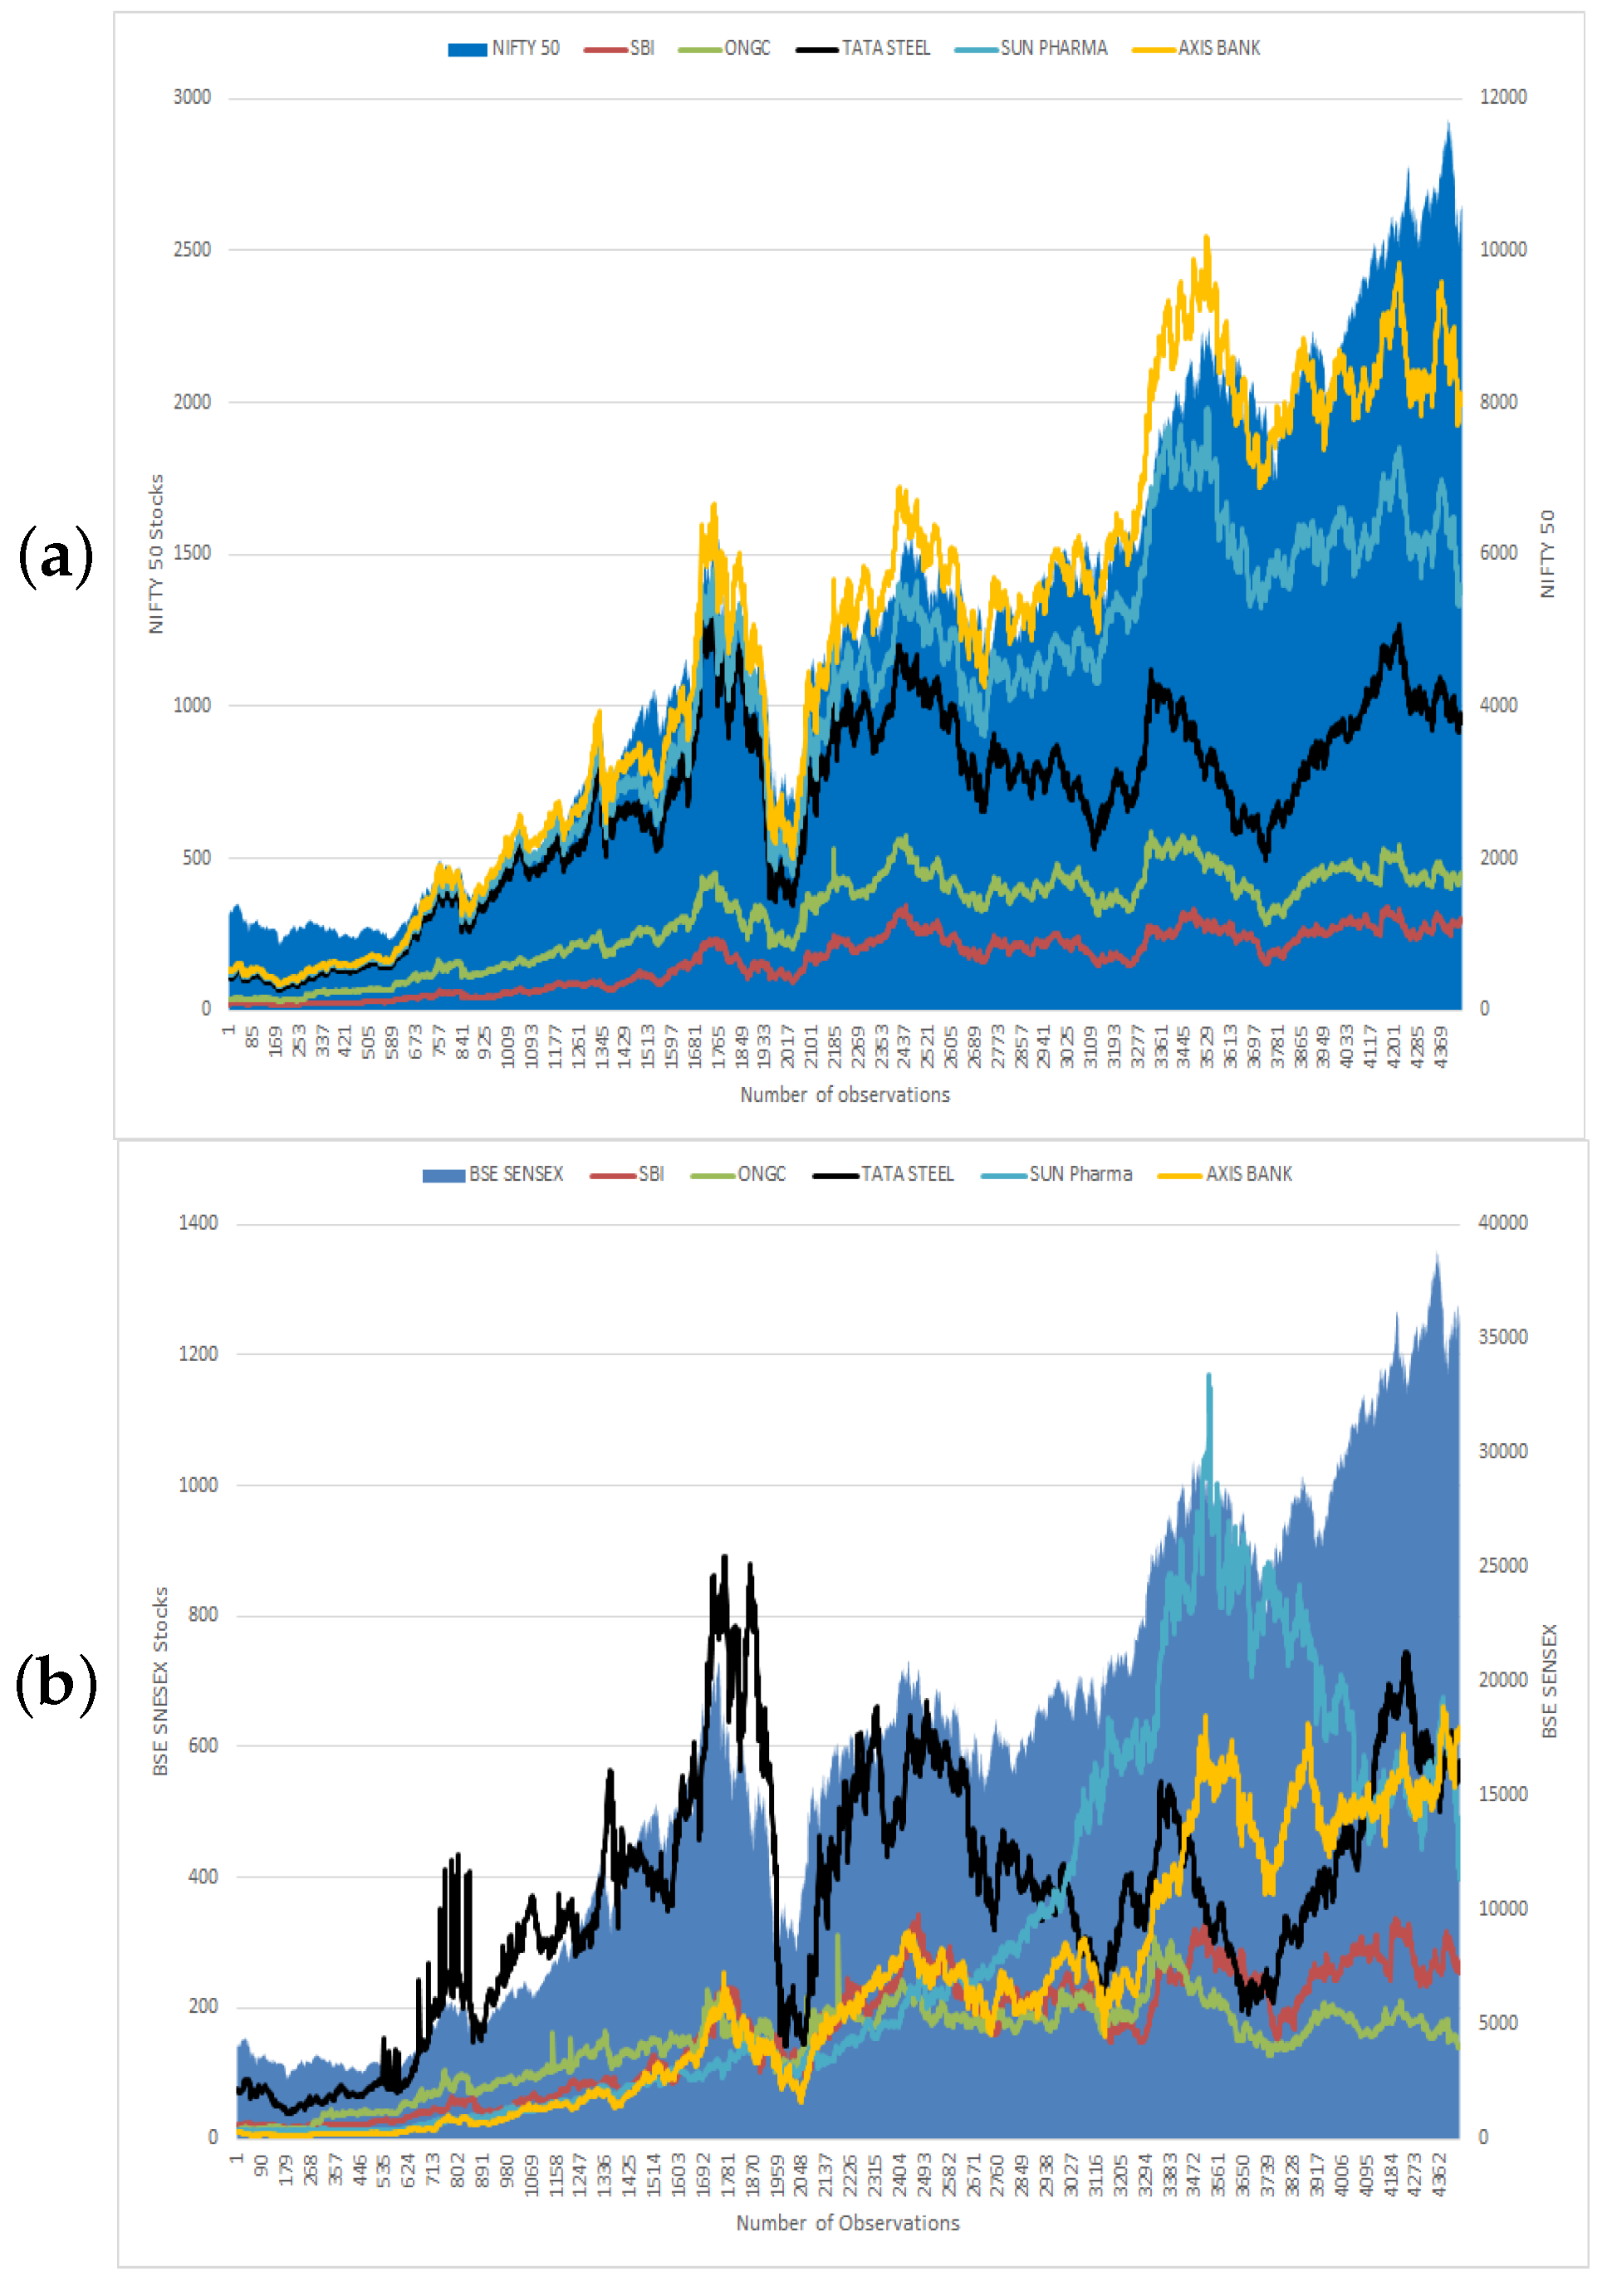
Figure 3.
Nature of indices with their stocks. (a) NIFTY 50. (b) BSE SENSEX.
Figure 3.
Nature of indices with their stocks. (a) NIFTY 50. (b) BSE SENSEX.
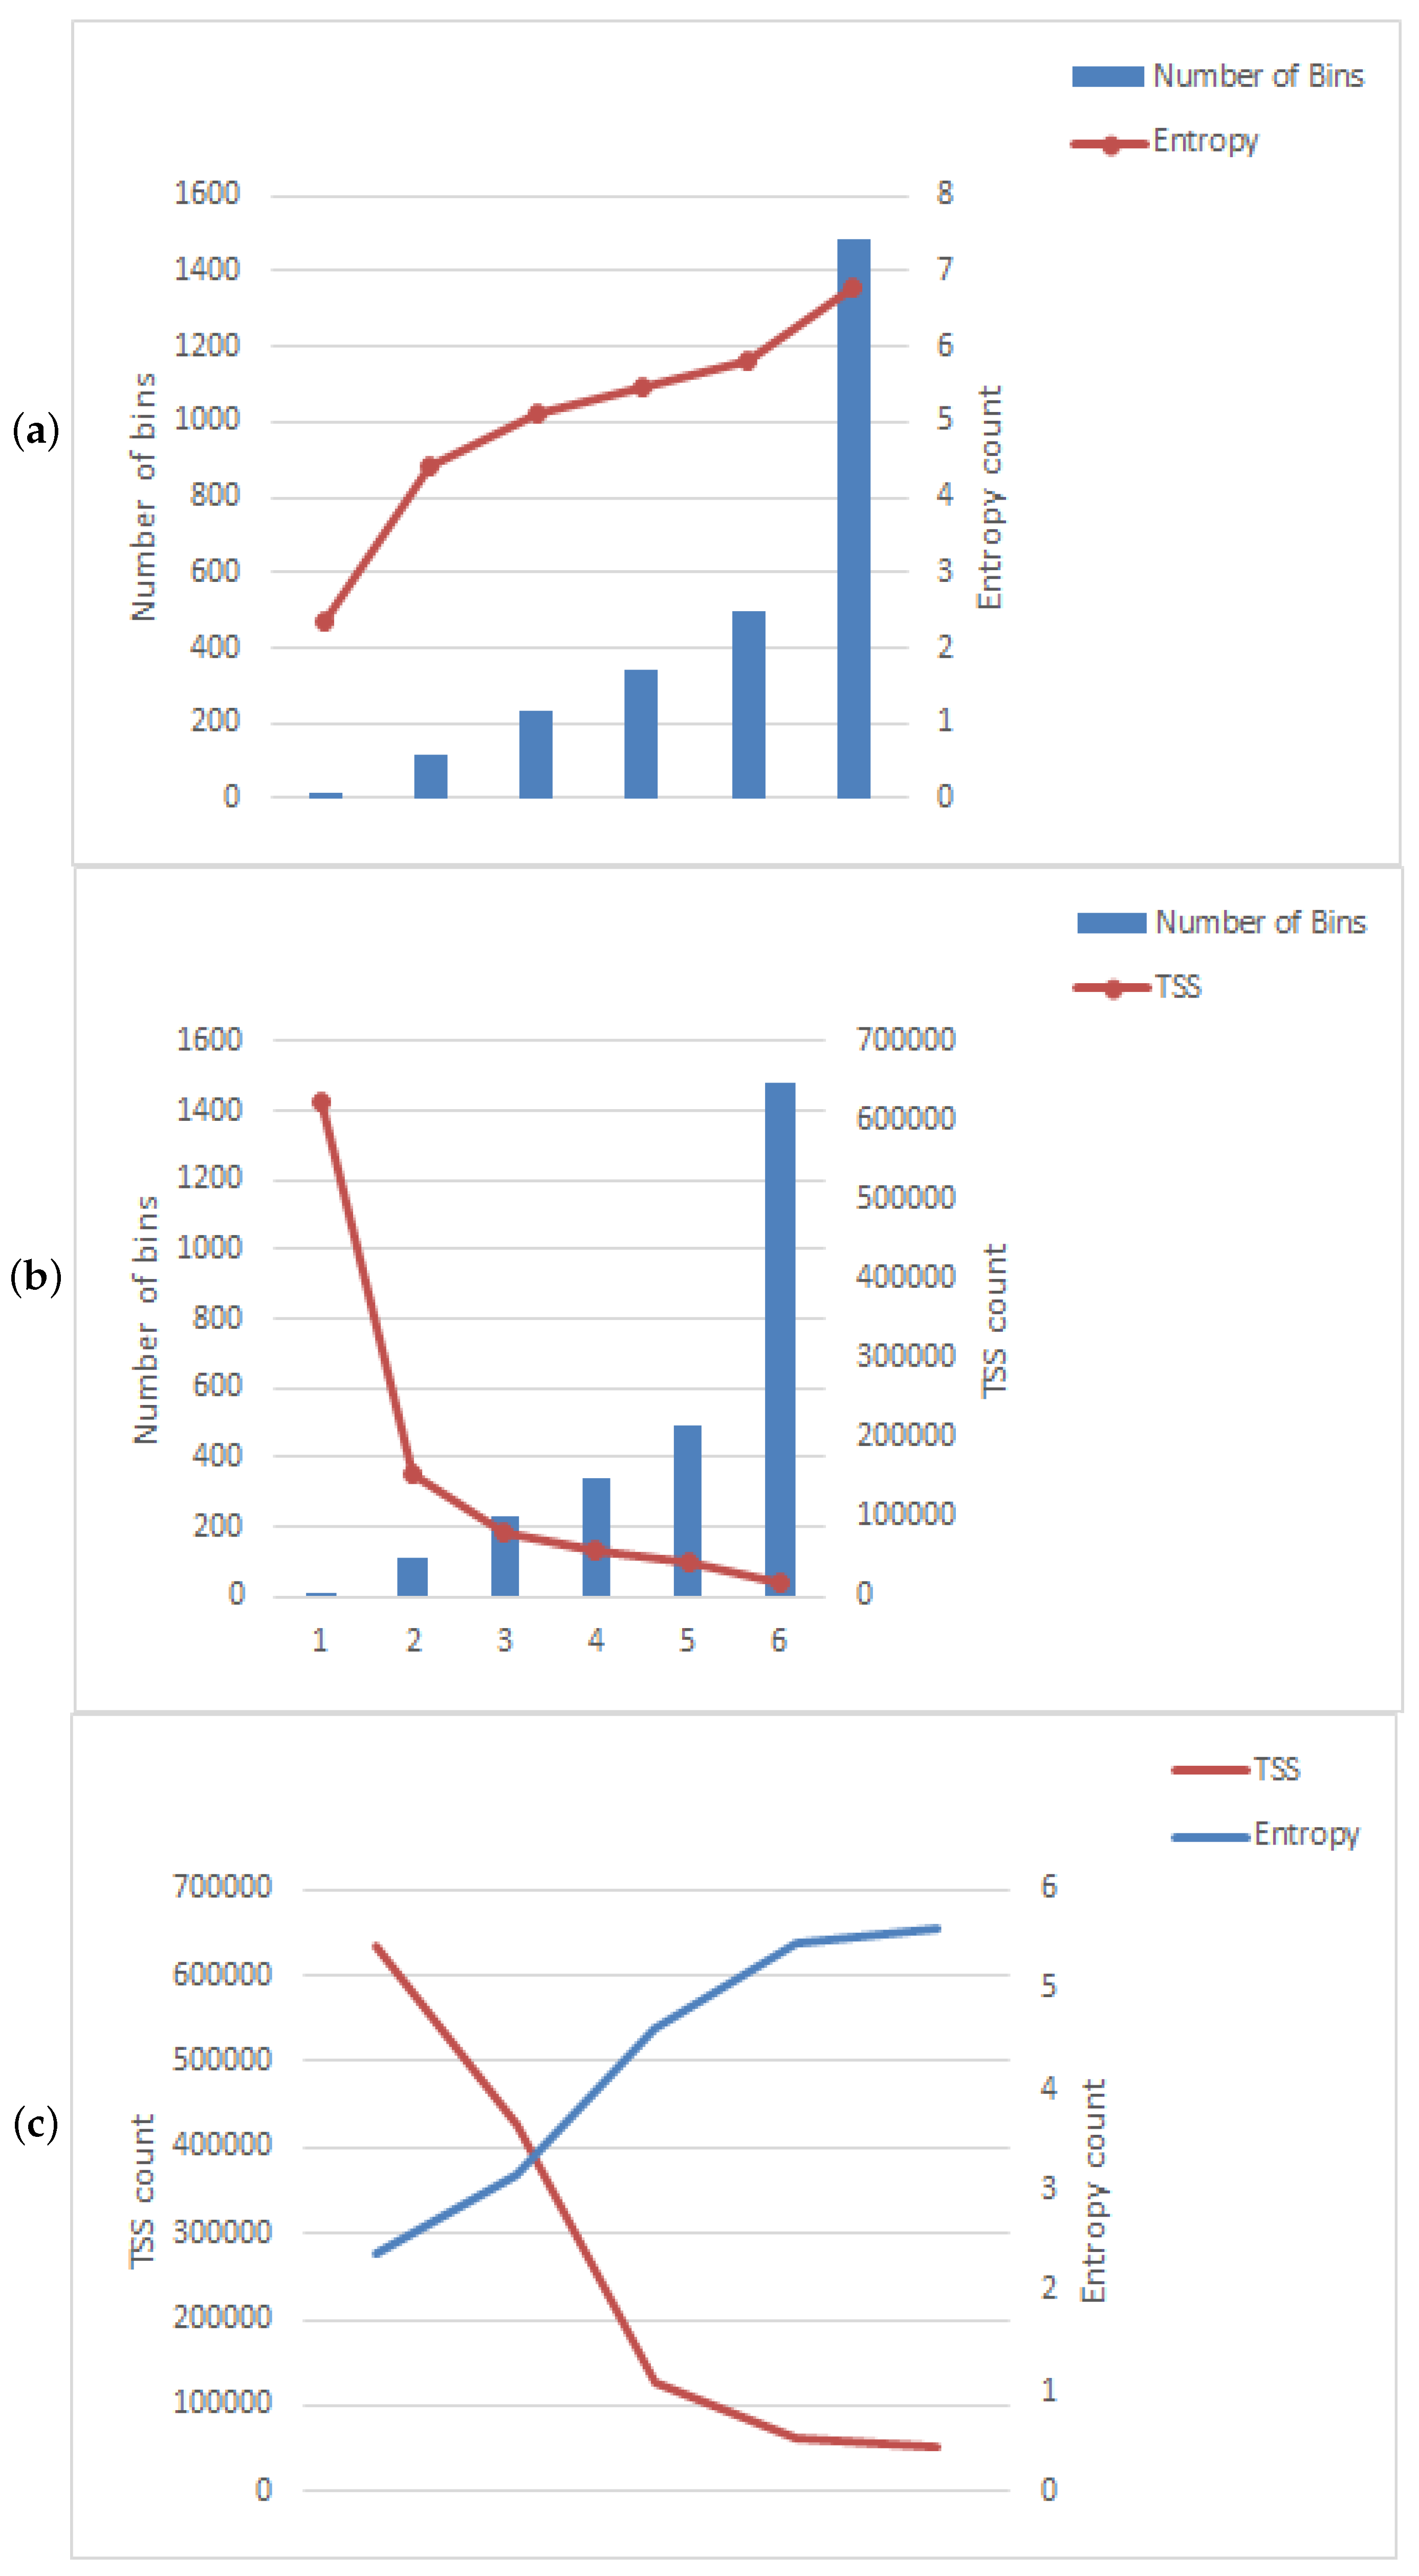
Figure 4.
Comparison of Shannon entropy and Total sum of square of BSE sensex stocks. (a) Entropy with bins. (b) TSS with bins. (c) Entropy and TSS.
Figure 4.
Comparison of Shannon entropy and Total sum of square of BSE sensex stocks. (a) Entropy with bins. (b) TSS with bins. (c) Entropy and TSS.
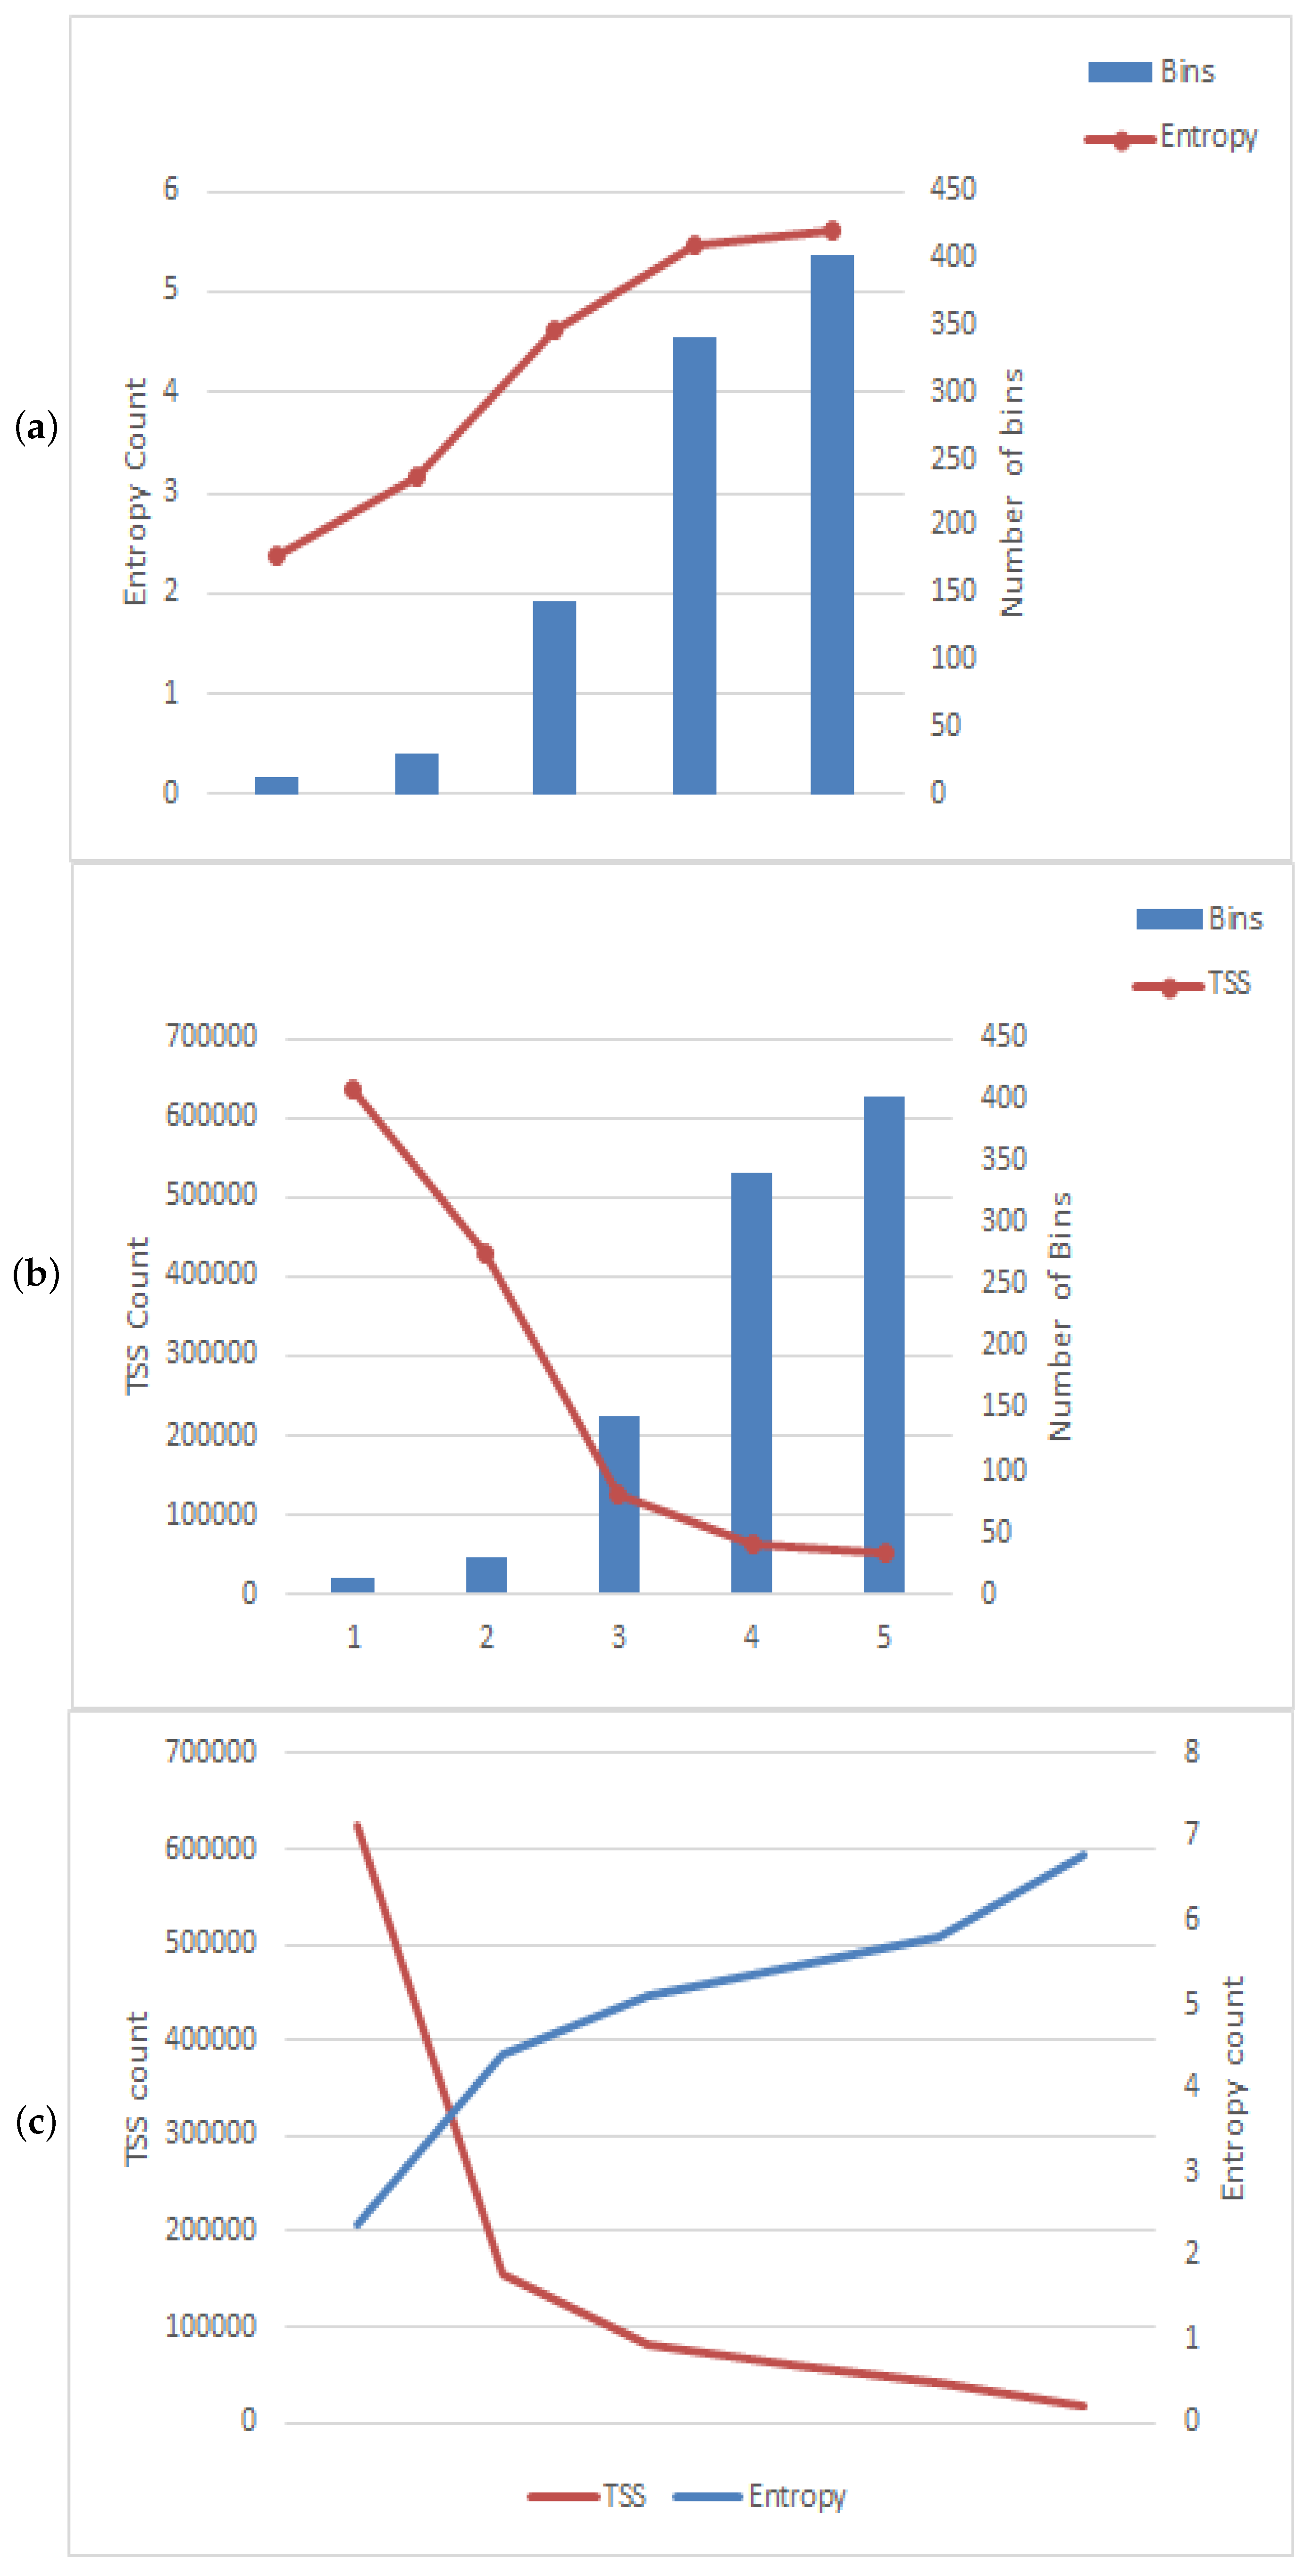
Figure 5.
Comparison of Shannon entropy and Total sum of square of NIFTY 50 stocks. (a) Entropy with bins. (b) TSS with bins. (c) Entropy and TSS.
Figure 5.
Comparison of Shannon entropy and Total sum of square of NIFTY 50 stocks. (a) Entropy with bins. (b) TSS with bins. (c) Entropy and TSS.
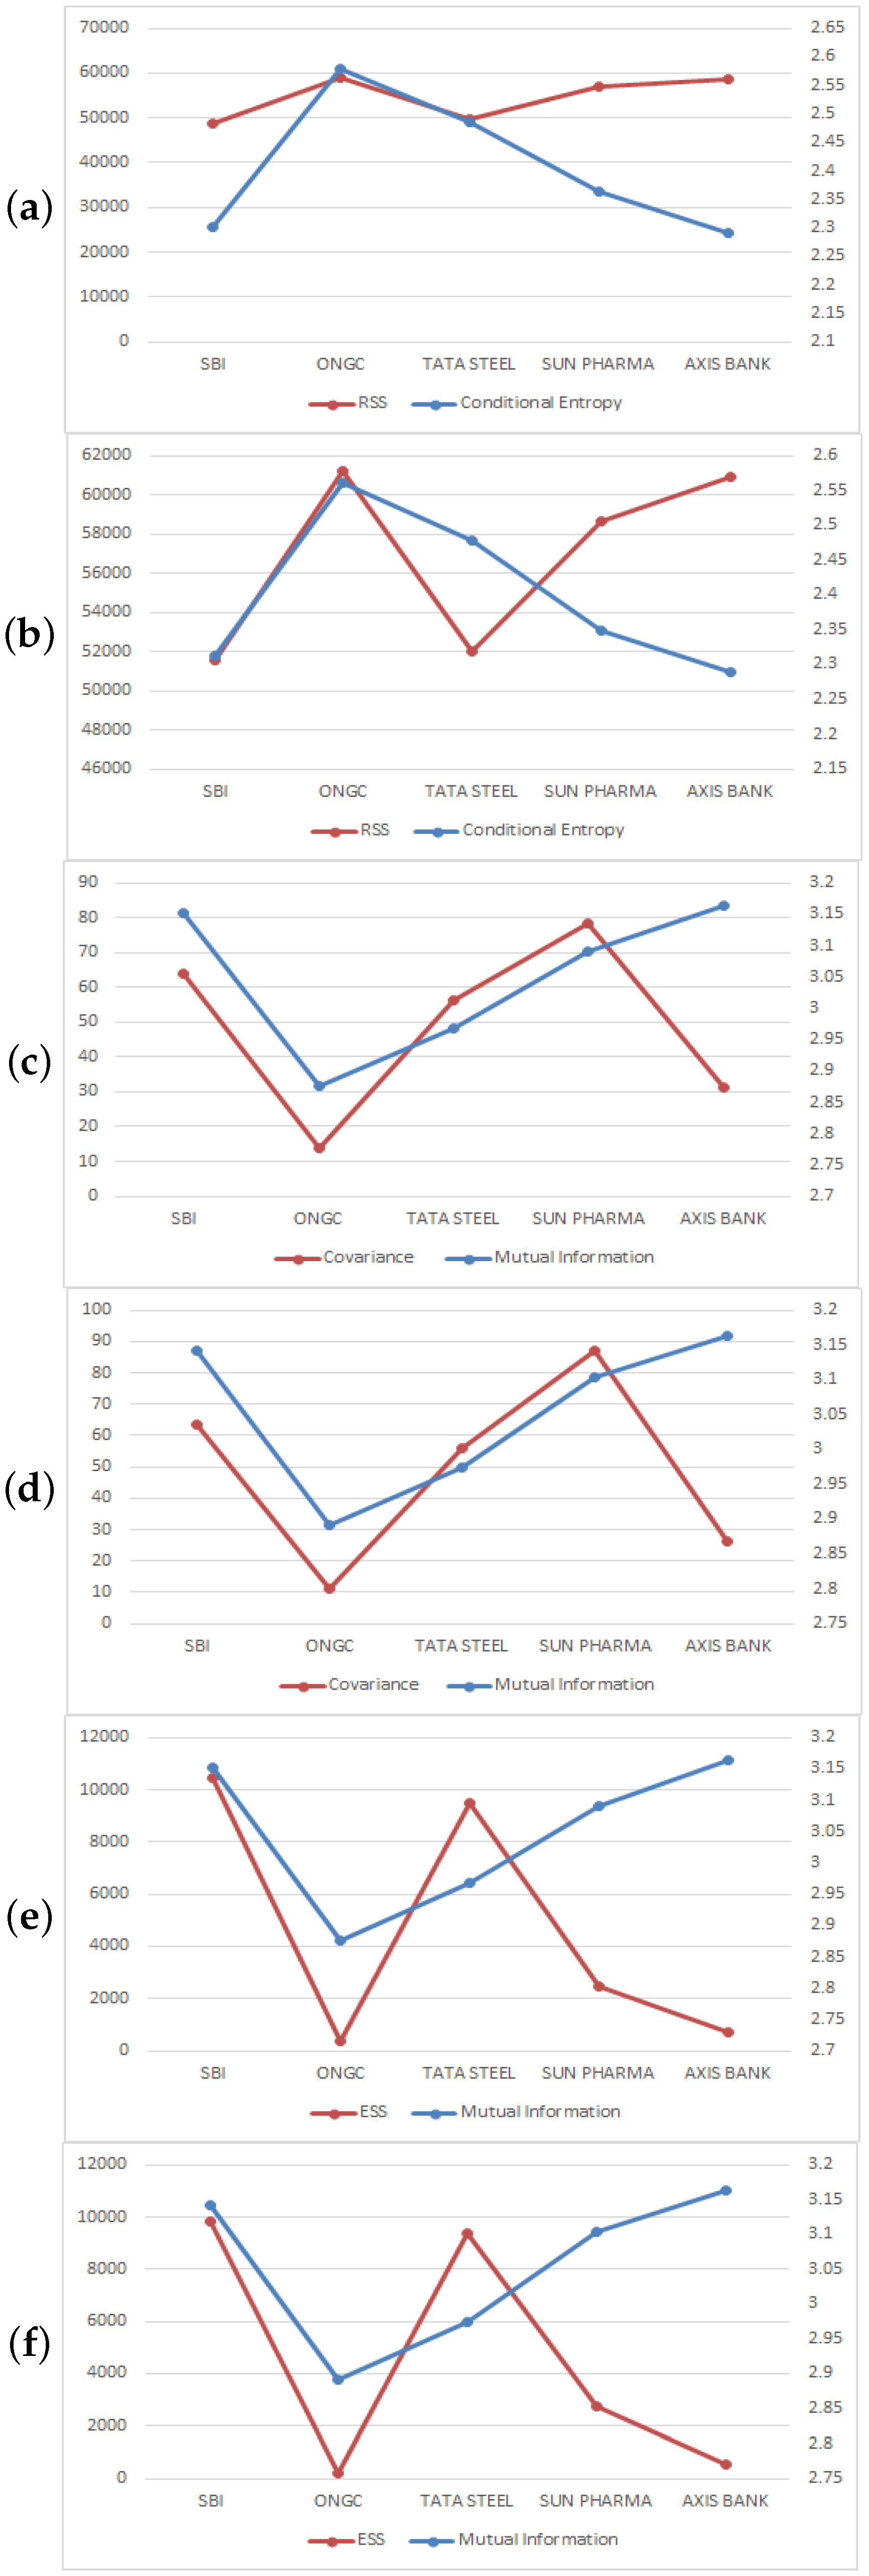
Figure 6.
Comparison of information and statistical meaures of NIFTY 50 and BSE sensex stocks. (a) Conditional entropy and RSS with Nifty stocks. (b) Conditional entropy and RSS with BSE sensex stocks. (c) Mutual information and covariance with Nifty stocks. (d) Mutual information and covariance with BSE sensex stocks. (e) Mutual information and ESS with Nifty stocks. (f) Mutual information and ESS with BSE sensex stocks.
Figure 7.
Comparison of information and statistical meaures of NIFTY 50 and BSE sensex stocks. (a) Correlation and Normalized mutual information with Nifty stocks. (b) Correlation and Normalized mutual information with BSE sensex stocks. (c) Relative mutual information and R2 with Nifty stocks. (d) Relative mutual information and R2 with BSE sensex stocks.
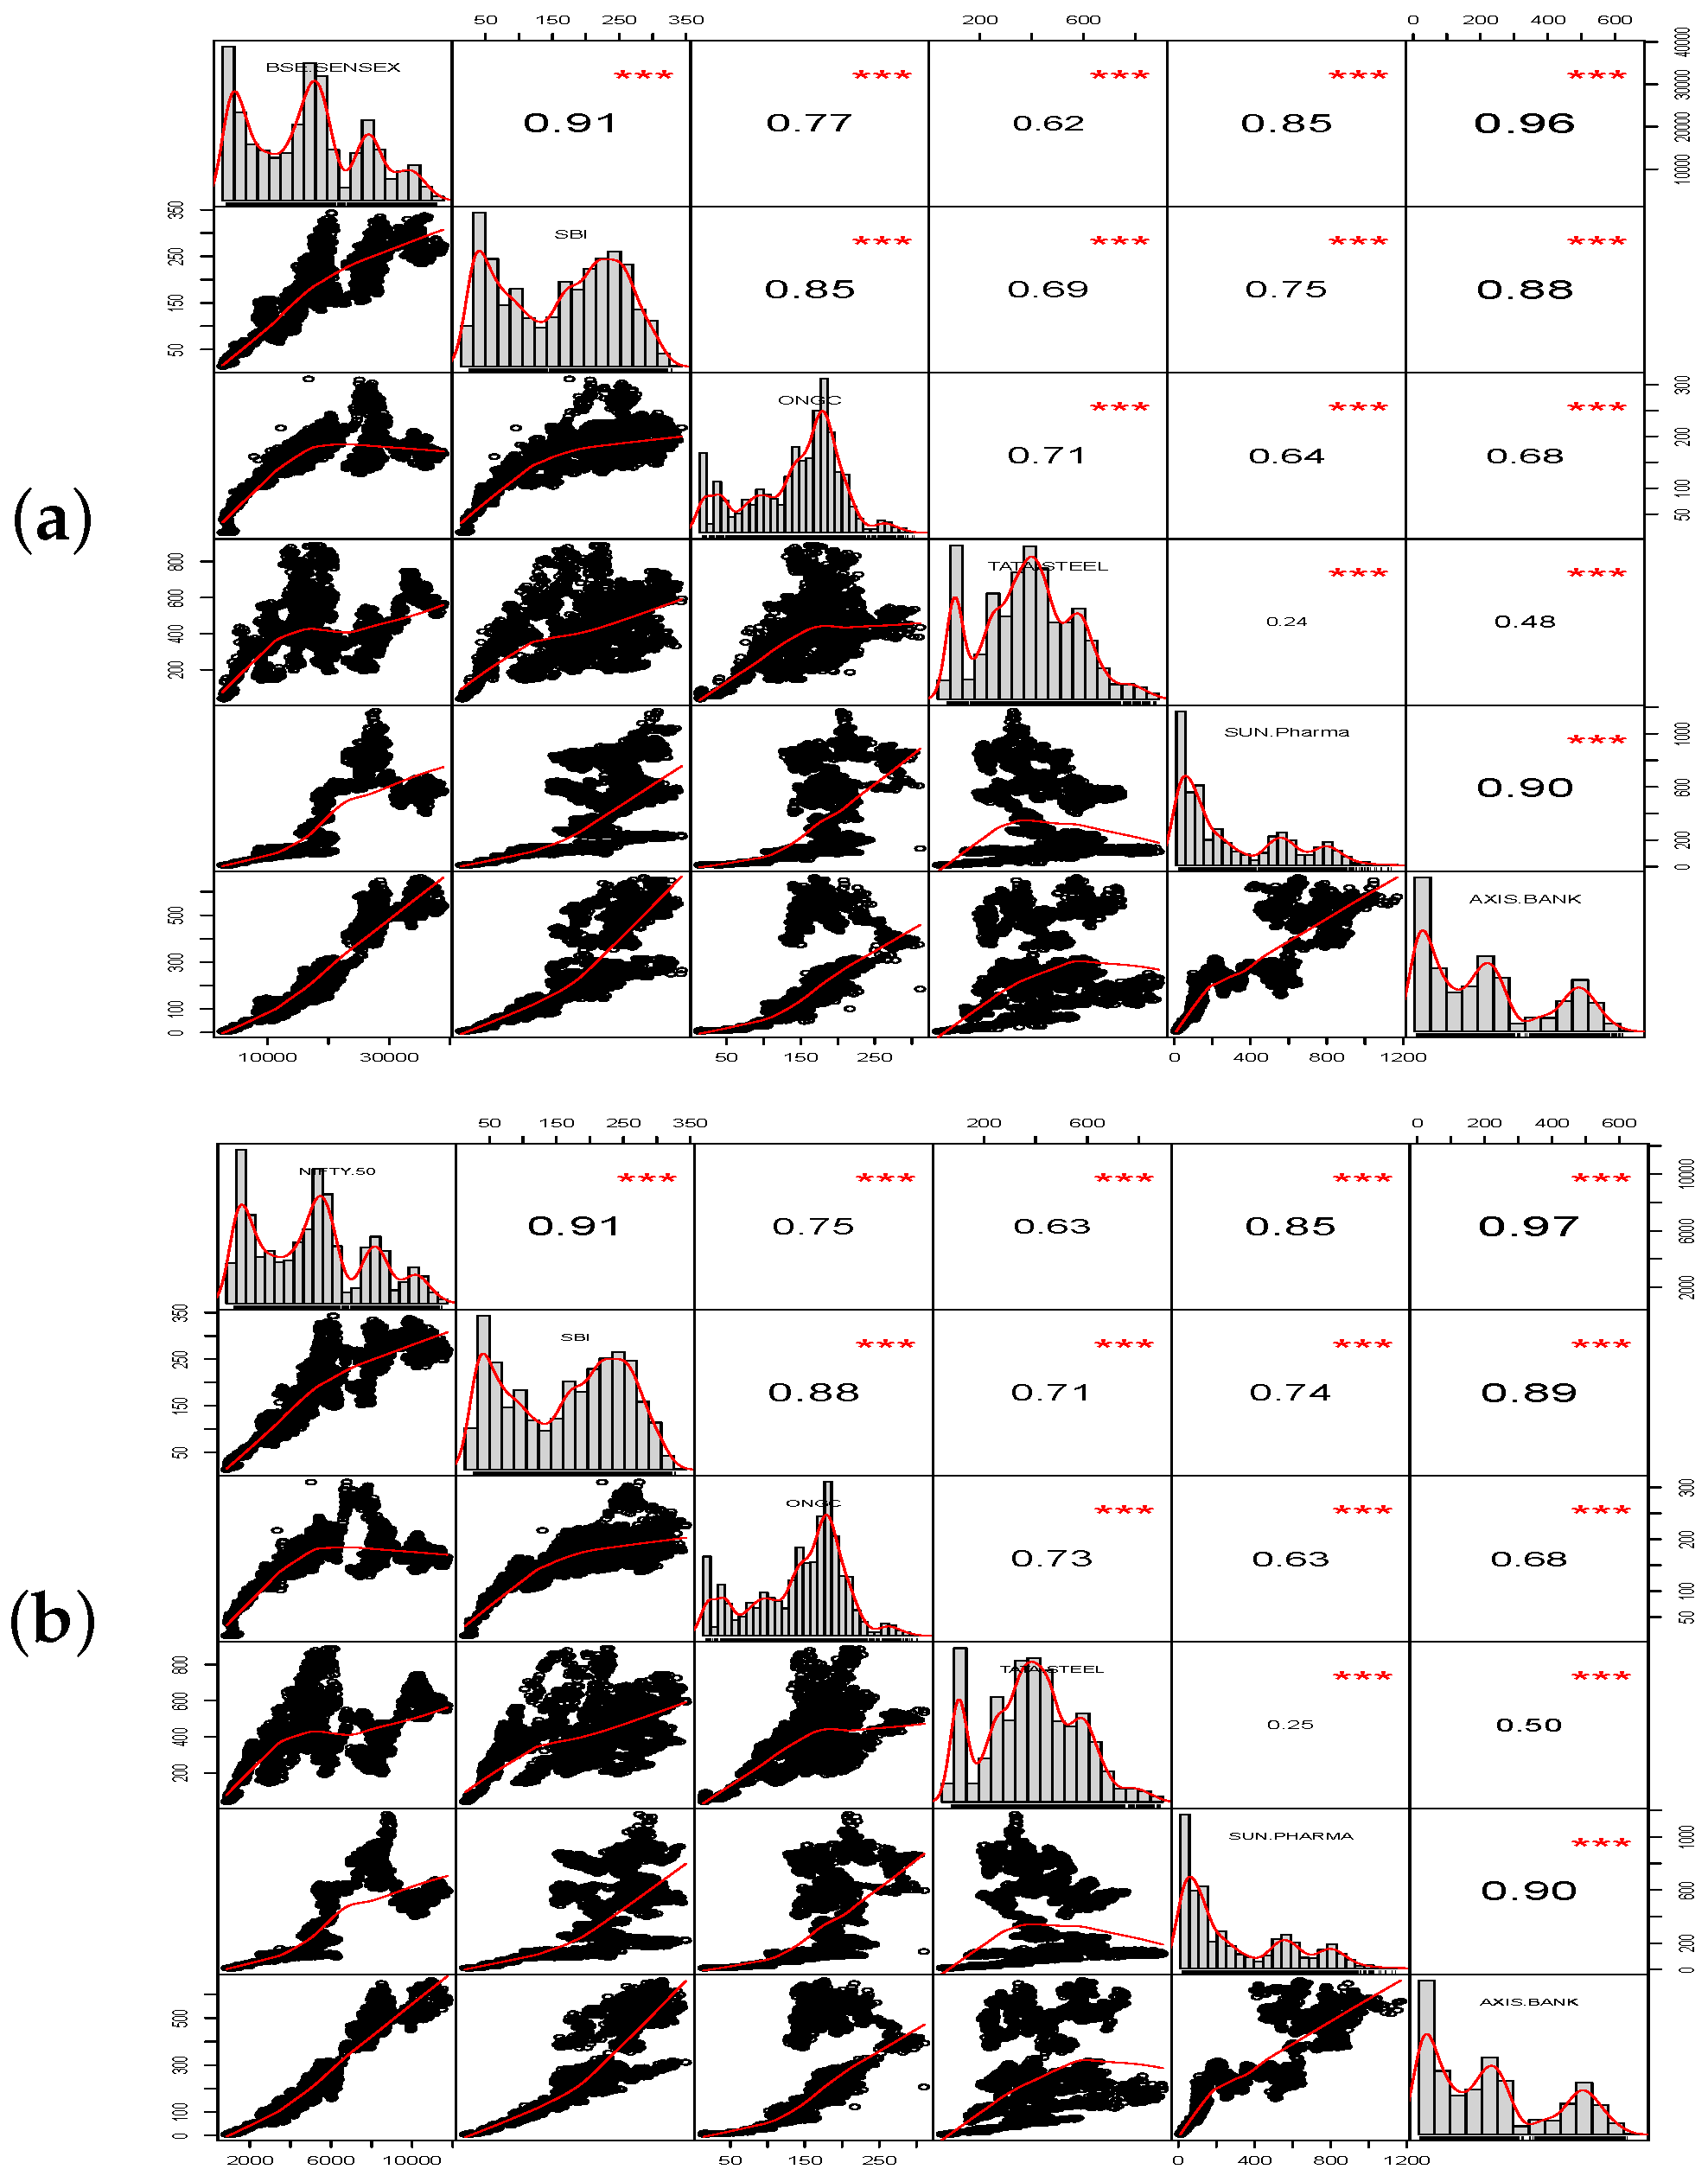
Figure 8.
Correlation matrix plot of BSE sensex and Nifty 50 with their stocks SBI, ONGC, Tata Steel, Sun Pharma, and Axis Bank. (a) BSE sensex. (b) NIFTY 50. The distribution of each stock/index is shown on the diagonal; on the lower diagonal, the bi-variate scatter plots with the fitted higher order degree polynomial are shown and on the upper diagonal, the correlation value plus the significance level (p-values: 0.001) as stars (“***”).
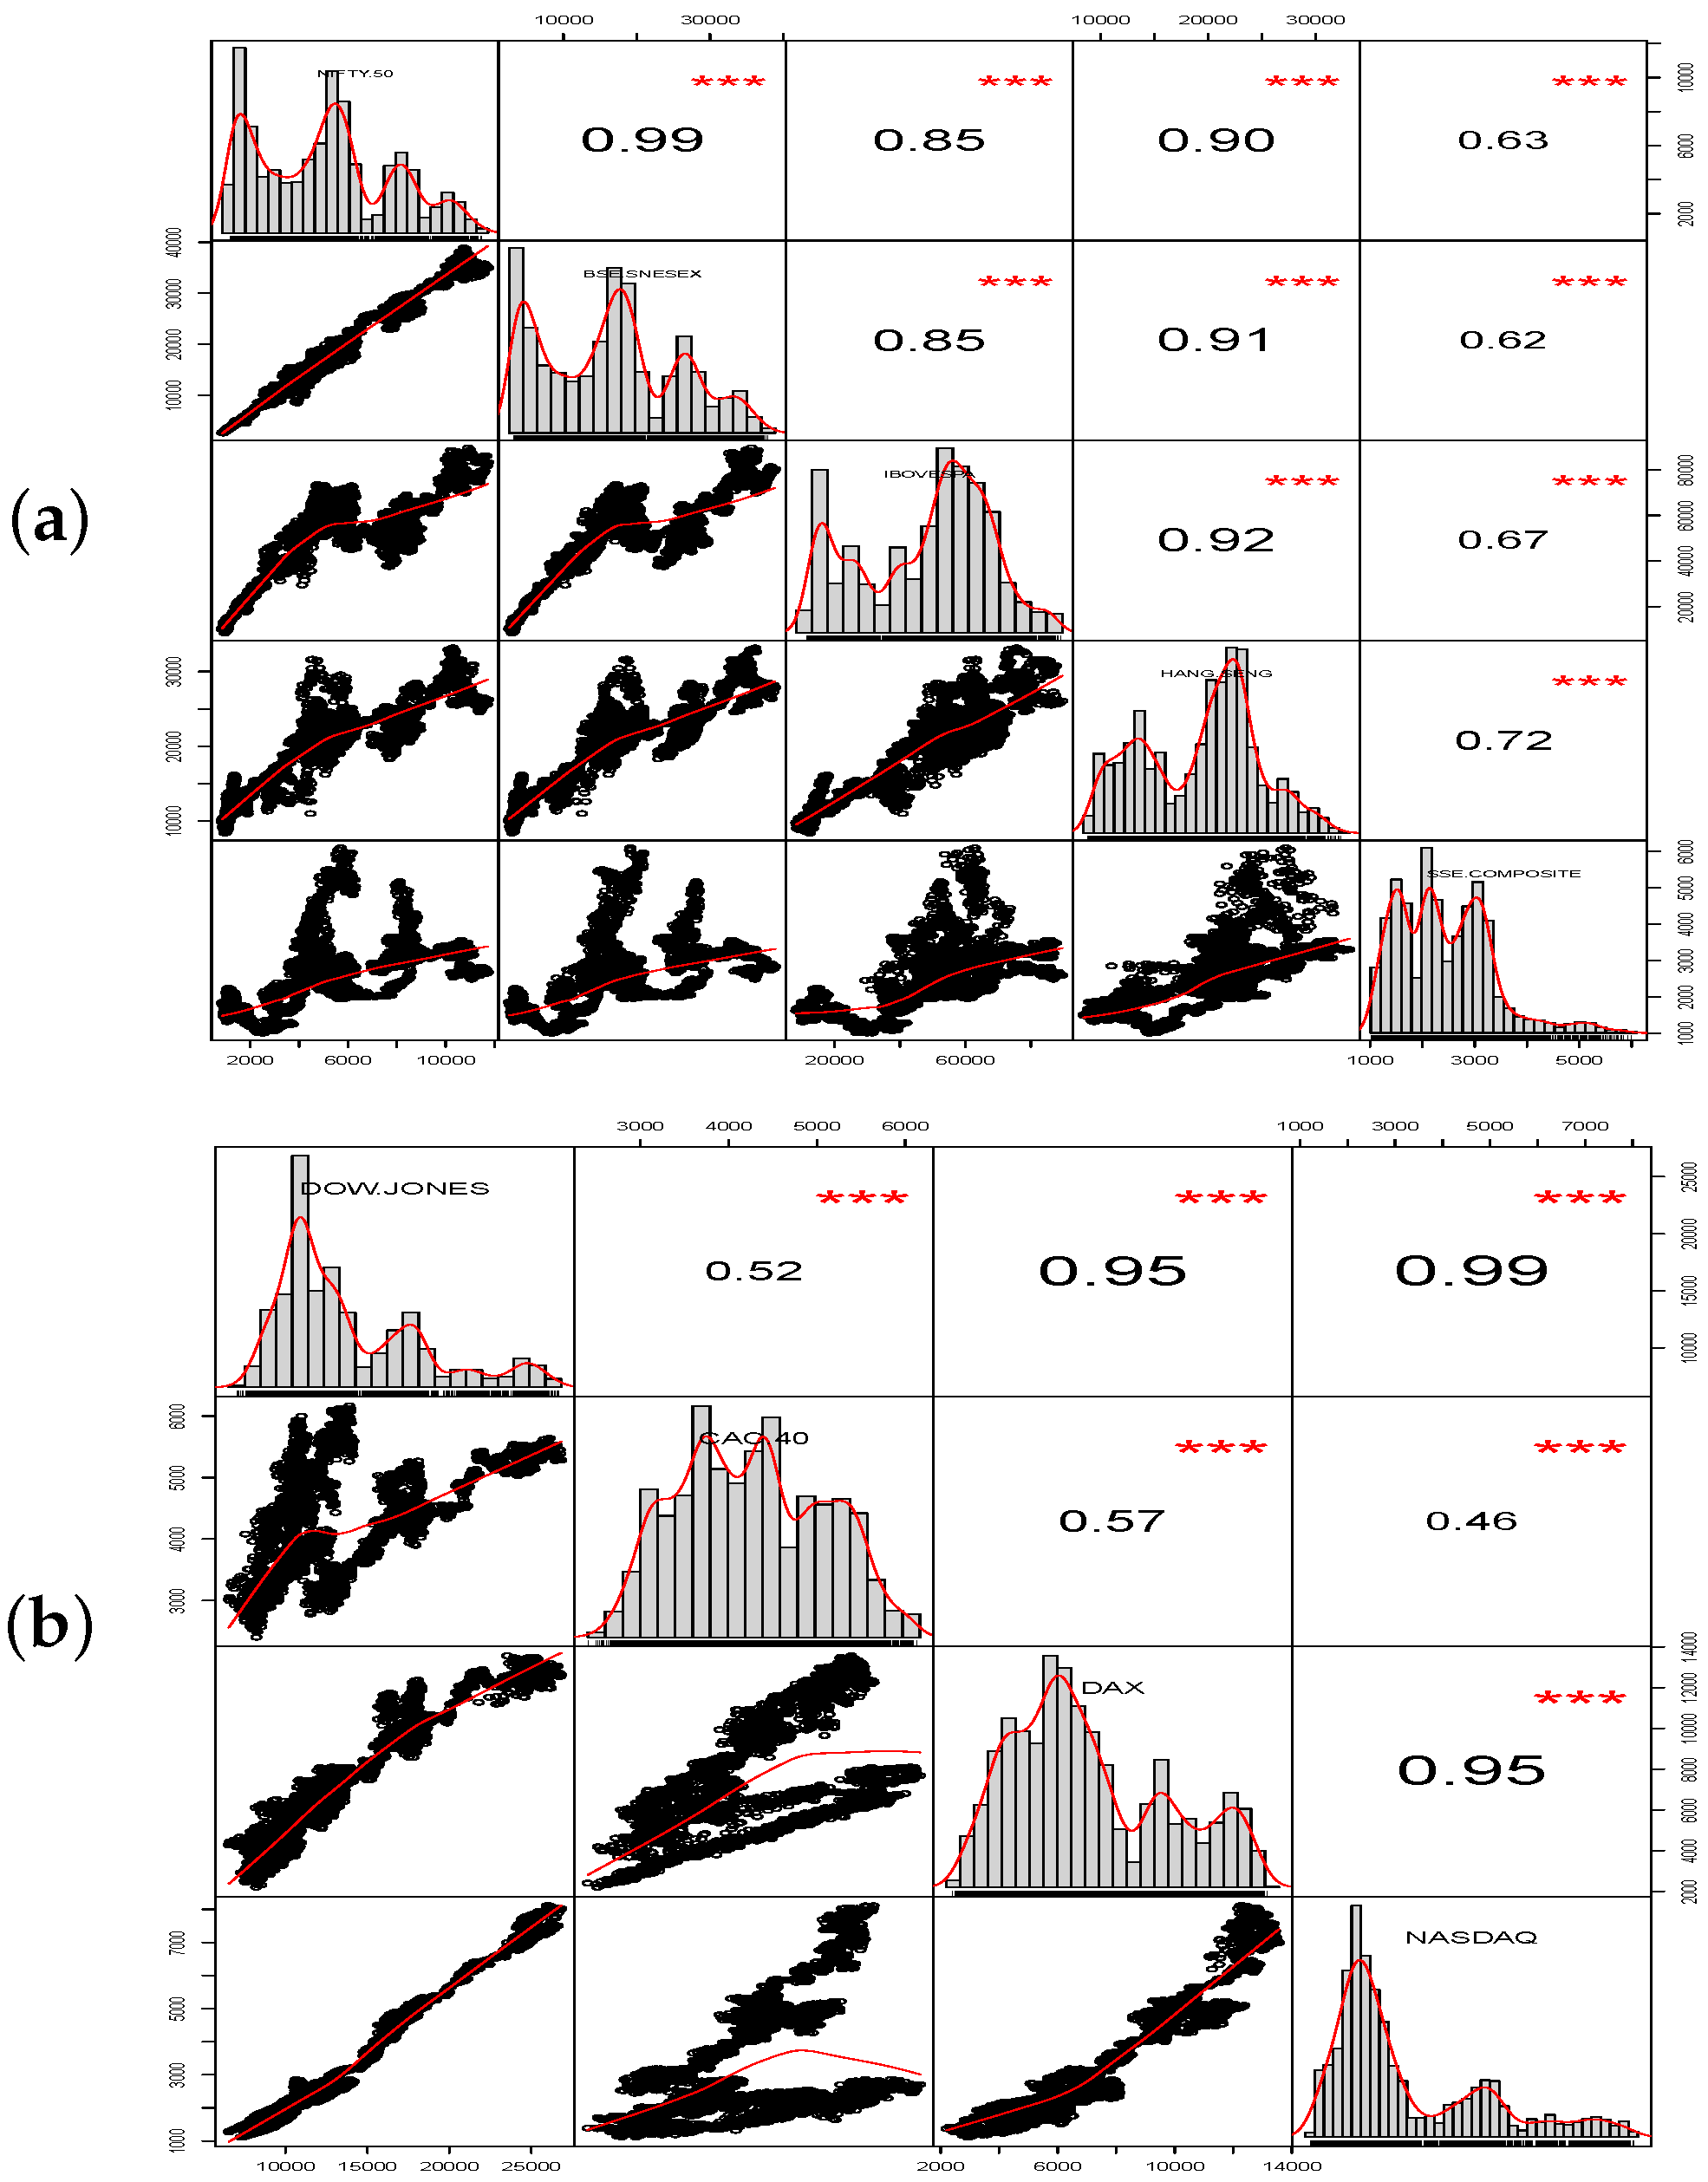
Figure 9.
Correlation matrix plot of indices: Nifty 50 with BSE sensex, IBOVESPA, Hang Seng, and SSE Composite and Dow Jones with CAC 40, DAX, and NASDAQ. (a) Nifty 50. (b) Dow Jones. The distribution of each stock/index is shown on the diagonal; on the lower diagonal, the bi-variate scatter plots with the fitted higher order degree polynomial are shown and on the upper diagonal, the correlation value plus the significance level (p-values: 0.001) as stars (“***”).
Table 1.
Equivalences between statistical measures and information theoretic measures.
Table 1.
Equivalences between statistical measures and information theoretic measures.
| Information Theoretical Measures | Statistical Measures |
|---|
| Entropy | (TSS) Total sum of squares |
| Conditional entropy | (RSS) Residual sum of squares |
| I(X,Y) Mutual information | cov(X,Y) Covariance or |
| | (ESS) Explained sum of squares |
| Normalized mutual information | Correlation |
| Relative mutual information | Coefficient of determination |
Table 2.
Correlation between NIFTY 50 index and its stocks with = 0.96765.
Table 2.
Correlation between NIFTY 50 index and its stocks with = 0.96765.
| | NIFTY 50 | SBI | ONGC | TATA STEEL | SUN PHARMA | AXIS BANK |
|---|
| NIFTY 50 | 1 | | | | | |
| SBI | 0.91277 | 1 | | | | |
| ONGC | 0.75195 | 0.87759 | 1 | | | |
| TATA STEEL | 0.62706 | 0.70924 | 0.72980 | 1 | | |
| SUN PHARMA | 0.84981 | 0.74144 | 0.63281 | 0.24771 | 1 | |
| AXIS BANK | 0.96812 | 0.88938 | 0.68445 | 0.49662 | 0.90294 | 1 |
Table 3.
Correlation between BSE sensex index and its stocks with = 0.96035.
Table 3.
Correlation between BSE sensex index and its stocks with = 0.96035.
| | BSE Sensex | SBI | ONGC | TATA STEEL | SUN Pharma | AXIS BANK |
|---|
| BSE sensex | 1 | | | | | |
| SBI | 0.90630 | 1 | | | | |
| ONGC | 0.77082 | 0.85210 | 1 | | | |
| TATA STEEL | 0.61634 | 0.69028 | 0.71104 | 1 | | |
| SUN Pharma | 0.84751 | 0.74785 | 0.63540 | 0.23767 | 1 | |
| AXIS BANK | 0.96070 | 0.88372 | 0.67863 | 0.48074 | 0.90138 | 1 |
Table 4.
Correlation between International Indices A.
Table 4.
Correlation between International Indices A.
| | NIFTY 50 | BSE Sensex | IBOVESPA | HANG SENG | SSE COMPOSITE |
|---|
| NIFTY 50 | 1 | | | | |
| BSE sensex | 0.99312 | 1 | | | |
| IBOVESPA | 0.84651 | 0.85487 | 1 | | |
| HANG SENG | 0.90201 | 0.91444 | 0.91677 | 1 | |
| SSE COMPOSITE | 0.62997 | 0.62134 | 0.66574 | 0.72005 | 1 |
Table 5.
Correlation between International Indices B.
Table 5.
Correlation between International Indices B.
| | DOW JONES | CAC 40 | DAX | NASDAQ |
|---|
| DOW JONES | 1 | | | |
| CAC 40 | 0.51827 | 1 | | |
| DAX | 0.94938 | 0.57404 | 1 | |
| NASDAQ | 0.99037 | 0.46469 | 0.94892 | 1 |
Table 6.
NIFTY 50 and its stocks.
Table 6.
NIFTY 50 and its stocks.
| | Entropy | Conditional Entropy | RSS | Mutual Information | Covariance | TSS/ESS | Normalized Mutual Informaion | Correlation | Relative Mutual Information | | Global Correlation Coefficient | Beta | Joint Entropy | Variation of Information |
|---|
| Number of Bins: 13 | | | | | | | | | | | | | | |
| NIFTY 50 | 2.36540 | | | | | 624,968.00000 | | | | | | | | |
| SBI | 2.45800 | 1.19399 | 525,211.40000 | 1.17139 | 14,421.80000 | 99,756.55000 | 0.48580 | 0.39952 | 0.49522 | 0.15962 | 0.95075 | 0.27691 | 3.65204 | 1.57500 |
| ONGC | 2.25030 | 1.27108 | 611,529.30000 | 1.09430 | 9615.42000 | 13,438.65000 | 0.47432 | 0.14664 | 0.46263 | 0.02150 | 0.94229 | 0.18463 | 3.52135 | 1.55790 |
| TATA STEEL | 2.31830 | 1.55828 | 271,045.30000 | 0.80710 | 39,897.10000 | 353,922.70000 | 0.34466 | 0.75253 | 0.34121 | 0.56631 | 0.89495 | 0.76606 | 3.87655 | 1.75198 |
| SUN PHARMA | 2.01200 | 1.24765 | 311,598.80000 | 1.11772 | 70,651.40000 | 313,369.20000 | 0.51235 | 0.70811 | 0.47253 | 0.50142 | 0.94501 | 1.35658 | 3.25969 | 1.46354 |
| AXIS BANK | 2.24080 | 0.95023 | 311,899.70000 | 1.41515 | 50,735.60000 | 313,068.3 | 0.61468 | 0.70777 | 0.59827 | 0.50093 | 0.97005 | 0.97417 | 3.19106 | 1.33263 |
| Number of Bins: 114 | | | | | | | | | | | | | | |
| NIFTY 50 | 4.40485 | | | | | 155,446.00000 | | | | | | | | |
| SBI | 4.51377 | 2.36359 | 109,584.07000 | 2.04125 | 602.40700 | 45,861.93000 | 0.45778 | 0.54317 | 0.45222 | 0.29503 | 0.99153 | 0.43791 | 6.87737 | 2.19911 |
| ONGC | 4.27008 | 2.54428 | 154,842.61420 | 1.86057 | 90.22120 | 603.38580 | 0.42900 | 0.06230 | 0.43572 | 0.00388 | 0.98782 | 0.06559 | 6.81436 | 2.22571 |
| TATA STEEL | 4.42332 | 2.63715 | 117,870.67000 | 1.76769 | 543.83200 | 37,575.33000 | 0.40046 | 0.49165 | 0.39963 | 0.24172 | 0.98531 | 0.39533 | 7.06047 | 2.30060 |
| SUN PHARMA | 4.01116 | 2.17026 | 141,939.42000 | 2.23459 | 756.63700 | 13,506.58000 | 0.53161 | 0.29476 | 0.55709 | 0.08688 | 0.99425 | 0.55003 | 6.18142 | 1.98666 |
| AXIS BANK | 4.22039 | 2.13511 | 152,160.01800 | 2.26973 | 324.84100 | 3285.98200 | 0.52642 | 0.14539 | 0.53780 | 0.02113 | 0.99464 | 0.23614 | 6.35551 | 2.02133 |
| Number of Bins: 234 | | | | | | | | | | | | | | |
| NIFTY 50 | 5.09440 | | | | | 82,294.00000 | | | | | | | | |
| SBI | 5.19725 | 2.41142 | 66,285.66000 | 2.68298 | 133.91900 | 16,008.34000 | 0.52141 | 0.44105 | 0.52665 | 0.19452 | 0.99766 | 0.37916 | 7.60868 | 2.21939 |
| ONGC | 4.95544 | 2.66188 | 81,787.85930 | 2.43251 | 29.42920 | 506.14070 | 0.48413 | 0.07842 | 0.47748 | 0.00615 | 0.99613 | 0.08332 | 7.61733 | 2.27701 |
| TATA STEEL | 5.12072 | 1.93975 | 68,218.60000 | 2.47435 | 117.95700 | 14,075.40000 | 0.48445 | 0.41356 | 0.48569 | 0.17103 | 0.99644 | 0.33397 | 7.06047 | 2.14152 |
| SUN PHARMA | 4.64187 | 2.37953 | 78,821.26900 | 2.71487 | 163.41200 | 3472.73100 | 0.55828 | 0.20542 | 0.53291 | 0.04219 | 0.99780 | 0.46267 | 7.02140 | 2.07521 |
| AXIS BANK | 4.91521 | 2.33849 | 80,765.57500 | 2.75591 | 76.24460 | 1528.42500 | 0.55074 | 0.13628 | 0.54096 | 0.01857 | 0.99797 | 0.21587 | 7.25371 | 2.12080 |
| Number of Bins: 342 | | | | | | | | | | | | | | |
| NIFTY 50 | 5.45397 | | | | | 59,342.00000 | | | | | | | | |
| SBI | 5.56269 | 2.30139 | 48,867.00000 | 3.15258 | 63.97360 | 10,474.90000 | 0.57235 | 0.42014 | 0.57803 | 0.17652 | 0.99908 | 0.36761 | 7.86408 | 2.17059 |
| ONGC | 5.32691 | 2.57858 | 58,991.00000 | 2.87539 | 13.99120 | 350.64500 | 0.53346 | 0.07687 | 0.52721 | 0.00591 | 0.99840 | 0.08040 | 7.90540 | 2.24278 |
| TATA STEEL | 5.48573 | 2.48593 | 49,847.00000 | 2.96804 | 56.51610 | 9495.09000 | 0.54262 | 0.40001 | 0.54419 | 0.16001 | 0.99867 | 0.32476 | 7.97166 | 2.23687 |
| SUN PHARMA | 5.00516 | 2.36412 | 56,861.00000 | 3.08985 | 78.31970 | 2480.87000 | 0.59138 | 0.20447 | 0.56653 | 0.04181 | 0.99896 | 0.45005 | 7.36928 | 2.06867 |
| AXIS BANK | 5.27565 | 2.29104 | 58,604.00000 | 3.16292 | 31.07630 | 738.05400 | 0.58965 | 0.11152 | 0.57993 | 0.01244 | 0.99910 | 0.17858 | 7.56670 | 2.09851 |
| Number of Bins: 494 | | | | | | | | | | | | | | |
| NIFTY 50 | 5.80256 | | | | | 42,468.00000 | | | | | | | | |
| SBI | 5.90688 | 2.14323 | 35,651.97000 | 3.65933 | 31.17240 | 6816.03000 | 0.62504 | 0.40062 | 0.61950 | 0.16049 | 0.99966 | 0.36187 | 8.05011 | 2.09542 |
| ONGC | 5.67248 | 2.42322 | 42,191.98000 | 3.37934 | 7.23935 | 276.02000 | 0.58902 | 0.08061 | 0.59574 | 0.00649 | 0.99941 | 0.08404 | 8.09570 | 2.17172 |
| TATA STEEL | 5.83876 | 2.29205 | 35,612.20000 | 3.51050 | 27.99800 | 6855.81000 | 0.60311 | 0.40178 | 0.60124 | 0.16143 | 0.99955 | 0.32502 | 8.13082 | 2.14949 |
| SUN PHARMA | 5.32343 | 2.31891 | 41,213.97000 | 3.48364 | 35.53140 | 1254.03000 | 0.62679 | 0.17183 | 0.65439 | 0.02952 | 0.99952 | 0.41248 | 7.64235 | 2.03929 |
| AXIS BANK | 5.61646 | 2.51435 | 41,923.79000 | 3.51050 | 15.80730 | 544.21300 | 0.61493 | 0.11320 | 0.62503 | 0.01281 | 0.99955 | 0.18350 | 8.13082 | 2.14949 |
| Number of Bins: 1482 | | | | | | | | | | | | | | |
| NIFTY 50 | 6.77728 | | | | | 17,490.00000 | | | | | | | | |
| SBI | 6.88017 | 1.43809 | 15,580.71000 | 5.33919 | 3.61783 | 1909.30000 | 0.78189 | 0.33040 | 0.77602 | 0.10916 | 0.99998 | 0.30635 | 8.31826 | 1.72599 |
| ONGC | 6.66510 | 1.67938 | 17,431.45000 | 5.09790 | 0.70358 | 58.55070 | 0.75850 | 0.05785 | 0.76486 | 0.00334 | 0.99998 | 0.05958 | 8.34448 | 1.80182 |
| TATA STEEL | 6.81970 | 1.52493 | 15,687.37000 | 5.25235 | 3.19311 | 1802.63000 | 0.77257 | 0.32103 | 0.77017 | 0.10306 | 0.99998 | 0.27038 | 8.34463 | 1.75848 |
| SUN PHARMA | 6.27082 | 1.85394 | 17,199.72000 | 4.92333 | 3.85145 | 290.28400 | 0.75521 | 0.12882 | 0.78511 | 0.01659 | 0.99997 | 0.32613 | 8.12477 | 1.78925 |
| AXIS BANK | 6.58587 | 1.63262 | 17,377.21000 | 5.14466 | 1.50709 | 112.79300 | 0.77005 | 0.08030 | 0.78116 | 0.00644 | 0.99998 | 0.12762 | 8.21849 | 1.75323 |
Table 7.
BSE sensex and its stocks.
Table 7.
BSE sensex and its stocks.
| | Entropy | Conditional Entropy | RSS | Mutual Information | Covariance | TSS/ESS | Normalized Mutual Information | Correlation | Relative Mutual Information | | Global Correlation Coefficient | Beta | Joint Entropy | Variation of Information |
|---|
| Number of Bins: 13 | | | | | | | | | | | | | | |
| BSE sensex | 2.36610 | | | | | 63,4618.00000 | | | | | | | | |
| SBI | 2.45447 | 1.21135 | 507,692.90000 | 1.15475 | 16,513.00000 | 126,925.10000 | 0.47917 | 0.44721 | 0.48803 | 0.20000 | 0.94900 | 0.31224 | 3.66582 | 1.58463 |
| ONGC | 2.24806 | 1.26131 | 617,196.60000 | 1.10479 | 10,970.17000 | 17,421.43000 | 0.47902 | 0.16568 | 0.46692 | 0.02745 | 0.94353 | 0.20743 | 3.50937 | 1.55067 |
| TATA STEEL | 2.32674 | 1.56586 | 254,483.20000 | 0.80024 | 40,779.83000 | 380,134.80000 | 0.34105 | 0.77394 | 0.33821 | 0.59899 | 0.89342 | 0.77110 | 3.89260 | 1.75851 |
| SUN PHARMA | 2.00817 | 1.27706 | 332,931.90000 | 1.08904 | 69,300.58000 | 301,686.10000 | 0.49960 | 0.68947 | 0.46026 | 0.47538 | 0.94166 | 1.31040 | 3.28523 | 1.48195 |
| AXIS BANK | 2.22799 | 1.02924 | 329,834.50000 | 1.33686 | 50,682.83000 | 304,783.50000 | 0.58225 | 0.69301 | 0.56500 | 0.48026 | 0.96488 | 0.95836 | 3.25723 | 1.38577 |
| Number of Bins: 31 | | | | | | | | | | | | | | |
| BSE sensex | 3.15224 | | | | | 427,756.00000 | | | | | | | | |
| SBI | 3.28062 | 1.68710 | 299,283.30000 | 1.46514 | 5517.76700 | 128,472.70000 | 0.45560 | 0.54800 | 0.46479 | 0.30034 | 0.97294 | 0.38698 | 4.96772 | 1.87151 |
| ONGC | 3.04249 | 1.75543 | 399,161.80000 | 1.39681 | 4018.90000 | 28,594.25000 | 0.45103 | 0.25854 | 0.44311 | 0.06684 | 0.96891 | 0.28185 | 4.79792 | 1.84421 |
| TATA STEEL | 3.15385 | 2.01077 | 306,297.50000 | 1.14147 | 6719.06700 | 121,458.50000 | 0.36202 | 0.53286 | 0.36211 | 0.28394 | 0.94763 | 0.47123 | 5.16463 | 2.00578 |
| SUN PHARMA | 2.79928 | 1.57570 | 197,588.50000 | 1.57654 | 18,222.33000 | 230,167.50000 | 0.53072 | 0.73354 | 0.50013 | 0.53808 | 0.97840 | 1.27799 | 4.37498 | 1.67285 |
| AXIS BANK | 3.04681 | 1.42946 | 203,804.30000 | 1.72278 | 12,906.50000 | 223,951.70000 | 0.55590 | 0.72356 | 0.54652 | 0.52355 | 0.98392 | 0.90517 | 4.47628 | 1.65936 |
| Number of Bins: 143 | | | | | | | | | | | | | | |
| BSE sensex | 4.62278 | | | | | 127,290.00000 | | | | | | | | |
| SBI | 4.72456 | 2.42919 | 101,753.60000 | 2.19359 | 347.06340 | 25,536.36000 | 0.46937 | 0.44790 | 0.47451 | 0.20061 | 0.99376 | 0.38717 | 7.15375 | 2.22714 |
| ONGC | 4.49114 | 2.59902 | 125,777.00000 | 2.02375 | 101.78170 | 1513.03200 | 0.44414 | 0.10902 | 0.43777 | 0.01188 | 0.99122 | 0.11354 | 7.09017 | 2.25087 |
| TATA STEEL | 4.65221 | 2.64883 | 98,543.81000 | 1.97394 | 343.30990 | 28,746.19000 | 0.42565 | 0.47521 | 0.42700 | 0.22583 | 0.99030 | 0.38298 | 7.30105 | 2.30805 |
| SUN PHARMA | 4.19777 | 2.23328 | 118,472.40000 | 2.38949 | 472.82390 | 8817.57300 | 0.54243 | 0.26319 | 0.51689 | 0.06927 | 0.99578 | 0.52746 | 6.43106 | 2.01036 |
| AXIS BANK | 4.43235 | 2.24883 | 124,754.50000 | 2.37395 | 207.80280 | 2535.48800 | 0.52444 | 0.14113 | 0.51353 | 0.01991 | 0.99565 | 0.23181 | 6.68118 | 2.07538 |
| Number of Bins: 341 | | | | | | | | | | | | | | |
| BSE sensex | 5.45260 | | | | | 61,410.00000 | | | | | | | | |
| SBI | 5.54762 | 2.31164 | 51,572.05000 | 3.14096 | 63.57059 | 9837.95000 | 0.57109 | 0.40025 | 0.57604 | 0.16020 | 0.99906 | 0.35196 | 7.85927 | 2.17216 |
| ONGC | 5.31997 | 2.56153 | 61,220.07650 | 2.89107 | 11.29412 | 189.92400 | 0.53678 | 0.06097 | 0.53021 | 0.00371 | 0.99845 | 0.06253 | 7.88151 | 2.23393 |
| TATA STEEL | 5.49089 | 2.47744 | 52,035.55100 | 2.97515 | 55.82941 | 9374.45000 | 0.54373 | 0.39070 | 0.54563 | 0.15265 | 0.99869 | 0.30910 | 7.96834 | 2.23454 |
| SUN PHARMA | 4.98351 | 2.34789 | 58,636.81300 | 3.10471 | 86.90882 | 2773.19000 | 0.59559 | 0.21250 | 0.56939 | 0.04515 | 0.99899 | 0.48117 | 7.33140 | 2.05589 |
| AXIS BANK | 5.26056 | 2.28971 | 60,892.79310 | 3.16289 | 26.05882 | 517.20700 | 0.59056 | 0.09177 | 0.58006 | 0.00842 | 0.99910 | 0.14427 | 7.55027 | 2.09460 |
| Number of Bins: 403 | | | | | | | | | | | | | | |
| BSE sensex | 5.61651 | | | | | 51,504.00000 | | | | | | | | |
| SBI | 5.70792 | 2.25205 | 43,313.94000 | 3.36446 | 46.60945 | 8190.06000 | 0.59421 | 0.39877 | 0.59903 | 0.15901 | 0.99940 | 0.36379 | 7.95997 | 2.14371 |
| ONGC | 5.47974 | 2.49112 | 51,260.09620 | 3.12538 | 9.12437 | 243.90400 | 0.56336 | 0.06881 | 0.55646 | 0.00473 | 0.99903 | 0.07121 | 7.97086 | 2.20124 |
| TATA STEEL | 5.65151 | 2.40696 | 42,810.67900 | 3.20955 | 42.28607 | 8693.32000 | 0.56967 | 0.41083 | 0.57144 | 0.16878 | 0.99918 | 0.33005 | 8.05847 | 2.20202 |
| SUN PHARMA | 5.14687 | 2.32651 | 49,158.15900 | 3.28999 | 60.63433 | 2345.84000 | 0.61191 | 0.21341 | 0.58577 | 0.04554 | 0.99930 | 0.47326 | 7.47339 | 2.04533 |
| AXIS BANK | 5.41261 | 2.28429 | 51,126.86590 | 3.33221 | 17.46517 | 377.13400 | 0.60436 | 0.08557 | 0.59328 | 0.00732 | 0.99936 | 0.13631 | 7.69691 | 2.08918 |
Table 8.
International market indices A.
Table 8.
International market indices A.
| | Entropy | Mutual Information | Correlation | Joint Entropy | Conditional Entropy | Relative Mutual Information |
|---|
| Number of Bins: 31 | | | | | | |
| NIFTY 50 | 3.15029 | | | | | |
| BSE SNESEX | 3.15202 | 2.11485 | 0.98778 | 4.18746 | 1.03544 | 0.67095 |
| IBOVESPA | 3.22630 | 1.51731 | 0.07871 | 4.85927 | 1.63298 | 0.47029 |
| HANG SENG | 3.20100 | 1.37211 | −0.12990 | 4.97918 | 1.77818 | 0.42864 |
| SSE COMPOSITE | 2.95250 | 1.11249 | 0.44629 | 4.99030 | 2.03779 | 0.37679 |
| Number of Bins: 143 | | | | | | |
| NIFTY 50 | 4.61974 | | | | | |
| BSE SNESEX | 4.62246 | 2.69859 | 0.95322 | 6.54361 | 1.92115 | 0.58379 |
| IBOVESPA | 4.71728 | 2.15750 | 0.10364 | 7.17952 | 2.46224 | 0.45736 |
| HANG SENG | 4.70464 | 2.05491 | −0.10610 | 7.26947 | 2.56483 | 0.43678 |
| SSE COMPOSITE | 4.44981 | 1.89907 | 0.38445 | 7.17049 | 2.72067 | 0.42677 |
| Number of Bins: 341 | | | | | | |
| NIFTY 50 | 5.45048 | | | | | |
| BSE SNESEX | 5.45222 | 3.37328 | 0.91252 | 7.52942 | 2.07720 | 0.61869 |
| IBOVESPA | 5.56159 | 3.06538 | 0.08978 | 7.94668 | 2.38509 | 0.55117 |
| HANG SENG | 5.54328 | 2.98039 | −0.08060 | 8.01337 | 2.47009 | 0.53765 |
| SSE COMPOSITE | 5.28904 | 2.78918 | 0.34756 | 7.95034 | 2.66130 | 0.52735 |
| Number of Bins: 403 | | | | | | |
| NIFTY 50 | 5.60935 | | | | | |
| BSE SNESEX | 5.61617 | 3.55583 | 0.9062 | 7.66968 | 2.05351 | 0.63314 |
| IBOVESPA | 5.72184 | 3.29735 | 0.08618 | 8.03383 | 2.31199 | 0.57627 |
| HANG SENG | 5.70409 | 3.20949 | −0.08090 | 8.10395 | 2.39985 | 0.56266 |
| SSE COMPOSITE | 5.44616 | 3.02750 | 0.33483 | 8.02801 | 2.58184 | 0.55589 |
Table 9.
International market indices B.
Table 9.
International market indices B.
| | Entropy | Mutual Information | Correlation | Joint Entropy | Conditional Entropy | Relative Mutual Information |
|---|
| Number of bins: 16 | | | | | | |
| DOW JONES | 2.39734 | | | | | |
| CAC 40 | 2.59322 | 0.74548 | 0.24985 | 4.24508 | 1.65186 | 0.28747 |
| DAX | 2.61923 | 1.23358 | 0.53358 | 3.78299 | 1.16376 | 0.47097 |
| NASDAQ | 2.35936 | 1.58996 | 0.76201 | 3.16674 | 0.80737 | 0.67389 |
| Number of bins: 283 | | | | | | |
| DOW JONES | 5.13384 | | | | | |
| CAC 40 | 5.41487 | 2.42453 | 0.25323 | 8.12418 | 2.70930 | 0.44775 |
| DAX | 5.43041 | 2.63143 | 0.35362 | 7.93282 | 2.50241 | 0.48457 |
| NASDAQ | 5.14322 | 2.87793 | 0.58449 | 7.39913 | 2.25591 | 0.55955 |
| Number of bins: 556 | | | | | | |
| DOW JONES | 5.79039 | | | | | |
| CAC 40 | 6.06928 | 3.52548 | 0.22600 | 8.33420 | 2.26491 | 0.58087 |
| DAX | 6.08881 | 3.61385 | 0.32142 | 8.26536 | 2.17654 | 0.59352 |
| NASDAQ | 5.79907 | 3.58918 | 0.55368 | 8.00029 | 2.20121 | 0.61892 |
| Number of bins: 1132 | | | | | | |
| DOW JONES | 6.41815 | | | | | |
| CAC 40 | 6.69865 | 4.72292 | 0.19908 | 8.39388 | 1.69523 | 0.70505 |
| DAX | 6.71238 | 4.75384 | 0.28448 | 8.37669 | 1.66431 | 0.70821 |
| NASDAQ | 6.42275 | 4.54329 | 0.51441 | 8.29761 | 1.87486 | 0.70737 |
Table 10.
Comparison of Shannon entropy and Total sum of square of BSE Sensex stocks.
Table 10.
Comparison of Shannon entropy and Total sum of square of BSE Sensex stocks.
| | BSE SENSEX |
|---|
| Number of Bins | 13 | 31 | 143 | 341 | 403 |
| Entropy | 2.36610 | 3.15224 | 4.62278 | 5.45260 | 5.61651 |
| TSS | 634,618.00000 | 427,756.00000 | 127,290.00000 | 61,410.00000 | 51,504.00000 |
Table 11.
Comparison of Shannon entropy and Total sum of square of NIFTY 50 stocks.
Table 11.
Comparison of Shannon entropy and Total sum of square of NIFTY 50 stocks.
| | NIFTY 50 |
|---|
| Number of Bins | 13 | 114 | 234 | 342 | 494 | 1482 |
| Entropy | 2.36539 | 4.40485 | 5.09440 | 5.45397 | 5.80256 | 6.77728 |
| TSS | 624,968.00000 | 155,446.00000 | 82,294.00000 | 59,342.00000 | 42,468.00000 | 17,490.00000 |


