Abstract
Low-temperature plasma treatments were applied to barley seeds using a dielectric barrier-stabilized corona discharge operated in ambient air enriched with oxygen or nitrogen to quantify surface chemical modifications and seed wettability. X-ray photoelectron spectroscopy showed that oxygen-enriched plasma produced the strongest oxidation, increasing surface oxygen from 9 ± 5 at% (control) to 24 ± 5 at%, while reducing carbon from 88 ± 5 at% to 76 ± 5 at%. Nitrogen-enriched plasma induced more moderate changes (O: 13 ± 5 at%, C: 85 ± 5 at%) but resulted in clear nitrogen incorporation, with an enhanced N 1s amine/amide component at ~400.8 eV. The hydroxyl O 1s contribution increased from 70% (control) to 82% (oxygen) and 90% (nitrogen), indicating substantial surface hydroxylation. SEM-EDX showed only minor micrometer-scale composition changes and no detectable morphological damage. Raman and ATR-FTIR spectra confirmed that polysaccharide, protein, and lipid structures remained intact, with intensity variations reflecting increased hydrophilicity. Water imbibition kinetics fitted with the Peleg model demonstrated faster initial hydration after plasma exposure, with 1/k1 increasing from 20.25 ± 1.90 h−1 (control) to 36.70 ± 6.56 h−1 (oxygen) and 38.87 ± 7.57 h−1 (nitrogen), while 1/k2 remained nearly unchanged.
Keywords:
low-temperature plasmas; barley seeds; XPS; SEM; Raman spectroscopy; ATR-FTIR; seed water imbibition 1. Introduction
The use of non-thermal plasmas (NTPs) for treating seeds has emerged as a promising strategy to enhance the physical and chemical characteristics of seed surfaces, directly impacting germination, initial vigor, and resistance to external agents (see, for instance, the recent reviews [1,2] and references therein), as well as shelf life [3]. Cold plasmas in air or similar gas mixtures generate a variety of reactive oxygen and nitrogen species (ROS and RNS), UV photons, micro-discharges, and electric effects that can modify both the morphology and surface chemistry of biological materials [4,5]. In the case of malt barley seeds, these changes can have a direct impact on grain quality, germination rate, and the efficiency of malting processes [6]. However, understanding the precise physical and chemical modifications that occur on malt seed surfaces when exposed to oxygen- and nitrogen-enriched plasmas requires detailed characterization and control of the treatment parameters.
At the morphological level, non-thermal plasma treatments can cause etching, partial removal of epicuticular waxes, formation of pores or surface roughness, and alterations in topography. These physical effects, commonly observed by scanning electron microscopy (SEM) or atomic force microscopy (AFM), increase surface wettability and decrease water contact angle, facilitating faster water uptake and promoting germination [7]. Such changes are often correlated with enhanced permeability and reduced microbial contamination, two factors of major industrial relevance.
X-ray photoelectron spectroscopy (XPS) and Fourier-transform infrared spectroscopy (FTIR) have demonstrated that air plasma treatments enrich the outermost layers with oxygen and nitrogen functionalities, increase surface polarity, and remove waxy components [8]. These modifications influence surface energy, water absorption kinetics, and microbial adhesion. Furthermore, plasma exposure can induce redistribution of several ions in the outer seed coat, influencing the electrochemical environment and potentially modulating biochemical signaling pathways related to germination [9].
The differences between oxygen and nitrogen plasmas are notable. Oxygen plasmas predominantly generate oxidative species (atomic oxygen, ozone, etc.), which favor oxidation and functionalization of surface compounds. Nitrogen plasmas, in contrast, promote the incorporation of nitrogen functionalities, leading to amination and the formation of nitrated structures. Mixed-gas plasmas can balance these effects, achieving surface activation without excessive damage when properly tuned [10].
These surface-level transformations translate into measurable improvements in seed performance. Numerous studies have reported increased germination rate and vigor, enhanced enzymatic activity, and improved water uptake in barley and other cereals following cold plasma exposure [11]. However, excessive plasma power or prolonged exposure can lead to deleterious effects such as oxidative stress, surface erosion, or DNA damage [12]. Consequently, optimization of plasma parameters—gas composition, exposure time, discharge power, and electrode configuration—is critical to achieve beneficial modifications while maintaining structural integrity.
Despite the growing number of studies on cereal seeds, systematic analyses focusing on malt barley remain scarce. Few works (e.g., [6]) have correlated nanoscale surface composition (via XPS and FTIR) with parameters directly relevant to malting, such as germination uniformity, water absorption kinetics, and enzymatic activation. In particular, increasing barley wettability during the steeping phase is crucial because it initiates germination, leading to the activation of essential enzymes that break down proteins and starches. Proper wettability, achieved by a controlled hydration process, results in a more uniform and higher-quality malt, which is critical for efficient brewing and desired flavor development in beer. This could also allow for reduced water usage and shorter steeping times, resulting in higher production rates and lower water consumption, allowing for reduced water use and shorter steeping times. The characterization of the plasma-induced modifications on malt seed surfaces is therefore essential for establishing cause–effect relationships between plasma chemistry, surface physics, and biological performance.
In this context, this work aims to characterize the morphological and chemical changes occurring on malt barley seed surfaces after exposure to oxygen- and nitrogen-enriched non-thermal plasmas. Through combined use of XPS, scanning electron microscopy with energy-dispersive X-ray spectroscopy (SEM-EDX), Raman spectroscopy analyses, and attenuated total reflectance–Fourier transform infrared spectroscopy (ATR-FTIR), the study seeks to clarify how plasma parameters influence surface functionality and seed wettability. To the best of our knowledge, this study represents one of the first Raman-based comparisons of oxygen- and nitrogen-enriched plasma effects on the barley seeds, providing direct spectroscopic evidence of the differential reactivity of these plasmas toward plant biopolymers. This knowledge provides a basis for the rational design of plasma-assisted processing technologies for sustainable malting and agricultural applications [12].
2. Materials and Methods
2.1. Plasma Source
The non-thermal plasma was generated by combining a dielectric barrier discharge (DBD) with a corona discharge in a wire-to-plane electrode configuration. The dielectric barrier-stabilized corona discharge used in this work is a modification of the point-to-plane electrode configuration previously used by some of the authors to maximize seed-plasma contact [13]. A similar discharge configuration was later studied by other authors as well [14,15].
A flat-wire electrode geometry was used, consisting of an array of multiple 0.2 mm diameter wires (covering an area of 1000 × 500 mm) over a grounded flat counter electrode. The flat electrode was covered with a 2 mm thick glass. The seeds to be treated were placed in a single layer over the glass sheet. The height between the wires and the top surface of the glass (gas gap) was 11 mm in the experiments. The corresponding average distance between the wires and seeds was about 6 mm. A quasi-steady sinusoidal voltage signal (50 Hz) with an amplitude of 30 kV was applied. The discharge was generated in ambient air without confinement, but the gas composition of the active zone of the discharge (i.e., in the gas gap where the plasma is generated) was locally varied by injecting oxygen and nitrogen (of industrial purity) as carrier gases, with a (measured) gas flow of about 28 Nl/min (liters at standard pressure and temperature per minute). The gas flow was injected uniformly across the high-voltage electrode surface onto the wires in a downward direction to draw the long-lived plasma species towards the seeds. The seed treatments were defined by the gas composition: PNT 70 (oxygen-enriched plasma) and PNT 71 (nitrogen-enriched plasma).
The intensification of the electric field operated by the wire-plane configuration strongly increases the mechanism of electric charge creation in the plasma via direct electron impact, thus producing higher electron concentrations in the plasma than a traditional DBD operated between flat electrodes under similar operating conditions (i.e., gas gap and applied voltage) [14]. A schematic diagram of the dielectric barrier-stabilized corona discharge (top) and the optical image of barley seeds during plasma treatment (bottom) are given in Figure 1. Note that the image of the seeds exposed to plasma shows localized regions of high electric field between the seed surface and the barrier capable of inducing discharges underneath the seed’s surface [15].
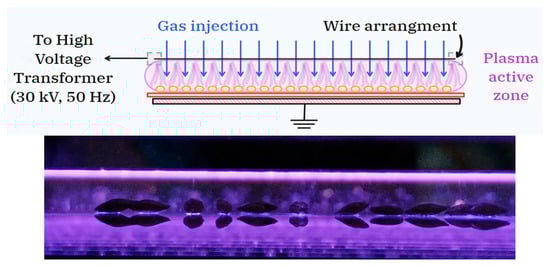
Figure 1.
Schematic diagram of the dielectric barrier-stabilized corona discharge (top) and optical image of barley seeds during plasma treatment (bottom). In both the diagram and the photograph of the discharge, the wires of the high-voltage electrode extend from left to right.
The electrical characteristics of the discharge were monitored during the experiments by using a 4-channel oscilloscope (Tektronix TBS2204B with a sampling rate of 2 GS/s and an analogical bandwidth of 200 MHz, Tektronix, OR, USA). The discharge voltage was measured by using a high-impedance voltage probe (Tektronix P6015A, 1000×, 3 pf, 100 MΩ), while the discharge current waveform was inferred from the measurement of the voltage drop across a (low-inductance) shunt resistor of 100 Ω connected in series with the discharge. Typical voltage (V) and (I) current waveforms for the discharge in the PNT 70 configuration (oxygen-enriched plasma) are shown in Figure 2.
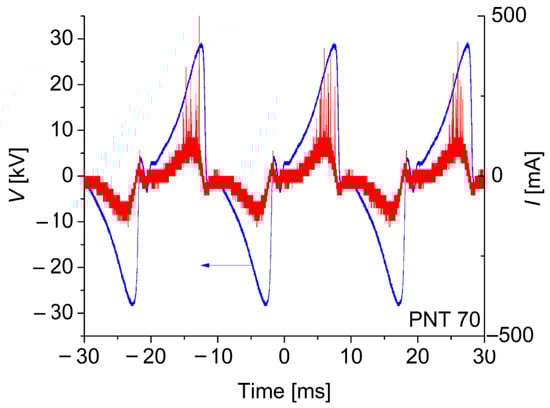
Figure 2.
Typical voltage and current waveforms for the discharge in the PNT 70 configuration (oxygen-enriched plasma). No qualitative differences were observed for the PNT 71 configuration.
It can be observed in Figure 2 that the discharge current waveform is asymmetrical in both half-cycles. In the positive half-cycle (when the active electrode is positive, i.e., a positive corona), the discharge exists in diffuse and streamer modes, similar to usual positive coronas. Diffuse mode occurs only at low currents. The main discharge mode of the positive corona is the streamer mode, characterized by large current peaks with amplitudes of hundreds of mA. On the other hand, the number of current peaks in the negative half-cycle (negative corona) is almost absent, indicating that the negative corona exists in diffuse discharge mode, consistent with the behavior of a typical negative corona discharge, in which the streamer mode is not observed [16].
The power consumed by the discharge was inferred by using the Lissajous method, obtained when plotting the transported electric charge Q through the discharge (inferred from the voltage drop across a measuring serial capacitor of 33.0 µF) as a function of the applied periodical voltages. A typical Lissajous figure for the PNT 70 is shown in Figure 3. The power of the discharge was calculated to be 671 ± 3 W and 687 ± 2 W for the PNT 70 and PNT 71, respectively. The corresponding discharge power densities (i.e., the ratio of power to active electrode area) were calculated to be 0.13 W/cm2 and 0.14 W/cm2. The small difference in power in favor of PNT 71 may be related to a decrease in the electron removal mechanism by (dissociative) attachment with oxygen molecules due to the local decrease in oxygen concentration.
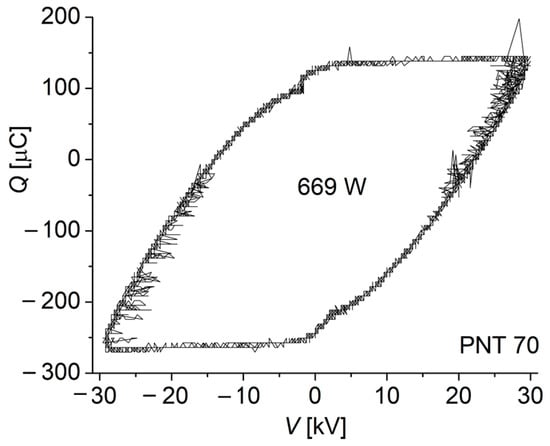
Figure 3.
Typical Lissajous figure for the discharge in the PNT 70 configuration (oxygen-enriched plasma).
The counter electrode was air cooled. This prevents the temperature of the glass surface (where the seeds are placed for treatment) from exceeding approximately 45–50 °C during long-term continuous operation.
2.2. SeedTreatment
Commercial Hordeum vulgare (barley) seeds were used in this study. For each experimental group, a 60 g sample of seeds was subjected to treatment, while non-treated seeds served as the control group. Seeds were exposed to a uniform 10 min plasma application according to previous results. In general, plasma exposure has been reported to increase seed wettability, and some studies report greater water imbibition by the seeds. Exposure times reported in the literature vary widely depending on the seed type, plasma source configuration, gas type and pressure, voltage waveform, and other factors. For barley, exposure times have generally been reported to range from 1 to 90 min [17]. The seeds were mixed every 2 min of treatment to ensure uniformity of the plasma treatment over the entire surface of the seeds.
The temperature of the seeds’ surface was measured with an IR handheld thermometer. After 10 min of treatment, the seeds’ temperature was below 40 °C, corresponding to an elevation above the room temperature of about 20 °C.
2.3. Raman Spectroscopy
Raman microscopy analyses were performed on a LabRAM HR Raman system (Horiba Jobin Yvon) Palaiseau, France, equipped with two monochromator gratings and a charge-coupled device detector (CCD). An 800 grooves/mm grating and 100 μm aperture resulted in a 1.5 cm−1 spectral resolution. A He-Ne laser line at 632.8 nm was used as an excitation source. Laser power was adjusted in order to avoid overheating on the sample (around 3 mW). The spectrograph is coupled to an imaging microscope with 10×, 50×, and 100× magnifications. Typically, the laser spot on the sample was about 10 and 3 μm in diameter for a 10× and 50× magnification, respectively. An advantage of the microscopic facility is the possibility of analyzing different regions on the seeds.
2.4. X-Ray Photoemission Spectroscopy (XPS)
XPS measurements were carried out using a PHI 5000 VersaProbe II system equipped with a monochromatic aluminum Kα X-ray source (1486.6 eV) and a spherical capacitor analyzer. The analysis chamber was maintained at a base pressure in the lower range of 10−10 Torr. Experimental parameters for the X-ray source included a spot size of 200 μm, X-ray power set at W, and a bias voltage of 15 kV. Prior to sample analysis, the resolution of the system was verified using an Ar-etched, polished fine-grained silver sample, with the full width at half maximum (FWHM) of the Ag 3d5/2 peak measured at 0.69 eV. Data analysis was performed using CasaXPS software version 2.3.18.
Due to the insulating nature of the samples, charging effects were observed during the XPS measurements. The widespread practice to overcome the complication associated with the charging effect is using an electron flood gun; however, the traditional method of electron flood gun charge neutralization proved to be ineffective in neutralizing the localized positive charge induced by the X-ray beam, as the static charge of the sample interfered with the low-energy electron beam. Instead, a dual-beam charge neutralization method patented by PHI was utilized. This method combines a low-energy Ar+ ion beam and a low-energy electron beam to effectively neutralize the localized positive charge caused by the X-ray beam. Additionally, the dominant component of adventitious carbon (AdC), specifically (C-C/C-H) in the C 1s energy region at 285 eV, served as a reference point for energy calibration of the XPS spectra.
2.5. Attenuated Total Reflectance–Fourier Transform Infrared Spectroscopy (ATR-FTIR)
The sample was analyzed by Fourier Transform Infrared Spectroscopy (FTIR) using a Shimadzu IRPrestige-21 spectrometer equipped with a horizontal attenuated total reflectance (ATR-8200H) accessory. Spectra were acquired in ATR mode using a zinc selenide prism. Prior to sample measurement, a background spectrum was recorded. Each spectrum resulted from 40 co-added scans at a resolution of 4 cm−1 over the 4000–700 cm−1 spectral range.
2.6. Scanning Electron Microscopy
SEM-EDS measurements and BS imaging in this study were conducted using an FEI Quanta 200 SEM operated in low vacuum mode. The system is equipped with Everhardt–Thornley and solid-state detectors. The samples were not coated with any conducting thin film; however, the low-vacuum SEM capabilities allowed for charge-free imaging and analysis of the uncoated samples. Spectral data were analyzed using Edax Genesis Apollo X software, Version 6.5 under standard less approximation, indicating that the chemical composition measurements should be considered as semi-quantitative.
2.7. Seed Water Imbibition
Seeds from each treatment and control group were weighed (p0) and placed in Petri dishes containing two filter papers moistened with 4 mL of distilled water. Four replicates of ten seeds each were prepared. At 0.5, 1, 2, 4, 5, and 6 h, the seeds were removed from the Petri dishes and weighed (pt). The experiment was repeated three times. The percentage of water uptake at each time point was calculated and used to construct imbibition curves, which represent the temporal dependence of average water absorption normalized to the initial seed mass:
3. Results
3.1. Raman Spectroscopy Results
Raman spectroscopy has emerged as a powerful, non-destructive technique for investigating the chemical and structural properties of plant seeds. It allows the identification of key biomolecules such as starch, proteins, lipids, carotenoids, and phenolic compounds, providing valuable insights into seed composition. Beyond compositional analysis, Raman spectroscopy has been applied to assess seed viability and aging, monitor structural and chemical changes induced by treatments such as plasma or thermal processes, and detect the presence of contaminants or pathogens. Owing to its rapid acquisition and minimal sample preparation, Raman spectroscopy can represent a versatile tool to study seeds [18,19].
3.1.1. Exterior Part of the Seeds
The Raman spectra (Figure 4) of the external part of the barley seed (1000–1800 cm−1) show several characteristic peaks associated with organic and biopolymeric structures. The spectral profile is dominated by a strong band near 1600 cm−1, with additional features observed at around 1200–1250 cm−1 and ~1350–1400 cm−1.
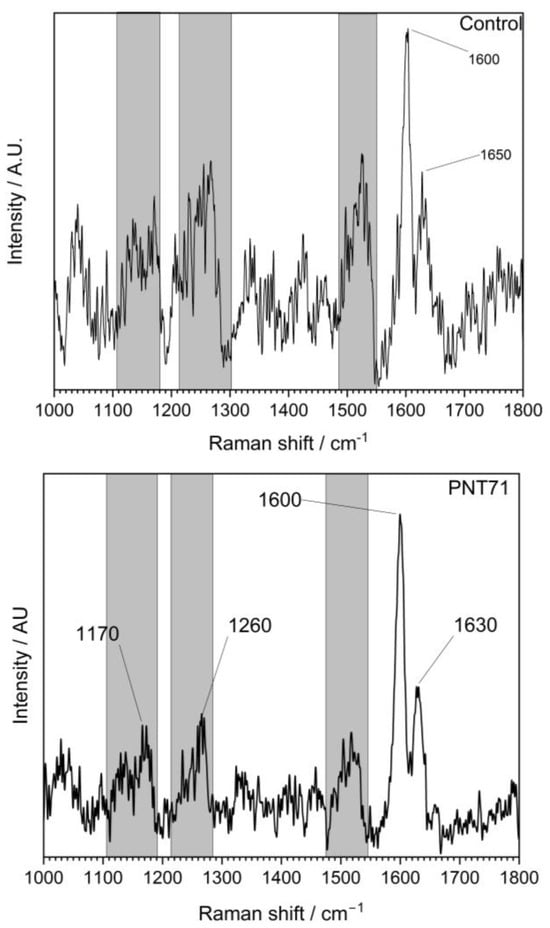
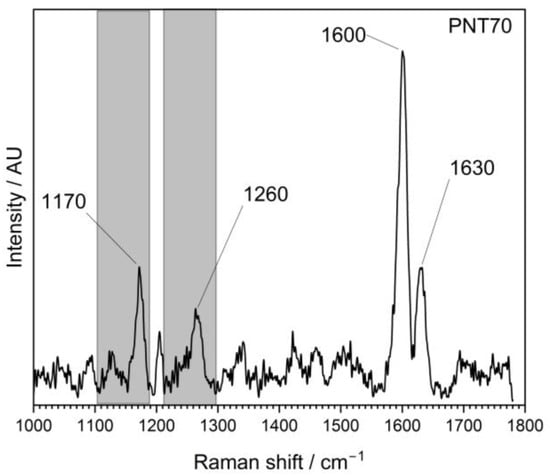
Figure 4.
Raman spectrum of the external surface of a barley seed of control and after plasma treatment, recorded in the 1000–1800 cm−1 region. The spectrum shows characteristic vibrational modes of biopolymers present in the seed coat, including polysaccharides, proteins, and lignin compounds.
The Raman spectra revealed distinct differences between the untreated control and the plasma-treated samples (PNT 70, oxygen plasma; PNT 71, nitrogen plasma). In the control spectrum, broad but identifiable bands were observed at 1170–1200 cm−1 (C–O–C stretching of polysaccharides), 1260–1300 cm−1 (amide III vibrations from proteins and lignin-related modes), and a dominant feature at ~1600 cm−1, attributed to aromatic C=C stretching of lignin and phenolic structures, with a weaker shoulder at ~1650 cm−1 corresponding to amide I (C=O stretching) of proteins. Plasma treatment produced sharper and more intense peaks, indicating effective removal of surface contaminants such as hydrocarbons and enhanced exposure of the underlying biopolymers. Oxygen plasma (PNT 70) caused the strongest modifications, with a well-defined carbohydrate band at 1170 cm−1, a clear amide III/lignin contribution at 1260 cm−1, and a sharp, dominant peak at 1600 cm−1 reflecting enhanced aromatic and phenolic structures. Additionally, the amide I shoulder at 1630 cm−1 was more distinct than in the control, suggesting an increased contribution from protein vibrations. Table 1 presents the main biomolecules of the coat seed with the corresponding functional group vibrations.

Table 1.
Main chemical bonds of coat seed with the corresponding functional group vibrations.
Nitrogen plasma-treated seed (PNT 71) also enhanced the signals compared to the control, but the peaks were broader and less intense than those observed with oxygen plasma. While the main vibrational modes at 1170, 1260, 1600, and 1630 cm−1 were present, their lower intensity suggests that N-plasma induces a milder surface modification, potentially introducing subtle nitrogen functionalities, although these are not clearly resolved in the Raman fingerprint region. Overall, oxygen plasma treatment appears to be more effective in enhancing surface oxidation and exposure of lignin- and protein-related structures, while nitrogen plasma leads to less pronounced but detectable modifications.
The differences between the spectra shown in Figure 4 can be attributed not only to the distinct chemical reactivity of the plasmas but also to their effect on surface cleanliness. Oxygen plasma is highly oxidative and known for its strong cleaning ability, effectively removing surface hydrocarbons and exposing the underlying biopolymer structures (cellulose, lignin, proteins). This results in stronger Raman scattering from intrinsic seed components. In contrast, nitrogen plasma is less effective in cleaning but may introduce amine functionalities, leading to weaker enhancement of the Raman active biopolymers [20,21,22,23,24].
Although nitrogen plasma treatment could, in principle, introduce nitrogen-containing functional groups such as amines and amides onto the surface biopolymers of the seed coat, the Raman spectra obtained in the 1000–1800 cm−1 region do not display distinct new bands attributable exclusively to nitrogen-related vibrations. This is partly because N–H and C–N vibrations often overlap with existing polysaccharide and protein modes, and partly due to the relatively low concentration of incorporated nitrogen functionalities. As a result, Raman spectroscopy alone may not clearly reveal nitrogen incorporation. To confirm the presence and chemical nature of nitrogen species, we carried out XPS and Attenuated Total Reflectance (ATR) and Fourier Transform Infrared (FTIR) measurements on the control and plasma-treated seeds; see below.
In the top panel (control sample), the most prominent features include strong starch-associated peaks at ~480 cm−1 (skeletal C–O–C bending), ~940–960 cm−1 (C–O stretching of the glycosidic linkages), and a strong band at ~1045–1060 cm−1 (C–O and C–C stretching). The high-wavenumber region (2850–2930 cm−1) exhibits strong CH2/CH3 stretching bands, which are characteristic of polysaccharides but also overlap with lipid and protein contributions [26]. Beyond starch-related modes, the barley seed spectrum contains additional features absent in the pure starch reference. A band near 1265–1300 cm−1 corresponds to amide III vibrations, while a broad feature at ~1650 cm−1 is assigned to the amide I band, both arising from protein backbone vibrations [22,27]. A pronounced feature around 1450 cm−1 originates from CH2/CH3 deformation modes, typically associated with lipids and proteins [26]. Carotenoid-related signals, such as the bands around 1150 and 1520 cm−1, are also evident in the spectra, which are associated with C–C and C=C stretching vibrations of the conjugated polyene chain, respectively [24]. Main chemical bonds detected from the interior part of the seed with the corresponding functional group vibrations are presented in Table 2.
Table 2.
Main chemical bonds of the interior part of the seeds with the corresponding functional group vibrations.
Even though the spectra of the plasma-treated seeds PNT71 and PNT 70 show reduced band intensities (which is related to the experimental conditions), the characteristic starch peaks remain visible, particularly in the low-wavenumber region (400–1200 cm−1) and near 2930. The carotenoid bands become less pronounced but also visible. Considering the experimental conditions, we conclude that no significant shifts in peak positions are observed, suggesting that plasma exposure does not alter the organic composition of the seed interior. This stability implies that the fundamental molecular structures, including polysaccharide and carotenoid frameworks, remain largely intact after treatment.
3.1.2. Interior Part of the Seeds
The interior of the seeds was analyzed by Raman spectroscopy to assess whether the plasma treatment produced any alterations in their internal structure or composition. The Raman spectra obtained from the interior part of the barley seeds (control, PNT 70, and PNT 71) are shown in Figure 5. The spectra exhibit distinct bands corresponding to starch (C6H10O5) and carotenoid components, as confirmed by the reference spectra.
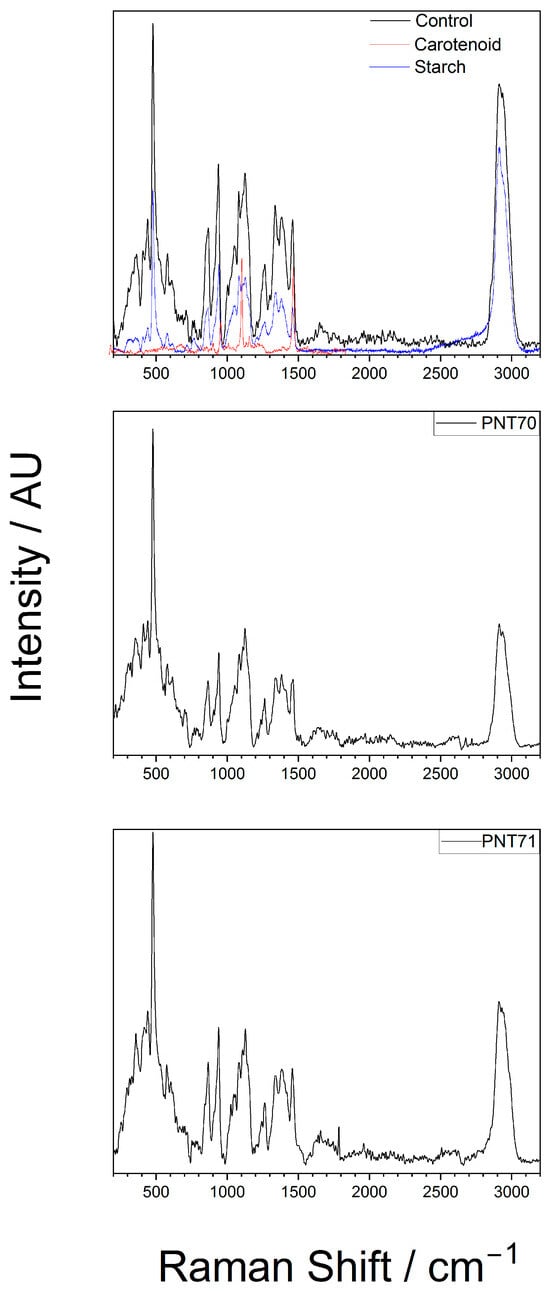
Figure 5.
Raman spectrum of the internal of a barley seed of control and after plasma treatment, recorded in the 200–3200 cm−1 region. The spectra show characteristic vibrational modes of starch and carotenoid present in the seed.
3.2. XPS Results
XPS provides a powerful means to investigate the surface chemistry of plant seeds, delivering quantitative and chemical-state information from only the outer few nanometers of the seed coat. This high surface sensitivity is especially important since the seed coat governs key processes such as water absorption, germination, and defense against environmental stresses. XPS has been employed to analyze natural surface components, including waxes, lignin, and polysaccharides, and to track chemical alterations induced by plasma or other treatments. When combined with complementary spectroscopic and microscopic approaches, XPS becomes a valuable tool for establishing direct connections between seed surface chemistry and biological function performance [9,31].
3.2.1. O1s-Region
High-resolution XPS spectra of the O 1s region are shown in Figure 6A for the control and plasma-treated seeds. The spectra were deconvoluted into two main components: a peak at ~532–533 eV corresponding to hydroxyl oxygen species (O–H), typically associated with surface hydroxyl groups and adsorbed water, and a smaller contribution at ~530–531 eV attributed to oxidized oxygen species (O–O), suchas carbonyl oxygen, or surface contaminations. In the control sample, the (O–H):(O–O) integrated area ratio was approximately ~7:3. After nitrogen plasma treatment (PNT 71), the O–H peak became more prominent, increasing the ratio to almost ~4:1, while in the oxygen plasma treatment (PNT 70) the (O–H) contribution dominated even further, with an estimated ratio of ~9:1. The relative concentrations of (O-O) and (O-H) peaks for control and plasma-treated seeds are listed in Table 3. These results clearly demonstrate that plasma treatment enhances hydroxylation of the seed surface, thereby increasing surface hydrophilicity, which may facilitate water uptake.
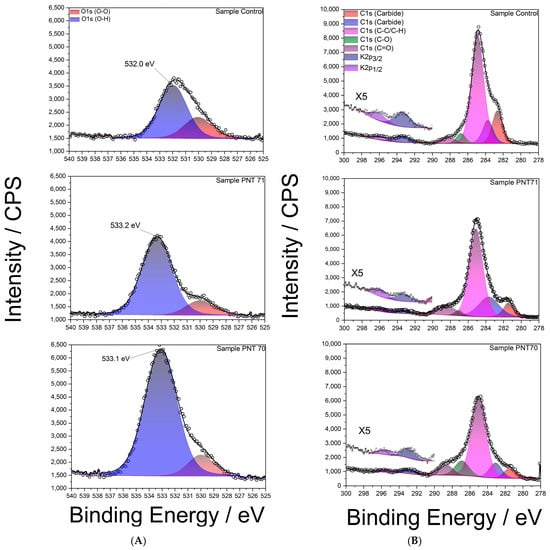
Figure 6.
(A): High-resolution XPS spectra of the O 1s region for barley seed surfaces: (top) control sample, (middle) nitrogen plasma-treated (PNT71), and (bottom) oxygen plasma-treated (PNT70). (B): High-resolution XPS C 1s spectra of control, nitrogen plasma-treated (PNT71), and oxygen plasma-treated (PNT70) barley seeds.
Table 3.
Relative concentration of O-O and O-H peaks for control and plasma-treated seeds.
A noticeable shift of approximately 1 eV toward higher binding energy was also observed in the (O-H) peak after plasma treatment compared to the control sample. This shift can be primarily attributed to the increased proportion of hydroxyl-rich species generated by plasma exposure, as hydroxyl oxygen typically appears at higher binding energies (~532.5–533.5 eV) relative to carbonyl oxygen (~530–531 eV) [32].
Plasma treatment likely oxidizes surface hydrocarbons and polysaccharides, enriching hydroxyl functionalities and reducing the relative contribution of lower-energy (O–O) species. Overall, the shift reflects the chemical restructuring of the seed coat surface induced by plasma, with hydroxylation emerging as the dominant modification of the surface.
3.2.2. C1s and K2p Regions
Figure 6B presents high-resolution XPS C 1s spectra of the control barley seed surface (top panel), PNT 71 (middle panel), andPNT70 (bottom panel). The main contributions were identified in the control spectrum (top panel) and used for fitting all spectra. The dominant peak at (284.8 ± 0.1) eV corresponds to C–C/C–H bonds, commonly associated with adventitious carbon contamination. Additional components were assigned to C–O (286.2 ± 0.1) eV, C=O (287.8 ± 0.1) eV, and minor contributions at lower binding energy (282–283 eV), which are formally attributed to carbide-like species. However, in biological samples such as seeds, these low-energy signals are more likely to arise from interactions of carbon with inherent mineral constituents (e.g., potassium or calcium) rather than true metal carbides. In addition, K 2p3/2 and K 2p1/2 signals are observed between 292 and 296 eV, reflecting the presence of inherent seed mineral constituents.
A clear reduction in the C–C/C–H contribution is observed after plasma treatment, particularly in the oxygen-treated sample (PNT 70), consistent with the removal of adventitious carbon through oxidative cleaning. This process involves the conversion of surface hydrocarbons into volatile CO and CO2, leading to an overall decrease in the carbon signal and a relative enrichment of oxygen species. In the nitrogen-treated sample (PNT 71), this effect is less pronounced, reflecting the lower oxidative potential of nitrogen plasma compared to oxygen plasma. These findings corroborate the compositional analysis shown in the O/C ratio (Figure 7), where oxygen plasma treatment significantly enhances surface oxygen concentration while depleting carbon. Such changes in surface chemistry are expected to alter the physicochemical properties of the seed coat, including hydrophilicity, permeability, and interaction with water during germination.
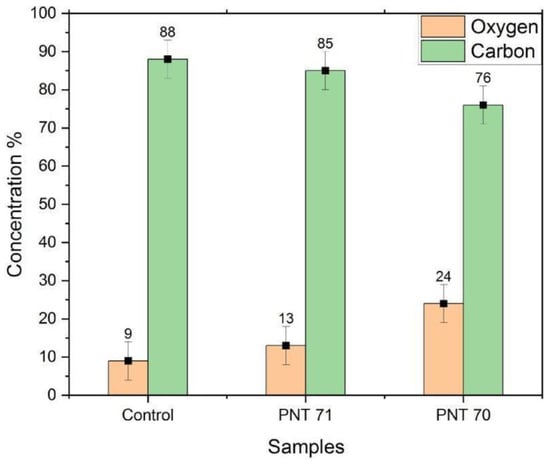
Figure 7.
XPS-derived surface concentrations of oxygen and carbon for untreated seeds (Control), nitrogen plasma-treated seeds (PNT 71), and oxygen plasma-treated seeds (PNT 70).
The bar graph (Figure 7) illustrates the relative surface concentrations of oxygen and carbon on barley seeds obtained by X-ray photoelectron spectroscopy (XPS) before and after plasma treatment. In the control sample, the carbon content is dominant at 88 ± 5%, while oxygen accounts for only 9 ± 5%. Upon nitrogen plasma treatment (PNT 71), the surface oxygen content increases slightly to 13 ± 5%, accompanied by a decrease in carbon concentration to 85 ± 5%. A more pronounced modification is observed in the oxygen plasma-treated seeds (PNT 70), where oxygen concentration rises significantly to 24 ± 5%, with a corresponding reduction in carbon content to 76 ± 5%. These results indicate that plasma treatment effectively alters the surface chemical composition of the seed coat, with oxygen plasma being more efficient in incorporating oxygen species and reducing surface carbon compared to nitrogen plasma. The reduction of carbon after oxygen plasma exposure can be partly attributed to the removal of adventitious carbon contamination, which is oxidized and desorbed as volatile CO and CO2 during treatment. Therefore, the observed increase in oxygen concentration reflects both the introduction of oxygen-containing functional groups and the cleaning effect of plasma on the seed surface.
3.2.3. N1s Region
The N 1s spectra (Figure 8A) reveal distinct differences between treatments. In the control seed, two components are observed: a dominant peak at ~400.8 eV, attributed to N3− environments such as amine or amide groups, and a smaller contribution at ~397.8 eV, associated with N2− (N-C) functionalities including imines or nitriles. Following N-plasma treatment (PNT 71), the N3− (N-H) component becomes strongly dominant, indicating efficient incorporation of nitrogen species from the plasma. In contrast, the spectrum of the O-plasma-treated seed (PNT 70) exhibits only a weak signal, preventing a reliable distinction of nitrogen oxidation states. This suggests that oxygen plasma preferentially modifies or removes labile nitrogen functionalities, potentially leaving behind more stable, lower oxidation state nitrogen species.
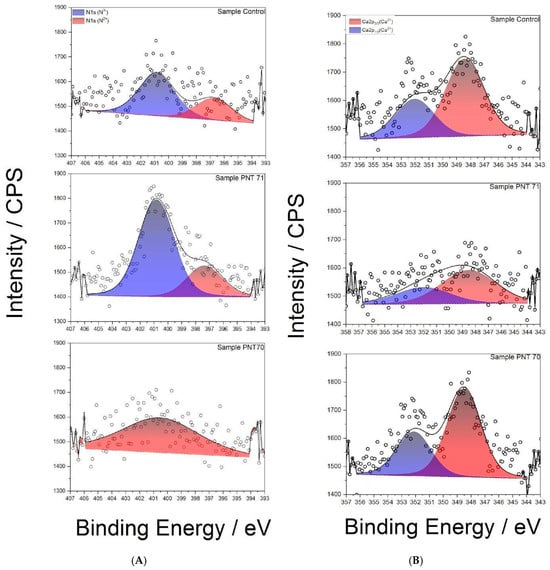
Figure 8.
(A) High-resolution XPS N 1s spectra of control, O plasma-treated (PNT 70), and N plasma-treated (PNT 71) seeds. (B) High-resolution XPS Ca 2p spectra of control, O plasma-treated (PNT 70), and N plasma-treated (PNT 71) barley seeds.
3.2.4. Ca2p Region
The Ca 2p spectra (Figure 8B) of the control and plasma-treated seeds show the characteristic doublet of Ca2+, with Ca 2p3/2 (347.8 ± 0.1) eV and Ca 2p1/2 (351.4 ± 0.1) eV. In the control seed, the Ca 2p doublet is intense and well resolved, indicating the presence of native calcium salts such as oxalates or carbonates in the seed coat. After N-plasma treatment (PNT 71), the Ca 2p signal intensity decreases, suggesting either partial sputtering/etching of surface calcium compounds or coverage by newly incorporated nitrogen-rich species. By contrast, after O-plasma treatment (PNT 70), the Ca 2p signal remains relatively strong, consistent with oxidative cleaning of adventitious surface contaminants rather than removal of calcium compounds.
3.3. ATR-FTIR Results
The ATR-FTIR spectra of the barley seed coats from the control sample, oxygen plasma–treated (PNT 70), and nitrogen plasma–treated (PNT 71) samples are shown in Figure 9. All three spectra display the typical vibrational bands of seed biopolymers, including a broad O–H/N–H stretching band between 3200 and 3600 cm−1, C–H stretching vibrations near 2920 and 2850 cm−1, amide I (~1650 cm−1) and amide II (~1540 cm−1) bands associated with proteins, and strong carbohydrate-related absorptions in the 1200–1000 cm−1 region [33,34]. These features confirm that the main biochemical constituents of the seeds—starch, proteins, and lipids—(Table 4) remain intact after plasma treatment, confirming the Raman results.
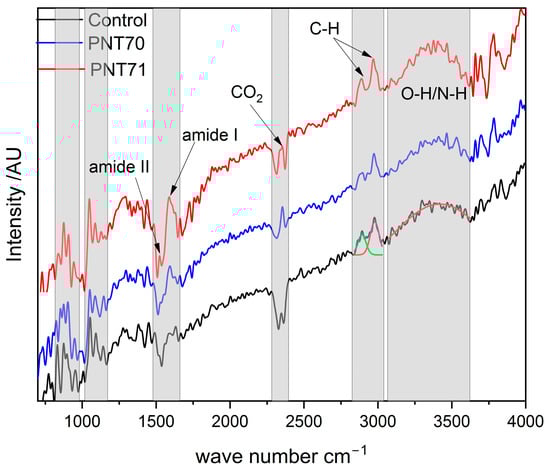
Figure 9.
ATR-FTIR spectra of control, O plasma-treated (PNT 70), and N plasma-treated (PNT 71) seeds span from 700 to 4000 cm−1.
Table 4.
Main biomolecules of the coat seeds detected by ATR-FTIR with corresponding functional group vibrations.
Notably, the oxygen plasma treatment (PNT 70) enhances the relative intensity of the O–H/N–H stretching region (3200–3600 cm−1), indicating an increase in surface hydroxylation and hydrophilicity. Whereas, the nitrogen plasma–treated sample (PNT 71) exhibits a more pronounced increase across the O–H/N–H and amide regions (1400–1600 cm−1), suggesting nitrogen incorporation and modification of surface nitrogen functionalities. Subtle intensity differences in the carbohydrate region (1200–1000 cm−1) also suggest surface rearrangements, but no new absorption bands are observed, indicating that plasma primarily modifies surface chemistry without altering the bulk molecular structure.
A distinct doublet feature at ~2350 cm−1, most evident in the oxygen plasma–treated sample, is assigned to the asymmetric stretching vibration of atmospheric CO2. This band typically appears as two adjacent absorptions due to vibrational–rotational splitting in the gas phase and does not originate from seed constituents. Its prominence after plasma treatment may be attributed to enhanced adsorption of CO2 on more polar, oxygenated surfaces or to variation in background conditions during spectral acquisition [35,36].
In summary, the spectral comparison reveals that while both plasma treatments alter the surface chemical environment—oxygen plasma enhances hydroxyl groups, and nitrogen plasma introduces nitrogen-containing functionalities—the fundamental molecular composition of the seed coats is preserved, in line with XPS results.
3.4. SEM Results
In the following, the elemental compositions of the seeds measured by SEM-EDX are presented. It is important to emphasize that SEM-EDX probes a much greater depth (typically 1–5 µm, depending on accelerating voltage and sample density) and is therefore not surface-sensitive in the same way as XPS (5–10 nm) or ATR-FTIR (hundreds of nanometers to a few micrometers, depending on the crystal and contact quality). This has significant implications for data interpretation.
The O- and N-containing functional groups at the outermost surface (such as –OH, –C=O, or –NH2) introduced by plasma treatment cannot be directly resolved by SEM-EDX, since their signal is masked by the bulk composition of the seed, which is a complex biological matrix. Furthermore, EDX lacks chemical-state sensitivity—it provides elemental information but does not distinguish between different bonding environments.
SEM-EDX can, however, indicate overall elemental enrichment, such as an increase in oxygen content if plasma oxidizes or removes hydrocarbon layers, exposing oxygen-rich carbohydrates or lignin. It may also reveal whether nitrogen incorporation is sufficiently high to alter the near-surface (micrometer-scale) composition or whether plasma etching exposes inorganic elements (e.g., Ca, K, Si) that were previously covered by organic material.
Nevertheless, SEM-EDX data must be interpreted with caution. Several factors can influence accuracy, including surface contamination (e.g., adsorbed carbon or environmental residues) and charging effects, which are common in non-conductive biological samples. These can lead to signal distortion, local beam drift, or misestimation of light-element content.
Figure 10 presents the SEM-EDX spectra and corresponding backscattered electron (BSE) images of the control seed (panels A and D), the O-plasma-treated sample PNT 70 (panels B and E), and the N-plasma-treated sample PNT 71 (panels C and F). The quantitative elemental compositions are summarized in Table 5. The table is based on ten measurements taken from five different seeds in each treatment group and the control sample, and the reported values represent the averages with their corresponding standard deviations.
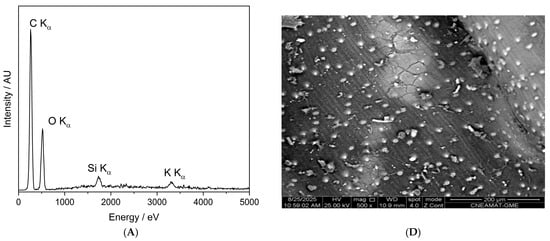
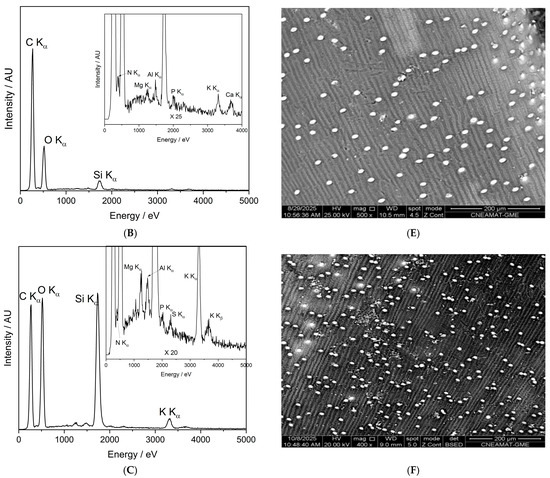
Figure 10.
SEM-EDX characterization of barley seeds. Panels (A–C) show the SEM-EDX spectra of the control seed, O-plasma-treated seed (PNT70), and N-plasma-treated seed (PNT71), respectively, while panels (D–F) display the corresponding backscattered electron (BSE) images.
Table 5.
Average elemental composition (atomic %) of the control, O-plasma-treated (PNT 70), and N-plasma-treated (PNT 71) barley seeds obtained from SEM-EDX analysis. Values represent the mean ± standard deviation from ten measurements performed on five different seeds per group.
The table includes the major elements detected (C, O, Si, K, and N); while traces of Mg, Al, P, S, and Ca were also observed at some measurement points, see insets in panels B and C. The control sample is dominated by carbon and oxygen, consistent with the organic nature of the seed surface. After plasma exposure, the O-plasma-treated sample (PNT 70) shows a similar C/O ratio, whereas the N-plasma-treated sample (PNT 71) exhibits a slight reduction in carbon and an increase in oxygen and nitrogen contents, indicating mild oxidation and possible nitrogen incorporation at the near-surface region. This is in good agreement with the results obtained by XPS. However, it should be borne in mind that nitrogen detection by EDX is inherently difficult because of its weak X-ray emission and spectral overlap with carbon peaks, resulting in substantially lower sensitivity compared to XPS.
The backscattered electron images reveal no apparent morphological changes or surface roughness variations among the samples, confirming that the plasma treatments primarily influence surface chemistry without significantly affecting the physical structure of the seed coat. The small bright particles visible on the surface correspond to fine sand grains, attributed to environmental contamination during sample handling. The surface of the barley seeds exhibits characteristic longitudinal rows and ridge-like structures, corresponding to the natural morphology of the seed coat (lemma and palea) [39,40]. These features arise from the arrangement of epidermal cells and silica bodies along the grain surface and are typical of barley and other cereal grains. Such patterns are part of the seed’s protective outer layer and facilitate mechanical strength and water regulation. The presence of these natural rows confirms that the plasma treatment did not disrupt the native microstructure of the seed surface.
Elemental distribution maps of calcium (Ca), potassium (K), nitrogen (N), phosphorus (P), and silicon (Si) were obtained from the surface of seeds for the control, O2-plasma-treated (PNT 70), and N2-plasma-treated (PNT 71) samples using SEM-EDX chemical mapping (Figure 11). The results provide a spatial overview of the main inorganic elements naturally present at the seed surface and allow qualitative comparison of elemental distributions following plasma treatment. In all samples, Ca, K, and P are the most prominent elements, showing a relatively homogeneous distribution across the seed surface. These elements are typically associated with mineral nutrients, phospholipids, and phosphate-containing biomolecules in the seed coat.
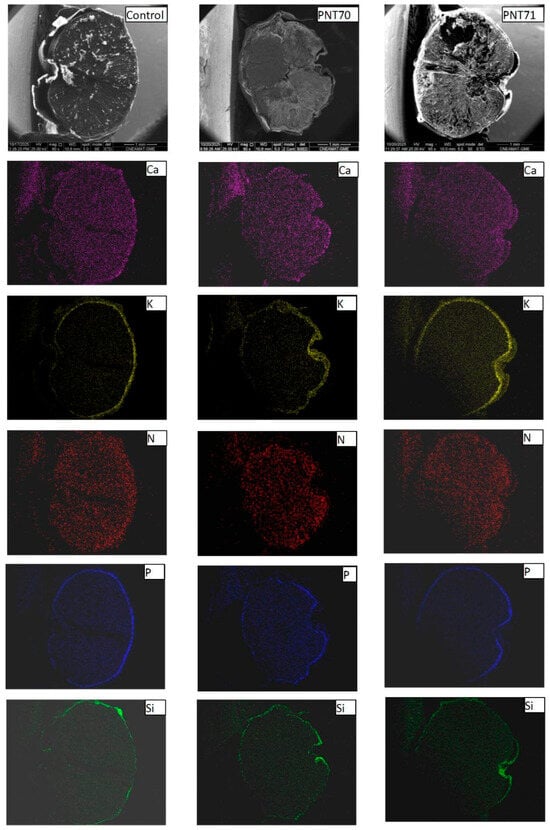
Figure 11.
SEM-EDX elemental maps of Ca, K, N, P, and Si for control, (PNT 70), and (PNT 71) barley seeds. The maps show similar elemental distributions across all samples, with no clear changes after plasma treatment.
For the O2-plasma-treated sample (PNT 70), the elemental maps do not show visible changes in either the intensity or the distribution of the detected elements compared to the control. This may suggest that oxygen plasma exposure under the applied conditions does not significantly alter the surface elemental composition or cause measurable oxidation detectable by EDX mapping. In the case of the N2-plasma-treated sample (PNT 71), the nitrogen maps also do not exhibit a distinct increase in signal intensity. This observation may reflect the inherent difficulty of detecting nitrogen with EDX, as the low-energy N Kα line is weak and often masked by background noise or overlapping peaks from other light elements. It is therefore possible that minor nitrogen incorporation occurred below the EDX detection threshold or in chemical forms not easily distinguished in mapping mode.
The Si signal, observed sporadically across all samples, likely originates from small surface particles or traces of silicate dust, which can adhere to the seed surface during handling or from environmental contamination. Importantly, no new or unusual elemental features were detected after plasma exposure, indicating that both oxygen and nitrogen plasma treatments modified the seed surface only at a subtle chemical level, without introducing or removing major inorganic elements detectable by EDX mapping.
3.5. Water Absorption Kinetics and Peleg Model Fitting
The hydration (water uptake) behavior of barley seeds was evaluated by monitoring the percentage of weight gain as a function of immersion time for control, PNT 70, and PNT 71 samples. The experimental data points, shown in Figure 12, were fitted using the Peleg model, which describes the sorption process according to the empirical relationship [17]:
where k1 and k2 are the Peleg constants. As illustrated in Figure 12, the plasma-treated seed curves exhibit a rapid initial increase in water uptake followed by a gradual approach to equilibrium, typical of diffusion-controlled hydration processes. The Peleg model provided an excellent fit to the experimental data, confirming its suitability for describing the hydration kinetics of barley seeds.
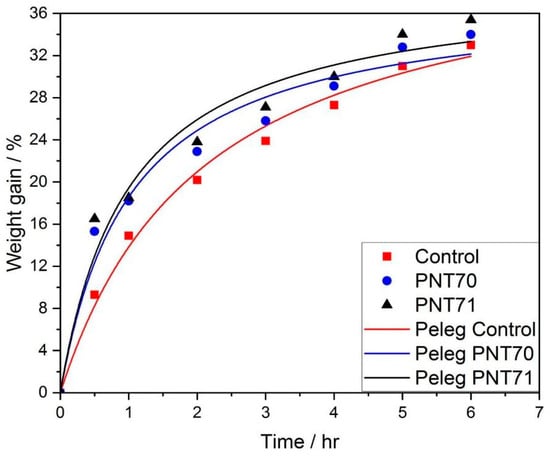
Figure 12.
Experimental and fitted curves of seed water absorption kinetics using the Peleg model for control and plasma-treated samples (PNT 70 and PNT 71).
Table 6 presents the Peleg fitting constants k1 and k2 and the corresponding derived parameters 1/k1 and 1/k2, related to the imbibition rate at t = 0 and the maximum attainable moisture content, respectively. The control seeds exhibited the highest k1 value (0.049 ± 0.005 h), indicating the slowest initial water absorption rate. In contrast, both plasma-treated samples showed lower k1, (0.027 ± 0.005 h) for PNT 70 and (0.026 ± 0.005 h) for PNT 71, corresponding to higher 1/k1 values (36.70 ± 6.56 h−1) and (38.87 ± 7.57 h−1), respectively. These results demonstrate that exposure to oxygen and nitrogen plasma increased the early seed hydration rate.
Table 6.
Peleg model parameters.
The k2 constant, which reflects the approach to equilibrium moisture content, remained nearly unchanged among treatments for PNT 70 (37.62 ± 2.43), PNT 71 (38.87 ± 2.70), and the control (43.35 ± 2.45), suggesting that plasma modification mainly influences the initial imbibition kinetics rather than the final hydration capacity. The relatively low fitting errors (R2 = 0.97–0.99) for all parameters confirm the robustness of the Peleg model in describing the water uptake process of plasma-treated barley seeds.
4. Discussion
The Raman spectra of the external seed coat revealed that oxygen plasma treatment (PNT70) produced sharper and more intense bands near 1170, 1260, and 1600 cm−1, which correspond to C–O–C stretching of polysaccharides, amide III vibrations, and aromatic C=C stretching of lignin and phenolic compounds, respectively. These spectral enhancements are consistent with the oxidative cleaning action of O2 plasma, which removes surface hydrocarbons and enhances the Raman visibility of intrinsic biopolymer structures [41,42]. The better-defined peaks also indicate a more homogeneous and oxygen-enriched surface, likely associated with mild oxidation of lignin and protein residues. In contrast, nitrogen plasma (PNT 71) induced subtler changes, characterized by broader and less intense Raman features. This behavior agrees with prior reports describing N2 plasma as a milder activator that primarily introduces low levels of nitrogen functionalities, such as amines or amides, without extensive oxidation [11,17]. Importantly, Raman spectra from the interior of the seeds show strong and unshifted bands associated with starch and carotenoids at ~480, 940–960, 1045–1060, and 1520 cm−1. The absence of new features or band shifts confirms that the plasma does not alter the internal biochemical composition, in agreement with previous seed studies showing that plasma modification is a surface-limited process [39].
The ATR-FTIR spectra support and complement the Raman results by providing molecular-level evidence of surface functional group changes. All samples—the control, O2-plasma-treated (PNT70), and N2-plasma-treated (PNT 71)—exhibit the characteristic bands of seed biopolymers: a broad O–H/N–H stretching envelope between 3200 and 3600 cm−1, C–H stretching near 2920 and 2850 cm−1, amide I (~1650 cm−1) and amide II (~1540 cm−1) from proteins, and carbohydrate-related absorptions in the 1200–1000 cm−1 region. The preservation of these spectral features confirms that plasma exposure does not degrade or chemically decompose the main seed constituents, namely starch, proteins, and lipids, thereby validating the Raman observation of structural stability in the seed interior.
Oxygen plasma caused a clear enhancement in the O–H/N–H stretching region (3200–3600 cm−1), indicating increased hydroxylation and higher surface hydrophilicity, consistent with oxidative functionalization typically observed on plasma-treated biopolymers [41,42]. Nitrogen plasma, on the other hand, led to a relative increase in both the hydroxyl and amide regions (1400–1600 cm−1), suggesting the introduction of nitrogen-containing species, in agreement with surface amination trends reported in N2-plasma-treated biological materials [11,41]. Subtle variations in the 1200–1000 cm−1 carbohydrate regions likely reflect local rearrangements of polysaccharide hydrogen bonding rather than new chemical groups. The combined Raman and ATR-FTIR techniques consistently demonstrate that the effects of oxygen and nitrogen plasma are largely confined to the outer seed coat, while the molecular composition of the seed interior is intact.
The XPS analysis quantitatively confirms the surface oxidation and functionalization inferred from the vibrational spectroscopies. Deconvolution of the O 1s region revealed two components: hydroxyl oxygen (O–H) at ~532–533 eV and oxidized oxygen (O–O, carbonyl-type) at ~530–531 eV. Plasma treatment increased the relative O–H contribution from 70% in the control to 82% (PNT 71) and 90% (PNT 70), indicating significant hydroxylation and higher surface polarity. The ~1 eV shift toward higher binding energy after treatment further confirms enrichment in hydroxyl species—consistent with the intensified O–H/N–H stretching bands observed by FTIR.
The C 1s spectra showed a pronounced reduction in the C–C/C–H peak (284.8 eV) and a relative increase in C–O and C=O components after oxygen plasma, demonstrating oxidative cleaning and removal of adventitious carbon, in agreement with the sharper Raman peaks of PNT70. Nitrogen plasma produced milder changes, again reflecting its lower oxidative potential. The N 1s spectra provided direct evidence of nitrogen incorporation after N2 plasma, with a dominant amine/amide component at ~400.8 eV, while the O2-treated sample exhibited only weak nitrogen signals, suggesting oxidation or removal of nitrogen functionalities. In the Ca 2p region, the signal decreased slightly after N2 plasma but remained strong after O2 plasma, indicating that oxygen plasma mainly cleans the surface without removing native minerals.
Quantitative elemental ratios further support these trends: oxygen plasma increased the surface O content from 9% to 24% and reduced carbon from 88% to 76%, whereas nitrogen plasma produced smaller changes (O ≈ 13%, C ≈ 85%). Such compositional shifts confirm that oxygen plasma more efficiently incorporates oxygen species and removes hydrocarbons, while nitrogen plasma introduces a subtler degree of functionalization.
The SEM micrographs revealed that the plasma treatments did not alter the seed coat morphology. The characteristic longitudinal rows and ridged epidermal patterns remained intact in all samples, confirming that plasma exposure preserves the structural integrity of the surface. Small bright particles visible on the micrographs correspond to sand grains or environmental contamination rather than plasma-induced features.
Elemental mapping by SEM-EDX detected C, O, Si, K, and minor elements (Mg, Al, P, S, and Ca). The control sample exhibited ~63 at% C and ~31 at% O, consistent with an organic surface. After plasma exposure, the O2-treated sample (PNT 70) maintained a similar C/O ratio, whereas the N2-treated sample (PNT 71) showed decreased C (55 at%) and increased O (36 at%) and N (2 at%). Although detection of nitrogen by EDX is limited by low sensitivity, this small increase qualitatively supports the XPS findings. The higher Si signal occasionally observed for PNT 71 most likely results from exposure of native silica bodies rather than compositional changes.
These micrometer-scale EDX trends mirror the nanometer-scale XPS observations: oxygen plasma promotes oxidation and cleaning, while nitrogen plasma induces mild nitrogen incorporation.
The imbibition kinetics of barley seeds fitted well to the Peleg model, confirming distinct hydration behaviors among treatments. Plasma-treated seeds (PNT 70 and PNT 71) exhibited lower values, indicating faster initial water uptake compared to the control. In contrast, values remained similar, showing that plasma exposure mainly enhanced the early hydration phase without affecting equilibrium water content. The nitrogen plasma treatment (PNT 71) showed the highest water absorption rate, consistent with increased surface polarity and wettability reported for plasma-treated seeds.
The increased water absorption rate of plasma-treated barley seeds found in this work contrasts with recent results obtained with a DBD between flat electrodes, in which no significant increase in the water uptake capacity of the seeds was found [6]. Given the consensus that the increased wettability of plasma-treated seeds can be attributed essentially to a combination of the physical action of the plasma on the seed surface, through the etching process by energetic particles, and the chemical action of reactive oxygen and nitrogen species (RONS) on the seed surface [2,4], the observed differences could be attributed to the higher concentrations of electrons and RONS found in dielectric barrier-stabilized corona discharges compared to those operating under similar conditions but between flat electrodes [15].
To the best of our knowledge, this study represents one of the first Raman-based comparisons of oxygen- and nitrogen-plasma effects on the barley seeds, providing direct spectroscopic evidence of the differential reactivity of these plasmas toward plant biopolymers.
5. Conclusions
This study demonstrates that our low-temperature oxygen- and nitrogen-enriched plasma setup, generated by combining a dielectric barrier discharge with a corona discharge in a wire-to-plane electrode configuration, produces well-defined and quantifiable modifications on the outermost layers of barley seed coats while preserving the internal biochemical structure. XPS revealed that oxygen plasma induced the strongest chemical activation, increasing surface oxygen from 9 ± 5 at% to 24 ± 5 at% and raising the hydroxyl O 1s contribution to ~90%, whereas nitrogen plasma incorporated detectable amine/amide species and increased O–H/O–N content to ~82%. Both plasmas reduced adventitious carbon, with oxygen plasma producing the strongest cleaning effect. Raman and ATR-FTIR confirmed retention of polysaccharide, protein, lipid, and carotenoid structures, indicating that the treatments modify only the outer nanometers of the seed coat without altering the interior.
At the functional level, these chemical changes resulted in faster early water uptake. The Peleg initial imbibition rate 1/k1 increased from 20.25 ± 1.90 h−1 (control) to 36.70 ± 6.56 h−1 (O2) and 38.87 ± 7.57 h−1 (N2), while 1/k2 remained unchanged, demonstrating that plasma treatment accelerates hydration kinetics without affecting final moisture capacity. SEM-EDX and imaging confirmed that no morphological damage or micrometer-scale compositional disruption occurred.
Overall, the combined spectroscopic, microscopic, and hydration analyses show that both plasma types enhance surface hydrophilicity through selective chemical functionalization, with oxygen plasma producing the strongest oxidation and nitrogen plasma enabling moderate amination. These quantifiable and stable surface modifications provide a mechanistic basis for improving steeping efficiency, reducing hydration time, and potentially enhancing germination performance in barley.
Author Contributions
Conceptualization, F.S.G., K.B.B., G.M. and L.P.; methodology, F.S.G., E.B.H., E.F.E. and P.N.A.; software, F.S.G. and A.G.; formal analysis, F.S.G., E.B.H., E.F.E., P.N.A., K.B.B. and L.P.; experiments, A.G., B.E.R., K.B.B. and L.P.; resources, G.M.; data curation, F.S.G., E.B.H., E.F.E., P.N.A., K.B.B. and L.P.; visualization, F.S.G., K.B.B., G.M. and L.P.; writing—original draft preparation, F.S.G.; writing—review and editing, F.S.G., E.B.H., E.F.E., P.N.A., K.B.B. and L.P.; supervision, F.S.G., K.B.B., G.M. and L.P.; funding acquisition, G.M. All authors have read and agreed to the published version of the manuscript.
Funding
This work was supported by Sylvarum, https://www.sylvarum.co/, accessed on 1 August 2025.
Data Availability Statement
The data presented in this study are available on request from the corresponding author.
Acknowledgments
L.P. and K.B.B. are members of CONICET. During the preparation of this manuscript, FSG used ChatGPT 5 for the purposes of the interpretation of Raman and ATR-FTIR results. FSG has reviewed and edited the output and takes full responsibility for the content of this publication.
Conflicts of Interest
Author Guadalupe Murga was CEO of the company SYLVARUM SAS. Author Brlan E. Robertson was employed by company SYLVARUM SAS. Author Allin Glagovsky was employed by company SYLVARUM SAS. The remaining authors declare that the research was conducted in the absence of any commercial or financial relationships that could be construed as a potential conflict of interest.
References
- Ahmed, N.; Yong, L.X.; Yang, J.H.C.; Siow, K.S. Review of Non-Thermal Plasma Technology and Its Potential Impact on Food Crop Seed Types in Plasma Agriculture. Plasma Chem. Plasma Process. 2025, 45, 421–462. [Google Scholar] [CrossRef]
- Bilea, F.; Garcia-Vaquero, M.; Magureanu, M.; Mihaila, I.; Mildažienė, V.; Mozetič, M.; Pawłat, J.; Primc, G.; Puač, N.; Robert, E.; et al. Non-Thermal Plasma as Environmentally-Friendly Technology for Agriculture: A Review and Roadmap. Crit. Rev. Plant Sci. 2024, 43, 428–486. [Google Scholar] [CrossRef]
- Šrámková, P.; Kostoláni, D.; Kyzek, S.; Bathoova, M.; Ďurčányová, S.; Stupavská, M.; Gálová, E.; Zahoranová, A.; Švubová, R. Extending shelf life: Cold plasma as a tool to preserve long-term germination potential of pea seeds. Sci. Rep. 2025, 15, 35001. [Google Scholar] [CrossRef]
- Adamovich, I.; Agarwal, S.; Ahedo, E.; Alves, L.L.; Baalrud, S.; Babaeva, N.; Bogaerts, A.; Bourdon, A.; Bruggeman, P.J.; Canal, C.; et al. The 2022 Plasma Roadmap: Low temperature plasma science and technology. J. Phys. D Appl. Phys. 2022, 55, 373001. [Google Scholar] [CrossRef]
- Deepak, G.D. Review on recent advances in cold plasma technology. Eur. Phys. J. Appl. Phys. 2022, 97, 39. [Google Scholar] [CrossRef]
- Perea-Brenes, A.; Gómez-Ramírez, A.; López-Santos, C.; Oliva-Ramírez, M.; Molina, R.; Cotrino, J.; García, J.L.; Cantos, M.; González-Elipe, A.R. Comparative analysis of the germination of barley seeds subjected to drying, hydrogen peroxide, or oxidative air plasma treatments. Plasma Process. Polym. 2022, 19, 2200035. [Google Scholar] [CrossRef]
- Holc, M.; Mozetič, M.; Recek, N.; Primc, G.; Vesel, A.; Zaplotnik, R.; Gselman, P. Wettability Increase in Plasma-Treated Agricultural Seeds and Its Relation to Germination Improvement. Agronomy 2021, 11, 1467. [Google Scholar] [CrossRef]
- Perea-Brenes, A.; Ruiz-Pino, N.; Yubero, F.; Garcia, J.L.; Gonzalez-Elipe, A.R.; Gomez-Ramirez, A.; Prados, A.; Lopez-Santos, C. Ion Mobility and Segregation in Seed Surfaces Subjected to Cold Plasma Treatments. J. Agric. Food Chem. 2025, 73, 6486–6499. [Google Scholar] [CrossRef]
- Kalachova, T.; Jindřichová, B.; Pospíchalová, R.; Fujera, J.; Artemenko, A.; Jančík, J.; Antonova, A.; Kylián, O.; Prukner, V.; Burketová, L.; et al. Plasma Treatment Modifies Element Distribution in Seed Coating and Affects Further Germination and Plant Growth through Interaction with Soil Microbiome. J. Agric. Food Chem. 2024, 72, 5609–5624. [Google Scholar] [CrossRef]
- Peťková, M.; Švubová, R.; Kyzek, S.; Medvecká, V.; Slováková, Ľ.; Ševčovičová, A.; Gálová, E. The Effects of Cold Atmospheric Pressure Plasma on Germination Parameters, Enzyme Activities and Induction of DNA Damage in Barley. Int. J. Mol. Sci. 2021, 22, 2833. [Google Scholar] [CrossRef]
- Waskow, A.; Howling, A.; Furno, I. Mechanisms of Plasma-Seed Treatments as a Potential Seed Processing Technology. Front. Phys. 2021, 9, 617345. [Google Scholar] [CrossRef]
- Veerana, M.; Mumtaz, S.; Rana, J.N.; Javed, R.; Panngom, K.; Ahmed, B.; Akter, K.; Choi, E.H. Recent Advances in Non-Thermal Plasma for Seed Germination, Plant Growth, and Secondary Metabolite Synthesis: A Promising Frontier for Sustainable Agriculture. Plasma Chem. Plasma Process. 2024, 44, 2263–2302. [Google Scholar] [CrossRef]
- Pizá, M.C.; Prevosto, L.; Zilli, C.; Cejas, E.; Kelly, H.; Balestrasse, K. Effects of non–thermal plasmas on seed-borne Diaporthe/Phomopsis complex and germination parameters of soybean seeds. Innov. Food Sci. Emerg. Technol. 2018, 49, 82–91. [Google Scholar] [CrossRef]
- Rongsangchaicharean, T.; Srisonphan, S.; Onwimol, D. Responses of Rice Seed Quality to Large-Scale Atmospheric Nonthermal Plasmas. Plasma Chem. Plasma Process 2022, 42, 1127–1141. [Google Scholar] [CrossRef]
- Srisonphan, S.; Ruangwong, K.; Thammaniphit, C. Localized Electric Field Enhanced Streamer Cold Plasma Interaction on Biological Curved Surfaces and Its Shadow Effect. Plasma Chem. Plasma Process 2020, 40, 1253–1265. [Google Scholar] [CrossRef]
- Fridman, A.; Chirokov, A.; Gutsol, A. Non-thermal atmospheric pressure discharges. J. Phys. D Appl. Phys. 2005, 38, R1–R24. [Google Scholar] [CrossRef]
- Ford, M.; Coad, B.R. Plasma glows and shifting water flows: Measuring the changes to water transport phenomena in seeds after plasma treatment. Food Chem. 2025, 479, 143733. [Google Scholar] [CrossRef] [PubMed]
- Aulia, R.; Amanah, H.Z.; Lee, H.; Kim, M.S.; Baek, I.; Qin, J.; Cho, B.-K. Protein and lipid content estimation in soybeans using Raman hyperspectral imaging. Front. Plant Sci. 2023, 14, 1167139. [Google Scholar] [CrossRef]
- Liu, Y.; Xu, Y.; Yan, Y.; Hu, D.; Yang, L.; Shen, R. Application of Raman spectroscopy in structure analysis and crystallinity calculation of corn starch: Structure analysis and crystallinity calculation by Raman spectroscopy. Starch-Stärke 2015, 67, 612–619. [Google Scholar] [CrossRef]
- Synytsya, A.; Čopíková, J.; Matějka, P.; Machovič, V. Fourier transform Raman and infrared spectroscopy of pectins. Carbohydr. Polym. 2003, 54, 97–106. [Google Scholar] [CrossRef]
- De Gelder, J.; De Gussem, K.; Vandenabeele, P.; Moens, L. Reference database of Raman spectra of biological molecules. J. Raman Spectrosc. 2007, 38, 1133–1147. [Google Scholar] [CrossRef]
- Agarwal, U.P. Raman imaging to investigate ultrastructure and composition of plant cell walls: Distribution of lignin and cellulose in black spruce wood (Picea mariana). Planta 2006, 224, 1141–1153. [Google Scholar] [CrossRef] [PubMed]
- Szymanska-Chargot, M.; Zdunek, A. Use of FT-IR Spectra and PCA to the Bulk Characterization of Cell Wall Residues of Fruits and Vegetables Along a Fraction Process. Food Biophys. 2013, 8, 29–42. [Google Scholar] [CrossRef]
- Schulz, H.; Baranska, M.; Baranski, R. Potential of NIR-FT-Raman spectroscopy in natural carotenoid analysis. Biopolymers 2005, 77, 212–221. [Google Scholar] [CrossRef]
- Schulz, H.; Baranska, M. Identification and quantification of valuable plant substances by IR and Raman spectroscopy. Vib. Spectrosc. 2007, 43, 13–25. [Google Scholar] [CrossRef]
- Czamara, K.; Majzner, K.; Pacia, M.Z.; Kochan, K.; Kaczor, A.; Baranska, M. Raman spectroscopy of lipids: A review. J. Raman Spectrosc. 2015, 46, 4–20. [Google Scholar]
- Barth, A. Infrared spectroscopy of proteins. Biochim. Et Biophys. Acta (BBA)-Bioenerg. 2007, 1767, 1073–1101. [Google Scholar] [CrossRef]
- Cael, S.J.; Koenig, J.L.; Blackwell, J. Infrared and raman spectroscopy of carbohydrates: Part III: Raman spectra of the polymorphic forms of amylose. Carbohydr. Res. 1973, 29, 123–134. [Google Scholar] [CrossRef] [PubMed]
- Withnall, R.; Chowdhry, B.Z.; Silver, J.; Edwards, H.G.M.; de Oliveira, L.F.C. Raman spectra of carotenoids in natural products. Spectrochim. Acta Part A Mol. Biomol. Spectrosc. 2003, 59, 2207–2212. [Google Scholar]
- Lu, H.; Tian, Y.; Ma, R. Assessment of order of helical structures of retrograded starch by Raman spectroscopy. Food Hydrocoll. 2023, 134, 108064. [Google Scholar] [CrossRef]
- Gómez-Ramírez, A.; López-Santos, C.; Cantos, M.; García, J.L.; Molina, R.; Cotrino, J.; Espinós, J.P.; González-Elipe, A.R. Surface chemistry and germination improvement of Quinoa seeds subjected to plasma activation. Sci. Rep. 2017, 7, 5924. [Google Scholar] [CrossRef]
- Henderson, J.D.; Payne, B.P.; McIntyre, N.S.; Biesinger, M.C. Enhancing Oxygen Spectra Interpretation by Calculating Oxygen Linked to Adventitious Carbon. Surf. Interface Anal. 2025, 57, 214–220. [Google Scholar] [CrossRef]
- Šerá, B.; Šerý, M.; Zahoranová, A.; Tomeková, J. Germination Improvement of Three Pine Species (Pinus) After Diffuse Coplanar Surface Barrier Discharge Plasma Treatment. Plasma Chem. Plasma Process. 2021, 41, 211–226. [Google Scholar] [CrossRef]
- Durak, T.; Depciuch, J. Effect of plant sample preparation and measuring methods on ATR-FTIR spectra results. Environ. Exp. Bot. 2020, 169, 103915. [Google Scholar] [CrossRef]
- Stuart, B.H. Infrared Spectroscopy: Fundamentals and Applications, 1st ed.; Wiley: Hoboken, NJ, USA, 2004. [Google Scholar]
- Naumann, D. Infrared Spectroscopy in Microbiology. In Encyclopedia of Analytical Chemistry; Meyers, R.A., Ed.; Wiley: Hoboken, NJ, USA, 2000. [Google Scholar]
- Christou, C.; Agapiou, A.; Kokkinofta, R. Use of FTIR spectroscopy and chemometrics for the classification of carobs origin. J. Adv. Res. 2018, 10, 1–8. [Google Scholar] [CrossRef] [PubMed]
- Kačuráková, M.; Wilson, R.H. Developments in mid-infrared FT-IR spectroscopy of selected carbohydrates. Carbohydr. Polym. 2001, 44, 291–303. [Google Scholar] [CrossRef]
- Grant, K.R.; Brennan, M.; Hoad, S.P. The Structure of the Barley Husk Influences Its Resistance to Mechanical Stress. Front. Plant Sci. 2021, 11, 614334. [Google Scholar] [CrossRef]
- Taketa, S.; Amano, S.; Tsujino, Y.; Sato, T.; Saisho, D.; Kakeda, K.; Nomura, M.; Suzuki, T.; Matsumoto, T.; Sato, K.; et al. Barley grain with adhering hulls is controlled by an ERF family transcription factor gene regulating a lipid biosynthesis pathway. Proc. Natl. Acad. Sci. USA 2008, 105, 4062–4067. [Google Scholar] [CrossRef]
- Ji, S.H.; Ki, S.H.; Kang, M.H.; Choi, J.S.; Park, Y.; Oh, J.; Kim, S.B.; Yoo, S.J.; Choi, E.H.; Park, G. Characterization of physical and biochemical changes in plasma treated spinach seed during germination. J. Phys. D Appl. Phys. 2018, 51, 145205. [Google Scholar] [CrossRef]
- Okumura, T.; Attri, P.; Kamataki, K.; Yamashita, N.; Tsukada, Y.; Itagaki, N.; Shiratani, M.; Ishibashi, Y.; Kuchitsu, K.; Koga, K. Detection of NO3− introduced in plasma-irradiated dry lettuce seeds using liquid chromatography-electrospray ionization quantum mass spectrometry (LC-ESI QMS). Sci. Rep. 2022, 12, 12525. [Google Scholar] [CrossRef]


Disclaimer/Publisher’s Note: The statements, opinions and data contained in all publications are solely those of the individual author(s) and contributor(s) and not of MDPI and/or the editor(s). MDPI and/or the editor(s) disclaim responsibility for any injury to people or property resulting from any ideas, methods, instructions or products referred to in the content. |
© 2025 by the authors. Licensee MDPI, Basel, Switzerland. This article is an open access article distributed under the terms and conditions of the Creative Commons Attribution (CC BY) license.