Abstract
Agriculture is a significant contributor to greenhouse gas (GHG) emissions, with enteric methane (EntCH4) from cattle production being a major source. In Zambia, cattle play a critical role in rural livelihoods and food security, yet the contribution of cattle production systems to national GHG emissions remains poorly quantified. This study used the Intergovernmental Panel on Climate Change (IPCC) Tier 2 method to estimate EntCH4 from Zambia’s cattle population from 1994 to 2022. The Tier 2 method provides a more accurate estimate than the Tier 1 method by incorporating country-specific data on cattle population demographics, husbandry, and feeding practices. The results show significant variations in EntCH4 over time, driven by changes in cattle population dynamics and production practices. This study underscored the importance of transitioning from the generalized Tier 1 to the Tier 2 method to capture the unique characteristics of Zambia’s cattle production systems. The present findings provide critical insights for developing targeted mitigation strategies that will support Zambia’s ongoing efforts to address climate change while promoting sustainable livestock production.
1. Introduction
The agriculture sector is of significant social, cultural, industrial, and economic importance in the Southern Africa Development Community (SADC) region, contributing between 4 and 27% of the gross domestic product (GDP). Over 70% of the region’s population, estimated to be slightly over 370 million, depends on agriculture for food, income and employment. Livestock production in the SADC region is significant, accounting for close to 40% of agriculture value added in some countries [1]. The livestock sector plays a pivotal role in food and nutritional security and is the economic backbone for some countries in the region. There is growing global and continental demand for livestock and livestock products. Hence, most of the countries in the region have embarked on livestock development plans to increase the livestock population and enhance value chain efficiency.
Cattle in the SADC region are regarded as one of the most important livestock species for their high economic returns and other contributions to both rural and urban economies. Hence, the performance of this sub-sector has a strong influence on food security, economic growth, and social stability in the region. The cattle population in the region is estimated to be slightly over 75 million heads and has been growing rapidly by almost 2% in the last two decades [2]. This growth has been driven by an increase in demand for animal-sourced food (meat, milk) because of population growth, urbanization, the growing middle-income class and the attendant higher disposable income [3,4,5].
Cattle are also a source of greenhouse gas (GHG) emissions, especially methane emissions, as a result of enteric fermentation. Ruminants produce methane as a by-product of the digestive process of enteric fermentation. Annual enteric methane emission is determined by the population size and by emissions per head per year, i.e., the emission factor. The emission factor varies with productive and reproductive performances, feed intake, and the type and quality of the feed. It is, thus, expected that the methane emissions from livestock will increase in response to the growing demand for animal-sourced food in the SADC region and efforts to increase productivity.
Livestock plays a crucial role in Zambia’s economy, contributing to food security, employment generation, and poverty alleviation. The livestock sub-sector contributes 3.2% and 42% to the national and agriculture sector GDP. Therefore, it has the potential to deliver both agricultural-led growth and socio-economic transformation as aspired to in the Eighth National Development Plan (8NDP) and Vision 2030 [6]. Among livestock, cattle are significant, providing meat, milk, draft power, and manure for smallholder farmers [7]. Cattle also play a cultural role in many Zambian communities, serving as a source of wealth, status, and social security [5]. With a cattle population of 5,115,495 heads [6], livestock is a significant source of greenhouse gas (GHG) emissions.
Enteric fermentation is a key category in the cattle GHG inventory, and the Intergovernmental Panel on Climate Change (IPCC) Guidelines recommend quantifying it using a Tier 2 method for major emitting species, such as cattle. The Tier 2 method is also more useful than the Tier 1 method for assessing the effects of livestock sector trends and policy measures on GHG emissions as it can better reflect actual practices and animal performance in the country. The development of a Tier 2 GHG inventory is expected to support further identification of livestock GHG mitigation options in line with national development and adaptation priorities.
According to Zambia’s first Biennial Update Report in 2020 to the United Nations Framework Convention on Climate Change (UNFCCC), enteric fermentation using the Tier 1 method contributed about 4200 Gg CO2e, or 27% of agricultural GHG emissions, with further emissions from dung and urine deposited on pasture. Livestock GHG emissions are therefore expected to increase with further development of the sector. Using the IPCC Tier 1 method, Zambia’s latest GHG inventory [8] indicates that enteric methane is the largest source of cattle emissions and a key emission source in the national inventory. Enteric methane thus requires a more accurate estimation to identify mitigation strategies. The IPCC Tier 1 method commonly used for emission estimation applies standard continental emission factors that are unable to account for the diversity of production systems and agroecological conditions, such as those present in Zambia. This has led to a growing need for more precise assessments using the IPCC Tier 2 approach, which incorporates country-specific data on feed intake, livestock productivity, and management practices [9].
Zambia, in its National Determined Contribution (NDC), has indicated its interest in and commitment to reducing emissions associated with the livestock sector [10]. There has, however, been limited previous research on livestock GHG emissions in Zambia, as is also the case for many other sub-Saharan African countries [9]. Most countries have been using the less accurate IPCC Tier 1 approach to estimate livestock emissions in their national inventories [11].
This study addresses this critical gap by applying the Tier 2 method to estimate enteric methane (EntCH4) emissions from Zambia’s cattle population over nearly three decades (1994–2022). By using detailed data on cattle demographics, production systems, and feeding practices, this study provides a more accurate emissions profile for the cattle production sector. The findings will inform future research priorities and sustainable livestock policies aligned with Zambia’s climate change mitigation efforts.
2. Materials and Methods
Estimates of EntCH4 emissions were generated using the Tier 2 method described in the 2006 IPCC guidelines [12] and the 2019 Refinement to the 2006 IPCC Guidelines for National Greenhouse Gas Inventories [13]. Dairy cattle were categorized following the OIE 2021 guidelines [14], which defined dairy cattle production systems as commercial systems where the purpose of the operation includes some or all of the breeding, rearing, and management of cattle intended for the production of milk. This included purebred dairy exotic breeds and their crossbreds. Other cattle refers to indigenous breeds and exotic purebred beef cattle, including their crossbreds, that are mostly kept for beef or multiple purposes (i.e., beef, milk and draught power).
2.1. Cattle Production Systems in Zambia
Cattle production in Zambia is characterized by a diversity of systems shaped by agro-ecological zones, cultural practices, farmers’ production objectives and management practices, available natural resources, use of breeding and assisted reproductive technology, and access to markets [5,7]. These production systems are distributed across Zambia’s diverse agro-ecological zones, with cattle populations concentrated in regions such as Western, Eastern, Southern, and Central Provinces [7]. Each region presents unique opportunities and challenges, including variations in rainfall, grazing resources, and vulnerability to climate change impacts such as droughts and flooding.
The majority of cattle in Zambia are raised in traditional or extensive systems, predominantly managed by smallholder farmers [15]. These systems rely heavily on natural pastures and communal grazing, with minimal inputs such as supplementary feed, veterinary care, or improved breeding practices. These cattle production systems provide essential livelihood resources for many rural households [7]. Cattle in these systems typically consume low-quality feed, which may result in higher methane (CH4) emissions per day and per unit of livestock product [16].
Semi-intensive systems represent a transition between traditional and commercial production. Farmers in these systems often adopt some improved management practices, such as controlled grazing, supplementary feeding, and basic veterinary care [5]. These systems are more prevalent in peri-urban areas and regions with better market access. While productivity is higher compared to traditional systems, semi-intensive systems still face challenges, including feed availability and climate variability. Commercial cattle production in Zambia is classified as an intensive system, with significant investments in infrastructure, feed quality, and animal health. These systems primarily focus on dairy and beef production for domestic and export markets [7]. High-quality feed and modern management practices contribute to increased productivity and reduced CH4 emissions per unit of product. However, commercial systems account for a small proportion of the national cattle population due to the high capital and operational costs involved.
In this study, five cattle production systems were identified, namely commercial dairy, emergent dairy, commercial beef, emergent beef, and extensive (i.e., traditional or transhumant systems) beef. The commercial dairy and beef production systems are mostly found along the railway tracks, while the extensive and emergent systems are located in the rural agricultural and peri-urban areas, respectively.
2.2. Defining and Sub-Categorizing Cattle Production Systems
The IPCC [12] recommends that cattle populations be classified into at least three main subcategories: mature cows, other mature cattle, and growing cattle. However, depending on the level of detail in the emission estimation method, subcategories may be further divided based on animal age, sex or feeding systems. The classification in the present study reflected cattle type (dairy, other), feed characteristics (production system) and animal characteristics (age, sex). Accordingly, five subcategories (Adult cows > 3 years, Adult males > 3 years, Heifers 1–3 years, Steers/Bulls 1–3 years, Calves < 1 year) were identified in each of the five cattle production systems. In addition, the commercial and extensive/traditional production systems included feedlot cattle and oxen, respectively, as extra subcategories. Thus, there are ten dairy cattle subcategories and 17 other cattle subcategories (Table 1).

Table 1.
Cattle subcategories for the different cattle production systems in Zambia.
2.3. Data Collection
EntCH4 emissions were estimated for each year from 1994 to 2022. Livestock activity data, including population, animal performance (i.e., milk yield and live weight), and feed basket composition for the different cattle subcategories, were obtained from country-specific data sources through systematic web searches using Google Scholar and bibliographic references. Literature reports on cattle from 1994 onwards (the base year for Zambia’s national inventory) were utilized for the present study if they provided parameter values for one or more of the following variables: herd structure, production system, breed, live weight (LW), weaning LW, mature LW, LW gain, calving rate, calving interval, lactation length, milk yield, milk fat and protein contents, feed basket composition and nutritional quality (including metabolizable energy, digestible energy (DE)), and hours of work (i.e., draught power). All available reports were pooled to ensure time series consistency. This study used only secondary data.
After compiling available literature reports, data gaps such as missing data and data inconsistencies were identified. To address data gaps from the literature review, an expert judgement workshop was convened with a knowledgeable team of 14 technical experts with over 15 years of experience in the field and several publications. The experts who were members of the project advisory group were carefully selected from the Ministry of Fisheries and Livestock, academia, NGOs and the private sector. They were asked to provide anonymized responses based on their experience and literature regarding animal performance, manure management, and feed composition to generate consensus on country-specific data for each livestock parameter. The responses were consolidated and then discussed at an in-person and in-house workshop held in August 2022, where the values were unanimously agreed upon before being accepted.
2.4. Cattle Subcategories (Herd Structure) and Population Data
The input data used to estimate cattle populations for each year were obtained from the FAOSTAT database. The FAOSTAT database utilized national official data (such as the 2017/2018 Livestock and Aquaculture Census and the 2022 Livestock Survey) and estimates based on FAOSTAT imputation methodology [2] as well as estimates based on the FAOSTAT dataset. The dairy cattle population was calculated to be an average of 9% of the total population, while other cattle accounted for 91%. There was no official data source on the disaggregated dairy cattle sub-categories in Zambia. For this initial inventory, we assumed that commercial dairy populations for the period 1994–2022 comprised 25% of the total dairy cattle population based on expert judgement. The remaining 75% was assumed to be the emergent dairy cattle population. For other cattle, we assumed that 14.5%, 6.2%, and 79.3% of the total other cattle population were commercial beef, emergent beef, and traditional/extensive beef populations, respectively, for the period 1994–2022, which was also based on expert judgement. The cattle population estimates disaggregated by cattle type for 2021 and 2022 were obtained by linear extrapolation following the method suggested by [17]. The total cattle population by cattle type and by production system is shown in Table 2.
Table 2.
Time series for the overall cattle population by cattle type and production system (head).
The population of cattle in each subcategory was estimated using the herd structure shown in Supplementary Table S1a,b. Given the lack of data on changes in herd structure over time, the herd structure proportions for each subcategory were assumed to be constant and hence were applied throughout the time series (from 1994 to 2022). Supplementary Table S2a,b show the dairy and other cattle subcategory populations.
2.5. Liveweight and Weight Gain
There is limited information on the LW and mature LW of both dairy and other cattle, as only a few published studies provided the data utilized. This led to the expert judgement session to address gaps in the available data. For adult cows, LW was calculated as the overall average LW of adult cows from articles and reports that provided LW for female animals, followed by expert judgement sessions after discarding outliers to ensure a coefficient of variation below 20%. For adult bulls, LW was estimated through expert judgement sessions, as there were no reports for this category. For calves aged 0–1 year old, the median age in this subcategory was set at six months, and the expert judgement panel estimated the LW at six months. For heifers and growing male cattle (1–3 years), the median age was 24 months, and the expert judgement panel estimated the LW. Given the lack of data on live weights over time, the values calculated for each subcategory in the dairy and other production systems were assumed to be constant and applied throughout the time series data (from 1994 to 2022).
The LW gain for adult cows and bulls was assumed to be zero, which is consistent with the guidelines [12]. LW gains for heifers (1–3 years) and growing males (1–3 years) were estimated as follows. To ensure consistency with the LW data used, the average daily LW gain for each subcategory was calculated by dividing the change in LW between two age classes by the number of days between the median age of each age class. For example, LW gain for heifers and growing males was calculated as the difference between the LW of growing heifers or growing males (1–3 years) and the live weight of calves (0–1 year) divided by the difference between the median age (in days) of the growing heifers or growing males (assuming 24 months as median age: 24 × 30.4 days = 730 days) and the median age (in days) of the calves (assuming a median age of 6 months: 6 × 30.4 days = 182 days). The weight gain for calves (0–1 year) was calculated as the difference between the live weight of calves (0–1 year) and their live weight at birth, divided by the median age (in days) of the calves (assuming a median age of 6 months: 6 × 30.4 days = 180 days). Given the lack of data regarding changes in weight gain over time, the values estimated for each subcategory of the dairy and other production systems were assumed to be constant and hence were applied throughout the time series data (from 1994 to 2022) and are shown in Supplementary Table S3.
2.6. Proportions of Females Giving Birth, Milk Yield and Milk Fat
The proportion of cows giving birth was estimated directly from calving rates as a proxy indicator:
P = (total number of calves/number of cows exposed to bulls) × 100
The calving rate is defined as the proportion of cows giving birth (P) over the total number of cows mated to bulls during the breeding season. Estimates less than 50% were removed from the analysis of average calving rates. For other cattle, due to limited available data in the literature, expert judgement was used to determine the proportion of cows giving birth. The proportions of cows giving birth (calving rate) in the commercial and emergent dairy systems were estimated at constant values of 73.8% and 63.7%, respectively. For other cattle, they were estimated at constant values of 80%, 59.1% and 55% for commercial beef, emergent beef and traditional/extensive production systems, respectively. These estimates were consistently used throughout the times series.
Milk yield estimates for the commercial dairy production system were obtained from various reports across the country [18,19,20,21,22,23,24,25,26,27,28]. These were mostly from survey records of milk off-take (i.e., volume of milk obtained by milking). The milk yields were categorized into two time periods: 2006 and 2011 (with a mean year of 2009 and an average daily milk yield of 17.0 L/day) and studies spanning from 2012 to 2022 (with a mean year of 2017, and an average daily milk yield of 21.3 L/day). After collating literature reports, the estimated daily milk off-take was converted to an annual average daily off-take (i.e., over 365 days) by multiplying the calculated average daily milk off-take by lactation duration and the proportion of cows giving birth. For example, for the year 2009, 17.0 × (275/365 days) × 0.738 = 9.5 kg (or 9.8 L) per cow per day, and for the year 2017, 21.3 × (275/365 days) × 0.738 = 11.8 kg (or 12.2 L) per cow per day for the commercial dairy production system. Extrapolation was used to estimate milk yield for the period between 1994 and 2008 and 2018–2022, and interpolation was used for the periods 2009–2017 based on the average values for 2009 and 2017 (reference years). The reference years were determined by calculating the average of the years for which data were available. For lactation length, the simple average from all literature review articles/reports was used, resulting in 275 days. Due to the lack of data on changes in lactation length and milk fat content over time, these average values were assumed to be constant and were applied throughout the time series data (1994 to 2022).
Similarly, milk yield estimates for emergent dairy production systems were obtained from various reports [18,19,20,21,22,23,24,25,26,27,28,29,30,31,32,33,34,35]. To determine the average daily milk yield per head in the emergent dairy production system, three data points, 1998, 2011, and 2022, were defined. Mean values were calculated for the periods 1994–1998, 1999–2011, and 2012–2022, and these were applied to the intervening years. For the other cattle types, constant values of 3.7 kg and 2.0 kg average milk yield were applied for emergent beef and traditional beef, respectively, for the entire time series from 1994 to 2022, as presented in Supplementary Table S4. A default value of 3.5% was used for milk fat content for all cows, following 2006 IPCC guidelines [12].
2.7. Work Hours for Oxen
Oxen in the extensive traditional production system are used for draught power [7]. They are mainly used for ploughing and transporting crop produce, food commodities, firewood, and water. The average work hours for oxen are 3.5 h per day for 46 days during the ploughing season [36]. Oxen are also used for an average of 50 days per year for transportation. To calculate the average hours worked per day by oxen, we multiplied the days worked by the hours worked per day for all activities and divided by 365 days (year). The total hours worked per calendar day was 0.715 h per oxen per year.
2.8. Diet Composition and Feed Characteristics
An expert judgement panel was used to define diet components and characterize feed characteristics in the dairy and other cattle production systems, as there was no published literature data. Using a questionnaire, the experts were individually asked to categorize the available diet components. They listed seven feed categories: (1) natural forages (i.e., grazing on unimproved or improved pastures and/or cut-and-carry systems), (2) planted pastures or forages (i.e., grass or legumes or fodder shrub/tree species), (3) grass hay (cut-and-carry system), (4) silage (i.e., maize, elephant grass, etc.), (5) agro-industrial by-products (e.g., oil seed cakes, cereal milling by-products, molasses, brewers’ waste, etc.), (6) concentrates and supplements (i.e., commercial or home-made, mineral supplements), (7) crop residues (i.e., from agricultural fields, households, marketplaces, food processing, etc.). The diet composition, as determined by the expert panel, is shown in Supplementary Table S5.
2.9. Other Coefficients in the IPCC Tier 2 Method
The IPCC provides the default coefficients for maintenance (Cfi): default values for lactating cows as 0.386; for non-lactating cows, growing cattle, and oxen as 0.322; and for bulls as 0.37 [12]. Country-specific values for Cfi were weighted for dairy cows and other cows by the proportion of dairy cows giving birth in the herd and the lactation period. For adult males (i.e., bulls), the value of Cfi was 0.370 across production systems and 0.322 for non-lactating cows, growing animals, and oxen.
2.10. Gross Energy Intake Estimation
A list of common cattle feedstuffs available in Zambia with their respective chemical compositions and nutritive values, including dry matter (DM), crude protein (CP) and metabolizable energy (ME), was compiled from the literature review. In the IPCC Tier 2 method, the amount consumed is predicted based on gross energy requirements, which depends on diet digestibility and animal performance; therefore, data on the amounts of specific feedstuffs consumed by cattle are not required. Feed energy digestibility (DE%) values for each feedstuff were estimated using two equations from [37]:
Feed energy digestibility (DE, %) = [Digestible energy (DE, MJ)/18.4] × 100
Digestible energy (DE, MJ) = Metabolizable energy (ME, MJ)/0.81
The final DE (%) value for each animal subcategory was calculated as the weighted sum of the individual feedstuffs’ DE values and their respective proportions in the feed. The resulting estimates were 61%, 61.2%, and 61.4% for commercial dairy and 58.1%, 58.2% and 58.0% for emergent dairy for the years 1995, 2007, and 2021, respectively. For beef cattle, 56%, 54.4%, and 53.7% were used for the respective and intervening years.
2.11. Enteric Methane Emission Factors
The enteric methane emission factors were calculated for each cattle subcategory in each production system using the 2006 IPCC equation.
where EF = the emission factor (kg CH4/head/year), GE = gross energy intake (MJ/head per day), Ym = CH4 conversion factor (%), 55.65 (MJ/kg CH4) = energy content of CH4, 365 days = number of days in the year. The value for the methane conversion factor used was the IPCC [13] default value of 6.5% for all cattle production systems, except for the extensive/traditional production system for which the default value of 7.0% was applied. For calves, a methane conversion factor of 3.25% was used, as the average calf is only alive for 6 months in a year, representing emissions after weaning at the age of 90 days and no emissions during the 90-day suckling period.
EF = (GE × (Ym/100) × 365 days)/55.65
2.12. Uncertainty Analysis
Uncertainty analysis for enteric methane emission was accomplished by Monte Carlo simulation implemented in Palisade @Risk software version 8.2.2 using the inventory mean values, margins of error around the mean value, and assumed probability density functions for each input parameter. The contribution of each variable to total uncertainty was estimated using Spearman’s ranked correlation coefficients [38]. The uncertainty of cattle populations was estimated based on the difference between FAOSTAT estimates for 2022 and the results of the 2022 Livestock Survey [39]. For standard coefficients used in the 2006 IPCC Tier 2 equations, margins of error and probability density functions were chosen with consideration of prior literature [38,40,41]. For country-specific parameters, margins of error were calculated from the datasets used to estimate parameter values, where available. In the case of parameters estimated using expert judgement, a triangular distribution was assumed. Expert judgement was used to estimate minimum and maximum likely values, with the inventory value as the most likely value.
Our inventory estimated a 2022 population of 3.24 million cattle in the emergent and traditional beef production systems, compared to 4.41 million in the 2022 Livestock Survey [39] and 0.59 million in the commercial sector, compared to 0.29 million in the survey. These represent differences of 36% and 50%, respectively. The livestock survey report did not give specific data on herd structure for the commercial dairy and beef production systems. So, a margin of error of ±50% was assumed for all animal subcategories in 2022. The margins of error and probability density function (PDFs) used for Ym (methane conversion factor), Cfi (coefficient for net energy for maintenance), LW (live weight), and Ca (coefficient for net energy for activity) in the uncertainty analysis are presented in Supplementary Table S6. For both emergent and traditional beef production systems (i.e., emergent dairy and beef and extensive systems), variation between predicted inventory values and survey values differed between cattle subcategories. They ranged between 17.7% and 58.5% (Supplementary Table S7). The total population of cattle in all production systems estimated in the 2022 survey was 21% higher than the total population in the inventory. Therefore, for 1994, we assumed that the uncertainty of individual subcategory populations could be up to two times higher, i.e., ±42%, which was applied to all animal subcategories.
3. Results
3.1. Cattle Population
The cattle population was found to have increased by 82.1% from 2,579,998 heads in 1994 to 4,698,971 heads in 2022 [39], and enteric methane emissions also increased by 81.9% from 165.0 to 300.2 Gg CH4/year for the same period. The rapid growth in the cattle population could be attributed to the government livestock development policy in the last two decades, coupled with generally good rainfall patterns necessary for grazing and rangelands [5]. The growth rate over the whole period is comparable to that of sub-Saharan Africa (75.8%) and developing countries as a whole (81.2%) [2].
3.2. Trends and Sources of Total Emissions
The total enteric CH4 emission from Zambian cattle increased from 165 Gg CH4 in 1994 to 300.2 Gg CH4 in 2022 (Table 3). The undulating figures for methane emissions from enteric fermentation are due to changing cattle population, mainly associated with disease outbreaks such as Foot and Mouth Disease, Contagious Bovine Pleuropneumonia, and East Coast Fever from 2000 to 2005 [15] due to the drought caused by El Nino in 2015/2016 Agricultural season, and Government interventions through stocking and restocking programmes in 2006–2010. The average contributions of dairy cattle and other cattle to the total methane emissions from cattle between 1994 and 2022 were 9 and 91%, respectively. Figure 1 shows the cattle population and total methane emission trend over the time series. Other cattle in the extensive traditional production system made the largest contribution to the yearly enteric CH4 emissions, accounting for an average of 72.5% of total enteric emissions, followed by the commercial beef production system (annual average of 14.3%). Dairy cattle from commercial and emergent dairy production systems, on average, make an annual contribution of 2.7% and 5.9%, respectively, of the total emissions.
Table 3.
Methane emissions from enteric fermentation for various cattle production systems in Zambia for the period 1994–2022 (Gg methane).
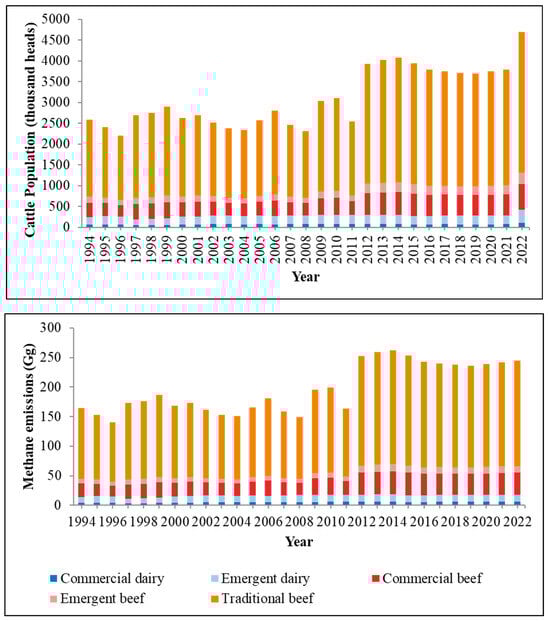
Figure 1.
Cattle population and methane emissions from enteric fermentation for various cattle production systems in Zambia for the period 1994–2022.
3.3. Emission Factors
The calculated methane emission factors for dairy and other cattle in Zambia are shown in Table 4a,b. The mean methane emission factors for commercial dairy ranged from an average of 17.8 kg CH4 head/year for calves to 99 kg CH4/head/year for adult cows. In the emergent dairy sector, the average was 18.7 kg CH4/head/year for calves rising to 70.5 kg CH4/head/year. A similar trend was observed for the other cattle, although the emission factors were lower in each year and sex class. Generally, adult cows and heifers had higher enteric methane emission factors than adult males and steers, respectively, for both cattle types and across the five production systems. Calves had the lowest enteric methane emission factors. It was also noted that the enteric methane emission factors generally increased from 1994 to 2022 for all production systems except for the emergent beef and extensive traditional production systems. The average emission factor for the adult cows from 1994 to 2022 for commercial dairy, emergent dairy, commercial beef, emergent beef and traditional beef production systems were 99.1, 70.5, 96.8, 74.3 and 72.9 kg CH4/head/year, respectively.
The resulting implied emission factors (IEF) (i.e., population-weighted average emission factors) for both dairy and other cattle in the various production systems are presented in Table 4a,b. The IEFs for dairy cattle in commercial and emergent production systems, 77.4 and 55.4 kg CH4/head/year, were generally higher than those for other cattle in commercial and emergent production systems, 69.8 and 51.9 kg CH4/head/year, respectively. The IEFs for dairy cattle in the commercial and emergent systems increased from 68.2 kg CH4/head/year to 86.7 kg CH4/head/year and from 55.2 kg CH4/head/year to 55.9 kg CH4/head/year from 1994 to 2022, respectively. For other cattle, the extensive traditional beef production system recorded a decrease in IEF from 65.0 kg CH4/head/year in 1994 to 63.4 kg CH4/head/year in 2022. However, the commercial beef cattle production system recorded an increase in IEF from 66.3 kg CH4/head/year in 1994 to 72.0 kg CH4/head/year in 2022.
3.4. Uncertainty
Monte Carlo simulation estimated total uncertainty for cattle populations at about ±16% in 2022 and ±19% in 1994. Regression coefficients indicated that the subcategory populations with the most significant influence on total population uncertainty were all in the extensive beef and commercial beef systems. The uncertainty of the implied emission factor (IEF) for 2022 was estimated at (+12.8%, −11.7%). The main factors driving uncertainty of the IEF for all cattle in 2022 are Ym, Cfi, digestibility and live weight for cows in the extensive beef system. Other influential variables were Ym, Cfi, and LW for extensive oxen, Ym for commercial beef cows and extensive system heifers, and Ca for the extensive system cows. Populations of calves, oxen, and heifers in the extensive system, as well as commercial beef cows, also influence the IEF.
Overall, the results of the uncertainty analysis indicate that to reduce the uncertainty of the Tier 2 cattle inventory, improved population subcategory estimates are needed in the extensive and commercial beef systems, along with better data on feed digestibility, live weights, and grazing distances in these systems.
Table 4.
(a) Enteric methane emission factors for dairy cattle subcategories in Zambia for the period 1994–2022 (kg CH4 head−1 year−1). (b) Enteric methane emission factors for other cattle subcategories in Zambia for the period 1994–2022 (kg CH4 head−1 year−1).
Table 4.
(a) Enteric methane emission factors for dairy cattle subcategories in Zambia for the period 1994–2022 (kg CH4 head−1 year−1). (b) Enteric methane emission factors for other cattle subcategories in Zambia for the period 1994–2022 (kg CH4 head−1 year−1).
| (a) | ||||||||||||||||||||
|---|---|---|---|---|---|---|---|---|---|---|---|---|---|---|---|---|---|---|---|---|
| Commercial Dairy System | Emergent Dairy System | |||||||||||||||||||
| Adult Cows | Adult Males | Heifers | Steers/Bulls | Calves | Implied Emission Factor | Adult Cows | Adult Males | Heifers | Steers/Bulls | Calves | Implied Emission Factor | |||||||||
| 1994 | 83.5 | 61.3 | 48.4 | 47.5 | 17.9 | 68.2 | 70.0 | 60.2 | 51.8 | 48.7 | 18.3 | 55.2 | ||||||||
| 1995 | 84.6 | 61.3 | 48.4 | 47.5 | 17.9 | 68.9 | 70.1 | 60.2 | 51.8 | 48.7 | 18.3 | 55.2 | ||||||||
| 1996 | 85.7 | 61.3 | 48.4 | 47.4 | 17.9 | 69.5 | 70.1 | 60.2 | 51.8 | 48.6 | 18.3 | 55.2 | ||||||||
| 1997 | 86.9 | 61.2 | 48.3 | 47.4 | 17.9 | 70.2 | 70.1 | 60.2 | 51.8 | 48.6 | 18.2 | 55.2 | ||||||||
| 1998 | 88.0 | 61.2 | 48.3 | 47.4 | 17.9 | 70.9 | 70.1 | 60.2 | 51.7 | 48.6 | 18.2 | 55.2 | ||||||||
| 1999 | 89.1 | 61.2 | 48.3 | 47.4 | 17.9 | 71.5 | 70.1 | 60.2 | 51.7 | 48.6 | 18.2 | 55.3 | ||||||||
| 2000 | 90.2 | 61.2 | 48.3 | 47.4 | 17.9 | 72.2 | 70.1 | 60.2 | 51.7 | 48.6 | 18.2 | 55.2 | ||||||||
| 2001 | 91.3 | 61.1 | 48.2 | 47.3 | 17.9 | 72.8 | 70.2 | 60.2 | 51.7 | 48.6 | 18.2 | 55.2 | ||||||||
| 2002 | 92.4 | 61.1 | 48.2 | 47.3 | 17.9 | 73.5 | 70.2 | 60.1 | 51.7 | 48.6 | 18.2 | 55.2 | ||||||||
| 2003 | 93.5 | 61.1 | 48.2 | 47.3 | 17.9 | 74.2 | 70.2 | 60.1 | 51.7 | 48.6 | 18.2 | 55.2 | ||||||||
| 2004 | 94.7 | 61.1 | 48.2 | 47.3 | 17.9 | 74.8 | 70.2 | 60.1 | 51.7 | 48.5 | 18.2 | 55.2 | ||||||||
| 2005 | 95.8 | 61.1 | 48.2 | 47.3 | 17.9 | 75.5 | 70.2 | 60.1 | 51.7 | 48.5 | 18.2 | 55.3 | ||||||||
| 2006 | 96.9 | 61.0 | 48.1 | 47.2 | 17.9 | 76.1 | 70.2 | 60.1 | 51.6 | 48.5 | 18.2 | 55.3 | ||||||||
| 2007 | 98.0 | 61.0 | 48.1 | 47.2 | 17.8 | 76.8 | 70.3 | 60.1 | 51.6 | 48.5 | 18.2 | 55.3 | ||||||||
| 2008 | 99.1 | 61.0 | 48.1 | 47.2 | 17.8 | 77.5 | 70.3 | 60.1 | 51.6 | 48.5 | 18.2 | 55.3 | ||||||||
| 2009 | 100.2 | 61.0 | 48.1 | 47.2 | 17.8 | 78.1 | 70.4 | 60.1 | 51.7 | 48.5 | 18.2 | 55.3 | ||||||||
| 2010 | 101.3 | 61.0 | 48.1 | 47.2 | 17.8 | 78.8 | 70.4 | 60.1 | 51.7 | 48.6 | 18.2 | 55.4 | ||||||||
| 2011 | 102.4 | 60.9 | 48.1 | 47.1 | 17.8 | 79.4 | 70.5 | 60.2 | 51.7 | 48.6 | 18.2 | 55.4 | ||||||||
| 2012 | 103.5 | 60.9 | 48.0 | 47.1 | 17.8 | 80.1 | 70.6 | 60.2 | 51.7 | 48.6 | 18.2 | 55.5 | ||||||||
| 2013 | 104.6 | 60.9 | 48.0 | 47.1 | 17.8 | 80.7 | 70.6 | 60.2 | 51.8 | 48.6 | 18.3 | 55.5 | ||||||||
| 2014 | 105.8 | 60.9 | 48.0 | 47.1 | 17.8 | 81.4 | 70.7 | 60.2 | 51.8 | 48.7 | 18.3 | 55.5 | ||||||||
| 2015 | 106.9 | 60.9 | 48.0 | 47.1 | 17.8 | 82.1 | 70.7 | 60.3 | 51.8 | 48.7 | 18.3 | 55.6 | ||||||||
| 2016 | 108.0 | 60.8 | 48.0 | 47.1 | 17.8 | 82.7 | 70.8 | 60.3 | 51.8 | 48.7 | 18.3 | 55.6 | ||||||||
| 2017 | 109.1 | 60.8 | 47.9 | 47.0 | 17.8 | 83.4 | 70.9 | 60.3 | 51.9 | 48.7 | 18.3 | 55.7 | ||||||||
| 2018 | 110.2 | 60.8 | 47.9 | 47.0 | 17.8 | 84.0 | 70.9 | 60.3 | 51.9 | 48.7 | 18.3 | 55.7 | ||||||||
| 2019 | 111.3 | 60.8 | 47.9 | 47.0 | 17.8 | 84.7 | 71.0 | 60.3 | 51.9 | 48.8 | 18.3 | 55.7 | ||||||||
| 2020 | 112.4 | 60.8 | 47.9 | 47.0 | 17.8 | 85.4 | 71.0 | 60.4 | 51.9 | 48.8 | 18.3 | 55.8 | ||||||||
| 2021 | 113.5 | 60.7 | 47.9 | 47.0 | 17.8 | 86.0 | 71.1 | 60.4 | 52.0 | 48.8 | 18.3 | 55.8 | ||||||||
| 2022 | 114.6 | 60.7 | 47.9 | 47.0 | 17.7 | 86.7 | 71.2 | 60.4 | 52.0 | 48.8 | 18.3 | 55.9 | ||||||||
| Mean | 99.1 + 9.1 | 61.0 + 0.2 | 48.1 + 0.2 | 47.2 + 0.1 | 17.8 + 0.1 | 77.4 + 5.4 | 70.5 + 0.4 | 60.2 + 0.1 | 51.8 + 0.1 | 48.6 + 0.1 | 18.3 + 0.0 | 55.4 + 0.2 | ||||||||
| (b) | ||||||||||||||||||||
| Commercial Beef | Emergent | Extensive/Traditional Beef | ||||||||||||||||||
| Adult cows | Adult males | Heifers | Steers/bulls | Calves | Feedlot | Implied emission factor | Adult cows | Adult males | Heifers | Steers/bulls | Calves | Implied emission factor | Adult cows | Adult males | Oxen | Heifers | Steers/bulls | Calves | Implied emission factor | |
| 1994 | 92.4 | 67.5 | 44.9 | 49.3 | 46.0 | 40.9 | 66.3 | 77.5 | 68.3 | 36.4 | 38.5 | 18.5 | 54.1 | 73.5 | 72.7 | 87.1 | 49.6 | 52.7 | 24.4 | 65.0 |
| 1995 | 92.7 | 67.8 | 45.1 | 49.6 | 46.3 | 41.1 | 66.6 | 77.1 | 68.0 | 36.2 | 38.3 | 18.4 | 53.9 | 73.5 | 72.7 | 87.1 | 49.6 | 52.7 | 24.4 | 65.0 |
| 1996 | 93.1 | 68.1 | 45.3 | 49.8 | 46.6 | 41.4 | 66.9 | 76.8 | 67.7 | 36.0 | 38.1 | 18.3 | 53.6 | 73.5 | 72.7 | 87.1 | 49.6 | 52.7 | 24.4 | 65.0 |
| 1997 | 93.5 | 68.4 | 45.5 | 50.0 | 46.9 | 41.6 | 67.2 | 76.5 | 67.4 | 35.8 | 38.0 | 18.2 | 53.4 | 73.5 | 72.7 | 87.1 | 49.6 | 52.7 | 24.4 | 65.0 |
| 1998 | 93.9 | 68.7 | 45.7 | 50.3 | 47.1 | 41.8 | 67.5 | 76.2 | 67.2 | 35.7 | 37.8 | 18.1 | 53. | 73.5 | 72.7 | 87.1 | 49.6 | 52.7 | 24.4 | 65.0 |
| 1999 | 94.3 | 69.0 | 46.0 | 50.5 | 47.4 | 42.1 | 67.8 | 75.8 | 66.9 | 35.5 | 37.6 | 18.0 | 52.9 | 73.5 | 72.7 | 87.1 | 49.6 | 52.7 | 24.4 | 65.0 |
| 2000 | 94.7 | 69.3 | 46.2 | 50.8 | 47.7 | 42.3 | 68.2 | 75.5 | 66.6 | 35.3 | 37.4 | 17.9 | 56.7 | 73.5 | 72.7 | 87.1 | 49.6 | 52.7 | 24.4 | 65.0 |
| 2001 | 95.2 | 69.6 | 46.4 | 51.0 | 48.0 | 42.6 | 68.5 | 75.2 | 66.3 | 35.1 | 37.2 | 17.8 | 52.4 | 73.5 | 72.7 | 87.1 | 49.6 | 52.7 | 24.4 | 65.0 |
| 2002 | 95.6 | 69.9 | 46.6 | 51.3 | 48.3 | 42.8 | 68.8 | 74.9 | 66.1 | 35.0 | 37.0 | 17.8 | 52.2 | 73.5 | 72.7 | 87.1 | 49.6 | 52.7 | 24.4 | 65.0 |
| 2003 | 96.0 | 70.2 | 46.9 | 51.5 | 48.6 | 43.0 | 69.1 | 74.6 | 65.8 | 34.8 | 36.9 | 17.7 | 51.9 | 73.5 | 72.7 | 87.1 | 49.6 | 52.7 | 24.4 | 65.0 |
| 2004 | 96.4 | 70.5 | 47.1 | 51.8 | 48.9 | 43.3 | 69.5 | 74.3 | 65.5 | 34.6 | 36.7 | 17.6 | 51.8 | 73.5 | 72.7 | 87.1 | 49.6 | 52.7 | 24.4 | 65.0 |
| 2005 | 96.8 | 70.8 | 47.3 | 52.0 | 49.2 | 43.5 | 69.8 | 74.0 | 65.3 | 34.5 | 36.5 | 17.5 | 51.6 | 73.5 | 72.7 | 87.1 | 49.6 | 52.7 | 24.4 | 65.0 |
| 2006 | 97.3 | 71.1 | 47.6 | 52.3 | 49.5 | 43.8 | 70.1 | 73.7 | 65.0 | 34.3 | 36.4 | 17.4 | 51.3 | 73.5 | 72.7 | 87.1 | 49.6 | 52.7 | 24.4 | 65.0 |
| 2007 | 97.3 | 71.1 | 47.6 | 52.3 | 49.5 | 43.9 | 70.2 | 73.7 | 65.0 | 34.3 | 36.4 | 17.4 | 51.3 | 73.5 | 72.7 | 87.1 | 49.6 | 52.7 | 24.4 | 65.0 |
| 2008 | 97.4 | 71.2 | 47.6 | 52.4 | 49.6 | 44.0 | 70.3 | 73.7 | 65.0 | 34.3 | 36.3 | 17.4 | 51.3 | 73.3 | 72.6 | 86.9 | 49.4 | 52.6 | 24.3 | 65.0 |
| 2009 | 97.6 | 71.3 | 47.7 | 52.5 | 49.7 | 44.2 | 70.4 | 73.6 | 64.9 | 34.3 | 36.3 | 17.4 | 51.3 | 73.2 | 72.5 | 86.7 | 49.3 | 52.5 | 24.3 | 64.9 |
| 2010 | 97.8 | 71.5 | 47.8 | 52.6 | 49.9 | 44.4 | 70.6 | 73.6 | 64.9 | 34.3 | 36.3 | 17.4 | 51.2 | 73.0 | 72.3 | 86.6 | 49.2 | 52.4 | 24.2 | 64.8 |
| 2011 | 97.9 | 71.6 | 47.9 | 52.7 | 50.0 | 44.5 | 70.7 | 73.5 | 64.8 | 34.2 | 36.2 | 17.4 | 51.2 | 72.9 | 72.2 | 86.4 | 49.1 | 52.3 | 24.2 | 64.5 |
| 2012 | 98.1 | 71.7 | 48.0 | 52.8 | 50.1 | 44.7 | 70.9 | 73.5 | 64.8 | 34.2 | 36.2 | 17.4 | 51.2 | 72.8 | 72.1 | 86.3 | 49.0 | 52.1 | 24.1 | 64.4 |
| 2013 | 98.2 | 71.8 | 48.1 | 52.9 | 50.2 | 44.8 | 71.0 | 73.4 | 64.8 | 34.2 | 36.2 | 17.3 | 51.1 | 72.6 | 71.9 | 86.1 | 48.9 | 52.0 | 24.1 | 64.3 |
| 2014 | 98.4 | 71.9 | 48.2 | 53.0 | 50.3 | 45.0 | 71.1 | 73.4 | 64.7 | 34.2 | 36.2 | 17.3 | 51.1 | 72.5 | 71.8 | 85.9 | 48.8 | 51.9 | 24.0 | 64.2 |
| 2015 | 98.6 | 72.1 | 48.3 | 53.1 | 50.5 | 45.2 | 71.3 | 73.3 | 64.7 | 34.1 | 36.1 | 17.3 | 51.1 | 72.4 | 71.7 | 85.8 | 48.7 | 51.8 | 24.0 | 64.1 |
| 2016 | 98.7 | 72.2 | 48.4 | 53.2 | 50.6 | 45.3 | 71.4 | 73.3 | 64.6 | 34.1 | 36.1 | 17.3 | 51.0 | 72.2 | 71.5 | 85.6 | 48.6 | 51.7 | 23.9 | 63.9 |
| 2017 | 98.9 | 72.3 | 48.4 | 53.3 | 50.7 | 45.5 | 71.6 | 73.2 | 64.6 | 34.1 | 36.1 | 17.3 | 50.9 | 72.1 | 71.4 | 85.5 | 48.5 | 51.6 | 23.9 | 63.8 |
| 2018 | 99.1 | 72.4 | 48.5 | 53.4 | 50.8 | 45.7 | 71.7 | 73.2 | 64.5 | 34.1 | 36.1 | 17.3 | 50.9 | 72.0 | 71.3 | 85.3 | 48.4 | 51.5 | 23.8 | 63.7 |
| 2019 | 99.2 | 72.6 | 48.6 | 53.5 | 51.0 | 45.8 | 71.8 | 73.1 | 64.5 | 34.0 | 36.0 | 17.3 | 50.9 | 71.9 | 71.2 | 85.2 | 48.3 | 51.3 | 23.7 | 63.6 |
| 2020 | 99.4 | 72.7 | 48.7 | 53.6 | 51.1 | 46.0 | 72.0 | 73.1 | 64.5 | 34.0 | 36.0 | 17.2 | 50.9 | 71.7 | 71.0 | 85.0 | 48.2 | 51.2 | 23.7 | 63.4 |
| 2021 | 99.4 | 72.7 | 48.7 | 53.6 | 51.1 | 46.1 | 72.0 | 73.1 | 64.5 | 34.0 | 36.0 | 17.2 | 50.9 | 71.7 | 71.0 | 85.0 | 48.2 | 51.2 | 23.7 | 63.4 |
| 2022 | 99.4 | 72.7 | 48.7 | 53.6 | 51.1 | 46.2 | 72.0 | 73.1 | 64.5 | 34.0 | 36.0 | 17.2 | 50.9 | 71.7 | 71.0 | 85.0 | 48.2 | 51.2 | 23.7 | 63.4 |
| Mean | 96.8 + 2.2 | 70.8 + 1.6 | 47.3 + 1.2 | 52.0 + 1.3 | 49.2 + 1.6 | 43.8 + 1.6 | 69.8 + 1.8 | 74.3 + 1.4 | 65.6 + 1.2 | 34.7 + 0.7 | 36.7 + 0.8 | 17.6 + 0.4 | 51.9 + 1.3 | 72.9 + 0.7 | 72.2 + 0.6 | 86.4 + 0.8 | 49.1 + 0.5 | 52.2 + 0.6 | 24.2 + 0.3 | 64.5 + 0.6 |
4. Discussion
This study is the first to obtain national-level estimates of enteric methane emissions in Zambia using the IPCC Tier 2 method. This effort represents a significant improvement in the accuracy of EntCH4 emission estimates from Zambia’s cattle sector for the period 1994 to 2022. The approach highlights the inherent relationships between cattle population dynamics, production systems, and methane emissions, revealing significant implications for climate action and livestock management in Zambia.
The traditional beef production system had the largest cattle population and therefore made the largest contribution to the annual enteric methane emissions between 1994 and 2022, accounting for 73% to 75% of the annual total enteric methane emissions. The commercial dairy production system had the lowest cattle population and thus contributed least to the annual enteric methane emissions, accounting for 2.3% to 2.5% of the annual total for the same period. While population-weighted average emission factors in the dairy production systems increased over the period studied, the IEF in the production system with the largest population decreased. The main driver of the increase in total cattle enteric methane emissions in Zambia from 1994 to 2022 was the increasing cattle population, particularly within the traditional beef production system. This finding aligns with the report by [42], which suggests that most of the increase in cattle GHG emissions in sub-Saharan Africa is due to rising livestock populations. The high cattle population in the traditional beef production system is also linked to the reluctance of smallholder farmers who are averse to sell their cattle for economic gain or profit owing to the multifunctional role of cattle in socio-cultural contexts, as noted by [5,43].
It is important to note that although there have been interventions to increase milk yield and feed digestibility during the study period, the effects on average production parameters in each production system (mainly emergent dairy and beef systems) and the small proportion of total cattle populations in these systems mean that these changes have not had a significant impact on total cattle GHG emissions at the national scale. This contrasts with some reports from Ethiopia [44], South Africa [45,46], Kenya [47] which show that individual animal productivity (e.g., milk yield, LW, weight gain and calving rate) has significantly increased and emission intensity has decreased in recent decades.
The present study revealed significant variations in the EntCH4 emission factor over the study period, driven by factors such as increasing cattle population growth, evolving production systems, and changes in feed availability and quality. The traditional beef production system, which dominates cattle production in Zambia, is characterized by low productivity and reliance on poor-quality feed. These factors contribute to higher methane emission factors, as the low digestibility of the feed increases the proportion of energy lost as methane during rumen fermentation. In contrast, commercial systems, though fewer in number, demonstrate the potential to reduce emissions intensity through improved management practices and better feed quality, resulting in higher productivity.
The total annual enteric methane emission reported in this study using the Tier 2 approach was generally found to be twice the methane emissions obtained using the Tier 1 approach, as reported by [48] in the first Biennial Update Reports (BUR). The average total annual methane emissions reported in the BUR for the period 1994–2016 using Tier 1 was 89.9 Gg CH4/year (range 51.4–143.6). However, in this study, the average total annual methane emission obtained for the same period was 187.2 Gg CH4/year (range 140.7–262.2). This aligns with the findings of [49,50] who compared the IPCC Tier 1 and Tier 2 methodologies in smallholder cattle systems in Ethiopia. Ref. [49] reported that the IPCC Tier 2 methodology estimated a 39% higher gross energy intake and a 51% higher implied emission factor compared to a modified Tier 2 methodology based on the Commonwealth Scientific and Industrial Research Organization (CSIRO) approach. These discrepancies highlight the importance of selecting appropriate models tailored to local conditions. This variability underscores the need to capture system-specific data, as generalized continental emission factors used in the Tier 1 method do not fail to account for these dynamics [9]. By integrating detailed data on feed characteristics, animal performance, and management practices, the Tier 2 method provided a more comprehensive understanding of Zambia’s livestock emissions profile, enabling targeted mitigation strategies that are tailored to specific production systems [51].
The implied emission factor for dairy cattle increased over time, partly due to the observed rise in milk yield in 2009 and again in 2017. The average implied emissions factor obtained for dairy cattle in commercial and emergent production systems (77.4 and 55.4 kg CH4/head/year, respectively), are higher than the 2006 IPCC Tier 1 value of 46 kg CH4 head/year for dairy cattle in Africa and the Middle East. Similarly, the emission factor found for dairy cows in this study was higher (99.1 kg CH4/head/year) than the 2019 IPCC default emission factor for dairy cows in low productivity systems (66 kg CH4/head/year) and for dairy cows in high productivity systems (86 kg CH4/head/year) in Africa. Refs. [47,52] also reported higher Tier 2 emission factors for dairy cattle in South Africa (76 kg CH4/head/year) and Kenya (70 kg CH4/head/year), respectively, than the 2006 IPCC default emission factors for Africa.
The equations in the 2006 IPCC guidelines for determining emission factor values are, by design, largely dependent on the values assumed for LW, feed energy digestibility, milk yield, and Ym. The LW differs between breeds, sex and age, while feed energy digestibility is affected by feed characteristics, feeding (and grazing) practices, and feed basket quality. The LW, feed digestible energy, and milk yield of dairy cows in Zambia and Ethiopia were higher than the values assumed for dairy cattle in Africa [12]. Therefore, using 2006 and 2019 IPCC default emission factor values for dairy cattle would underestimate enteric CH4 emissions when compared with emission factors developed using country-specific information. These contrasting results highlight the need to develop country-specific emission factors that reflect the different cattle production systems and performance levels in these systems.
Despite its advantages, the Tier 2 methodology depends on the availability of high-quality, country-specific data. In Zambia, gaps in data on feed composition, seasonal variability in feed resources, and production parameters remain significant challenges. Addressing these gaps will require systematic data collection, research collaborations, and investments in livestock research infrastructure [53]. Accurate and detailed GHG inventory data are essential for Zambia to meet its commitments under the Paris Agreement and its Nationally Determined Contributions (NDCs). The Tier 2 method enhances the credibility of Zambia’s GHG inventories, providing a solid foundation for setting realistic mitigation targets. Future research should build on this work by integrating field-based measurements of feed characteristics and methane emissions, particularly under varying agroecological conditions. Scenario modelling could also explore the potential impacts of different mitigation strategies on emissions, productivity, and livelihoods. Engaging stakeholders across the livestock value chain, from smallholder farmers to policymakers, will be crucial for ensuring that research findings translate into actionable policies and programmes.
One of the distinguishing requirements of the IPCC Tier 2 method is the high demand for disaggregated animal population and livestock activity data, including production performance, feed characteristics, and feed diet quality. Uncertainty analysis is a statistical tool that provides critical information for prioritizing methodological and data improvement plans [13]. The uncertainty analysis of the years 1994 and 2022 activity data for enteric fermentation emissions was estimated at −15.9% and −19.7%, respectively. The uncertainty of emission factors aligns with the 2006 IPCC default uncertainty range for Tier 2 emission factors of ±20%. The extensive beef system was identified as the most significant contributor to the uncertainty of enteric fermentation emissions. Factors responsible for the uncertainty in enteric emissions include Ym, Cfi, feed digestibility, live weight for cows, and the population size. It should also be noted that this study used average values for activity data reported in a few years and from different locations in the country, supplemented by expert judgement. These data sources may have affected the estimated uncertainty, which should be re-analyzed when data becomes available. In particular, expert judgement was the main source of data for diet composition, a key input to the estimates of diet digestibility. Improving data quality for these key activity data is critical to reducing the uncertainty of inventory estimates.
Uncertainty analysis in this study highlighted that investments in data improvement should target animal subcategory populations and key input parameters used to estimate the enteric emission factors. The results of this analysis, therefore, support more cost-effective use of limited research resources by identifying the systems, subcategories and parameters for which better data should be prioritized.
5. Conclusions
This study used the IPCC Tier 2 method to estimate enteric fermentation emissions from cattle in Zambia. The cattle population and enteric methane emissions have steadily increased from 1994 to 2022. The main driver of the increase in enteric methane emissions is the beef cattle population under the extensive traditional production system, as there were no quantifiable data on improved cattle productivity. The dairy cattle population has largely remained at about 10% of the total cattle population. Since dairy cattle production systems exhibited higher emission factors than the other cattle, this suggests that changes in the structure of the sector could affect the level and intensity of GHG emissions from cattle production in the future.
This study provides a foundation for improving GHG inventory accuracy in Zambia’s livestock sector and highlights the need for targeted mitigation strategies. By transitioning to the Tier 2 method, Zambia can better align its climate action plans with its unique agricultural systems, ensuring that policies are both practical and equitable. This improved inventory is expected to strengthen Zambia’s ability to measure, report and verify emissions and emission reductions from the livestock sector.
The use of country-specific activity data to estimate enteric methane emissions using the IPCC Tier 2 method showed higher emissions than the IPCC default values for Africa. This further supports arguments for using country-specific livestock activity data to derive more accurate emission factors. The uncertainty analysis indicated that overall uncertainty could be reduced with more accurate livestock activity data for all the production systems. The ongoing national efforts to collect primary data on body weights, feed characteristics, and diet baskets are expected to improve the emission factors.
Supplementary Materials
The following supporting information can be downloaded at: https://www.mdpi.com/article/10.3390/methane4040030/s1, Table S1a: Assumed commercial and emergent dairy cattle herd structures (proportion); Table S1b: Assumed Commercial, emergent, and extensive/traditional other cattle herd structures (proportion); Table S2a: Time series for dairy cattle subcategory populations in Zambia 1994–2022 (head); Table S2b: Time series for other cattle subcategory populations in Zambia 1994–2022 (head); Table S3: Average live weight and growth rate of cattle for the different subcategories under each cattle production; Table S4: Average milk yields for lactating cows in each production system in Zambia. 1994–2022 (kg head−1 day−1); Table S5: Feed basket (diet composition) for dairy cattle and other cattle by production system; Table S6: Margins of error and PDFs used for Ym, and other coefficients in uncertainty analysis (%);Table S7: Margins of error for cattle subcategory population estimates used in uncertainty analysis (%)
Author Contributions
All the authors were involved in the concept for the paper, while I.K.O. and C.M. equally contributed to data generation, and analysis with guidance from S.W., C.A.B. and A.W.; I.K.O. and C.M. led the preparation of the manuscript. All authors have read and agreed to the published version of the manuscript.
Funding
Funding for the study was provided by the New Zealand Climate Smart Agriculture Initiative through the New Zealand Agricultural Greenhouse Gas Research Centre (C1144/24085/2023), financed by New Zealand’s Ministry of Foreign Affairs and Trade (MFAT) and Ministry of Primary Industries (MPI).
Data Availability Statement
The data that support the findings of this study are contained within the article, Supplementary Material and as provided in the minimum dataset file. Further inquiries can be directed to the corresponding author.
Acknowledgments
This study was funded by the New Zealand Climate Smart Agriculture Initiative to support the objectives of the Global Alliance on Agricultural Greenhouse Gases. The support provided by the Zambia Environmental and Management Agency during the process is equally applauded being the implementing national agency responsible for GHG inventory compilation. We also acknowledge support from the UNIQUE Land Use GmbH, Ministry of Fisheries and Livestock, PRIME Consultants International, the inventory advisory group and the various experts who took part in the expert judgement panel.
Conflicts of Interest
The authors declare that there was no conflict of interest. The author has no relevant financial or non-financial interests to disclose.
References
- SADC. Macroeconomic Statistics Bulletin; Southern African Development Community (SADC) Secretariat: Gaborone, Botswana, 2020; 77p. [Google Scholar]
- FAOSTAT. Statistical Database 2022. Available online: https://www.fao.org/faostat/en/#data/QCL (accessed on 1 June 2022).
- Herrero, M.; Havlik, P.; McIntire, J.; Palazzo, A.; Valin, H. African Livestock Futures: Realizing the Potential of Livestock for Food Security, Poverty Reduction and the Environment in Sub-Saharan Africa; Office of the Special Representative of the UN Secretary General for Food Security and Nutrition; The United Nations System Influenza Coordination (UNSIC): Geneva, Switzerland, 2008; 118p, Available online: https://pure.iiasa.ac.at/id/eprint/11154/2/LiveStock_ExSum_ENG_20140725_02_web.pdf (accessed on 23 August 2023).
- Enahoro, D.; Mason-D’Croz, D.; Mul, M.; Rich, K.M.; Robinson, T.P.; Thornton, P.; Staal, S.S. Supporting sustainable expansion of livestock production in South Asia and Sub-Saharan Africa: Scenario analysis of investment options. Glob. Food Secur. 2019, 20, 114–121. [Google Scholar] [CrossRef]
- Odubote, I.K. Characterization of production systems and management practices of the cattle population in Zambia. Trop. Anim. Health Prod. 2022, 54, 216. [Google Scholar] [CrossRef]
- DLD. 2024 Annual Report; Department of Livestock Department, Ministry of Fisheries and Livestock: Lusaka, Zambia, 2024; 45p. [Google Scholar]
- Mumba, C.; Hasler, B.; Muma, J.B.; Munyeme, M.; Sitali, D.C.; Skjerve, E.; Rich, M.K. Practices of traditional beef farmers in their production and marketing of cattle in Zambia. Trop. Anim. Health Prod. 2018, 50, 49–62. [Google Scholar] [CrossRef]
- GRZ. Zambia. Third National Communication to the United Nations Framework Convention on Climate Change (UNFCCC). 2020. Available online: https://unfccc.int/documents/254196 (accessed on 20 August 2023).
- Graham, M.W.; Butterbach-Bahl, K.; du Toit, C.J.L.; Korir, D.; Leitner, S.; Merbold, L.; Mwape, A.; Ndung’u, P.W.; Pelster, D.E.; Rufino, M.C.; et al. Research Progress on Greenhouse Gas Emissions From Livestock in Sub-Saharan Africa Falls Short of National Inventory Ambitions. Front. Soil Sci. 2022, 2, 927452. [Google Scholar] [CrossRef]
- Ministry of Green Economy and Environment. NDC Implementation Framework for Zambia 2023-2030; Ministry of Green Economy and Environment Office: Lusaka, Zambia, 2023. [Google Scholar]
- Wilkes, A.; Wassie, S.E.; Tadesse, M.; Assefa, B.; Abu, M.; Ketema, A.; Solomon, D. Inventory of Greenhouse Gas Emissions from Cattle, Sheep, and Goats in Ethiopia (1994–2018) Calculated Using the IPCC Tier 2 Approach; Environment and Climate Change Directorate of the Ministry of Agriculture: Addis Ababa, Ethiopia, 2020. [Google Scholar]
- IPCC. 2006 IPCC Guidelines for National Greenhouse Gas Inventories; Prepared by the National Greenhouse Gas Inventories Programme; Eggleston, H.S., Buendia, L., Miwa, K., Ngara, T., Tanabe, K., Eds.; IGES: Hayama, Japan, 2006. [Google Scholar]
- IPCC. 2019 Refinement to the 2006 IPCC Guidelines for National Greenhouse Gas Inventories; Calvo Buendia, E., Tanabe, K., Kranjc, A., Baasansuren, J., Fukuda, M., Ngarize, S., Osako, A., Pyrozhenko, Y., Shermanau, P., Federici, S., Eds.; IPCC: Geneva, Switzerland, 2019. [Google Scholar]
- OIE. Terrestrial Animal Health Code-Chapter 7.11-Animal Welfare and Dairy Cattle Production Systems. 2021. Available online: https://www.woah.org/fileadmin/Home/eng/Health_standards/tahc/current/en/chapitre_aw_dairy_cattle.pdf (accessed on 15 July 2023).
- Sinkala, Y.; Simuunza, M.; Pfeiffer, D.U.; Munang’andu, H.M.; Mulumba, M.; Kasanga, C.J.; Muma, J.B.; Mweene, A.S. Challenges and Economic Implications in the Control of Foot and Mouth Disease in Sub-Saharan Africa: Lessons from the Zambian Experience. Vet. Med. Int. 2014, 2014, 373921. [Google Scholar] [CrossRef]
- Ouatahar, L.; Bannink, A.; Lanigan, G.; Amon, B. Modelling the effect of feeding management on greenhouse gas and nitrogen emissions in cattle farming systems. Sci. Total Environ. 2021, 776, 145932. [Google Scholar] [CrossRef]
- Pica-Ciamarra, U.; Baker, D.; Morgan, N.; Zezza, A.; Azzarri, C.; Ly, C.; Nsiima, L.; Nouala, S.; Okello, P.; Sserugga, J. Investing in the Livestock Sector: Why Good Numbers Matter; A Sourcebook for Decision Makers on How to Improve Livestock Data; World Bank: Washington, DC, USA, 2014; 144p, Available online: https://openknowledge.worldbank.org/handle/0986/17830 (accessed on 1 December 2016).
- Neven, D.; Katjiuongua, H.; Adjosoediro, I.; Reardon, T.; Chuzu, P.N.; Tembo, G.; Ndiyoi, M. Food Sector Transformation and Standards in Zambia: Smallholder Farmer Participation and Growth in the Dairy Sector; Staff Papers 2006-18; Michigan State University: East Lansing, MI, USA, 2006. [Google Scholar] [CrossRef]
- World Bank. What Would it Take for Zambia’s Beef and Dairy Industries to Achieve Their Potential? Finance and Private Sector Development Unit, Africa Region. 2011. Available online: https://openknowledge.worldbank.org/server/api/core/bitstreams/63ef02b0-bea4-54ed-935e-9f46ccaaa821/content (accessed on 23 April 2022).
- Dutilly, C.; Alary, V.; Bonnet, P.; Lesnoff, M.; Fandamu, P.; de Haan, C. Multi-scale assessment of the livestock sector for policy design in Zambia. J. Policy Model. 2020, 42, 401–418. [Google Scholar] [CrossRef]
- ACF. Final Report on the Dairy Value Chain Study in Zambia; Agricultural Consultative Forum: Lusaka, Zambia, 2012; 123p. [Google Scholar]
- SNV Netherlands Development Organisation. Assessment of Opportunities for Improving Dairy Production, Marketing, and Adoption of Good Animal Husbandry Practices Within Traditional Cattle Keeping Areas of Zambia; SNV Netherlands Development Organisation: The Hague, The Netherlands, 2012. [Google Scholar]
- Kawambwa, P.; Hendriksen, G.; Zandonda, E.; Wanga, L. Business Viability Assessment Study of Smallholder Dairy Farming in Zambia; Wageningen Environmental Research (Alterra), Wageningen University: Wageningen, The Netherlands, 2014; 52p. [Google Scholar]
- ZEMA. Zambia—First Biennial Update Report (BUR) to the United Nations Framework Convention on Climate Change; ZEMA: Lusaka, Zambia, 2020. [Google Scholar]
- SAIPAR. Affordability of Protein-Rich Foods: Evidence from Zambia. 2019. Available online: https://assets.cdcgroup.com/wp-content/uploads/2018/12/14110951/Affordability-of-Protein-Rich-Foods-Evidence-from-Zambia.pdf (accessed on 25 April 2023).
- Mumba, C.M. Livestock Greenhouse Gas Inventory Activity Data for Zambia; Consultancy report submitted to FANRPAN; FANRPAN: Pretoria, South Africa, 2020. [Google Scholar]
- SIDA. Project Review of the Dairy Association of Zambia’s Digital Information Management System (DIMS) Project; SIDA: Lusaka, Zambia; Sundbyberg, Sweden, 2020. [Google Scholar]
- Zambeef. Kalundu Dairy Farm: Zambia’s Biggest Dairy. 2022. Available online: https://www.farmersweekly.co.za/animals/kalundu-dairy-farm-zambias-biggest-dairy/ (accessed on 24 August 2023).
- Hofer, A. Small Scale Dairy Farming in Zambia. 2015. Available online: https://stud.epsilon.slu.se/8066/7/hofer_a_150617.pdf (accessed on 23 August 2023).
- Ledgard, S.; Falconer, S.; Carlson, B.; Wedderburn, L.; Howley, C. Review of Greenhouse Gas Profiles for Six MFAT Agricultural Aid Projects; Report for the Ministry of Foreign Affairs and Trade of New Zealand; RE450/2018/074; Ministry of Foreign Affairs and Trade of New Zealand: Wellington, New Zealand, 2018. [Google Scholar]
- GIZ. Milk Yield Dataset; GIZ: Lusaka, Zambia, 2021; Unpublished Work. [Google Scholar]
- ZNS. Milk Yield Dataset; ZNS: Lusaka, Zambia, 2022; Unpublished Work. [Google Scholar]
- Odubote, I.K.; Musimuko, E.; Rensing, S.; Schmitt, F.; Kapotwe, B. Genetic survey in the smallholder dairy production system of Southern province of Zambia. J. Anim. Breed. Genet. 2023, 140, 235–252. [Google Scholar] [CrossRef] [PubMed]
- ZDTP. Practical Farm Advice F06A- Feeding Calendar for Smallholder Dairy Cows in Zambia; Zambia Dairy Transformation Programme: Lusaka, Zambia, 2020. [Google Scholar]
- GIZ. Milk Yield and Body Weight Dataset; GIZ: Lusaka, Zambia, 2022; Unpublished Work. [Google Scholar]
- Baars, R.M.T.; de Jong, R.; Zwart, D. Costs and returns of the crop-cattle system in the Western Province of Zambia. Revue Élev. Méd. Vét. Pays Trop. 1996, 49, 243–251. [Google Scholar]
- CSIRO. Nutrient Requirements of Domesticated Ruminants; CSIRO Publishing: Collingwood, VIC, Australia, 2007. [Google Scholar]
- Milne, A.E.; Glendining, M.J.; Bellamy, P.; Misselbrook, T.; Gilhespy, S.; Gasado, M.R.; Hulin, A.; van Oijen, M.; Whitmore, A.P. Analysis of uncertainties in the estimates of nitrous oxide and methane emissions in UK’s greenhouse gas inventory for agriculture. Atmos. Environ. 2014, 82, 94–105. [Google Scholar] [CrossRef][Green Version]
- Ministry of Fisheries and Livestock Zambia; Zambia Statistics Agency. The 2022 Livestock Survey Report; Ministry of Fisheries and Livestock: Lusaka, Zambia; Zambia Statistics Agency: Lusaka, Zambia, 2022; 132p. [Google Scholar]
- Monni, S.; Perälä, P.; Regina, K. Uncertainty in Agricultural CH4 and N2O Emissions from Finland—Possibilities to Increase Accuracy in Emission Estimates. Mitig. Adapt. Strateg. Glob. Change 2007, 12, 545–571. [Google Scholar] [CrossRef]
- Karimi-Zindashty, Y.; Macdonald, J.D.; Desjardins, R.L.; Worth, D.E.; Hutchinson, J.J.; Vergé, X.P.C. Sources of uncertainty in the IPCC Tier 2 Canadian livestock model. J. Agric. Sci. 2012, 150, 556–569. [Google Scholar] [CrossRef]
- Chang, J.; Peng, S.; Yin, Y.; Ciais, P.; Havlik, P.; Herrero, M. The key role of production efficiency changes in livestock methane emission mitigation. AGU Adv. 2021, 2, e2021AV000391. [Google Scholar] [CrossRef]
- Descheemaeker, K.; Oosting, S.J.; Tui, S.H.K.; Masikati, P.; Falconnier, G.N.; Giller, K.E. Climate change adaptation and mitigation in smallholder crop–livestock systems in sub-Saharan Africa: A call for integrated impact assessments. Reg. Environ. Change 2016, 16, 2331–2343. [Google Scholar] [CrossRef]
- Wassie, S.E.; Wilkes, A.; Tadesse, M.; Assefa, B.; Abu, M.; Solomon, D. Enteric methane emission estimates for cattle in Ethiopia from 1994 to 2018. S. Afr. J. Anim. Sci. 2022, 52, 346–365. [Google Scholar]
- Caro, D.; Davis, S.J.; Bastianoni, S.; Caldeira, K. Global and regional trends in greenhouse gas emissions from livestock. Clim. Change 2014, 126, 203–216. [Google Scholar] [CrossRef]
- Tongwane, M.I.; Moeletsi, M.E. Provincial cattle carbon emissions from enteric fermentation and manure management in South Africa. Environ. Res. 2021, 195, 110833. [Google Scholar] [CrossRef]
- SDL. Inventory of GHG Emissions from Dairy Cattle in Kenya 1995–2017. Nairobi, Kenya, 2020. Available online: https://globalresearchalliance.org/wp-content/uploads/2021/11/Kenya-Dairy-Cattle-GHG-Inventory-Report_2020.pdf (accessed on 4 September 2023).
- ZEMA. Zambia—Third National Communication (TNC) to the United Nations Framework Convention on Climate Change; ZEMA: Lusaka, Zambia, 2020. [Google Scholar]
- Gurmu, E.B.; Ndung’U, P.W.; Wilkes, A.; Getahun, D.; Graham, M.W.; Leitner, S.M.; Marquardt, S.; Mulat, D.G.; Merbold, L.; Worku, T.; et al. Comparison of Tier 1 and 2 methodologies for estimating intake and enteric methane emission factors from smallholder cattle systems in Africa: A case study from Ethiopia. Anim.-Open Space 2024, 3, 100064. [Google Scholar] [CrossRef]
- Gurmu, E.B.; Wilkes, A.; Poole, J.; Marquardt, S.; Ndun’gu, P.; Onyango, A.A.; Merbold, L.; Kori, D.; del Prado, A.; Pardo, G.; et al. Protocol for a Tier 2 Approach to Generate Context-Specific Enteric Methane Emission Factors (Ef) for Cattle Production Systems Using Ipcc Method; 2024 Manual 77; International Livestock Research Institute (ILRI): Nairobi, Kenya, 2024. [Google Scholar]
- Bateki, C.A.; Wilkes, A.; Schlecht, E. Accuracy of enteric methane emission models for cattle in sub-Saharan Africa: Status quo and the way forward. J. Anim. Sci. 2023, 101, skad397. [Google Scholar] [CrossRef]
- Du Toit, C.J.L.; Meissner, H.H.; Van Niekerk, W.A. Direct methane and nitrous oxide emissions of South African dairy and beef cattle. S. Afr. J. Anim. Sci. 2013, 43, 320–339. [Google Scholar] [CrossRef]
- Odubote, I.K. Establishment of National Livestock Databank for Genetic Improvement Programmes in Zambia. Bull. Anim. Health Prod. 2019, 67, 161–168. [Google Scholar]

Disclaimer/Publisher’s Note: The statements, opinions and data contained in all publications are solely those of the individual author(s) and contributor(s) and not of MDPI and/or the editor(s). MDPI and/or the editor(s) disclaim responsibility for any injury to people or property resulting from any ideas, methods, instructions or products referred to in the content. |
© 2025 by the authors. Licensee MDPI, Basel, Switzerland. This article is an open access article distributed under the terms and conditions of the Creative Commons Attribution (CC BY) license (https://creativecommons.org/licenses/by/4.0/).