1. Introduction
The analysis of the ink of common writing instruments is one of the most relevant areas of modern criminalistics in document fraud since the specific characteristics of inks can answer identification, comparison, and/or dating questions in requested forensic examinations [
1,
2,
3]. This work aims to contribute to the discrimination of blue and green inks from common writing instruments through a non-destructive technique in which the full analysis of Raman spectra is exploited with Knime software in order to build a predictive model.
2. Materials and Methods
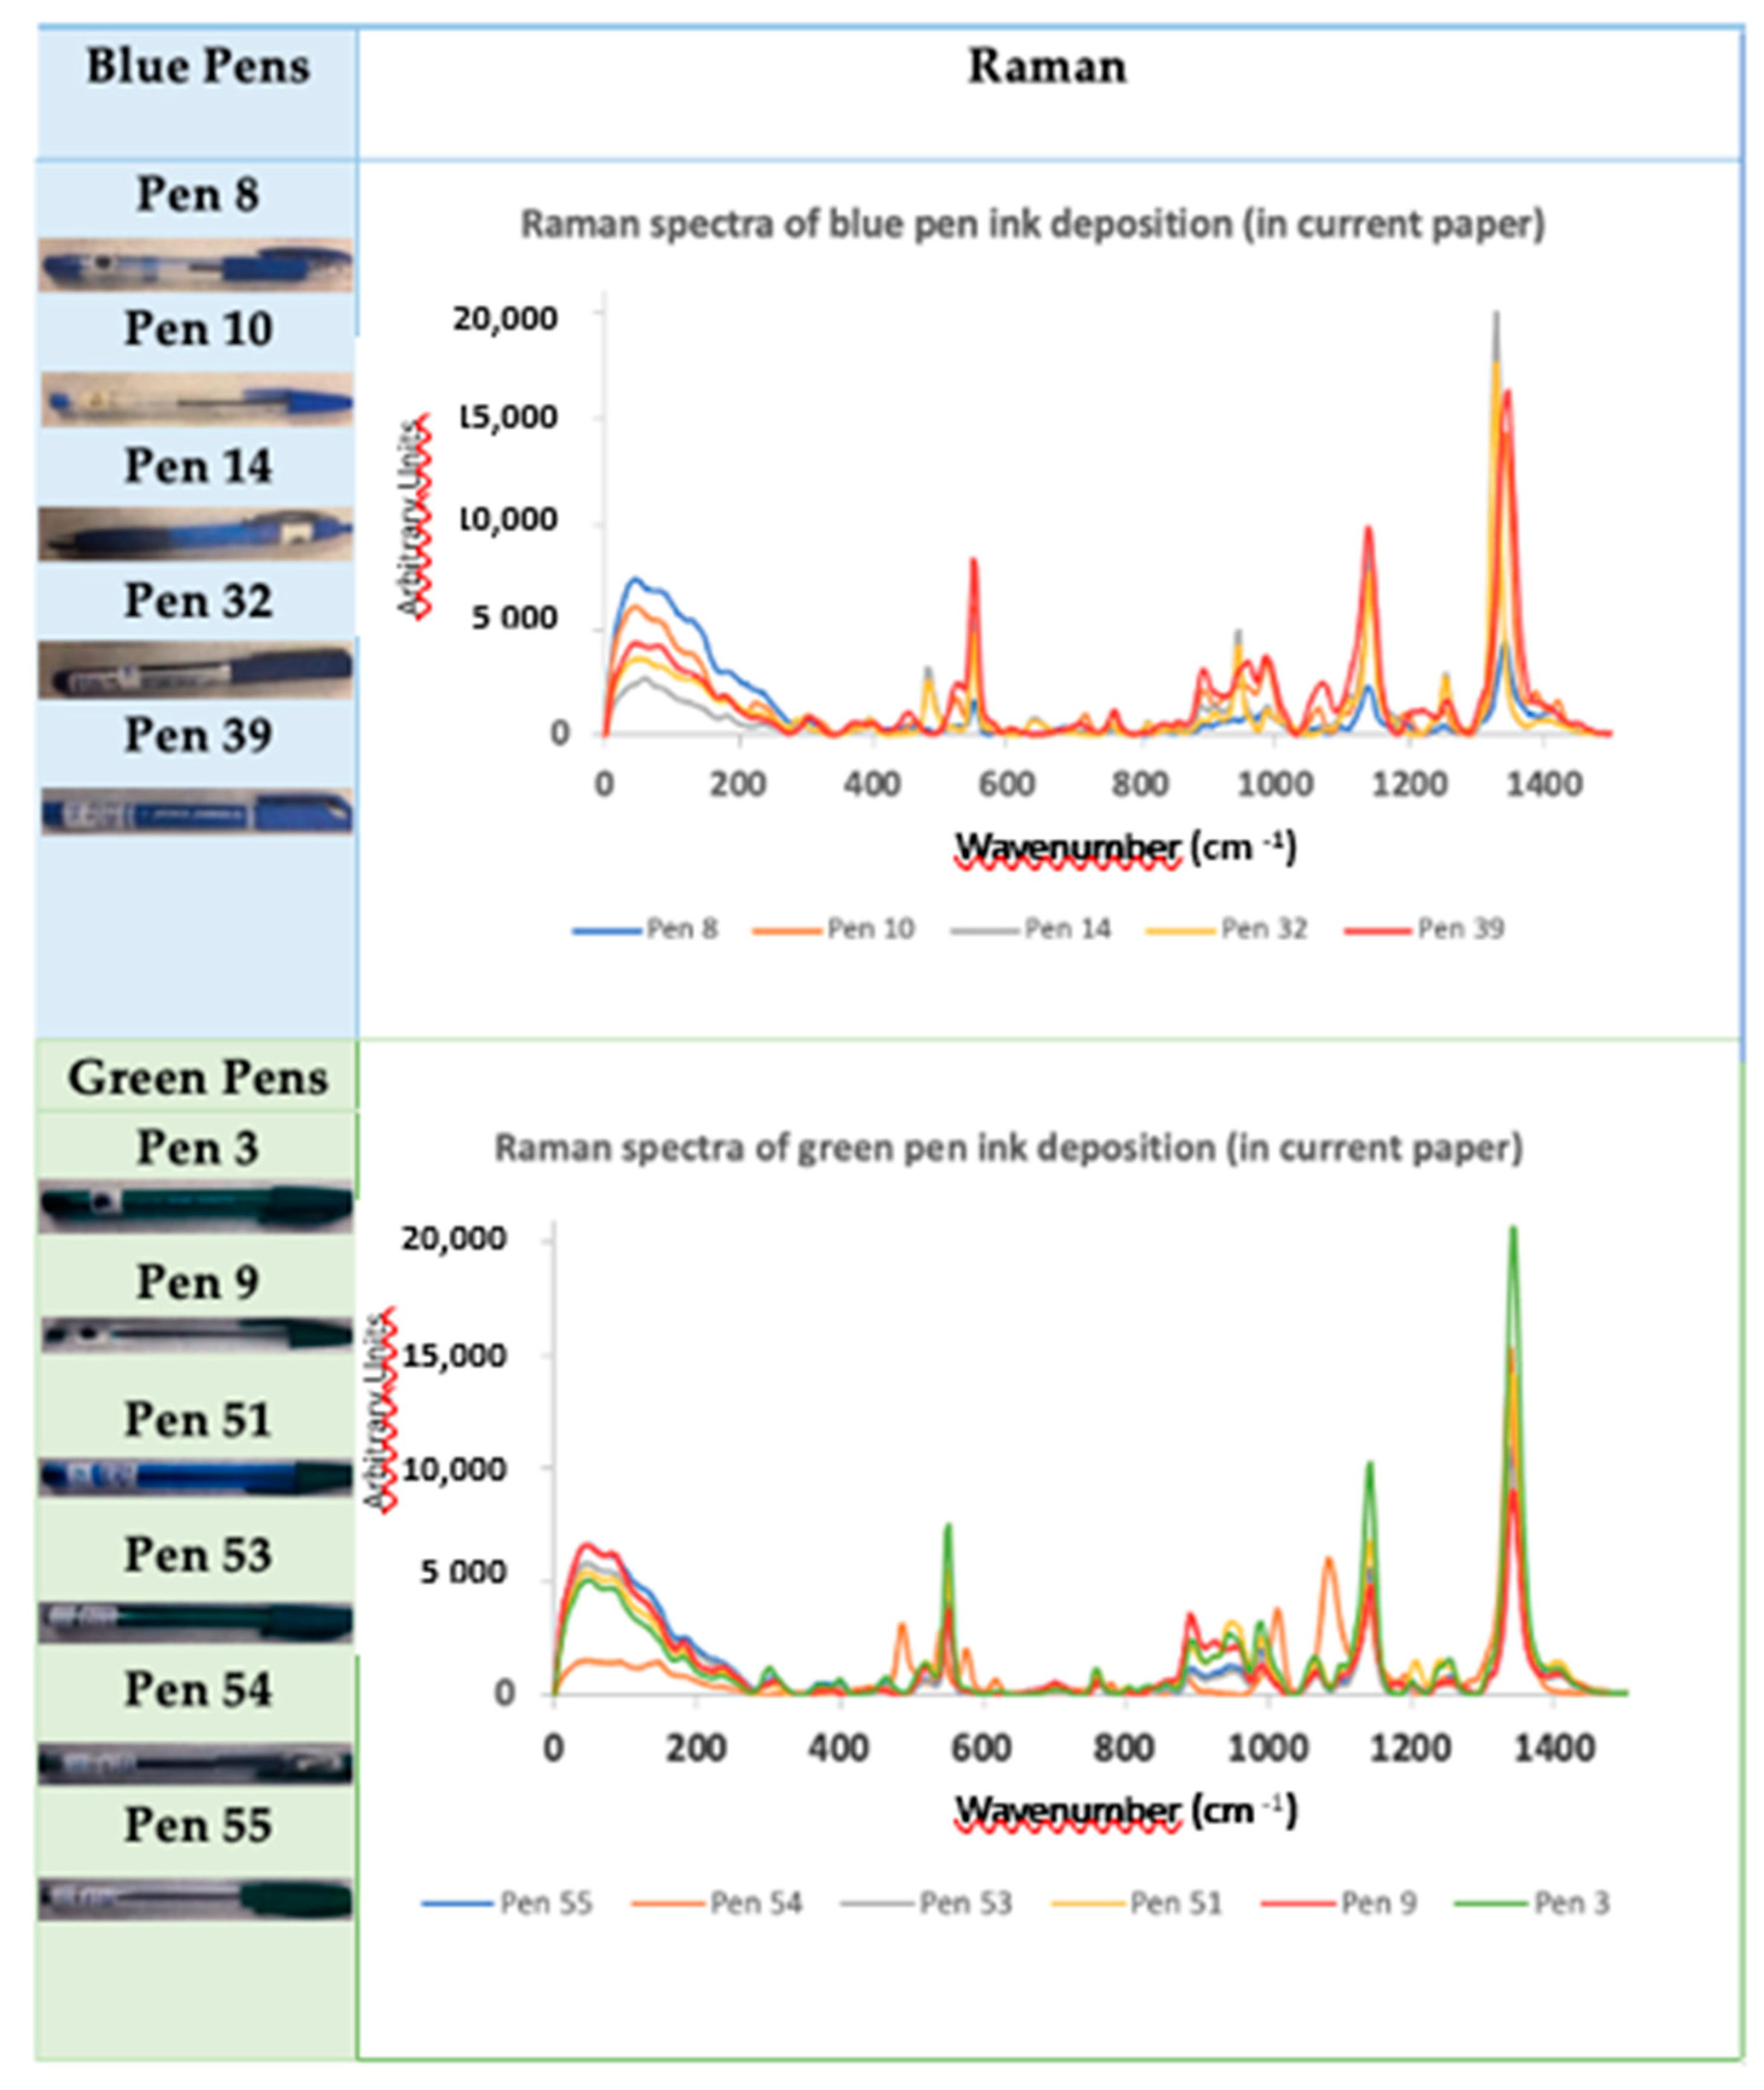
Eleven pens (five blue and six green) were selected from a collection of pens purchased on commercial surfaces. After signal Raman screening: pen 8: Unilakubo—SG100 Rubber Grip 0.7 mm; pen 10: Bic Crystal; pen 14: Bic—unidentifiable model; pen 32: Uni-ball Eye micro 0.5 mm; pen 39: Stabilo Sensor F 0.3 mm; pen 3: Papermate—Inkjoy 1.0 mm; pen 9: Bic Crystal; pen 51: Bic Crystal Soft Medium; pen 53: Papermate Inkjoy 1.0 mm; pen 54: Staples Stick Pens; pen 55: FlairZing—Color Flair 0.7 mm. The ink of each pen has been deposited in notebooks, created with current paper (Navigator) in circular areas with different stroke overlaps in each quadrant, in order to optimize the acquisition conditions. Raman spectra of the ink circular area deposits were acquired using a Raman Mira DS spectrometer equipped with a laser with an excitation wavelength of 785 nm (100 mW) and a spectral range of 200–2300 nm. The equipment provides a spectral resolution of 8–10 cm−1 and a measuring spot of 0.042–2.5 mm. The detection technique used is Orbital Raster Scan (ORS), where a tightly focused beam (0.04 mm) scans a relatively larger area compared to the conventional Raman scanning, averaging the information. It has a universal fixture with three positions that allow the surface of objects to be analysed at three different distances: in contact and at 3 mm and 5 mm.
After acquiring 3 replicates of the Raman spectra for the pen inks, the respective baseline was adjusted using Spectragryph software version 1.2.15 [
4]. The baseline of the spectra was adjusted 2 times. The Raman spectra files of each ink were split into 2 databases to create a predictive model using KNIME Analytics Platform software version 4.6.0 [
5]: (a) the training database (which contained the data from 2 replicates for each of the dyes, the averages of the triplicates and the average between each two replicates) and the (b) validation database (which contained 1 of the replicates that were not present in the training database).
3. Results
The visual analysis of the Raman spectra of the pen inks studied revealed differentiating bands that could contribute to the construction of a predictive model,
Figure 1.
After obtaining the Raman spectra on the handwriting instrument inks, the predictive model was built using Knime software to evaluate the discriminative ability of the model,
Figure 2.
The following nodes were used in the model: Decision Tree Learner, Decision Tree Predictor, Scorer, Decision Tree View, Decision Tree To Image, Decision Tree To Ruleset, and Data to Report.
According to Berthold’s instructions [
5], in the nodes called Excel Reader (Nodes 1 and 3), the files intended to be processed by the predictive model were inserted: in node 1, the document of the training database, and in node 3, the test database. Decision Tree Learner (node 8) parameters were set, and a decision tree was generated from the training file (node 1). The Decision Tree Predictor (node 4) draws on the tree of node 8 to predict the class value for new patterns, in this case, for the “test” file. The Scorer, node 5, analyses the test and training files inserted in the previous nodes and provides the accuracy and error of the analysis. The following nodes (12, 13, 14, and 16) serve only to visualize the decision trees on an image.
After creating the Decision Tree Learner, a second tree was generated with the same nodes, but with the objective of validation in real context. In node 1, the same training file was inserted (for each technique), and in node 3, the validation file containing the data of the one replicate that was not present in the training file was inserted.
The predictive model created achieved a discriminatory power of 72.7% and an error of 27.3%.
4. Discussion
Despite the reduced number of replicates in each database, the present technique achieved values not much lower than those obtained in other studies with other techniques such as Micro-ATR-FTIR combined with chemometrics in which the discrimination power did not exceed 86.67% [
6] and 89.99% [
7], or in studies where multispectral imaging coupled with FCM was used and achieved discrimination percentages of 76% [
8] and 85.7% [
9].
5. Conclusions
The present pilot study allowed the development of a predictive model based on pen ink Raman spectra with a high discriminatory power of 72.7%.
Author Contributions
Conceptualization, A.B.; methodology, A.B. and M.V.; software, D.E. and C.F.; investigation, D.E. and V.T.; writing—original draft preparation, D.E.; writing—review and editing, A.B., M.V. and C.F.; supervision, A.B., M.V. and C.F. All authors have read and agreed to the published version of the manuscript.
Funding
This research received no external funding.
Institutional Review Board Statement
Not applicable.
Informed Consent Statement
Not applicable.
Data Availability Statement
Data are contained within the article.
Acknowledgments
Laboratório de Ciências Forenses e Criminais Egas Moniz and Departamento de Conservação e Restauro Faculdade de Ciências e tecnologias da Universidade Nova de Lisboa.
Conflicts of Interest
The authors declare no conflict of interest.
References
- Cantu, A.; Ink Analysis, A. Wiley Encyclopedia of Forensic Sciences, 2nd ed.; John Wiley & Sons, Ltd.: Hoboken, NJ, USA, 2009; pp. 375–379. [Google Scholar] [CrossRef]
- Ellen, D. The Scientific Examination of Documents, 2nd ed.; Taylor & Francis: Boca Raton, FL, USA, 1997. [Google Scholar]
- Ortiz-Herrero, L.; Bartolomé, L.; Durán, I.; Velasco, I.; Alonso, M.L.; Maguregui, M.I.; Ezcurra, M. DATUVINK pilot study: A potential non-invasive methodology for dating ballpoint pen inks using multivariate chemometrics based on their UV–vis-NIR reflectance spectra. Microchem. J. 2018, 140, 158–166. [Google Scholar] [CrossRef]
- Menges, F. Spectragryph. 2019. Available online: http://spectroscopy.ninja (accessed on 27 April 2021).
- Berthold, M. KNIME Analytics Platform v4.0.2. 2019. Available online: https://www.knime.com/ (accessed on 27 April 2021).
- Lee, L.C.; Othman, M.R.; Pua, H. Systematic assessment of attenuated total reflectance-fourier transforms infrared spectroscopy coupled with multivariate analysis for forensic analysis of black ballpoint pen inks. Malays. J. Anal. Sci. 2012, 16, 262–272. [Google Scholar]
- Nam, Y.S.; Park, J.S.; Lee, Y.; Lee, K.B. Application of micro-attenuated total reflectance fourier transform infrared spectroscopy to ink examination in signatures written with ballpoint pen on questioned documents. J. Forensic Sci. 2014, 59, 800–805. [Google Scholar] [CrossRef] [PubMed]
- Khan, M.J.; Yousaf, A.; Khurshid, K.; Abbas, A.; Shafait, F. Automated forgery detection in multispectral document images using fuzzy clustering. In Proceedings of the 13th IAPR International Workshop on Document Analysis Systems, Viena, Austria, 24–27 April 2018; Volume 2018, pp. 393–398. [Google Scholar] [CrossRef]
- Asri, M.N.M.; Yahya, N.N.; Nor, N.A.M.; Desa, W.N.S.M.; Ismail, D. Towards establishing a non-destructive technique for forensic ink analysis involving Raman spectroscopy with chemometric procedures. AIP Conf. Proc. 2019, 2155, 1–7. [Google Scholar] [CrossRef]
| Disclaimer/Publisher’s Note: The statements, opinions and data contained in all publications are solely those of the individual author(s) and contributor(s) and not of MDPI and/or the editor(s). MDPI and/or the editor(s) disclaim responsibility for any injury to people or property resulting from any ideas, methods, instructions or products referred to in the content. |
© 2023 by the authors. Licensee MDPI, Basel, Switzerland. This article is an open access article distributed under the terms and conditions of the Creative Commons Attribution (CC BY) license (https://creativecommons.org/licenses/by/4.0/).


