Abstract
As the penetration of distributed energy resources (DERs) continues to increase, there is conjecture concerning the power quality implications of the inverters used to interface these DERs with low-voltage (LV) electricity supply networks. As a power electronics converter, inverters are a known source of harmonic emissions. Using a combination of large-scale field measurements, laboratory evaluations of inverter performance, and power system modelling, this study applies an empirical data-driven approach to investigate the impact of small-scale solar PV inverters on LV harmonic distortion magnitudes. This multi-facetted approach, involving field data analysis, laboratory assessments of inverter performance, and power system simulation to evaluate the impact of small-scale DER on harmonic distortion in LV networks, is novel in comparison to other studies, which only utilise one or two of the analysis methods of simulation, laboratory evaluation, or analysis of field measurements but not all three. The analysis of field measurement data collected over the past decade does not indicate any significant changes in harmonic distortion magnitudes that can be attributed to the increasing penetration of DERs. Power system modelling, which incorporates data obtained from laboratory inverter performance evaluations, indicates that, even at very high levels of penetration, the harmonic current emissions from solar PV inverters are only sufficient to add modest levels of harmonic distortion to LV networks, a 0.25% increase in THD for 40% penetration and a 0.62% increase in THD for 100% penetration, providing an explanation for the findings of the field data analysis.
1. Introduction
With increasing volumes of solar photovoltaic (PV) generation come increasing numbers of power electronic converters connected to low-voltage (LV) distribution networks. These inverters are a source of harmonic distortion emissions, which are intrinsic to their operation [1,2]. While there is no conjecture that PV inverters are a source of harmonic emissions, the characteristics of these emissions (e.g., magnitudes, phase angles, and sensitivity to supply voltage waveform distortion) and their overall impact on electricity supply networks are yet to be fully understood. Using a combination of empirical data, laboratory evaluations of inverter harmonic emission, and power system modelling to provide a data-driven evaluation, this paper investigates the impact of solar PV inverters on harmonic voltage distortion magnitudes in LV networks. This study is novel through the application of this three-facetted approach, with other studies only using one or two methods of simulation, laboratory evaluation, or analysis of field data, to predict PV inverter harmonic impacts.
With respect to the characteristics of the harmonic current distortion emitted from PV inverters, Table 1 provides a summary of the relevant literature, including study details and outcomes.

Table 1.
Summary of the literature evaluating the harmonic emissions of small-scale inverters.
A limitation of several of the studies shown in Table 1 is that they conflate high current THD values with significant harmonic impacts. This is an inaccurate inference, as it is the overall magnitude of the harmonic current that leads to increases in harmonic voltage distortion, not the relationship between the total harmonic current and the fundamental current. The studies in [3,4] identify that the emission of individual current harmonic orders may not decrease linearly with the fundamental current, resulting in a higher current THD at a low fundamental current (or power) output. However, the majority of studies indicate that the maximum magnitude of the harmonic current is correlated with the maximum output power. Notwithstanding the potentially misguided analysis related to the assessment of current THD values, several of the studies indicate that the current emissions of solar inverters are relatively low. For example, Refs. [7,11] indicate low current THD when inverters operate at power levels greater than 60% of rated power. A limitation of many of the studies is that measurements were undertaken using inverters connected to the distribution network, i.e., an uncontrolled supply voltage, and that the size of the inverters assessed, a function of the age of the studies, is significantly smaller than those now commonly installed (5 kW or greater).
With respect to the impact of variations in harmonic distortion in the supply voltage waveform on inverter current harmonic emissions, Ref. [5] evaluates inverter performance using both laboratory and field measurements (specifications of laboratory-based inverter not provided). The study in [4] also utilises laboratory measurements in an attempt to quantify the relationship between harmonic current emissions and network voltage distortion. Published in 2019, this is a relatively recent study, and the results align well with those presented in [5]. The study presented in [12] provides measurements of the current emissions from a 3 kW inverter under varying supply voltage distortion, indicating that the distortion of the supply voltage has a significant impact on current emissions. However, the behaviour for individual orders does not necessarily align with that identified in [4,5], particularly for the 3rd harmonic, which increases as opposed to a downward or low-impact trend in the two aforementioned studies, and the 5th harmonic, which does not appear to be greatly impacted—opposing the strong upward trend in [4,5]. These results provide some indication that, while high level outcomes, i.e., supply voltage distortion, have a significant impact on current emissions, performance may differ significantly for individual harmonic orders depending on the individual inverter assessed.
The study in [13] uses a combination of simulations (using IsSPICE) and experimental methods to evaluate the impact of supply voltage distortion on PV inverter current harmonic emissions. The simulation evaluated performance at four power levels: 25%, 50%, 75%, and 100% of the inverter rating. The simulation study found that the addition of distortion into the supply waveform has a significant impact on the current harmonic emissions. The experimental component of the study involved the assessment of the performance of a 400 W inverter. It was found that an increase in the voltage THD leads to a significant increase in the current THD. The study concludes that grid connected PV inverters are highly susceptible to harmonic distortion of the grid voltage waveform, and voltage distortion can easily result in twice the current distortion of the rated output under typical operational circumstances of sub-peak power.
A major limitation of many of the above studies is that the outcomes are based on measurements of only a small number of inverters, often only one or two. No consideration has been given to whether performance varies across inverters from [4,5] different manufacturers. In the case of [5,13], which were published in 2008 and 2000, respectively, the results are now quite dated, and the assessed inverters may not be characteristic of modern designs. Additionally, the studies do not consider a full suite of potential voltage harmonic distortion scenarios, particularly with respect to the phase angle of the supply voltage distortion. The study presented in [14] investigates the impact of supply voltage distortion on single-phase rectifier current emissions. The study finds that the current harmonic emission performance is sensitive to the shape of the voltage waveform—flat waveforms tend to decrease current harmonics, while peaky waveforms increase them. Furthermore, the study finds the following:
- Low-order supply voltage harmonics have a significant impact on the harmonic current components of the input line current.
- The harmonic characteristics of the line current are dependent on both the magnitude and phase angle of the supply voltage harmonics.
The bridge rectifier circuits investigated in [14] are similar to the circuits employed in small-scale PV inverters. Consequently, it may be reasonable to assume that inverter current harmonic emissions may also be sensitive to the shape of the supply voltage waveform, as well as the magnitude of the harmonic components. There are no studies which could be identified that examined scenarios related to the supply voltage waveform shape on solar inverter current harmonic emissions.
Overall, there is a limited literature assessing the current emission performance of modern inverters when subject to supply voltage waveforms that may contain background voltage harmonic distortion. An accurate evaluation of the current emissions of the inverters is essential if precise modelling to estimate the impact of increasing solar PV penetration on harmonic voltage distortion levels is to be achieved.
Considering the impact of solar PV inverters on harmonic distortion magnitudes, there is a significant body of literature which implements a range of computer simulation techniques to estimate the impact of solar PV generation on LV network voltage harmonic distortion levels. These studies utilise a range of simulation packages and have been conducted using various scenarios for network topologies and characteristics. There is significant variation in the methods used to simulate the emissions of PV inverters. Table 2 provides a summary of simulation studies within the literature, including the software package utilised and details of the modelled network(s).
Table 2.
Summary of simulation studies evaluating impact of solar PV on voltage harmonic distortion levels.
The outcomes of the studies summarised in Table 2 are varied in terms of their conclusions with respect to the impact of solar PV generation on voltage harmonic magnitudes. The studies generally contain one or more of the following limitations:
- They only apply a single harmonic current emission spectrum and do not appear to consider that this spectrum may vary between inverters from different manufacturers.
- Simulation studies use harmonic emission spectra for inverters which are based supply from an undistorted voltage waveform. In practice, this may be a significant limitation of the studies, as supply voltage waveform distortion can have a significant impact on the current harmonic emission magnitudes of electronic loads [18,28].
- The simulation studies are also predicated on the network being modelled. There are no studies which can be cited that are considered equivalent to Australian LV networks.
- The majority of the studies identified are now quite dated.
- In many cases, simulated penetration levels are significantly lower than those now being observed in Australian LV distribution networks, which are world-leading with regard to the growth of PV inverter installations (approaching 40% penetration).
Given the limitations of the studies cited, there is a need for additional research, representative of distribution networks in terms of both topology and solar PV penetration levels, and which utilise harmonic emission spectra that are commensurate with those produced by modern inverters, considering performance when subject to varying supply voltage conditions.
The literature review provided above demonstrates that a consensus is yet to be reached regarding the likely impact of high penetrations of solar PV generation on LV harmonic distortion magnitudes. The purpose of this work is to provide further clarity to this discourse and to provide a comprehensive assessment of the impact of solar PV generation on harmonic distortion in LV electricity supply networks. The next section provides an empirical assessment of the impact of solar PV generation on harmonic distortion magnitudes based on data collected from a significant number of LV sites in Australia. This analysis expands on that provided in [29]. Subsequent sections of the paper provide experimental and simulation results that explain the findings of the empirical assessment. In the first instance, the emission characteristics of a range of solar PV inverters as determined using laboratory evaluations are presented (Section 3). This includes assessment of performance under varying levels of supply voltage distortion. The data from the laboratory evaluation were then used in a power system modelling exercise (Section 4) to provide an explanation of the empirical results.
2. Empirical Investigation of the Impact of Solar PV Generation on Distribution Network Harmonic Distortion
In this section, an assessment of the impact of small-scale solar PV generation on harmonic distortion magnitudes in LV networks has been conducted by investigating the hourly aggregates of voltage THD magnitudes. The data used for this investigation were sourced from the Power Quality Compliance Audit (PQCA) project [30], which is administered by the author through the Australian Power Quality Research Centre at the University of Wollongong. The PQCA has been operating since 2002, meaning that there is a significant amount of data prior to the high penetration of solar PV generation, which began to increase rapidly in 2010. Using PQCA data, ‘pre’ significant solar penetration data can be compared to ‘present’ data (data to 2022) to assess the impact of the increasing penetration of solar PV on harmonic distortion magnitudes. Table 3 shows the numbers of LV sites available for analysis each year. Some variation in site numbers is observed due to the PQCA project relying on sites being submitted by participating NSPs, which may change from year to year. Here, it is noted that, while there is a variation in the number of sites and variation in participating NSPs, previous studies have indicated that approximately 200 sites in total are required to ensure statistical confidence in calculated indices for large electricity supply networks [31]. As seen in Table 3, the number of sites included in this study generally exceeds 200 by a significant margin. Consequently, the number of sites included is sufficient to ameliorate any concerns related to statistical confidence in the data.
Table 3.
Numbers of LV sites used in empirical analysis.
The process of investigation involves comparing voltage THD magnitudes across the years for which data are available. For each year, voltage THD magnitudes have been calculated for each hour of the day. If PV generation was having a significant impact on THD magnitudes, substantial changes in the THD magnitudes should be observed during daylight hours—i.e., when solar PV systems are generating energy (considered to be 9 am to 6 pm for the purposes of this investigation).
The process for calculating voltage THD indices for each hour of the day was as follows:
- Data at each site are sorted depending on the hour of the day they are measured.
- The 95th percentile voltage THD index for the period of interest (month or year) is calculated for each hour of the day at each site.
- Indices for each period of interest for all sites are calculated—the indices calculated are the 5th percentile value, median value, and 95th percentile value.
Once the above indices have been calculated, analysis was undertaken to identify if there were any significant changes to the profile of voltage THD magnitudes across the day for the period of 2009–2022. Assessment has been made of THD magnitudes for both the entire year (annual) and each season, with summer, autumn, winter, and spring represented by values from January, April, July, and October, respectively. A seasonal analysis has been performed to investigate whether the time of the year has an impact on outcomes.
As an example of an outcome of the above data analysis procedure, Figure 1 shows the hourly profile of voltage THD magnitudes for annual median values. While it is difficult to comprehensively analyse Figure 1, it does appear that, while the overall THD magnitudes have varied across the years, i.e., the hourly profiles move up and down on the graph, there is little to suggest that the overall shape of the profiles has changed, i.e., there do not appear to be strong changes in the shapes of the curves between 9 am and 6 pm.
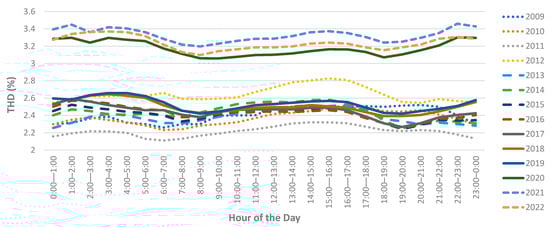
Figure 1.
Profile of annual median voltage THD magnitudes.
To simplify the analysis, the further presentation of data has been restricted to ‘pre’ data from 2009 and 2010 (before the significant penetration of solar) and ‘present’ data from 2021 and 2022 (after the significant penetration of solar). Figure 2 shows the hourly profile of voltage THD magnitudes for these data. It can be observed in the figures that, while the overall THD magnitudes have increased since 2009–2010, there is little change to the overall daily profile, i.e., values have increased consistently across every hour of the day as opposed to increases during daylight hours, which could be attributed to solar PV generation. As such, there is little evidence that solar PV generation is leading to increases (or decreases) in voltage THD values. As a comparison, Figure 3 shows the profiles of steady-state voltage magnitudes. In this figure, a clear daytime ‘hump’ (highlighted by the red box) in magnitudes can be observed within the 2020 data when compared to the 2009 data, showing the influence of solar PV generation on steady-state voltage magnitudes. Equation (1) has been used to quantify the variation in THD values during the hours 9 am–6 pm to quantify the variation in voltage THD during periods associated with solar PV generation. The outcomes of this calculation for 95th percentile voltage THD values, along with the year-end solar installed PV capacity for each year, are shown in Figure 4. Figure 4 clearly shows that the variation in voltage THD slightly decreases as the installed capacity increases.
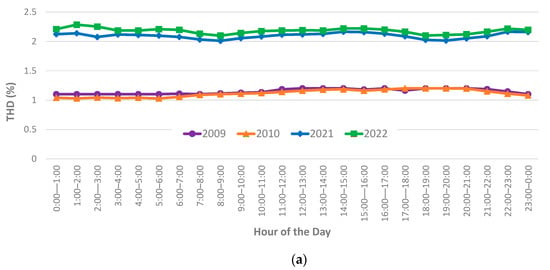
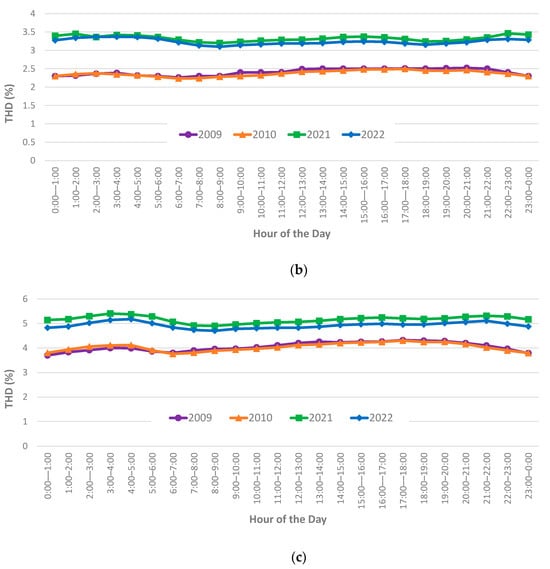
Figure 2.
Annual profiles of voltage THD magnitudes: (a) 5th percentiles, (b) medians, and (c) 95th percentiles.
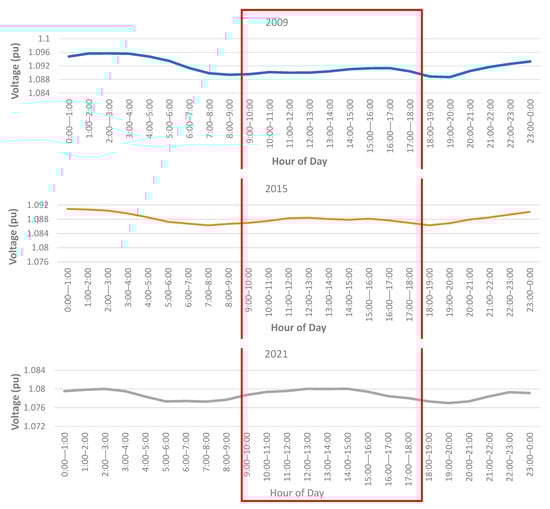
Figure 3.
Hourly profile of median 99th percentile steady-state voltage indices for 2009, 2015, and 2020 on individual graphs from [29] (red box indicates peak solar generation period).
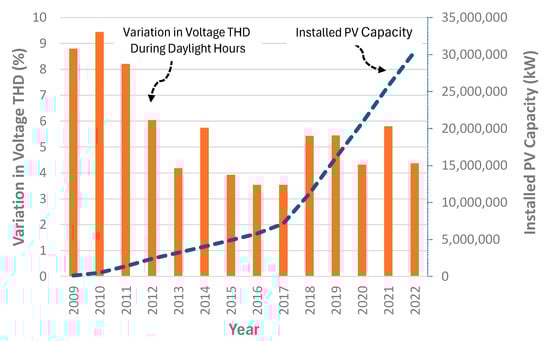
Figure 4.
Variation in 95th percentile voltage THD values between the hours of 9 am and 6 pm for each year, along with installed PV capacity.
The overall increases in voltage THD values across all hours of the day between 2009 and 2010 and 2021 and 2022 may be due to the inclusion of a higher number of sites toward the ends of LV feeders, while the 2009–2010 data were highly biassed towards sites at the distribution transformer terminals. It is well accepted that voltage harmonic distortion will be higher towards the ends of feeders compared to magnitudes at the transformer terminals [32]. While it is accepted that this variation in site characteristics can impact voltage THD magnitudes, as detailed above, the number of sites included in the study is considered to be sufficient for statistical confidence in outcomes. Furthermore, the inclusion of sites at the ends of feeders would be expected to exaggerate the impacts of any injected harmonic current emissions—the data do not show this to be the case.
Appendix A shows the seasonal profiles of voltage THD magnitudes. Similar outcomes are observed for the seasonal data as for the annual data shown in Figure 2. The analysis of the measured data does not indicate that solar PV generation is having a significant impact on voltage THD magnitudes in LV networks, despite significant levels of solar PV penetration. The subsequent sections of this paper use the laboratory evaluation of inverter performance and power system modelling to explain this behaviour.
3. Laboratory Evaluation of Solar PV Inverter Harmonic Emissions
The previous section provided empirical evidence which suggests that, despite the relatively high penetration of solar PV generation, little evidence of any impact on LV harmonic distortion levels can be observed. This section provides an extensive laboratory evaluation of the harmonic current emissions of seven residential-scale single-phase solar inverters. The inverters which have been evaluated are standard types designed for use in residential applications from a range of well-known manufacturers. The inverters are configured for operation in the Australian marketplace and will have firmware installed for compliance with the Australian standard for inverters connected to LV networks in Australia, AS 4777. The inverter design and firmware should ensure a compliance with the harmonic current emission limits prescribed in AS 4777. All evaluated inverters were of a transformerless configuration, with integrated EMC filters. These current emission data are then used to develop plausible current harmonic distortion emission scenarios for power system modelling, as detailed in Section 4.
A summary of the specifications of the inverters evaluated is provided in Table 4. Inverters 1 and 2 are from the same manufacturer, while Inverters 6 and 7 are also from the same manufacturer (different to Inverter 1 and 2). Performance has been evaluated at four output active power magnitudes: 25%, 50%, 75%, and 100% of the rated output. A range of supply voltage waveforms was applied to each inverter to understand the performance when subject to differing supply voltage scenarios (which will be the case in practice).
Table 4.
Details of evaluated inverters.
3.1. Supply Voltage Test Waveforms
Five supply voltage waveforms were applied in the laboratory evaluation. These waveform scenarios were selected to align with the likely operating scenarios in LV networks. Details of the waveforms are as follows:
- Sinusoidal at nominal voltage (230 V): This is the base case used for comparisons.
- Two waveforms (with a fundamental voltage of 230 V) containing low-order harmonic distortion: These waveforms were designed to assess the impact of background distortion on performance. The magnitude of the distortion for these scenarios is based on the median and 95th percentile values for 3rd, 5th, and 7th order voltage harmonics as determined from data collected by the Power Quality Compliance Audit (PQCA) [30]. The 3rd, 5th, and 7th harmonic orders have been selected, as these are the dominant orders in LV networks. The test waveforms containing low-order harmonic distortion have been termed Waveform 1 (WF1) and Waveform 2 (WF2), where WF1 is based on the median value of voltage harmonic distortion and WF2 is based on 95th percentile values. For both WF1 and WF2, the phase angle of each of the harmonic components added to the waveform was set to 0°.
- Two waveforms (with a fundamental voltage of 230 V) containing low-order harmonic distortion with differing phase angles: These waveforms were designed to assess the impact of adjusting the phase angle of the background distortion, relative to the fundamental voltage, on performance. The magnitude of the harmonic components of these waveforms were identical for those used in WF1, while the phase angles used were 180° for the first waveform and the phase angle values published in [33] for the second waveform. The values in [33] are based on the survey results of prevailing phase angles in LV networks worldwide. These waveforms have been termed Waveform 3 (WF3) and Waveform 4 (WF4), respectively.
In all cases, a high-precision, low-output distortion laboratory power supply (California Instrument MX-30, manufactured in California Instrument, San Diego, CA, USA) was utilised to supply AC voltage/waveforms. An Elgar Terra solar array simulator (SAS 2023) (manufactured in Elgar Corporation, San Diego, CA, USA) was utilised as the DC input to the inverters under test. In all cases, adjustments in the inverter output power were achieved by varying the output of the solar array simulator. The measurement instrument used was a Hioki 3198 power quality analyser(V10.10, HIOKI, Ueda, Japan). This instrument is compliant with Class A of IEC 61000-4-30 [34]. A diagram illustrating the laboratory set-up is included below in Figure 5.
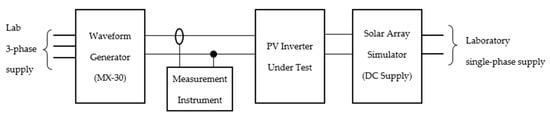
Figure 5.
PV inverter testing experimental set-up.
The characteristics of the supply voltage waveforms applied to the evaluated inverters are given in Table 5. The selections of phase angles for WF3 and WF4 were as per the details outlined above. The voltage THD values were 1.95% and 4.00% for WF1/WF3 and WF2/WF4, respectively.
Table 5.
Details of supply voltage waveforms.
3.2. Performance Under Sinusoidal Supply Voltage Waveform Conditions
This section provides an analysis of the performance of the inverters when supplied using a sinusoidal supply voltage waveform. While it is recognised that this analysis is somewhat flawed, since electricity supply networks will always contain some level of harmonic distortion (i.e., background distortion), an analysis based on measurements using sinusoidal supply voltage waveforms provides a ‘base case’ which can be compared to the results obtained for the other supply voltage waveform scenarios.
Figure 6 shows one cycle of the output current for each of the seven inverters when supplied with a sinusoidal voltage waveform for 50% and 100% of the inverter rated output power. In both cases, the waveforms appear to be quite sinusoidal, indicating that the magnitude of harmonic distortion is low. This is confirmed by the THD values, which are shown in Table 6.
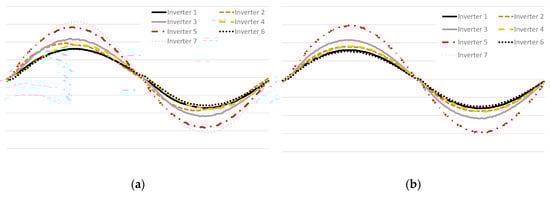
Figure 6.
Inverter output current waveforms for sinusoidal voltage supply scenario at (a) 50% of rated power and (b) 100% of rated power.
Table 6.
Current THD values for sinusoidal supply voltage scenario.
Figure 7 provides a comparison of the harmonic current emissions normalised against the limits specified in AS 4777 [35] (the Australian Standard for Inverters connecting to LV networks) when the inverters were supplied with sinusoidal voltage waveforms for 50% and 100% of the rated output power. The majority of the inverters have harmonic current emissions which are well within the prescribed limits—only two exceedances were observed across all measurements: the 2nd harmonic for Inverter 2 for both the 50% and 100% rated power output scenarios. The performance with respect to the limits was worse for the 50% rated output power scenario.
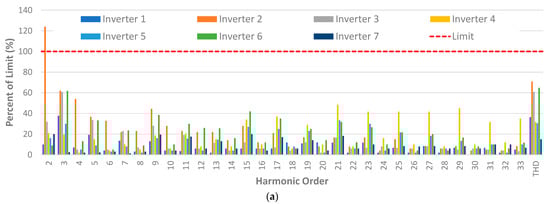
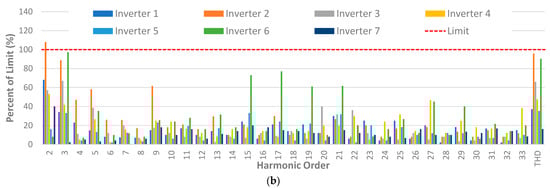
Figure 7.
Current harmonic emissions normalised to AS 4777 limits: (a) 50% of rated power and (b) 100% of rated power (dashed red line indicates AS 4777 limit).
3.3. Characteristics of Emissions
This section investigates the characteristics of the current harmonic emissions when the inverters are supplied using sinusoidal supply voltage waveforms. The purpose of this analysis is to better understand the phase angle relationships between the emissions from different inverters to assess if emissions are likely to add or cancel. The phase angle measurements used are based on 13-cycle waveform captures measured using the IEC 61000-4-30 Class A requirements, as built into the measurement instrument.
Figure 8 shows a sample of the harmonic current emissions analysed for 50% rated output power, while Figure 9 shows the same information for 100% rated output power. In each figure, the magnitude is given as a percentage of the fundamental current, while the phase angle is in degrees. The results for a range of harmonic orders are shown in appreciation of the fact that while the distortion for a particular harmonic order is applied with a varying magnitude and phase, due to the internal operation of the inverter and the complex interactions between the inverter components and the network, there may be variation in the resulting harmonic current characteristics across multiple harmonic orders.
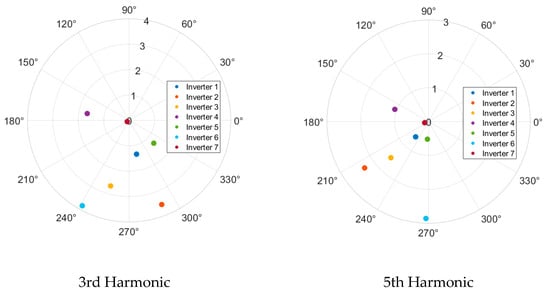
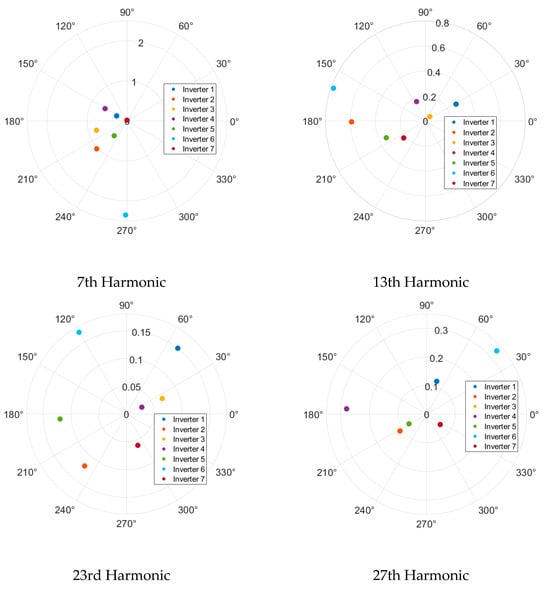
Figure 8.
Characteristics of harmonic current emissions for 50% rated output power.
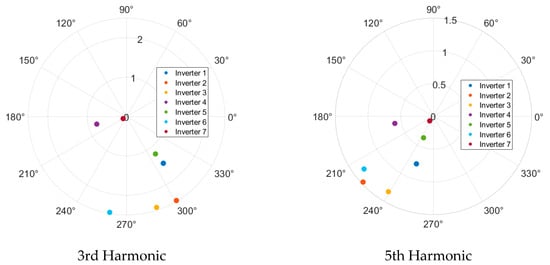
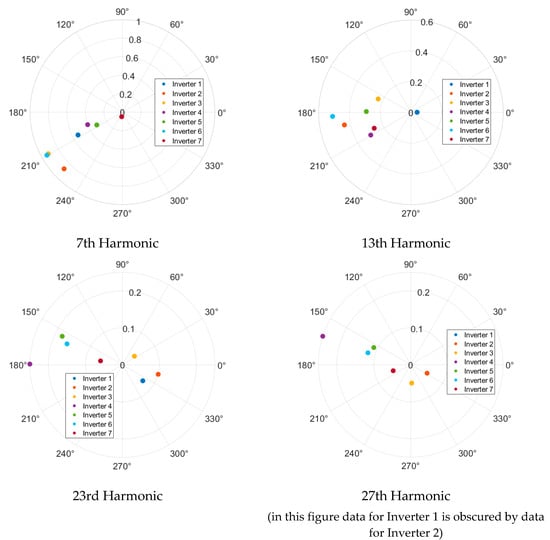
Figure 9.
Characteristics of harmonic current emissions for 100% rated output power.
The following conclusions can be derived from the data shown in Figure 8 and Figure 9 and the other harmonic orders analysed:
- In general, the phase angle diversity increases as the harmonic order increases. As such, when supplied with sinusoidal voltage waveforms, there will likely be some addition of low-order harmonic current emissions, while some cancellation can be expected for higher-order harmonics.
- The amount of phase angle diversity is similar for both output power levels for four of the six harmonic orders shown.
- The phase angle diversity is lower at 100% rated power compared to 50% rated power for three of the nine harmonic orders shown.
- The magnitudes of harmonic current emissions (in % of fundamental) are generally higher for the 50% rated output power scenario. However, it should be noted that the overall magnitudes of harmonic current emissions (in amperes) are highest at 100% rated output power.
3.4. Impact of Output Power Magnitude
This section examines the impact of the output power magnitude on emissions. Table 7 shows harmonic current emission magnitudes (in percentage of fundamental current) and phase angles (in degrees) for selected harmonic orders for each inverter (Inv. in the table) for the evaluations conducted at 25%, 50%, 75%, and 100% of the rated active output power. The variation (Var in the table) in values is calculated for each inverter using (1).
Table 7.
Harmonic current emissions for 25%, 50%, 75%, and 100% rated output power.
The variation in the phase angle is calculated as the maximum value minus the minimum value. The average deviation is calculated as the arithmetic average of the variation values across the seven inverters. The data in the table have been formatted as follows:
- Changes in magnitude of up to 40% are shaded green,
- Changes in magnitude between 40% and 100% are shaded orange,
- Changes in magnitude greater than 100% are shaded red,
- Changes in phase angle of up to 60° are shaded green,
- Changes in magnitude between 60° and 120° are shaded orange,
- Changes in phase angle greater than 120° are shaded red.
While there is inconsistent performance across the evaluated inverters, the following provides a summary of the performance:
- The output power magnitude has a significant impact on the magnitude (in percentage of fundamental) of the current harmonic emissions, particularly for higher-order harmonics.
- Where there is a variation in the magnitude (in percentage of fundamental current) of harmonic current emissions, the magnitude tends to decrease as the output power magnitude increases. This finding aligns with the results published in [3,4]. It should be noted that, while distortion as a percentage of the fundamental current is highest at a low output power, the value of the harmonic emission in amperes is highest at the highest output power (i.e., where the output power is reduced, the fundamental current decreases to a greater extent than the harmonic current components).
- The output power magnitude generally does not have a significant impact on the phase angle for the low-order harmonics (3rd, 5th, and to a lesser extent 7th).
- The output power magnitude has a significant impact on the phase angle diversity for orders above the 7th. This suggests that there could be a phase cancellation of harmonic current emissions from inverters of the same type which are operating at different output power magnitudes.
3.5. Impact of Background Distortion
This section investigates the impact of distortion on the supply voltage waveform (i.e., background distortion) of current harmonic emissions. Table 8 and Table 9 show the current THD values when the PV inverters were supplied with a sinusoidal waveform (labelled ‘Sine’), as well as WF1 and WF2, for 100% and 50% rated output power, respectively. The percentage variation, which is provided to allow for an easy appreciation of the impacts of the various test waveforms, in each table is calculated using (2):
Table 8.
Current THD when supplied with undistorted (Sine), WF1, and WF2 for 100% rated output power.
Table 9.
Current THD when supplied with undistorted (Sine), WF1, and WF2 for 50% rated output power.
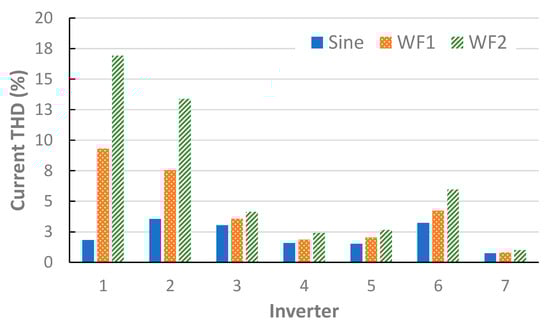
Figure 10.
Current THD when supplied with undistorted (Sine), WF1, and WF2 for 100% rated output power.
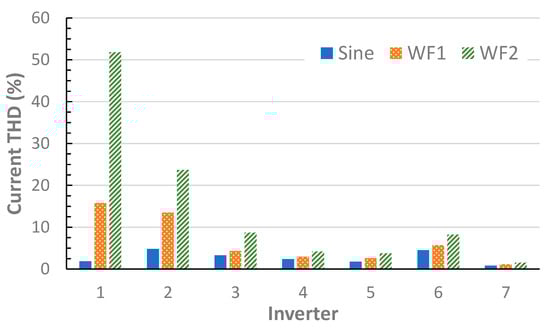
Figure 11.
Current THD when supplied with undistorted (Sine), WF1, and WF2 for 50% rated output power.
Several conclusions can be drawn from the data shown above:
- Current THD magnitudes are low when the inverters are supplied with undistorted supply voltage waveforms.
- The inclusion of low-order harmonic distortion on the supply voltage waveform has a significant impact on the current THD emissions. The presence of even modest levels of voltage distortion, as is the case for WF1, results in a 32% increase in current THD in the best case, and an increase of over 800% in the worst case, when considering the performance at 100% rated output power.
- The impact of distorted supply voltage waveforms on the current THD is not consistent across all inverters. The largest variation is observed for Inverters 1 and 2, while the smallest is for Inverters 3 and 7.
- THD tends to increase as rated power decreases. This performance is in line with the observations in [8,13]. However, it should be noted that the total harmonic current magnitude in amperes is higher at rated power (100%) than at 50% power. The reason for THD increasing is that the harmonic current components do not decrease at the same rate as the fundamental current.
- In general, increases in the current THD as voltage distortion increases are larger for the 50% rated output power case.
Table 10 shows the impact of the addition of background distortion (i.e., the impact of supply using WF1 and WF2) to the values of magnitudes and phase angles for a selection of harmonic orders for Inverter 1 to Inverter 7, respectively, at 100% output power. The calculations for variations in parameters, as well as the coloured shading in the table, are equivalent to those applied in Section 3.4 (Table 7). The following summarises the analysis of Table 10:
Table 10.
Harmonic current emissions for Sine, WF1, and WF2 supply voltage waveforms for 100% rated output power.
- The addition of distortion to the supply voltage waveform generally has a modest impact on the 3rd harmonic current emission magnitudes and has little impact on the 3rd harmonic current phase angles.
- The addition of distortion to the supply voltage waveform leads to large increases in the current emission magnitudes for both 5th and 7th harmonic orders. The impact on phase angles is reasonably small.
- There is an inconsistent performance across the inverters for the other harmonic orders shown. However, the data demonstrate that the addition of low-order harmonic distortion to the supply voltage waveform can have significant impacts on the current emissions (in terms of both magnitude and phase angle) for higher-order harmonics.
- As a general principle, the addition of low-order voltage harmonic distortion to the supply voltage waveforms leads to larger changes in the current harmonic emission magnitudes than phase angles.
3.6. Impact of Background Distortion Phase Angle
This section examines the current harmonic emissions when variations in the phase angle are added to the background distortion in the supply voltage waveforms. Effectively, this is a comparison of performance between WF1, WF3, and WF4. Table 11 shows the impact of the addition of phase angle diversity to the background distortion on the values of the magnitude and phase angle for a selection of harmonic orders for Inverter 1 to Inverter 7, respectively, at 100% output power. The calculations for variations in parameters, as well as the coloured shading in the table, are equivalent to those applied in Section 3.4 (Table 7). The following summarises the analysis of Table 11:
Table 11.
Harmonic current emissions for WF1, WF3, and WF4 supply voltage waveforms for 100% rated output power.
- The impact of the phase angle of the background distortion on 3rd harmonic current emissions is generally small.
- The addition of phase angle diversity leads to a significant diversity in the phase angle of the harmonic current emissions for the 5th and 7th harmonics. This suggests that there may be significant phase cancellation depending on the characteristics of the background voltage distortion.
- The impact on higher-order harmonic current emissions is inconsistent across the various inverters:
- ○
- There is very little impact for Inverter 4, 5, and 7.
- ○
- There is a significant variation in the phase angle values for Inverter 1, 2, and 3 depending on the harmonic order.
3.7. Summary
Figure 12 and Figure 13 show the average variations in harmonic current emission magnitudes and phase angles for the three operating scenarios considered in Section 3.4–Section 3.6 for magnitude and phase angle respectively. These graphs allow for an easy visualisation of the operating scenario that has the largest impact on harmonic current emission characteristics. With respect to magnitude, background distortion has the most significant impact on the 5th and 7th harmonics, while output power has a larger impact for the higher-order harmonics. With respect to the phase angle, the phase angle of the background distortion has the largest impact on 5th and 7th harmonics, while the output power is more relevant for higher-order harmonics. The impact of all scenarios on the 3rd harmonic is relatively modest.
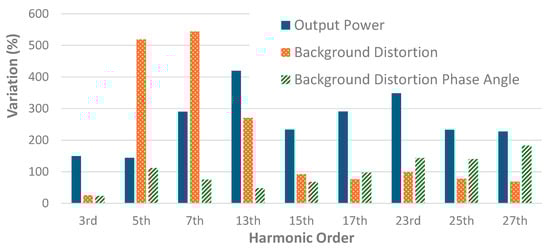
Figure 12.
Average variation in harmonic current emission magnitudes for evaluated operating scenarios.
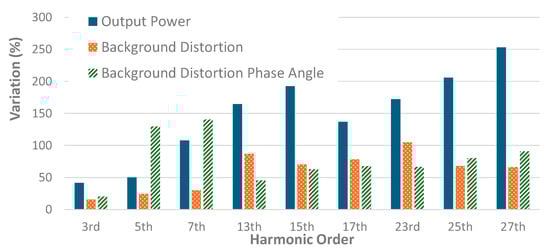
Figure 13.
Average variation in harmonic current emission phase angle for evaluated operating scenarios.
4. Power System Modelling
4.1. Modelling Methodology and Parameters
This section utilises the laboratory data obtained in the previous section as an input for low-voltage network modelling, which aims to explain the lack of a significant impact of solar PV inverter current harmonic emissions on LV THD levels, as described in Section 2. A simple current injection calculation has been undertaken in the MATLAB software package (version R2023b Update 3) to simulate the worst-case scenario. The following are the details of the modelling methodology and inputs:
- The results of the laboratory evaluation indicate that the maximum harmonic current is always commensurate with the maximum output power (i.e., 100% rated power). As such, the harmonic current magnitudes for 100% rated power have been used.
- The harmonic emissions for WF2 have been used, as this waveform results in the highest harmonic current emission magnitude.
- Only emissions for the 3rd, 5th, and 7th harmonics have been considered. The laboratory results indicate that emissions for other harmonics are low and have a high degree of phase angle diversity, indicating that there will likely be a significant phase cancellation of emissions.
- The maximum harmonic emission magnitude across all seven inverters has been used as the injected current magnitude. Table 12 shows the details of the injected emission magnitudes. The average of the measured phase angles for the 3rd, 5th, and 7th harmonic orders has been used as the indicative phase angle for use in the model. This is justified, as there is no significant phase angle variation for these harmonic orders, as indicated in Section 3 (Figure 9). The use of a single-phase angle for all inverters means that phase angles will add arithmetically, which represents the worst-case scenario.
Table 12. Harmonic current inputs for low-voltage feeder model.
- The harmonic emissions are all injected at the end of the modelled feeder. As such, all emissions flow through the total impedance of the feeder. This results in the highest harmonic voltage.
- All harmonic spectra are represented as fixed current sources in the model.
- The network is assumed to be balanced in terms of both loading and impedance.
The network model consists of a 350 kVA transformer suppling two identical voltage feeders of 200 m in length (i.e., 175 kVA per feeder). The distribution network is modelled using actual network parameters obtained from Endeavour Energy, an Australian Network Service Provider. The network model was designed through typical voltage distribution feeder construction. The conductor type used for the network model is Olex Mercury, which is a 111 mm2 All Aluminium Conductor (AAC) type. This conductor has the following impedance properties:
- Resistance: 0.315 Ω/km (at 50 Hz, 75 °C),
- Inductive Reactance: 0.259 Ω /km (to 0.3 m at 50 Hz).
The penetration of solar PV generation is assumed to be equal to the rating of the feeder, i.e., 175 kVA ÷ 3 = 58.3 kVA per phase. Figure 14 shows a single-phase equivalent representation of the modelled network.
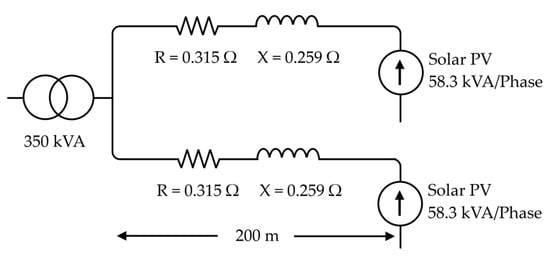
Figure 14.
Single-phase equivalent representation of modelled network.
Differences in the sequence characteristics of triplen and non-triplen harmonics necessitated the implementation of different models for triplen and non-triplen harmonic orders. For non-triplen harmonics, the network can be modelled as a simple single-phase equivalent. For such models, only the impedance of the active conductor needs to be modelled, as in a balanced system no harmonic current will flow in the neutral conductor. For triplen harmonics, the neutral impedance must also be modelled, as currents from these harmonic orders will add in the neutral as zero sequence harmonics (assuming a balanced level of harmonics are on each phase). To convert this three-phase interaction into a single-phase equivalent, the impedance of the neutral conductor must be multiplied by 3 and added to the active conductor impedance. As such, the effective impedance used in the single-phase equivalent circuit is four times the active conductor impedance (given the assumption that the neutral conductor is constructed of the same material as the active conductors). Figure 15 shows the equivalent circuits used in modelling.
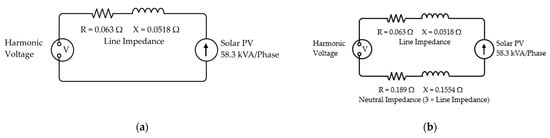
Figure 15.
Fundamental frequency (50 Hz) model equivalent circuits: (a) non-triplen harmonic orders; (b) triplen harmonic orders.
4.2. Model Outputs
Table 13 shows the output of the model for each harmonic order, as well as the calculated THD value.
Table 13.
Harmonic current outputs for low-voltage feeder model at 100% penetration.
The model presented in this section represents an extreme worst-case scenario, utilising the highest harmonic emission magnitudes injected into the maximum system impedance and ignoring any phase diversity. Even under these circumstances, the output of the model indicates that, at a 100% penetration of solar PV generation, the solar PV generation current harmonic emissions only result in a contribution of 0.62% to the voltage THD per LV feeder.
The overall penetration of solar PV generation in Australia is approximately 40%. Scaling the model outputs to this value produces the results shown in Table 14.
Table 14.
Harmonic current outputs for low-voltage feeder model scaled for 40% penetration.
Overall, the very low contributions to harmonic distortion magnitudes obtained by using laboratory-based inverter emissions as inputs to power system modelling provide an explanation for the empirical results detailed in Section 2 and indicate that it is unlikely that harmonic current emissions from residential solar PV inverters will result in significant impacts on harmonic voltage magnitudes.
5. Conclusions
The paper investigates the impact of residential-scale solar PV generators on harmonic distortion magnitudes in low-voltage electricity supply networks. A three-stage approach was adopted.
In the first instance, measured voltage THD data from Australian LV networks have been used to provide an empirical evaluation of how voltage THD magnitudes have changed over time as solar PV penetration has increased. This empirical evaluation indicated that there is little evidence that solar PV generation is having a significant impact.
The second and third stages involved a laboratory evaluation of the harmonic current emissions from a range of solar PV inverters for differing output power values, background distortion magnitudes, and background distortion phase angles. The outcomes of this laboratory evaluation were used as inputs to a worst-case power system model to assess the impact of solar PV current emissions on harmonic voltage distortion magnitudes. The output of the modelling indicates that, even under worst-case operating conditions, solar PV inverter current emissions are too small to have a significant impact on harmonic voltage distortion magnitudes. The combination of laboratory evaluation and power system modelling provides an explanation for the findings of the empirical study. As an overall outcome, this paper provides data-driven evidence to suggest that solar PV inverters are unlikely to have a significant impact on harmonic voltage distortion.
The most significant limitation of this paper is that it deals with equipment and networks in the Australian context. Australian networks at a low voltage have a 4-wire, 230 V nominal configuration. This network configuration will obviously not be relevant in all parts of the world. An additional limitation is that, while the performance of a significant number of inverters has been evaluated, there are many more models in the marketplace. The evaluation of the performance of additional inverters is an avenue for future work. Other future work includes continuing to monitor data collected from the field to observe the trends in harmonic distortion magnitudes as small-scale solar PV penetration continues to increase (as it is forecast to do).
Author Contributions
S.E. was responsible for the development and implementation of the research methodology, including laboratory testing. S.E. was also responsible for drafting the manuscript. D.A.R. was responsible for overall project supervision and technical guidance, as well as review and editing. J.C.K. was responsible for the drafting and verification of the manuscript, along with research conceptualization. G.D. assisted with data analysis and verification. All authors have read and agreed to the published version of the manuscript.
Funding
This research received no external funding.
Data Availability Statement
The original contributions presented in the study are included in the article; further inquiries can be directed to the corresponding author.
Conflicts of Interest
The authors declare no conflicts of interest.
Appendix A. Seasonal Hourly Profiles of Voltage THD Magnitudes


Figure A1.
Hourly profiles of voltage THD magnitudes for January (summer): (a) 5th percentile values, (b) median values, (c) 95th percentile values.


Figure A2.
Hourly profiles of voltage THD magnitudes for April (autumn): (a) 5th percentile values, (b) median values, (c) 95th percentile values.


Figure A3.
Hourly profiles of voltage THD magnitudes for July (winter): (a) 5th percentile values, (b) median values, (c) 95th percentile values.


Figure A4.
Hourly profiles of voltage THD magnitudes for October (spring): (a) 5th percentile values, (b) median values, (c) 95th percentile values.
References
- Dugan, R.C.; McGranaghan, M.F.; Santoso, S.; Beaty, H.W. Electrical Power Systems Quality; McGraw Hill: New York, NY, USA, 2012. [Google Scholar]
- Gabr, W.I.; Salem, W.A. Impact of Grid Connected Photovoltaic System on Total Harmonics Distortion (THD) of Low Voltage Distribution Network: A Case Study. In Proceedings of the 2018 Twentieth International Middle East Power Systems Conference (MEPCON), Cairo, Egypt, 18–20 December 2018; pp. 608–614. [Google Scholar] [CrossRef]
- Papaioannou, I.T.; Bouhouras, A.S.; Marinopoulos, A.G.; Alexiadis, M.C.; Demoulias, C.S.; Labridis, D.P. Harmonic impact of small photovoltaic systems connected to the LV distribution network. In Proceedings of the 2008 5th International Conference on the European Electricity Market, Lisboa, Portugal, 28–30 May 2008; pp. 1–6. [Google Scholar] [CrossRef]
- Elkholy, A. Harmonics assessment and mathematical modeling of power quality parameters for low voltage grid connected photovoltaic systems. Sol. Energy 2019, 183, 315–326. [Google Scholar] [CrossRef]
- Schlabbach, J. Harmonic current emission of photovoltaic installations under system conditions. In Proceedings of the 2008 5th International Conference on the European Electricity Market, Lisboa, Portugal, 28–30 May 2008; pp. 1–5. [Google Scholar] [CrossRef]
- Vinayagam, A.; Aziz, A.; Pm, B.; Chandran, J.; Veerasamy, V.; Gargoom, A. Harmonics assessment and mitigation in a photovoltaic integrated network. Sustain. Energy Grids Netw. 2019, 20, 100264. [Google Scholar] [CrossRef]
- Du, Y.; Lu, D.D.-C.; James, G.; Cornforth, D.J. Modeling and analysis of current harmonic distortion from grid connected PV inverters under different operating conditions. Sol. Energy 2013, 94, 182–194. [Google Scholar] [CrossRef]
- Chicco, G.; Napoli, R.; Spertino, F. Experimental evaluation of the performance of grid-connected photovoltaic systems. In Proceedings of the 12th IEEE Mediterranean Electrotechnical Conference (IEEE Cat. No.04CH37521), Dubrovnik, Croatia, 12–15 May 2004; Volume 3, pp. 1011–1016. [Google Scholar] [CrossRef]
- Schlabbach, J.; Grob, A.; Chicco, G. Influence of Harmonic System Voltages on the Harmonic Current Emission of Photovoltaic Inverters. In Proceedings of the 2007 International Conference on Power Engineering, Energy and Electrical Drives, Setubal, Portugal, 12–14 April 2007; pp. 545–550. [Google Scholar] [CrossRef]
- Batrinu, F.; Chicco, G.; Schlabbach, J.; Spertino, F. Impacts of grid-connected photovoltaic plant operation on the harmonic distortion. In Proceedings of the MELECON 2006–2006 IEEE Mediterranean Electrotechnical Conference, Malaga, Spain, 16–19 May 2006; pp. 861–864. [Google Scholar] [CrossRef]
- Arteaga, J.-A.; López, Y.U.; López, J.A.; Posada, J. Decoding Harmonics: Total Harmonic Distortion in Solar Photovoltaic Systems with Integrated Battery Storage. Electricity 2025, 6, 28. [Google Scholar] [CrossRef]
- Chicco, G.; Schlabbach, J.; Spertino, F. Experimental assessment of the waveform distortion in grid-connected photovoltaic installations. Sol. Energy 2009, 83, 1026–1039. [Google Scholar] [CrossRef]
- Simmons, A.D.; Infield, D.G. Current waveform quality from grid-connected photovoltaic inverters and its dependence on operating conditions. Prog. Photovolt. Res. Appl. 2000, 8, 411–420. [Google Scholar] [CrossRef]
- Mansoor, A.; Grady, W.M.; Thallam, R.S.; Doyle, M.T.; Krein, S.D.; Samotyj, M.J. Effect of Supply Voltage Harmonics on the Input Current of Single-Phase Diode Bridge Rectifier Loads. IEEE Trans. Power Deliv. 1995, 10, 1416–1422. [Google Scholar] [CrossRef]
- Sharew, E.A.; Kefale, H.A.; Werkie, Y.G. Power Quality and Performance Analysis of Grid-Connected Solar PV System Based on Recent Grid Integration Requirements. Int. J. Photoenergy 2021, 2021, 4281768. [Google Scholar] [CrossRef]
- Ahsan, S.M.; Khan, H.A.; Hussain, A.; Tariq, S.; Zaffar, N.A. Harmonic Analysis of Grid-Connected Solar PV Systems with Nonlinear Household Loads in Low-Voltage Distribution Networks. Sustainability 2021, 13, 3709. [Google Scholar] [CrossRef]
- Fekete, K.; Klaic, Z.; Majdandzic, L. Expansion of the residential photovoltaic systems and its harmonic impact on the distribution grid. Renew. Energy 2012, 43, 140–148. [Google Scholar] [CrossRef]
- Chidurala, A.; Kumar Saha, T.; Mithulananthan, N. Harmonic impact of high penetration photovoltaic system on unbalanced distribution networks—Learning from an urban photovoltaic network. IET Renew. Power Gener. 2016, 10, 485–494. [Google Scholar] [CrossRef]
- Dartawan, K.; Hui, L.; Austria, R.; Suehiro, M. Harmonics Issues that Limit Solar Photovoltaic Generation on Distribution Circuits. In Proceedings of the SOLAR 2012, World Renewable Energy Forum (WREF 2012), Denver, CO, USA, 13–17 May 2012. [Google Scholar]
- Balda, J.C.; Oliva, A.R. A PV dispersed generator: A power quality analysis within the IEEE 519. In Proceedings of the 8th International Conference on Harmonics and Quality of Power. Proceedings (Cat. No.98EX227), Athens, Greece, 14–16 October 1998; Volume 1, pp. 476–481. [Google Scholar] [CrossRef]
- Latheef, A.A. Harmonic Impact of Photovoltaic Inverter Systems on Low and Medium Voltage Distribution Systems. Master’s Thesis, University of Wollongong, Wollongong, Australia, 2006. [Google Scholar]
- HB 264-2003; Application Guide to AS/NZS 61000.3.6 and AS/NZS 61000.3.7. Standards Australia: Sydney, Australia, 2003.
- Torquato, R.; Trindade, F.C.L.; Freitas, W. Analysis of the harmonic distortion impact of photovoltaic generation in Brazilian residential networks. In Proceedings of the 2014 16th International Conference on Harmonics and Quality of Power (ICHQP), Bucharest, Romania, 25–28 May 2014; pp. 239–243. [Google Scholar] [CrossRef]
- Dghim, H.; El-Naggar, A.; Erlich, I. Harmonic distortion in low voltage grid with grid-connected photovoltaic. In Proceedings of the 2018 18th International Conference on Harmonics and Quality of Power (ICHQP), Ljubljana, Slovenia, 13–16 May 2018; pp. 1–6. [Google Scholar] [CrossRef]
- Lee, Y.D.; Chen, C.S.; Hsu, C.T.; Cheng, H.S. Harmonic Analysis for the Distribution System with Dispersed Generation Systems. In Proceedings of the 2006 International Conference on Power System Technology, Chongqing, China, 22–26 October 2006; pp. 1–6. [Google Scholar] [CrossRef]
- Papaioannou, I.T.; Alexiadis, M.C.; Demoulias, C.S.; Labridis, D.P.; Dokopoulos, P.S. Modeling and Field Measurements of Photovoltaic Units Connected to LV Grid. Study of Penetration Scenarios. IEEE Trans. Power Deliv. 2011, 26, 979–987. [Google Scholar] [CrossRef]
- Al-Sharif, Y.M.; Sowilam, G.M.; Kawady, T.A. Harmonic Analysis of Large Grid-Connected PV Systems in Distribution Networks: A Saudi Case Study. Int. J. Photoenergy 2022, 2022, 8821192. [Google Scholar] [CrossRef]
- Blanco Castañeda, A.; Yanchenko, S.; Meyer, J.; Schegner, P. Impact of supply voltage distortion on the current harmonic emission of non-linear loads. DYNA 2015, 82, 150–159. [Google Scholar] [CrossRef]
- Elphick, S.; Robinson, D.; Knott, J.; Perera, S.; David, J.; Drury, G. Impact of Renewable Energy on Power Quality in Distribution Systems. In Proceedings of the CIGRE 2023 International Sympoisum, Cairns, Australia, 6–8 March 2023. [Google Scholar]
- Elphick, S.; Ciufo, P.; Drury, G.; Perera, S.; Smith, V.; Gosbell, V. Large Scale Pro-active Power Quality Monitoring: An Example from Australia. IEEE Trans. Power Deliv. 2016, 32, 881–889. [Google Scholar] [CrossRef]
- Elphick, S.; Gosbell, V.; Smith, V.; Drury, G.; Barr, R. Assessing Network Compliance for Power Quality Performance. In Proceedings of the 16th International Conference on Harmonic and Quality of Power, ICHQP 2014, Bucharest, Romania, 25–28 May 2014. [Google Scholar]
- Elphick, S.; Smith, V.; Gosbell, V.; Perera, S. Characteristics of Power Quality Disturbances in Australia: Voltage Harmonics. Aust. J. Electr. Electron. Eng. 2013, 10, 490–496. [Google Scholar] [CrossRef]
- Yadav, J.; Blanco Castañeda, A.; Meyer, J.; Vasudevan, K. International Survey on Voltage Harmonic Unbalance in Low Voltage Networks. In Proceedings of the 2022 20th International Conference on Harmonics & Quality of Power (ICHQP), Naples, Italy, 29 May–1 June 2022. [Google Scholar] [CrossRef]
- IEC. Electromagnetic Compatibility (EMC)—Part 4–30: Testing and Measurement Techniques—Power Quality Measurement Methods; IEC: Geneva, Switzerland, 2015. [Google Scholar]
- AS/NZS 4777.2:2020; Grid Connection of Energy Systems via Inverters, Part 2: Inverter Requirements. Standards Australia: Sydney, Australia, 2020.
Disclaimer/Publisher’s Note: The statements, opinions and data contained in all publications are solely those of the individual author(s) and contributor(s) and not of MDPI and/or the editor(s). MDPI and/or the editor(s) disclaim responsibility for any injury to people or property resulting from any ideas, methods, instructions or products referred to in the content. |
© 2025 by the authors. Licensee MDPI, Basel, Switzerland. This article is an open access article distributed under the terms and conditions of the Creative Commons Attribution (CC BY) license (https://creativecommons.org/licenses/by/4.0/).