Abstract
Successful aquatic ecosystem conversation strategies depend on high-quality data from monitoring studies and improved habitat requirement knowledge. Remote Underwater Video (RUV) is a non-extractive alternative to capture-based techniques for studying and monitoring fish and is increasingly used in smaller channels. This study uses field observations made with waterproof Sony HDR-AS100V action cameras positioned in stream channels to determine species and population during various flow conditions across three sites within the Credit River Watershed, Ontario, Canada. Six fish species were identified, and individual fish lengths were estimated using the inverse square law to proportionally adjust size scales to fish positions relative to the camera. Successful identification and measurements were limited by turbidity, with camera placements in >6 NTU conditions (18% of all placements) resulting in at least one fish observed in the frame. With over 24 h of video recordings with 94 individual video clips, the optimal filming duration was determined to be 20–25 min. RUV surveys provide managers with useful monitoring data regarding fish present in an environment in a cost-effective and efficient manner. Additionally, as the method is largely non-invasive, RUV surveys are especially useful for studying fish behaviour, sensitive or endangered species, and working in difficult-to-access channels (e.g., shallow, faster flow).
1. Introduction
Monitoring initiatives are used to ensure effective ecosystem conservation efforts, and to accomplish this, a firm understanding of biotic and physical conditions across various spatial and temporal scales is needed [1,2,3]. Monitoring fish community composition and abundance has historically relied on physical capture or visual census methods [3,4,5]. Poor visibility [5,6], strong currents, or complex channel structures [7] often hinder conventional techniques. Furthermore, extractive sampling methods can pose a threat to biodiversity [3] and the physical health of the fish, as they may suffer from net abrasion [5] or mortality from electrofishing [8,9].
Increasingly, Remote Underwater Video (RUV) surveys have been used as an alternative to conventional techniques to study fish and can provide several advantages to both the operator and the fish themselves. RUV initiatives typically employ the use of one or more waterproof video cameras to record fish in habitats that may otherwise be difficult to access or observe from above water. Frequently, RUV surveys have been used to estimate species richness, abundance, habitat preferences, and behavioural patterns in high-visibility marine environments [2,3,10]. Apart from Davis et al. [11] and Tweedie [12], documented use within freshwater environments and streams is relatively sparse. However, usage is expected to see a significant increase soon, as novel applications continue to emerge and as the required equipment becomes increasingly robust and affordable [3,5].
There are a range of deployment set-ups for RUVs and various advantages and limitations. The selected RUV sampling regimes need to consider application characteristics and aim to balance precision and cost effectiveness by optimizing the recording time and camera placements [7]. As described elsewhere [5,11], compact waterproof action cameras, such as GoPro® and Sony, offer significant versatility, but have reduced battery life and less data storage compared to systems that have data storage and power supplies wired to on-shore platforms. In studies where longer deployments and/or precise repeat observations are needed, these more permanent systems would be beneficial [5,10]. However, continuous camera deployments can be limited by lens fouling issues [3]. Camera placement may be fixed on mounts that are stationary or moving and positioned either floating, semi-submerged, or on the bed [2]. Using various baits (e.g., crushed sardines, cat food, and sweet corn) to attract fish is well-documented, but a standardized operating protocol has not been adopted [4,7]. Baited RUV surveys have proven effective for detecting mobile species, but less effective for cryptic species [13].
One of the advantages for RUV surveys is that they offer unique and direct observations of fish in complex vegetated habitats [14] with minimal disturbance that may alter fish behaviour [5,10]. Examples include observing fish for extended time periods in areas that are difficult to access [5], allowing researchers to ask questions about fish behaviour, and providing an opportunity to estimate fish abundances in a variety of environments (e.g., highly vegetated ponds [10] and tropical oxbow lakes [2]). RUV surveys outperform conventional methods in studying cryptic, rare, or endangered species [2,13,15]. Additionally, RUV surveys are less likely to disturb natural fish behaviour or cause adverse effects on sensitive species [2,5,10].
RUV surveys inherently produce video archives, which grants operators the ability to review field observations while providing direct evidence to corroborate subsequent analyses. RUV monitoring programs can lead to databases of local fish population and community changes over space and time; these data are necessary to ensure effective biodiversity conservation efforts [2,10]. Finally, archives generated from these surveys permit independent analysis and cross-validation, encouraging open discussion and traceable datasets [3].
RUV survey techniques do have some limitations, generally due to unfavourable survey conditions. Performance in low-light conditions is poor, which limits simple RUV surveys to daylight hours unless additional light sources or cameras are employed (e.g., infrared, white light, or monochrome cameras [2,5]). In addition, turbidity limits visibility and thus impacts quantifying important metrics such as MaxN or species richness from the RUV survey [2,4,5,6].
RUV survey methods are non-extractive, which means that obtaining physical characteristic measurements (e.g., fork length) can be a challenge. For example, physically capturing a fish (e.g., netting or electro-fishing) ensures that the fish is available for direct physical measurements. Stereo-video surveying, another type of remote or passive surveying, has been used to accurately measure fish length and is well-documented and often outperforms estimations from divers in marine environments [16,17]. Stereo-video work requires additional post-processing time and an additional camera per site, which reduces cost effectiveness [17]. It is possible to estimate fish length from a solo video frame, as demonstrated in a laboratory setting by Harvey et al. [16] and in a natural marine environment by Cappo et al. [18]. In a laboratory environment with a fish silhouette, Harvey et al. [16] estimated fish length with reasonable accuracy (standard error = 13.62 mm) at 1–5 m ranges from the camera. As is to be expected, in the controlled laboratory setting, the fish silhouette could be placed directly adjacent to the scale bar and perpendicular to the camera lens; deviations from this positioning resulted in reduced confidence in the estimated lengths [16]. Cappo et al. [18] noted similar constraints when applying this technique in a natural marine environment.
RUV survey footage can be used to quantify fish behaviour and estimate community structure. For example, species richness values (e.g., Simpson’s Diversity Index) and accumulation curves were generated by Cappo et al. [18]. The MaxN metric, the maximum number of individuals observed in one frame at one time, is typically used to limit recounting and overestimating fish population sizes [18]. And there are several variations of this metric, such as Mean-count (MaxN values taken at defined time intervals across a clip are averaged) or MaxN at the time of first sighting.
This publication shares the findings from Tweedie’s MSc thesis completed in 2018 [12]. Our aims here are to report the advantages and shortcomings of RUV surveys for observing a fish community within Ontario freshwater streams during summer conditions. The RUV survey techniques were evaluated on their ability to provide location, community, and estimated fish length data.
2. Methods
2.1. Study Sites
This study repeated site visits to three small-scale (30–60 m long, 5–20 m wide, and <1.2 m deep) reaches within the Credit River watershed in southern Ontario, Canada, to conduct RUV surveys and collect water quality characteristics (Figure 1). Each reach was located within protected areas and remained generally undisturbed by human activity throughout the study period. Sites were selected based on accessibility, as well as the presence of multiple hydrogeomorphic units (e.g., riffles, runs, and pools) to ensure that a diverse set of fish habitats was represented. Moreover, the Credit Valley Conservation Authority has a rich record of fishes known to occur in their various streams and subwatersheds [19,20,21].
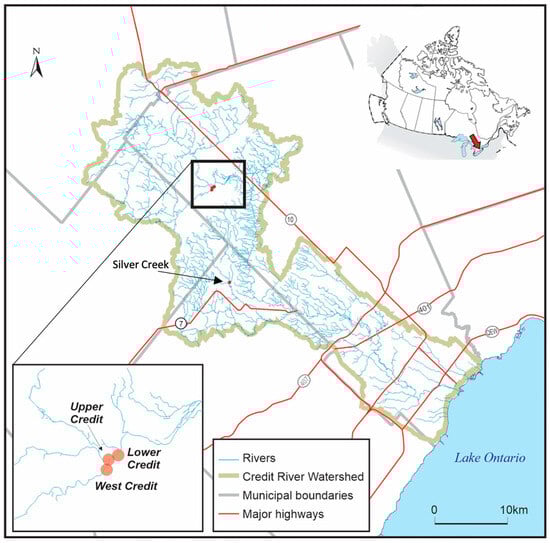
Figure 1.
Study reaches and monitoring station locations throughout the Credit River Watershed in southern Ontario, Canada. Specific monitoring location on Silver Creek, a tributary to the Credit, is labelled, and the sites located closely together are shown in the lower left inset map. The inset map in the top-right corner indicates the Credit River location relative to the Laurentian Great Lakes.
2.1.1. Silver Creek
Silver Creek is a low-order, headwater stream that joins the Credit River. The study reach is within the Silver Creek conservation area: a highly vegetated, forested valley that has limited human activity. The reach is characterized by a series of sand-dominated step pools, intersected by a low-grade, open riffle section dominated by cobble and gravel substrate (Figure 2a). Multiple large wood (LW) structures, large boulders, and aquatic vegetation patches are also present. A LW structure constricted flow and created a scour pool above the crest of the riffle section.
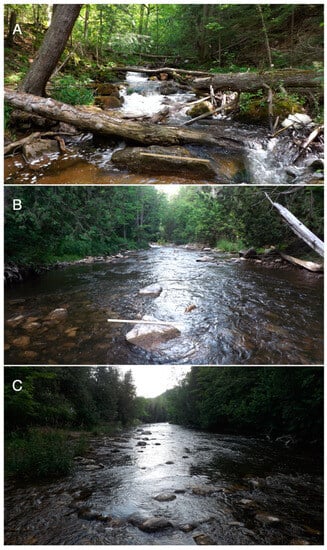
Figure 2.
Photographs of the Silver Creek (A), West Credit (B), and Lower Credit (C) study reaches (see Figure 1 for locations). Flow is toward the camera in all three photos, and a 1 m stick is shown near the centre bottom of each photo for relative scale.
2.1.2. West Credit
The West Credit River site (Figure 2b) is approximately 200 m upstream of the confluence with the main branch (Figure 1) and is in the southernmost portion of Forks of the Credit provincial park. The study reach was 30 m in length and 10 m wide with no significant meandering. Two deep and moderately fast-flowing pools in the upstream section, followed by a shallow riffle section and a distinct mid-channel thalweg, characterize the reach. Flow-impeding LW structures and boulders are present, as well as multiple vegetated areas adjacent to the right bank. Riparian vegetation and canopy cover is notably prevalent in the reach. A large stump protruding from a severely undercut bank hangs over the upstream pool on the left bank, providing potential riparian predatory cover. Gravel and cobble substrate were the dominant bed material type throughout the reach.
2.1.3. Lower Credit
The Lower Credit site is located on the main branch of the Credit River, 300 m below the confluence with the West branch (Figure 1). Spanning 60 m in length, and 20 m wide, this was the largest of the sampled reaches (Figure 2c). The morphology is dominated by riffle- and glide-type flows, with a distinct thalweg present near the left bank. Several LW structures protruding from an undercut left bank impede flow. Riparian vegetation covers roughly 80% of the banks in the reach, with trees and canopy cover dominating the left bank and shrubs and grasses dominating the right bank. Two patches of grasses and several large boulders are also present in the mid sections of the channel.
2.2. Fish Observation Methods
Following RUV methods described in Ebner et al. [5] and Davis et al. [11], fish observations were conducted at each site to determine community composition and estimate fish length. Biweekly surveying at each site in summer 2017 (early June through late August) was completed using Sony HDR-as100v waterproof action cameras. Cameras were fitted with flat lens casings to avoid visual distortion and blurriness caused by using convex lens casings underwater. Videos were filmed in 1080p resolution at 60fps with a 120° field of view. Cameras were mounted to either weighted metal plates or a flexible JOBY® GorillaPod tripod, which was fixed (temporarily) to large cobbles on the channel bed. The cameras were positioned throughout each channel with a measuring rod hammered upright into the bed, which is visible in each frame for size referencing. Ideally, the measuring rods were placed 1 m from the camera in the centre of the frame. However, sometimes this was constrained by the substrate. Once placed, the cameras were left to film for 20–25 min. This filming time was used to maximize camera placements in a day. Up to 12 deployments were performed during each site visit. Video review occurred the following day to ensure proper functioning of each camera, lens fitting, resolution/frame rate settings, and mounts. Consistent review of the videos allowed for continual refinement and optimization of the process.
Video footage was reviewed in detail to determine the species composition in each clip. MaxN, defined by the maximum number of individuals present in a single frame, was determined for each video clip to avoid recounting fish and overestimating population numbers. The geomorphic habitat unit [22] and refuge features (e.g., LW, boulders, or vegetation) utilized by each individual and school were recorded. Fish fork-length estimates were produced with a novel, iterative two-step process using the reference measuring rod and the inverse square law. The inverse square law states that a physical quantity, in this case length perpendicular to the camera (x plane), is inversely proportional to the square of the distance from the source (RUV camera). A procedural overview is described below, and graphical representation of the procedure is provided (Figure 3):
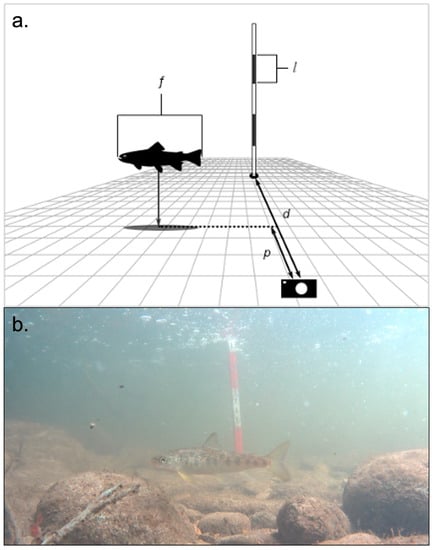
Figure 3.
(a). Graphical representation of the procedure and measurements used to estimate fish length from RUV footage. (b). Still photo from a video recording showing a juvenile Atlantic salmon in the frame on 23 August 2017, 11:27 am at the Lower Credit. The red/white intervals on the scale rod in the photo are 10 cm each, the scale rod is 0.881 m from the camera, and turbidity is 3.7 NTU. It is much easier to estimate the proportional distance from the camera to rod from video. Watching a fish swim and tracking shadows on the bed helps to estimate proportional distance; this is not as apparent in the still photo. In this video, the native screen resolution is 1440 × 900 pixels, PTL is 11.8 pixels per cm, proportional distance (p) is 0.2, and calculated fork-length estimate for the fish is 16.45 cm.
- Establish baseline pixel-to-length (PTL) scale using a video clip with a known filming distance from the rod (di) and a known rod measurement increment (li) (i.e., l is equal to x number of pixels at distance d; Figure 3). This will differ between camera models and lens types.
- Measure pixel length of known rod increment (lmeas) using an on-screen pixel ruler.
- Using the inverse square law, lmeas, and the baseline PTL scale, determine the distance the rod is away from the camera (dmeas). This step may be skipped if distance dmeas is precisely measured in situ.
- Estimate the unitless proportional distance (p) that the fish is from the camera to the rod. For example, if the fish were directly adjacent to the rod, p would equal 1. If the fish were halfway between the rod and the camera, p would equal 0.5. Proportional distance estimates are used instead of actual distance estimates to reduce user bias.
- Convert p to a real length by multiplying with dmeas and, using the inverse square law, establish a new PTL scale for the fish distance location using Equation (1):where C = dili2.PTL = C ∗ (pdmeas)−0.5
- Measure the pixel length of the fish (f) when it is perpendicular to the camera viewing direction and convert to a real length with the new PTL scale.
- Repeat steps 4–6 at least three times per fish, preferably at multiple distances from the camera, and average the resulting estimates. It is imperative that each video clip is analyzed using uniform screen and video player dimensions to avoid alterations in the PTL scales.
Estimated proportional distance biases were reduced by including at least three size estimates per fish measured, typically at different distances, and then averaged to produce a final fork-length estimate. Multiple length estimates were given to objects with known lengths at several distances to investigate precision, as well as tendencies to either over- or underestimate lengths at certain distances. The residual value magnitudes were averaged to produce an overall precision estimate.
2.3. Water Quality Monitoring
Turbidity levels were recorded during site visits using a YSI 600 OMS V2 Multiparameter Water Quality Sonde, sampling NTU levels (±0.3 NTU) once every minute for up to 45 min. The Sonde was placed at the upstream extent of the reach surveyed to avoid turbidity measurements being influenced by bed disturbances during camera placement. Water pressure was continually recorded through the field season with Onset HOBO U20 and U20 L water level loggers, placed within stilling wells at each site. Water pressure values were converted to stage measurements by offsetting for recorded adjacent air pressure.
3. Results
RUV surveys generated 94 video clips and over 24 h of footage. Approximately 39% of the clips successfully captured at least one fish (37/94). In total, 106 individual fish were recorded across all sites (Table 1). Half of all fish (50%) in each recording appeared within the first 4 min, and over 90% were seen within the first 13 min (Figure 4). Six fish species, consisting of minnows (Rhinichthys atratulus, Semotilus atromaculatus), salmonids (Salmo salar, Salvelinus fontinalis, Oncorhynchus mykiss), and suckers (Hypentelium nigricans) were identified, with five unidentifiable individuals. The unidentifiable individuals could not be classified at the species level, but were conclusively identified as juvenile salmonids. Fish species richness was highest in the Lower Credit site, as all six species were observed, whereas the West Credit and Silver Creek sites both exhibited richness values of 4. The Lower Credit site was dominated by the presence of creek chub, and subsequently yielded the lowest Simpson’s Diversity Index value (0.308). This value was slightly higher in Silver Creek (0.332) and West Credit (0.397), reflecting more uniform species abundances.

Table 1.
Site comparisons of video capture success rates, Simpson’s Diversity Index values, and accumulated species richness values of all identified species across all sites.
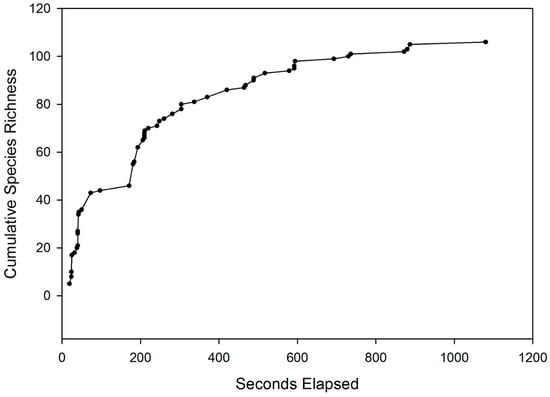
Figure 4.
Combined species accumulation curve showing the time of first sighting across all sites and species. Symbols represent each observation made in this study.
The average MaxN in each successful video clip was 2.16 individuals; however, median and modal values were 1. MaxN distributions across all sites and species exhibit well-defined positive skews. Minnow species were more commonly observed together, with an overall average MaxN value of 3.77, whereas the salmonid species had a lower average MaxN value of 1.56.
Although Atlantic salmon were not observed in the Silver Creek site, they were the most frequently identified species in the study. In total, 19 individuals were identified from 15 successful video clips. Atlantic salmon were most often observed as individuals, which was reflected in their average MaxN value of 1.27 (Table 2). Brook and rainbow trout were less likely to reside as individuals and yielded slightly higher average MaxN values of 1.78 and 1.86, respectively. A total of 16 brook trout were encountered on nine occasions and were the only salmonid species present at all sites. The average brook trout MaxN value was higher in the Silver Creek site (2.17) than both the Lower (1.00) and West Credit (1.00) sites. There were 13 rainbow trout observed over seven occasions in the Lower Credit and Silver Creek sites. Similar to brook trout, average MaxN values were higher for the Silver Creek site (2.00) than for Lower Credit (1.50).
Table 2.
Summary of MaxN values and fish length estimates generated from the RUV footage for all species at each study site.
Blacknose dace were observed five times at the Silver Creek and Lower Credit sites with 14 individuals and an average MaxN of 2.80. MaxN was greater in Silver Creek (7.00) than in Lower Credit (1.75). Although creek chub were observed on eight occasions, a total of 35 individuals were recorded. The respective average MaxN values were higher in the West Credit (5.50) and Lower Credit (4.60) sites and reduced in Silver Creek (1.00). Four northern hog suckers were identified in footage from the Lower Credit and West Credit sites, yielding an average MaxN of 2.00.
Average size estimates were completed and assigned to individuals whenever possible. A total of 14 individuals (13.2% of the total sampled population) across five clips (5.4% of total clips) were unable to be measured due to poor visibility, improper orientation, or insufficient time in a video frame. Length estimate accuracy was reasonable, as the average residual value from the control tests was ±0.69 cm from the real value (standard error: 2.56 cm).
Salmonid species size averages varied across sites (Table 2). Atlantic salmon in the Lower Credit had an average length of 12.94 cm, whereas average length was estimated as 9.79 cm in West Credit. Brook trout individuals were largest in West Credit (10.47 cm) and smallest in the Silver Creek site (8.29 cm). Similarly, rainbow trout were much larger in Lower Credit (11.93 cm) than in Silver Creek (7.94 cm). Larger fish tended to reside in smaller groups, or as individuals. Smaller fish were more likely to reside in groups with MaxN values exceeding 2 (Figure 5). Fish that resided in pairs or individually were 10.10 cm in length on average, whereas the average size of fish residing in groups of three or more was only 6.70 cm. There were no trends in fish length averages across species across sites.
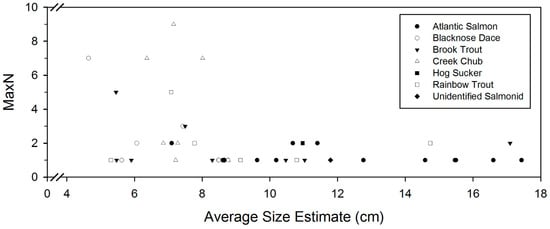
Figure 5.
Size estimates for each species plotted against their respective MaxN values.
Overall, fish observations were higher in pool habitats, with 41 of the 106 total individuals observed in pools (Figure 6). Of the 53 salmonids recorded, 20 were detected in pool habitats and 14 in run habitats. Only 7 of the 53 individuals were detected within riffle habitat units. Pools were especially popular with salmonids in Silver Creek. Of the 32 fish recorded in Silver Creek, only one rainbow trout was observed at the riffle crest, during a period of elevated flow conditions. All other salmonid individuals resided in pool (23) and step-pool (8) habitats.
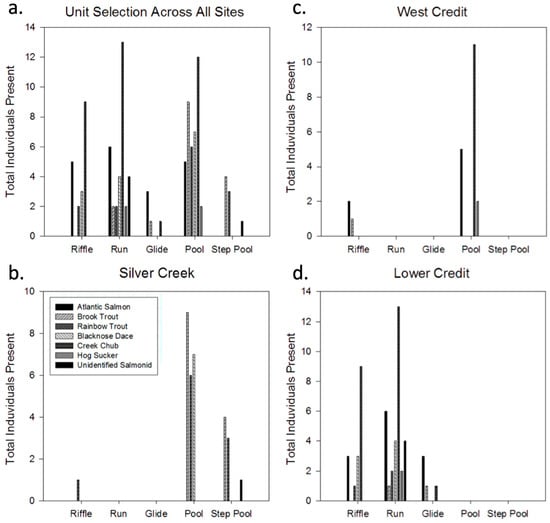
Figure 6.
Physical habitat unit selection by all fish species (a) across all sites, (b) in Silver Creek, (c) in West Credit, and (d) in Lower Credit. Values represent the total number of individuals of a certain species identified in a particular habitat throughout the entire sampling regime. The legend in (b) applies to all panels.
Recorded turbidity levels across all sites ranged from 1.90 NTU to 26.28 NTU. Turbidity generally increased with stage at the Lower Credit, Upper Credit, and Silver Creek sites [12]. No similar or well-defined pattern was observed at West Credit. The lowest turbidity levels were seen consistently at Silver Creek, as levels never surpassed 5.75 NTU and the average was 2.87 NTU. The average turbidity level of 9.32 NTU recorded in the Upper Credit site was considerably higher for than the other sites [12].
Turbidity was found to have a significant effect on the probability that a given video clip would capture at least one detectable fish (p-value < 0.05). When turbidity levels were below 6 NTU, an overall success rate of 50% was achieved, whereas this rate decreased to 18% when turbidity levels surpassed 6 NTU. Fish sighting success rates were highest at Silver Creek (56%), where turbidity was lowest during all sampling days [12].
4. Discussion
RUV surveys are a cost-effective alternative to physical capture methods for collecting data regarding fish community characteristics and habitat use. Moreover, the species observed via RUV surveys coincide with results published elsewhere [19,20]. Fish location, size, MaxN, and species of freshwater fish present were accurately determined in this study using a record of underwater footage spanning the summer season across several sites. Video processing to determine species and MaxN data typically took 40–50 min for each 20 min clip, depending on visibility conditions and the number of fish present. The length estimates took 15–20 min per fish once the baseline PTL scale was established (Figure 3).
RUV recordings of 20–25 min in length are sufficient for this application as the species accumulation curve is asymptotic by 10 elapsed minutes (600 s) (Figure 4). Similar filming times are recommended for studies focusing on station-holding fish (e.g., Atlantic salmon), as this filming time allowed for an increased number of camera deployments, subsequently increasing the number of fish detected. A longer filming duration would not increase the chances of detecting more fish. However, it would increase the viewing time of a given individual, which could be beneficial for studying fish behaviour and habitat interaction.
Salmonid MaxN values were lower than for other species (Figure 5), which is expected as salmonids are a territorial fish and compete for optimal foraging locations [23,24,25]. Conversely, minnow species were observed more frequently, yielding a higher average MaxN value, as these fish tend to follow a pattern of shoaling behaviour to decrease predation risks [26,27]. The observed minnow shoaling may either be a predator avoidance mechanism or simply an aggregation of individuals in a high-quality foraging location [26].
The proposed fish-sizing methodology was effective, easy to use, and cost-efficient in this application. A notable advantage to using this approach is that no additional cameras or post-processing software packages were needed. Pixel measurements were completed using a simple media player (e.g., Quicktime Player or VLC), and the length estimates were calculated with basic spreadsheet programs (e.g., Excel). Difficulties were experienced with several clips due to poor visibility, fish viewing times, and fish viewing angles. Similar to observations noted by both Harvey et al. [16] and Cappo et al. [18], our success was ultimately limited by the orientation and position of the fish. Several instances occurred where the fish in the frame never oriented itself perpendicular to the camera, thereby eliminating the possibility of generating accurate, repeatable measurements.
Considering the average length of the recorded fish (9.48 cm), the ±0.69 cm fish length estimate accuracy (standard error: 2.56 cm) suggests that this method is effective in providing rapid fish length estimates with reasonable certainty. Length estimates could be improved with additional measuring reference rods, similar to the control-test design used in Harvey et al. [16]. Specifically, this would improve relative distances estimates and increase the reliability of the adjusted pixel-to-length scale and length estimates. Accounting for fisheye/wide-angle lens distortion would also be beneficial in increasing the accuracy of this method, as objects in the outer margins of the frame appear slightly compressed and smaller than they would in the centre of the frame. Taking the necessary steps to eliminate lens distortion requires additional post-processing time, computing power, and software packages such as GoPro® Studio for entire video clips or Adobe Photoshop for still frames.
Additional difficulties were incurred when the fish only appeared in areas considerably close to or far from the camera, or in areas with dense aquatic vegetation or debris. Orienting the viewing angle to avoid such issues was sometimes challenging due to the inability to watch live-feed video from the cameras. This issue was also noted by Davis et al. [11] while viewing fish in ice-covered streams. Although a user is typically able to wirelessly connect to the cameras to view live-feed video on mobile devices, this connectivity is severely limited when the camera is underwater.
As described above, turbidity limits successful recordings, as illustrated by the difference in success rates above and below 6 NTU. It is possible that several fish were present in the footage taken at above 6 NTU but remained undetectable/unidentifiable due to the turbidity. This was especially true when attempting to identify juvenile salmonids to the species level, as many species are similar in appearance before reaching maturity. Considering this information, the use of underwater video to monitor fish communities is best suited for clear water streams during daylight conditions. This recommendation is consistent with previous studies [2,4,10]. Additional difficulties were associated with finding suitable camera placements within exceptionally deep or high-velocity locations. Heavily weighted camera platforms can remedy velocity-related limitations but come at the expense of transportability and ease of placement.
The flexible JOBY® GorillaPod tripod mount served very well in this study. The flexible arms allowed the camera to be freely positioned and oriented on the channel bed to optimize the field of view in the resulting video. Due to its non-streamlined silhouette, difficulties were incurred when attempting to place the camera in high-velocity areas. Thus, this tripod is best suited for pools or other areas of lower velocity and can be replaced by weighted metal plate mounts in high-velocity areas.
Data generated from RUV footage have a variety of potential applications within freshwater ecosystems conservation and management efforts and complement existing survey techniques. RUV surveys are particularly advantageous for studies focused on animal behaviour and habitat use. This was illustrated by Butler and Rowland [28], who, by using a combination of RUV and radio tagging techniques, made the important discovery that an endangered Australian freshwater cod species (Maccullochella ikei) parentally guards its eggs and larvae during spawning periods. Conventional shore-based or snorkel observation techniques should be complemented by RUV to help reduce observer bias. This could be especially beneficial when dealing with cryptic and sheltering species, which tend to be underrepresented in observational surveys [2,4,13,15]. This was illustrated in the results from Silver Creek, as many fish were visible from the shore but additional individuals and their respective species were unidentifiable without the RUV. Most notably, the two mature brook trout would have not been identified without RUV, as they were either sheltering out of sight from the shore or swimming far too fast to observe. RUV surveys also provide a complementary, reviewable record, in which additional data could be reviewed and extracted in the future, whereas data derived by in situ, real-time field techniques (e.g., shore-based or snorkel techniques) are limited to whatever the user records in that moment.
RUV-derived data also have several potential applications regarding aquatic habitat suitability modelling. Habitat suitability is often modelled and expressed in terms of Weighted Usable Area (WUA), defined as the total surface area of a given reach, weighted by its predicted suitability [29,30]. Due to the relative ease and efficiency of generating fish observations at multiple locations throughout a channel, producing the observed habitat preference curves required for WUA calculations may be conducted with RUV surveys. Additionally, RUV data can also serve to validate habitat suitability predictions. This is particularly important for bioenergetics-based drift foraging habitat suitability models, as efforts have focused significantly more on model development rather than output validation [31]. The fish size, MaxN, and behavioural data from RUV surveys can be utilized to test theories relating habitat use to dominance hierarchies, shoaling effects, or other behavioural aspects.
5. Conclusions
Remote underwater video surveys are cost-efficient and non-invasive techniques to effectively satisfy data requirements of monitoring programs to ensure that conservation efforts are successful. Additionally, RUV surveys represent an excellent opportunity to explore in situ aquatic behavioural ecology by providing unparalleled, direct visual records of the species, with reduced risk for disturbance effects compared to conventional methods. There is a significant potential upside in studies and programs that deal with particularly sensitive, cryptic, or endangered species, as it is far less intrusive than capture-based alternatives. This study demonstrates that RUV surveying techniques can generate fish community data and produce fish length estimates. The 20 min filming period in this study proved to be sufficient and effective at maximizing salmonid location observations while minimizing the risk of missing a fish in any given location. Applications concerned with cryptic species or fish behaviour may warrant a lengthier filming period. Additional development and validation of non-stereo video sizing estimates is recommended to further reduce the overall cost and increase the amount of useful and derivable data. RUV is likely to see an increase in adaption in the future, as the technology becomes increasingly robust, miniaturized, and affordable.
Author Contributions
Conceptualization, J.B.T., J.M.C. and P.V.V.; methodology, J.B.T., J.M.C. and P.V.V.; validation, J.B.T.; formal analysis, J.B.T. and J.M.C.; investigation, J.B.T. and J.M.C.; resources, J.M.C. and P.V.V.; data curation, J.M.C. and J.B.T.; writing—original draft preparation, J.B.T. and J.M.C.; writing—review and editing, J.M.C., J.B.T. and P.V.V.; visualization, J.B.T. and J.M.C.; supervision, J.M.C.; project administration, J.M.C.; funding acquisition, J.M.C. and P.V.V. All authors have read and agreed to the published version of the manuscript.
Funding
This research was funded by a Canadian Foundation for Innovation, grant number 31341. The APC was funded by general research funds held by J.C. at University of Guelph.
Institutional Review Board Statement
Not applicable.
Informed Consent Statement
Not applicable.
Data Availability Statement
This article is based on MSc. Thesis research conducted by J.T. and available at http://hdl.handle.net/10214/14273. Some data are proprietary; available data are posted here: https://doi.org/10.6084/m9.figshare.21970673.v2; please contact the corresponding author for details (jaclyn.cockburn@uoguelph.ca).
Acknowledgments
Expert field and technical support was provided by Alex Scott and Sandy McLaren, and manuscript production support was provided by Marie Puddister and Skylar Barclay, all in the Department of Geography, Environment and Geomatics at University of Guelph.
Conflicts of Interest
The authors declare no conflict of interest. The funders had no role in the design of the study; in the collection, analyses, or interpretation of data; in the writing of the manuscript; or in the decision to publish the results.
References
- King, A.J.; Gawne, B.; Beesley, L.; Koehn, J.D.; Nielsen, D.L.; Price, A. Improving Ecological Response Monitoring of Environmental Flows. Environ. Manag. 2015, 55, 991–1005. [Google Scholar] [CrossRef]
- King, A.J.; George, A.; Buckle, D.J.; Novak, P.A.; Fulton, C.J. Efficacy of Remote Underwater Video Cameras for Monitoring Tropical Wetland Fishes. Hydrobiologia 2018, 807, 145–164. [Google Scholar] [CrossRef]
- Mallet, D.; Pelletier, D. Underwater Video Techniques for Observing Coastal Marine Biodiversity: A Review of Sixty Years of Publications (1952–2012). Fish. Res. 2014, 154, 44–62. [Google Scholar] [CrossRef]
- Ebner, B.C.; Morgan, D.L. Using Remote Underwater Video to Estimate Freshwater Fish Species Richness: Video-Based Survey of Freshwater Fishes. J. Fish. Biol. 2013, 82, 1592–1612. [Google Scholar] [CrossRef] [PubMed]
- Ebner, B.C.; Starrs, D.; Morgan, D.L.; Donaldson, J.A.; Doody, J.S.; Cousins, S.; Butler, G.; Tonkin, Z.; Beatty, S.; Broadhurst, B.; et al. Emergence of Field-Based Underwater Video for Understanding the Ecology of Freshwater Fishes and Crustaceans in Australia. J. R. Soc. W. Aust. 2014, 97, 287–296. [Google Scholar]
- Ebner, B.; Thiem, J.; Lintermans, M.; Gilligan, D. Brendan Video Monitoring in Upland Streams. In An Ecological Approach to Re-establishing Australian Freshwater Cod Populations: An Application to Trout Cod in the Murrumbidgee Catchment; Canberra Parks, Conservation & Lands: Canberra, Australia, 2006; pp. 95–104. [Google Scholar]
- Schmid, K.; Reis-Filho, J.A.; Harvey, E.; Giarrizzo, T. Baited Remote Underwater Video as a Promising Nondestructive Tool to Assess Fish Assemblages in Clearwater Amazonian Rivers: Testing the Effect of Bait and Habitat Type. Hydrobiologia 2017, 784, 93–109. [Google Scholar] [CrossRef]
- Sloat, M.R.; Baker, P.F.; Ligon, F.K. Estimating Habitat-Specific Abundances of PIT-Tagged Juvenile Salmonids Using Mobile Antennas: A Comparison with Standard Electrofishing Techniques in a Small Stream. N. Am. J. Fish. Manag. 2011, 31, 986–993. [Google Scholar] [CrossRef]
- Ellender, B.R.; Becker, A.; Weyl, O.L.F.; Swartz, E.R. Underwater Video Analysis as a Non-Destructive Alternative to Electrofishing for Sampling Imperilled Headwater Stream Fishes: Underwater video analysis as an alternative stream sampling technique. Aquatic. Conserv. Mar. Freshw. Ecosyst. 2012, 22, 58–65. [Google Scholar] [CrossRef]
- Wilson, K.L.; Allen, M.S.; Ahrens, R.N.M.; Netherland, M.D. Use of Underwater Video to Assess Freshwater Fish Populations in Dense Submersed Aquatic Vegetation. Mar. Freshw. Res. 2015, 66, 10. [Google Scholar] [CrossRef]
- Davis, L.; Cockburn, J.; Villard, P.V. Deploying Action Cameras to Observe Fish in Shallow, Ice-Covered Streams. J. Freshw. Ecol. 2016, 32, 193–198. [Google Scholar] [CrossRef]
- Tweedie, J. Evaluating Juvenile Salmonid Physical Habitat Use and Characteristics Using a Spatially Explicit Bioenergetics Model and Remote Underwater Video Surveys. Master’s Thesis, University of Guelph, Guelph, ON, USA, 2018. [Google Scholar]
- Lowry, M.; Folpp, H.; Gregson, M.; Suthers, I. Comparison of Baited Remote Underwater Video (BRUV) and Underwater Visual Census (UVC) for Assessment of Artificial Reefs in Estuaries. J. Exp. Mar. Biol. Ecol. 2012, 416–417, 243–253. [Google Scholar] [CrossRef]
- Dibble, E.D.; Eric, D.; Killgore, K.J.; Harrel, S.L. Assessment of Fish-Plant Interactions; Environmental Laboratory (U.S.): Washington, DC, USA, 1997. [Google Scholar]
- Fulton, C.; Starrs, D.; Ruibal, M.; Ebner, B. Counting Crayfish: Active Searching and Baited Cameras Trump Conventional Hoop Netting in Detecting Euastacus Armatus. Endang. Species. Res. 2012, 19, 39–45. [Google Scholar] [CrossRef][Green Version]
- Harvey, E.; Shortis, M.; Stadler, M.; Cappo, M. A Comparison of the Accuracy and Precision of Measurements from Single and Stereo-Video Systems. Mar. Technol. Soc. J. 2002, 36, 38–49. [Google Scholar] [CrossRef]
- Shortis, M.R.; Ravanbakskh, M.; Shaifat, F.; Harvey, E.S.; Mian, A.; Seager, J.W.; Culverhouse, P.F.; Cline, D.E.; Edgington, D.R. A Review of Techniques for the Identification and Measurement of Fish in Underwater Stereo-Video Image Sequences; Remondino, F., Shortis, M.R., Beyerer, J., Puente León, F., Eds.; SPIE Privacy Policy: Munich, Germany, 2013; p. 87910G. [Google Scholar]
- Cappo, M.; Speare, P.; De’ath, G. Comparison of Baited Remote Underwater Video Stations (BRUVS) and Prawn (Shrimp) Trawls for Assessments of Fish Biodiversity in Inter-Reefal Areas of the Great Barrier Reef Marine Park. J. Exp. Mar. Biol. Ecol. 2004, 302, 123–152. [Google Scholar] [CrossRef]
- Credit Valley Conservation Authority Fishes of the Credit River Watershed 2002. Available online: https://files.cvc.ca/cvc/uploads/2011/02/FishoftheCRW.pdf (accessed on 16 April 2023).
- Allen, B.; Mandrak, N.E. Historical Changes in the Fish Communities of the Credit River Watershed. Aehm 2019, 22, 316–328. [Google Scholar] [CrossRef]
- Ministry of Natural Resources and Credit Valley Conservation Credit River Fisheries Management Plan: A Cooperative Management Planning Initiative for the Credit River Fishery 2002. Available online: https://files.cvc.ca/cvc/uploads/2012/06/credit-river-fisheries-mgmplan.pdf (accessed on 16 April 2023).
- Newson, M.D.; Newson, C.L. Geomorphology, Ecology and River Channel Habitat: Mesoscale Approaches to Basin-Scale Challenges. Prog. Phys. Geogr. 2000, 24, 195–217. [Google Scholar] [CrossRef]
- Huntingford, F.A.; Metcalfe, N.B.; Thorpe, J.E.; Graham, W.D.; Adams, C.E. Social Dominance and Body Size in Atlantic Salmon Parr, Salmo Solar L. J. Fish. Biol. 1990, 36, 877–881. [Google Scholar] [CrossRef]
- Metcalfe, N.B. The Interaction between Behavior and Physiology in Determining Life History Patterns in Atlantic Salmon (Salmo Salar). Can. J. Fish. Aquat. Sci. 1998, 55, 93–103. [Google Scholar] [CrossRef]
- Thornton, E.J.; Duda, J.J.; Quinn, T.P. Influence of Species, Size and Relative Abundance on the Outcomes of Competitive Interactions between Brook Trout and Juvenile Coho Salmon. Ethol. Ecol. Evol. 2017, 29, 157–169. [Google Scholar] [CrossRef]
- Freeman, M.C.; Grossman, G.D. Group Foraging by a Stream Minnow: Shoals or Aggregations? Anim. Behav. 1992, 44, 393–403. [Google Scholar] [CrossRef]
- Peuhkuri, N. Size-Assortative Shoaling in Fish: The Effect of Oddity on Foraging Behaviour. Anim. Behav. 1997, 54, 271–278. [Google Scholar] [CrossRef] [PubMed]
- Butler, G.L.; Rowland, S.J. Using Underwater Cameras to Describe the Reproductive Behaviour of the Endangered Eastern Freshwater Cod Maccullochella Ikei. Ecol. Freshw. Fish 2009, 18, 337–349. [Google Scholar] [CrossRef]
- Bovee, K.D.; Cochnauer, T. Development and Evaluation of Weighted Criteria, Probability-of-Use Curves for Instream Flow Assessments: Fisheries; Cooperative Instream Flow Service Group, Western Energy and Land Use Team, Office of Biological Services, Fish and Wildlife Service, U.S. Department of the Interior Report: Washington, DC, USA, 1978.
- Hayes, J.W.; Goodwin, E.; Shearer, K.A.; Hay, J.; Kelly, L. Can Weighted Useable Area Predict Flow Requirements of Drift-Feeding Salmonids? Comparison with a Net Rate of Energy Intake Model Incorporating Drift–Flow Processes. Trans. Am. Fish. Soc. 2016, 145, 589–609. [Google Scholar] [CrossRef]
- Rosenfeld, J.S.; Bouwes, N.; Wall, C.E.; Naman, S.M. Successes, Failures, and Opportunities in the Practical Application of Drift-Foraging Models. Environ. Biol. Fish. 2014, 97, 551–574. [Google Scholar] [CrossRef]
Disclaimer/Publisher’s Note: The statements, opinions and data contained in all publications are solely those of the individual author(s) and contributor(s) and not of MDPI and/or the editor(s). MDPI and/or the editor(s) disclaim responsibility for any injury to people or property resulting from any ideas, methods, instructions or products referred to in the content. |
© 2023 by the authors. Licensee MDPI, Basel, Switzerland. This article is an open access article distributed under the terms and conditions of the Creative Commons Attribution (CC BY) license (https://creativecommons.org/licenses/by/4.0/).