Abstract
Background: During an apnea, oxygen depletion occurs at all tissue levels, so apnea duration is influenced by the mammalian dive reflex, which includes a bradycardia resulting in reduced cardiac oxygen consumption. This study aimed to examine the relationships between heart rate (HR), peripheral estimation of O2 (SpO2), deltoid and respiratory muscle oxygenation (SmO2), and apnea duration. Methods: The study included 10 breath-hold divers (BHD), 39 ± 10 years of age, with body height of 184.3 ± 3.5 cm, body mass of 84.0 ± 9.2 kg, and 16.2 ± 9.7 years of apnea experience. The BHD performed three preparatory apneas followed by three maximal apneas with 5 min of supine rest between each apnea. During all apneas (duration, 115–323 s; involuntary breathing movements (IBMs), 7–35), SmO2 (measured via NIRS on intercostals (respiratory) and deltoid (locomotor) muscles), heart rate, and SpO2 (measured via forehead sensor) were obtained. Results: The smallest disagreement in oxygen levels was between intercostal SmO2 and SpO2 during the easy-going phase (no IBMs), whereas deltoid desaturation values were more variable. During the struggle phase, Intercostal SmO2, moderately, and Deltoid SmO2, strongly, differed from SpO2. Correlations between apnea duration and O2 saturation showed that only Intercostal SmO2 (r = −0.71; p = 0.03) was significantly related to apnea duration. There was also a significant correlation between HR and SpO2 in the struggle phase (r = −0.58; p = 0.05). Conclusions: These findings suggest that during the struggle phase, SpO2 and SmO2 are not highly connected and that local and systemic oxygen levels in the blood are depleted at different rates. Furthermore, the HR response during the struggle phase affected only SpO2, which indicates that lowering the heart rate may help prevent more rapid deoxygenation. Lastly, the intercostal trend of deoxygenation could be interpreted as respiratory muscle work, suggesting that the increased work of respiratory muscles may prolong apnea duration.
1. Introduction
The human diving response (DR) is defined as the physiological adaptations to a voluntary breath-hold (apnea) that promote the efficient use of oxygen [1,2,3]. This response is potentiated by face immersion in cold water [4]. Even though cold receptors initiate this potentiation, a dry, static breath-hold also initiates the DR [5,6]. In both cases, the DR induces strong selective vasoconstriction to the periphery and a heart rate reduction, known as bradycardia. The diving bradycardia is caused by increased cardiac vagal activity [7,8]. This reduction in heart rate reduces cardiac metabolism of oxygen, thereby conserving oxygen stores and delaying the onset of potential hypoxia-related consequences [9]. At the same time, peripheral vasoconstriction is caused by increased sympathetic activity [10]. Vasoconstriction to the periphery ensures that the brain, heart, and adrenal glands are prioritized to receive oxygen-rich blood via centralization of the blood volume [11].
These physiological adaptations occur differently throughout the duration of apnea. Specifically, apnea is divided into two main phases: the easy-going phase and the struggle phase [12]. The easy-going phase is characterized by a slow accumulation of CO2 and a reduction in PO2 with no breathing movements, whereas the struggle phase occurs when breath-hold divers (BHD) experience a strong urge to breathe due to the sufficient accumulation of arterial CO2 and reduction in PO2 that induces involuntary breathing movements (IBM), by simulating chemoreceptors [13,14]. Even though there are multiple physiological responses during such a prolonged period without air, Bain, Drvis, Dujic, MacLeod and Ainslie [12], in their review, state that apnea preparation, VO2 storage, and VO2 economy play key roles in apnea duration. Following this and the fact that apnea is performed with limited oxygen availability stored only in the lungs, efficient oxygen consumption is a main priority in order to perform a prolonged apnea [12].
The bradycardia and vasoconstriction induced by DR reduce cardiac metabolism, thereby improving O2 economy and consequently reducing the production of CO2 [12]. Hence, the real-time monitoring and analysis of O2 circulation, consumption, and storage, on both local muscle and peripheral oxygen saturation levels, could be valuable determinants of BHD performance. Previous studies determined how local muscle O2 saturation changes during an apnea [15,16]. The respiratory muscles desaturated and recovered differently from other locomotor muscles [15], which was explained by the interaction with IBMs during the struggle phase. However, peripheral estimation of O2 saturation (SpO2) decreased during both phases of the apnea [16].
Previous studies have defined the changes in tissue oxygenation in non-respiratory muscles and peripheral tissues that occur during the diving-induced bradycardia and decrease in oxygen saturation [11,17,18]. However, no study to date has characterized the influence of these diving-induced changes on the respiratory muscles. To fill this gap, the current study aimed to examine the relationship between local respiratory muscle oxygenation, heart rate, and peripheral oxygen saturation during maximal static apnea in elite BHDs. We also determined which oxygenation parameters (local muscle or peripheral) were related to apnea duration. Lastly, we wanted to determine the difference between peripheral estimation (SpO2) and local muscle oxygen saturation (SmO2) during apneas in elite BHD.
2. Materials and Methods
2.1. Experimental Design
The sample of participants consisted of 10 BHD. Participants arrived at the laboratory 30–45 min before the start of the experiments for instrumentation and explanation of the procedures. They had abstained from food for at least 4 h. All experimental procedures were performed in accordance with the Declaration of Helsinki on the treatment of human participants and were approved by the Human Research Protection Program at Northern Arizona University (approval number: 2161517-4) and the Ethical Committee of the University of Split Faculty of Kinesiology (approval number: 2181-205-02-05-24-007). Informed, written consent was obtained from each participant. All experiments were carried out in a climate-controlled room (22–24 °C).
On each participant, anthropometric and spirometry measures were performed preceding the apnea protocol. Next, participants performed 3 preparatory apneas, targeting 10 IBMs with the first one done on functional residual capacity and the other two on total lung capacity. All preparatory apneas were done as submaximal with 2.5 min of rest in between. The preparation was followed by 3 maximal apneas with 5 min of rest between each maximal apnea. The detailed protocol has been described previously [15,19,20].
2.2. Anthropometric and Spirometry Indices
Anthropometric indices included body height, body mass, and body fat percentage. Body mass and body fat percentage were assessed with the bioimpedance scale (Tanita BC 418 scale; Tokyo, Japan). Body height was determined with a Tanita HR-001 anthropometer (Tanita; Tokyo, Japan).
Baseline pulmonary function, including forced vital capacity (FVC), forced expiratory volume in 1 s (FEV1), and FEV1/FVC ratio, was determined using computerized spirometry (CPFS/D Spirometer; MedGraphics; St. Paul, MN, USA) and conducted and reported per Societal standards and using appropriate predictive equations [21].
2.3. Peripheral Arterial Oxygen Saturation and Local Muscle Oxygenation Procedure
Peripheral estimates of arterial oxygen saturation (SpO2) and heart rate (HR) were continuously measured using a forehead sensor in 8 participants (Nellcor, Oximax N-600 pulse oximeter, Tyco, Mansfield, MA, USA) that has been validated against direct measures of arterial oxygen saturation in the range of SaO2 = 63.5–99.5% [22]. Because of a technical malfunction in 2 participants, this measurement was taken only from 8, to ensure the quality of data acquisition.
Muscle oxygenation and blood volume changes in the muscles were measured by a commercially available continuous-wave near-infrared spectroscopy (NIRS) sensor (Moxy Monitor; FortioriDesigns LLC, Hutchinson, MN, USA) [23]. A NIRS sensor was placed over the area of the following muscles: external intercostal muscles (7th and 8th intercostal spaces) and deltoid muscle of the dominant side. The placement and proper fixing of the device followed the protocol from [23]. Participants’ body fat percentage was low (14.4 ± 3.8%), and previous work has suggested that adipose tissue thickness < 15 mm is considered negligible and would likely have no impact on NIRS results, so no correction factors were made [24]. The main parameters calculated from NIRS were muscle oxygen saturation (SmO2) and total hemoglobin (tHb). tHb is derived as the sum of oxygenated (O2Hb) and deoxygenated hemoglobin (HHb) in the measured region (tHb = O2Hb + HHb) and is indicative of a change in the blood volume of the muscle. On the other hand, SmO2 is the fraction of O2Hb compared to tHb (SmO2 = O2Hb/tHb) and is defined as the percentage of oxygenated hemoglobin and myoglobin relative to the total quantity of chromophores present in the muscle tissue at a certain moment.
2.4. Data Acquisition and Statistical Analysis
From the main variables of both NIRS and forehead sensor (SmO2, tHb, SpO2, and HR), we calculated trends of change (the difference between the starting and ending point of a range over time). The trends were calculated for the easy-going, struggle, and recovery phases, as a change in value during the time period (i.e., duration of the easy-going or struggle phase). Additionally, the means of absolute values were calculated for different phases of the apnea (easy-going phase, struggle phase, and recovery). The means of easy-going and struggle phases were defined in the beginning (0–33%), middle (34–66%), and end (67–100%) of the apnea duration. Also, to determine the relationship between SmO2 and SpO2, the percentage of differences between values and baseline at the beginning of apnea was calculated. The statistical analyses were done on the longest apnea out of the 3 maximal ones.
Descriptive and physiological data are presented as pooled means ± SD. To determine the estimation difference between SpO2 and SmO2, a Bland–Altman plot was used to calculate bias, and upper and lower limits. The results from the Bland–Altman plot were explained as differences in 3 categories: small (low bias, small limits of agreement), moderate (low or large bias, small limits of agreement), or large (large bias, large limits of agreement) [25]. Pearson’s correlation was used to determine the relation among all measured variables.
Statistica version 13.0 (Dell Inc., Austin, TX, USA) was used for the analyses, and a level of 95% (p < 0.05) was applied.
3. Results
Participant Characteristics
The means of the participant characteristics were as follows: age, 39 ± 10 years; body mass, 84.0 ± 9.2 kg; body height, 184.3 ± 3.5 cm; and body fat, 14.4 ± 4.4%. Three participants were national team competitors who participated in international competitions, and others would be considered moderate BHD athletes based on their apnea length, with a mean training experience of 16.2 ± 9.7 years. At the time of the study, they all self-reported to be healthy. Demographic, anthropometric characteristics, and PFT data are shown in Table 1.

Table 1.
Demographic data of participants (N = 10).
Analysis of the diver responses during maximal static apnea (Figure 1) revealed that the onset of the struggle phase was followed by greater oxygen desaturation and a decreased heart rate. Moreover, tHb had a tendency toward increasing in the intercostal muscles and slightly decreasing in the deltoid muscles.
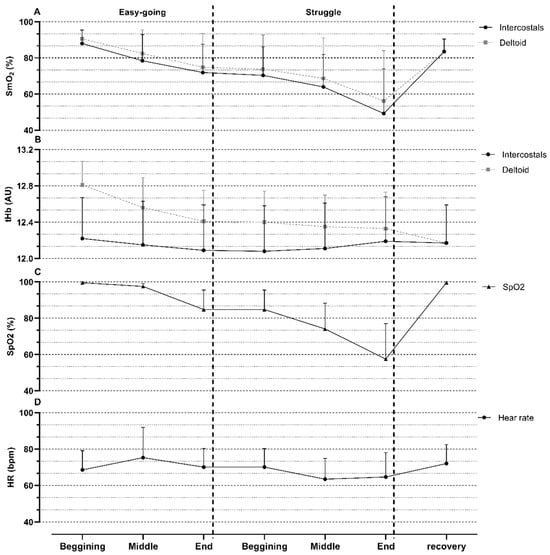
Figure 1.
Means and standard deviations of various measured parameters during maximal apnea. (A) muscle oxygenation (SmO2) in Intercostal and Deltoid muscles; (B) total hemoglobin (tHb) in Intercostal and Deltoid muscles; (C) oxygen saturation (SpO2); (D) heart rate (HR). AU—arbitrary units; bpm—beats per minute.
Furthermore, the Bland–Altman plot revealed that the smallest difference was between intercostal SmO2 and SpO2 during the easy-going phase (bias = −5.78; lower = −20.53; Upper = 9.07), whereas deltoid SmO2 had moderate differences (bias = −4.89; lower = −24.80; Upper = 15.01). During the struggle phase, intercostal SmO2 moderately (bias = −1.96; lower = −21.91; Upper = 17.99) and deltoid SmO2 strongly differed from SpO2 (bias = 0.47; lower = −32.14; Upper = 33.07). These moderate and strong differences were mostly seen during stronger desaturations in the struggle phase (−20–50%) (Figure 2).
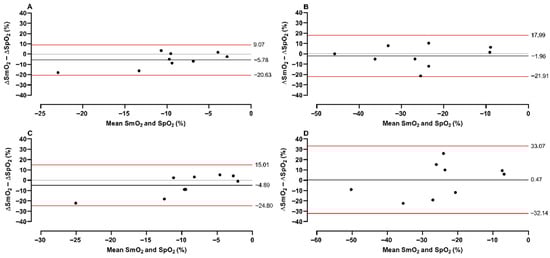
Figure 2.
A Bland–Altman plot of SmO2 and SpO2. The plot represents differences and means between variables, with a red line showing limits and a black line showing bias. The plot was conducted for intercostal (upper panels) and deltoid (lower panels) muscles during the easy-going phase (A,C) and struggle phase (B,D).
There was no significant correlation between the measured changes of oxygenation (SmO2 and SpO2) during the easy-going phase and total duration of apnea (r = −0.07–0.10; p = 0.80–0.90) (Figure 3). Furthermore, during the struggle phase, intercostal oxygen saturation was significantly related to the duration of apnea (r = −0.71; p = 0.03). Peripheral and deltoid oxygen saturation were not significantly related to duration of apnea, r = −0.43; p = 0.21, and r = −0.57; p = 0.11, respectively.
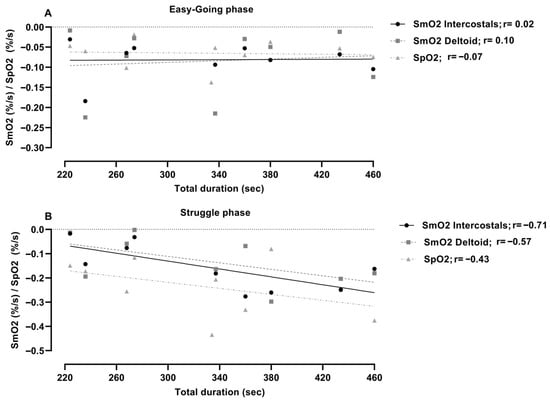
Figure 3.
Correlation analysis of muscle oxygenation (SmO2) and peripheral oxygen saturation (SpO2) with a total duration of apnea during (A) easy-going and (B) struggle phase.
Correlation analysis among measured trends during the easy-going phase showed that muscle saturation did not relate significantly to heart rate, in either muscle groups or SpO2 (r = 0.03–0.14; p = 0.78–0.94) (Figure 4). The struggle-phase heart rate was not significantly correlated to the measured oxygenation trends in the muscles (r = 0.03–0.06; p = 0.88–0.94), but was significantly associated with SpO2 (r = −0.58; p = 0.05).
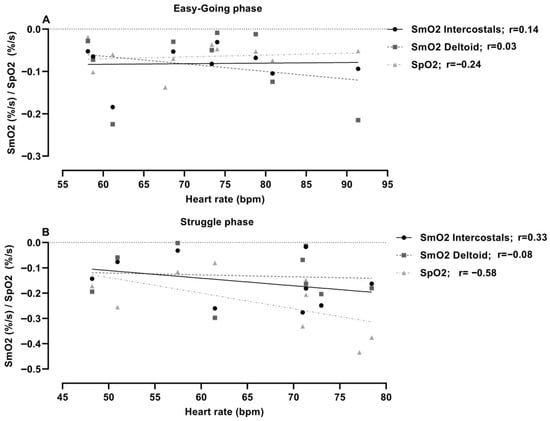
Figure 4.
Correlation analysis between muscle oxygenation (SmO2) and heart rate trend during (A) easy-going and (B) struggle phase.
4. Discussion
This study aimed to examine the relationships among deltoid and respiratory muscle oxygenation, heart rate, and peripheral oxygen saturation during maximal static apneas in elite BHDs. Three main findings in the current study were: (1) the duration of apnea was highly related to the desaturation of intercostals during the struggle phase; (2) lower heart rate was related to slower peripheral oxygen desaturation during the struggle phase; (3) muscle and peripheral desaturation differences were more pronounced during the struggle phase than the easy-going phase in both muscle groups.
4.1. Local Muscle Oxygen Saturation and Apnea Duration
According to Schagatay [26], three main factors (total body gas storage, tolerance to asphyxia, and metabolic rate) determine the limits of static apnea. The author concluded that these factors could be enhanced with training and further prolonging apnea duration. Following this, and as mentioned above, apnea duration relies on oxygen consumption and conservation [12]. However, respiratory muscle work and deoxygenation could be observed from our results. Such an effect may act to prolong a breath hold in the way that a higher workload of these muscles helps push oxygenated blood towards the heart and brain to prevent blacking out.
The results of our study indicate that the BHD who have longer apnea durations perceive higher respiratory muscle desaturation during the struggle phase. However, the deltoid muscles and peripheral oxygen saturation did not show such a relation. The observed desaturation trend of intercostals could be interpreted as the workload placed upon the respiratory muscles. This workload is presented as IBMs that contract all respiratory muscles [13]. Previous studies defined that IBMs help BHD maintain cerebral blood flow (CBF) through improved stroke volume [27,28]. The maintenance of CBF prevents asphyxia tolerance, where any decrease in CBF would initiate apnea cessation [29]. Also, if CBF decreases, the risk of hypoperfusion and potential neural ischemia rises, thereby compromising the safety and performance of BHD [30]. Hence, higher oxygen decreases in the intercostal muscles could be connected to IBMs and CBF maintenance through the higher workload of these muscles.
4.2. Heart Rate and Oxygen Saturation
As noted in the introduction, severe bradycardia mostly occurs during the struggle phase of apnea [12]. However, the lowering in heart rate as a preparation indicates a parasympathetic system activation, which helps prolong apnea [7]. This study’s results indicate that neither SmO2 nor SpO2 is influenced by heart rate during the easy-going phase. Despite the lack of relation, desaturation occurs in peripheral tissues and muscles, indicating blood centralization and peripheral vasoconstriction [13].
However, HR and SpO2 were negatively correlated during the struggle phase, demonstrating how lower HR induces lower deoxygenation of tissues. These results demonstrate the bradycardic preservation of O2. Such findings corroborate previous studies that showed how the majority of apnea performance is influenced by oxygen consumption and preservation [26]. Previously, it was defined that diving bradycardia is induced by increased vagal activity, whereas the peripheral vasoconstriction of selected vascular beds is linked to increased sympathetic discharge [10]. Such a notion is also observed as sympathetic activity increases by ~100% during the easy-going phase, whereas during the struggle phase, this increase rises up to ~700–800% at the end of the maximal breath hold [31]. Additionally, HR reduction was monitored as an indicator of apnea performance because a lower heart rate indicates better results in competition [7,26]. Following that, maintaining low HR for as long as possible can help keep cardiac O2 consumption down and thus increase apnea duration.
4.3. Peripheral and Local Muscle Oxygen Saturation
Observation of the peripheral estimation of oxygen saturation is defined as an indicator of O2 content in capillary blood, assuming Hb levels remain constant [32]. Previously, it was shown that peripheral estimates and direct measures of arterial oxygen saturation (SaO2) differ, particularly at lower oxygen levels. Hoiland, Ainslie, Bain, MacLeod, Stembridge, Drvis, Madden, Barak, MacLeod and Dujic [16] demonstrated that when SpO2 drops below 70%, the SpO2 overestimates SaO2 by approximately 5%. Concerning this error in estimation, the SpO2 and SmO2 were collected in a similar manner using near-infrared spectroscopy at different sites on the body. However, in this study, we examined deltoid and respiratory muscle SmO2 and compared it to SpO2 with an oximeter placed on BHD’s forehead, which has been validated against direct measures of arterial blood in the range of SaO2 = 63.5–99.5% [22]. Our results are the first to show that during the easy-going phase, both the deltoid and respiratory muscles showed similar oxygen depletion as was recorded by the SpO2, which has been validated against direct measures of arterial blood. These results indicate constant vasoconstriction in the peripheral tissues. Conversely, during the struggle phase, differences between the two muscle groups emerged. It can be seen that BHDs have a greater SmO2 decrease in the respiratory muscles than SpO2. Yet, in the deltoid, it was variable, with some participants having a greater decrease of SpO2 than SmO2, and in others, a greater SmO2 depletion than SpO2.
4.4. Limitations and Strengths
This study is one of the first that examined the correlation between heart rate, peripheral oxygen saturation, and deltoid and respiratory muscle oxygenation in a relatively small group of apnea divers during dry static apneas. Thus, one limitation of this study was a small sample size, which could contribute to low statistical power. Furthermore, we did not have direct measures of tissue perfusion, which would allow for more precise indications of O2 fluctuations due to blood flow compared to the measurements made in this study. Although we did not have direct measures of arterial oxygen saturation, we used a forehead saturation probe that was validated against arterial oxygen saturation in the range of saturations expected in this study, minimizing the impact of this limitation. Furthermore, the current investigation may support the need for future studies to examine some other parameters, such as CaO2, PaO2, and PaCO2, which could be valuable to further understand the presented relations. The lack of cold-water face immersion would initiate a stronger bradycardia, leading to greater reductions in HR; however, all divers had a bradycardia appropriate for the dry static apnea condition. Nevertheless, the current study presents valuable new insights into physiological adaptations and responses to maximal inspiratory apnea. Also, some of the data presents novel practical applications for BHDs, which could help them enhance their performance.
5. Conclusions
This study examined the relationships among some physiological responses that occur during a dry static apnea. Specifically, we examined the associations between bradycardia and peripheral oxygen saturation with oxygenation in both the deltoid and intercostal muscles and the differences between them with apnea. From these aims, three main findings were observed: (1) apnea duration was highly related to the desaturation of intercostal muscles during the struggle phase; (2) lower heart rate was related to slower peripheral oxygen desaturation during the struggle phase; (3) muscle and peripheral desaturation differences are more pronounced during the struggle phase than the easy-going phase in both muscles groups.
Such findings lead to the conclusion that HR does not have a significant influence on muscle oxygenation in both respiratory and locomotor muscles during the entire static apnea. To the contrary, during the struggle phase, peripheral oxygen estimation shows a slower desaturation when participants experience lower HR values. Hence, those participants who perceive stronger bradycardia have a lower rate of deoxygenation in peripheral oxygen saturation. Taken together, it can be concluded that a higher workload of respiratory muscles due to IBMs could prolong apnea duration, though this remains to be directly tested.
Author Contributions
Conceptualization, J.W.D. and D.V.; methodology, C.D.H., I.D., N.F. and J.W.D.; software, D.V.; validation, J.W.D., C.D.H. and D.V.; formal analysis, D.V.; investigation, C.D.H., G.B.C., A.T.L., N.F. and D.V.; resources, J.W.D.; data curation, C.D.H., J.W.D. and D.V.; writing—original draft preparation, D.V. and Ž.D.; writing—review and editing, C.D.H., G.B.C., A.T.L., N.F., Ž.D. and J.W.D.; visualization, D.V.; supervision, N.F., J.W.D. and Ž.D.; project administration, J.W.D.; funding acquisition, J.W.D. All authors have read and agreed to the published version of the manuscript.
Funding
This research was funded and supported by a Fulbright Scholarship (JWD) and a PADI Foundation Grant (JWD).
Institutional Review Board Statement
The study was conducted in accordance with the Declaration of Helsinki, and approved by the Human Research Protection Program at Northern Arizona University (approval number: 2161517-4) and the Ethical Committee of the University of Split Faculty of Kinesiology (approval number: 2181-205-02-05-24-007).
Informed Consent Statement
Informed consent was obtained from all subjects involved in the study.
Data Availability Statement
All data is contained within the manuscript body.
Conflicts of Interest
The authors declare no conflicts of interest.
Abbreviations
The following abbreviations are used in this manuscript:
| DR | Diving response |
| BHD | Breath-hold divers |
| IBM | Involuntary breathing movements |
| CO2 | Carbon dioxide |
| O2 | Oxygen |
| VO2 | Oxygen volume |
| SmO2 | Muscle oxygen saturation |
| SpO2 | Peripheral estimation of oxygen saturation |
| HR | Heart rate |
| FVC | Forced vital capacity |
| FEV1 | Forced expiratory volume in 1st second |
| FEV1/FVC | Tiffeneau index |
| CBF | Cerebral blood flow |
References
- Andersson, J.P.; Evaggelidis, L. Arterial oxygen saturation and diving response during dynamic apneas in breath-hold divers. Scand. J. Med. Sci. Sports 2009, 19, 87–91. [Google Scholar] [CrossRef]
- Andersson, J.P.; Linér, M.H.; Rünow, E.; Schagatay, E.K. Diving response and arterial oxygen saturation during apnea and exercise in breath-hold divers. J. Appl. Physiol. (1985) 2002, 93, 882–886. [Google Scholar] [CrossRef]
- Patrician, A.; Dujić, Ž.; Spajić, B.; Drviš, I.; Ainslie, P.N. Breath-Hold Diving—The Physiology of Diving Deep and Returning. Front. Physiol. 2021, 12, 639377. [Google Scholar] [CrossRef]
- Schagatay, E.; Andersson, J. Diving response and apneic time in humans. Undersea Hyperb. Med. 1998, 25, 13–19. [Google Scholar]
- Ferrigno, M.; Hickey, D.D.; Liner, M.H.; Lundgren, C.E. Cardiac performance in humans during breath holding. J. Appl. Physiol. 1986, 60, 1871–1877. [Google Scholar] [CrossRef]
- Fagius, J.; Sundlöf, G. The diving response in man: Effects on sympathetic activity in muscle and skin nerve fascicles. J. Physiol. 1986, 377, 429–443. [Google Scholar] [CrossRef] [PubMed]
- Costalat, G.; Godin, B.; Balmain, B.N.; Moreau, C.; Brotherton, E.; Billaut, F.; Lemaitre, F. Autonomic regulation of the heart and arrhythmogenesis in trained breath-hold divers. Eur. J. Sport Sci. 2021, 21, 439–449. [Google Scholar] [CrossRef] [PubMed]
- Lemaître, F.; Buchheit, M.; Joulia, F.; Fontanari, P.; Tourny-Chollet, C. Static apnea effect on heart rate and its variability in elite breath-hold divers. Aviat. Space Environ. Med. 2008, 79, 99–104. [Google Scholar] [CrossRef] [PubMed]
- Alboni, P.; Alboni, M.; Gianfranchi, L. Diving bradycardia: A mechanism of defence against hypoxic damage. J. Cardiovasc. Med. 2011, 12. [Google Scholar] [CrossRef]
- Shamsuzzaman, A.; Ackerman, M.J.; Kuniyoshi, F.S.; Accurso, V.; Davison, D.; Amin, R.S.; Somers, V.K. Sympathetic nerve activity and simulated diving in healthy humans. Auton. Neurosci. 2014, 181, 74–78. [Google Scholar] [CrossRef]
- Palada, I.; Obad, A.; Bakovic, D.; Valic, Z.; Ivancev, V.; Dujic, Z. Cerebral and peripheral hemodynamics and oxygenation during maximal dry breath-holds. Respir. Physiol. Neurobiol. 2007, 157, 374–381. [Google Scholar] [CrossRef]
- Bain, A.R.; Drvis, I.; Dujic, Z.; MacLeod, D.B.; Ainslie, P.N. Physiology of static breath holding in elite apneists. Exp. Physiol. 2018, 103, 635–651. [Google Scholar] [CrossRef]
- Dujic, Z.; Uglesic, L.; Breskovic, T.; Valic, Z.; Heusser, K.; Marinovic, J.; Ljubkovic, M.; Palada, I. Involuntary breathing movements improve cerebral oxygenation during apnea struggle phase in elite divers. J. Appl. Physiol. (1985) 2009, 107, 1840–1846. [Google Scholar] [CrossRef]
- Godfrey, S.; Campbell, E.J. The control of breath holding. Respir. Physiol. 1968, 5, 385–400. [Google Scholar] [CrossRef] [PubMed]
- Vrdoljak, D.; Dujić, Ž.; Hubbard, C.D.; Coombs, G.B.; Lovering, A.T.; Drvis, I.; Foretic, N.; Duke, J.W. Muscle oxygenation and local blood volume difference between intercostal and deltoid during dry static apnea in breath-hold divers. Respir. Physiol. Neurobiol. 2025, 335, 104402. [Google Scholar] [CrossRef] [PubMed]
- Hoiland, R.L.; Ainslie, P.N.; Bain, A.R.; MacLeod, D.B.; Stembridge, M.; Drvis, I.; Madden, D.; Barak, O.; MacLeod, D.M.; Dujic, Z. β1-Blockade increases maximal apnea duration in elite breath-hold divers. J. Appl. Physiol. 2016, 122, 899–906. [Google Scholar] [CrossRef]
- Bouten, J.; Bourgois, J.G.; Boone, J. Hold your breath: Peripheral and cerebral oxygenation during dry static apnea. Eur. J. Appl. Physiol. 2020, 120, 2213–2222. [Google Scholar] [CrossRef]
- Eichhorn, L.; Erdfelder, F.; Kessler, F.; Doerner, J.; Thudium, M.O.; Meyer, R.; Ellerkmann, R.K. Evaluation of near-infrared spectroscopy under apnea-dependent hypoxia in humans. J. Clin. Monit. Comput. 2015, 29, 749–757. [Google Scholar] [CrossRef] [PubMed]
- Duke, J.W.; Hubbard, C.D.; Vrdoljak, D.; Coombs, G.B.; Lovering, A.T.; Drvis, I.; Dujić, Ž.; Foretic, N. Respiratory muscle strength pre- and post-maximal apneas in a world champion breath-hold diver. J. Appl. Physiol. 2024, 138, 66–72. [Google Scholar] [CrossRef]
- Hubbard, C.D.; Vrdoljak, D.; Coombs, G.B.; Cross, T.J.; Taylor, B.J.; Lovering, A.T.; Drvis, I.; Dujic, Ž.; Foretić, N.; Duke, J.W. Reduction in respiratory muscle strength following a series of preparatory and maximal static, dry breath-holds. J. Appl. Physiol. 2025, 139, 1335–1345. [Google Scholar] [CrossRef]
- Quanjer, P.H.; Stanojevic, S.; Cole, T.J.; Baur, X.; Hall, G.L.; Culver, B.H.; Enright, P.L.; Hankinson, J.L.; Ip, M.S.; Zheng, J.; et al. Multi-ethnic reference values for spirometry for the 3-95-yr age range: The global lung function 2012 equations. Eur. Respir. J. 2012, 40, 1324–1343. [Google Scholar] [CrossRef] [PubMed]
- Laurie, S.S.; Yang, X.; Elliott, J.E.; Beasley, K.M.; Lovering, A.T. Hypoxia-induced intrapulmonary arteriovenous shunting at rest in healthy humans. J. Appl. Physiol. (1985) 2010, 109, 1072–1079. [Google Scholar] [CrossRef]
- Feldmann, A.; Schmitz, R.; Erlacher, D. Near-infrared spectroscopy-derived muscle oxygen saturation on a 0% to 100% scale: Reliability and validity of the Moxy Monitor. J. Biomed. Opt. 2019, 24, 1–11. [Google Scholar] [CrossRef] [PubMed]
- Barstow, T.J. Understanding near infrared spectroscopy and its application to skeletal muscle research. J. Appl. Physiol. (1985) 2019, 126, 1360–1376. [Google Scholar] [CrossRef]
- Doğan, N. Bland-Altman analysis: A paradigm to understand correlation and agreement. Turk. J. Emerg. Med. 2018, 18, 139–141. [Google Scholar] [CrossRef]
- Schagatay, E. Predicting performance in competitive apnoea diving. Part I: Static apnoea. Diving Hyperb. Med. 2009, 39, 88–99. [Google Scholar] [PubMed]
- Willie, C.K.; Ainslie, P.N.; Drvis, I.; MacLeod, D.B.; Bain, A.R.; Madden, D.; Maslov, P.Z.; Dujic, Z. Regulation of brain blood flow and oxygen delivery in elite breath-hold divers. J. Cereb. Blood Flow Metab. 2015, 35, 66–73. [Google Scholar] [CrossRef] [PubMed]
- Hubbard, C.D.; Cross, T.J.; Merdich, G.Z.; Vrdoljak, D.; Foretic, N.; Dujić, Ž.; Duke, J.W. Respiratory system responses to a maximal apnoea. Exp. Physiol. 2025, 110, 382–390. [Google Scholar] [CrossRef] [PubMed]
- Bailey, D.M.; Willie, C.K.; Hoiland, R.L.; Bain, A.R.; MacLeod, D.B.; Santoro, M.A.; DeMasi, D.K.; Andrijanic, A.; Mijacika, T.; Barak, O.F.; et al. Surviving Without Oxygen: How Low Can the Human Brain Go? High. Alt. Med. Biol. 2017, 18, 73–79. [Google Scholar] [CrossRef] [PubMed]
- Moir, M.E.; Klassen, S.A.; Al-Khazraji, B.K.; Woehrle, E.; Smith, S.O.; Matushewski, B.J.; Kozić, D.; Dujić, Ž.; Barak, O.F.; Shoemaker, J.K. Impaired dynamic cerebral autoregulation in trained breath-hold divers. J. Appl. Physiol. 2019, 126, 1694–1700. [Google Scholar] [CrossRef]
- Heusser, K.; Dzamonja, G.; Tank, J.; Palada, I.; Valic, Z.; Bakovic, D.; Obad, A.; Ivancev, V.; Breskovic, T.; Diedrich, A.; et al. Cardiovascular Regulation During Apnea in Elite Divers. Hypertension 2009, 53, 719–724. [Google Scholar] [CrossRef] [PubMed]
- Lima, A.; Bakker, J. Noninvasive monitoring of peripheral perfusion. In Applied Physiology in Intensive Care Medicine 2: Physiological Reviews and Editorials; Pinsky, M.R., Brochard, L., Mancebo, J., Antonelli, M., Eds.; Springer: Berlin/Heidelberg, Germany, 2012; pp. 39–49. [Google Scholar]
Disclaimer/Publisher’s Note: The statements, opinions and data contained in all publications are solely those of the individual author(s) and contributor(s) and not of MDPI and/or the editor(s). MDPI and/or the editor(s) disclaim responsibility for any injury to people or property resulting from any ideas, methods, instructions or products referred to in the content. |
© 2025 by the authors. Licensee MDPI, Basel, Switzerland. This article is an open access article distributed under the terms and conditions of the Creative Commons Attribution (CC BY) license (https://creativecommons.org/licenses/by/4.0/).