Abstract
A thermal metric developed using the day-to-day temperature variability framework that was previously applied to the east coast of China has been adapted for Canadian climate station data. The same metric, based on the variability of the minimum temperature of the day, was able to distinguish between coastal and inland stations, especially when the winter months of December, January and February, were removed from the analysis. While the threshold of the metric that distinguished between the two groups was different than that developed for the east coast of China, it was nonetheless unambiguous. The range of latitudes in the Canadian setting was sufficiently narrow that a latitude correction, as was performed for the China climate stations, was not required. A comparison with a more traditional measure of continentality suggests that the thermal variability measure performs better at identifying the coastal/continental nature of the climate station data. This work also suggests that a more nuanced treatment of winter months should be considered for all such measures in colder climates.
1. Introduction
Recently, a new metric was developed to identify the effects of water bodies on local climate along China’s East Coast [1]. This metric is now applied to a series of Canadian climate stations. Historically, the marine influence has been evaluated by continentality metrics [2]. These metrics are physically based on the dampening effect of water bodies on temperature through advective effects of land/sea contrast and the radiative effects arising from the presence of cloud and fog. A commonly used metric is the difference between the mean monthly temperature of the warmest month and the coldest month of the year using climate normal data [3], and normalized by latitude to account for seasonal variations of insolation [2,4]. Stations further from major water bodies exhibited greater annual ranges in these monthly temperatures [5]. Gough and Shi (2021) successfully used a day-to-day (DTD) temperature variability framework to assess the marine effect on climate data, by correctly identifying coastal and in-land climate stations.
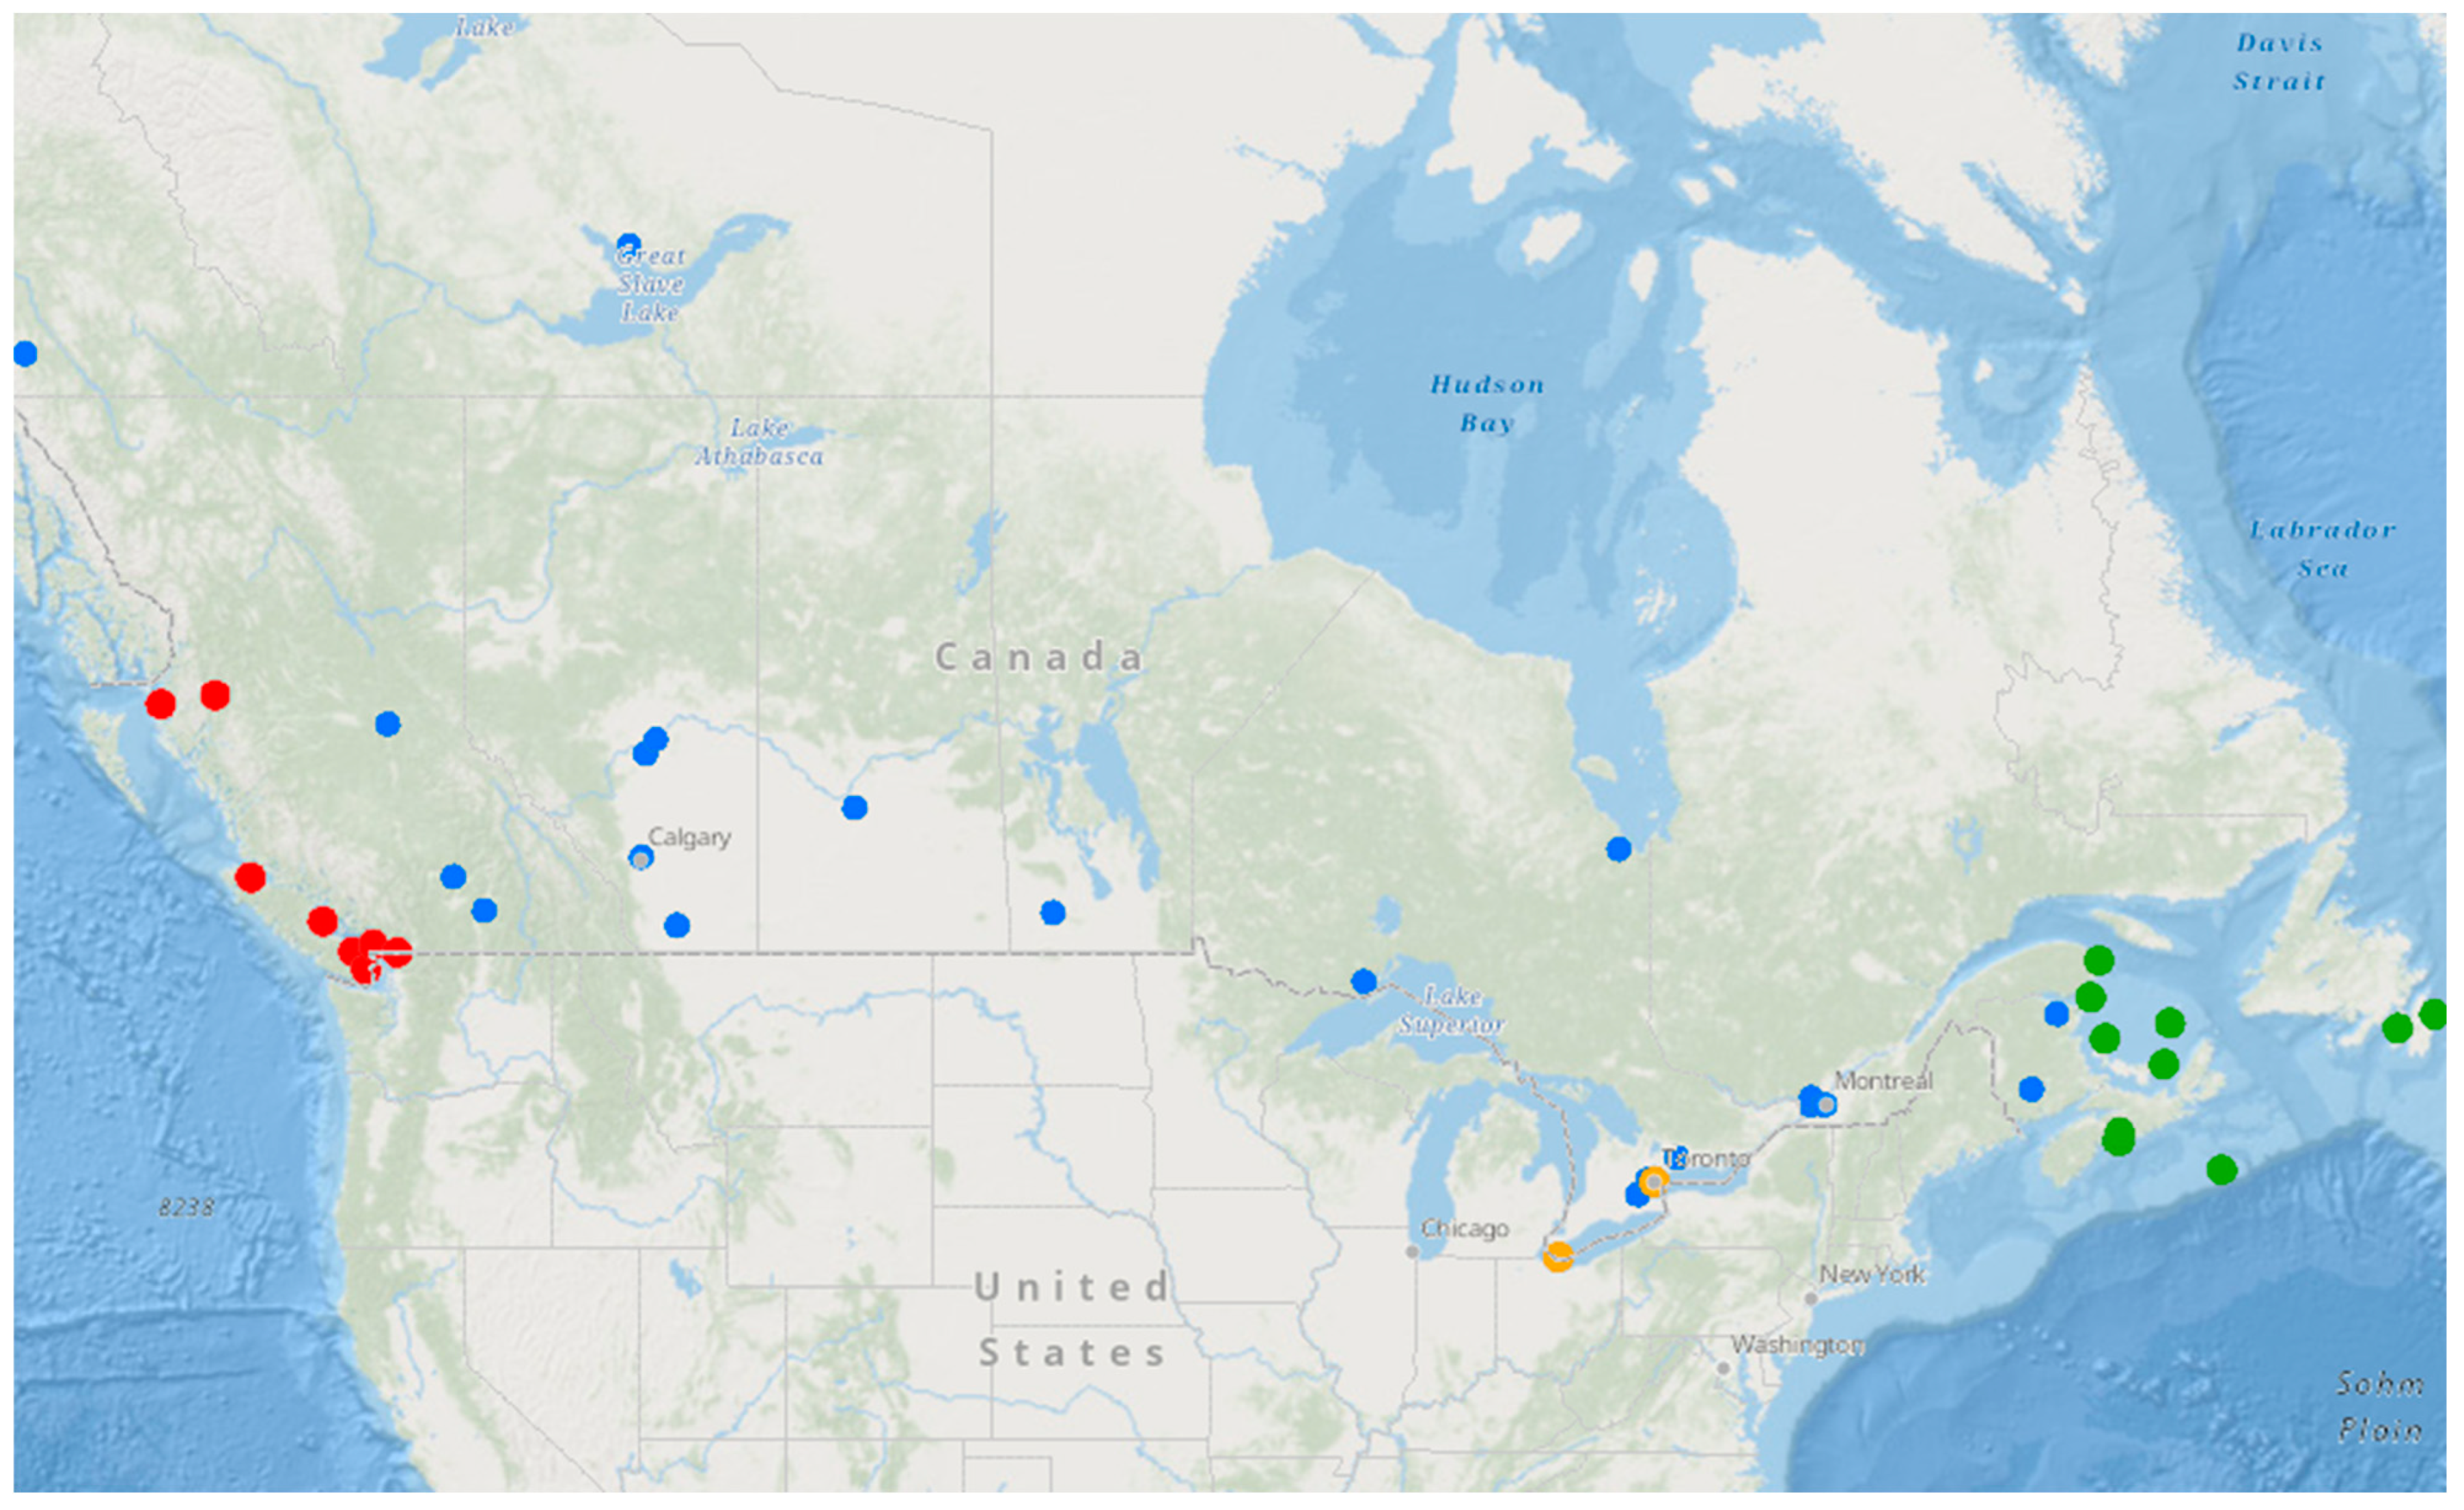
Canada is the world’s second largest country by area and extends from 42° N to 82° N (Figure 1). Over 40% of this land is permafrost landscape. The population, and thus most climate stations, exists close to the southern boundary, generally south of 60° N. This area has a midlatitude climate characterized by four distinct seasons, winter, spring, summer and autumn. These seasons are modified regionally by topography and the presence of large water bodies, the Atlantic Ocean in the east, the Pacific Ocean to the west, the largely ice-covered Arctic sea (including Hudson Bay) in the north. Central Canada is impacted by the presence of the Laurentian Great Lakes.
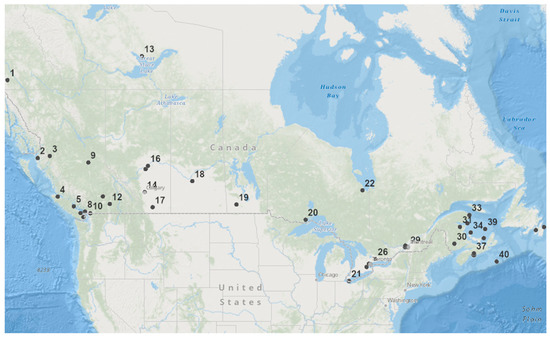
Figure 1.
Location of climate stations. The station numbering matches that in Table 1.
In this work, the DTDTmin [1] metric is applied to a series of a Canadian climate stations to test the transferability of this coastal climate metric to this geographic location.
2. Materials and Methods
Daily minimum and maximum temperature data from forty-two Canada climate stations were used in this work, taken from the national climate data archive maintained by Environment and Climate Change Canada (https://climate.weather.gc.ca/historical_data (accessed on 10 January 2022)). The stations were chosen for their proximity to the Pacific Ocean, Atlantic Ocean and the Great Lakes, as well as areas that were not proximal to large water bodies. These stations are listed in Table 1 and displayed in Figure 1. Ten years of data were used, mainly for the period 1991–2000, although some variations based on data availability and quality.

Table 1.
List of climate stations. “A” represents “airport”. YK—Yukon, BC—British Columbia, AB—Alberta, NWT—Northwest Territories, SK—Saskatchewan, MB—Manitoba, ON—Ontario, QC—Quebec, NB—New Brunswick, NS—Nova Scotia, PEI—Prince Edward Island, and NL—Newfoundland and Labrador.
Ref. [6] introduced the difference in the monthly mean of the absolute difference between a day’s mean temperature with the previous day’s mean temperature (DTD) as a way to assess thermal variability. An additional metric (∆DTD) was subsequently introduced, the difference between the DTD derived from the maximum temperature (DTDTmax) and the minimum temperature (DTDTmin) of the day. This measure has been shown to be a good metric to detect the urbanization of a landscape [7,8,9,10]. For urban landscapes, insolation is mainly partitioned into sensible heat, subsurface heat, and to a lesser extent, latent heat (evaporation of surface water). This leads to a substantial increase in temperature (sensible heat) for a given radiative input. Rural, as well as coastal locations, with the same radiative input, partitions considerably more energy into latent heat because of the greater availability of surface water and the production of fog [11] and clouds [12]. This in turn dampens the day to day variability as detected by [1] for coastal locations in East China. They examined annual day-to-day temperature variability for sixteen urban areas along China’s eastern coast, comparing these cities to those inland from the coast. The minimum temperature variability was found to be the clearest indicator of coastalization, particularly when the effects of latitude were accounted for. In addition, this metric was found to be superior and more nuanced than traditional measures of continentality/coastalization. This measure was subsequently used to detect the influence of the Adriatic Sea on local climate data by [13] and for the South China coast of Guangdong [14].
DTDTmin was identified as the clearest indicator of coastal versus inland sites along China’s east coast [1], as recently confirmed by [14] for China’s south coast. Gough and Shi [1] found a threshold between 1.75 and 1.80 for latitude-normalized DTDTmin to delineate between coastal and inland locations. This metric is calculated for each station and binned by proximity to large water bodies (Pacific Ocean, Atlantic Ocean, Great Lakes). The differences in the coastal and inland station data are statistically assessed using Student’s t-test. The impact of the cold climate of Canada on the DTDTmin metric is explored by removing the months of December, January and February. The two traditional measures of continentality based on warmest and coldest month of the year [2,3,4] are calculated and contrasted to the DTDTmin metric. The coherency of the various metrics is assessed using a signal to noise ratio (mean/standard deviation).
The research questions explored include whether the results of the China East Coast analysis are reproducible in a Canadian context? Is there a unique threshold for coastalization? Does the colder climate of Canada impact the results and need to be accounted for? How does the DTDTmin metric perform in identifying coastal stations compared to more traditional measures of continentality?
3. Results
3.1. DTDTmin
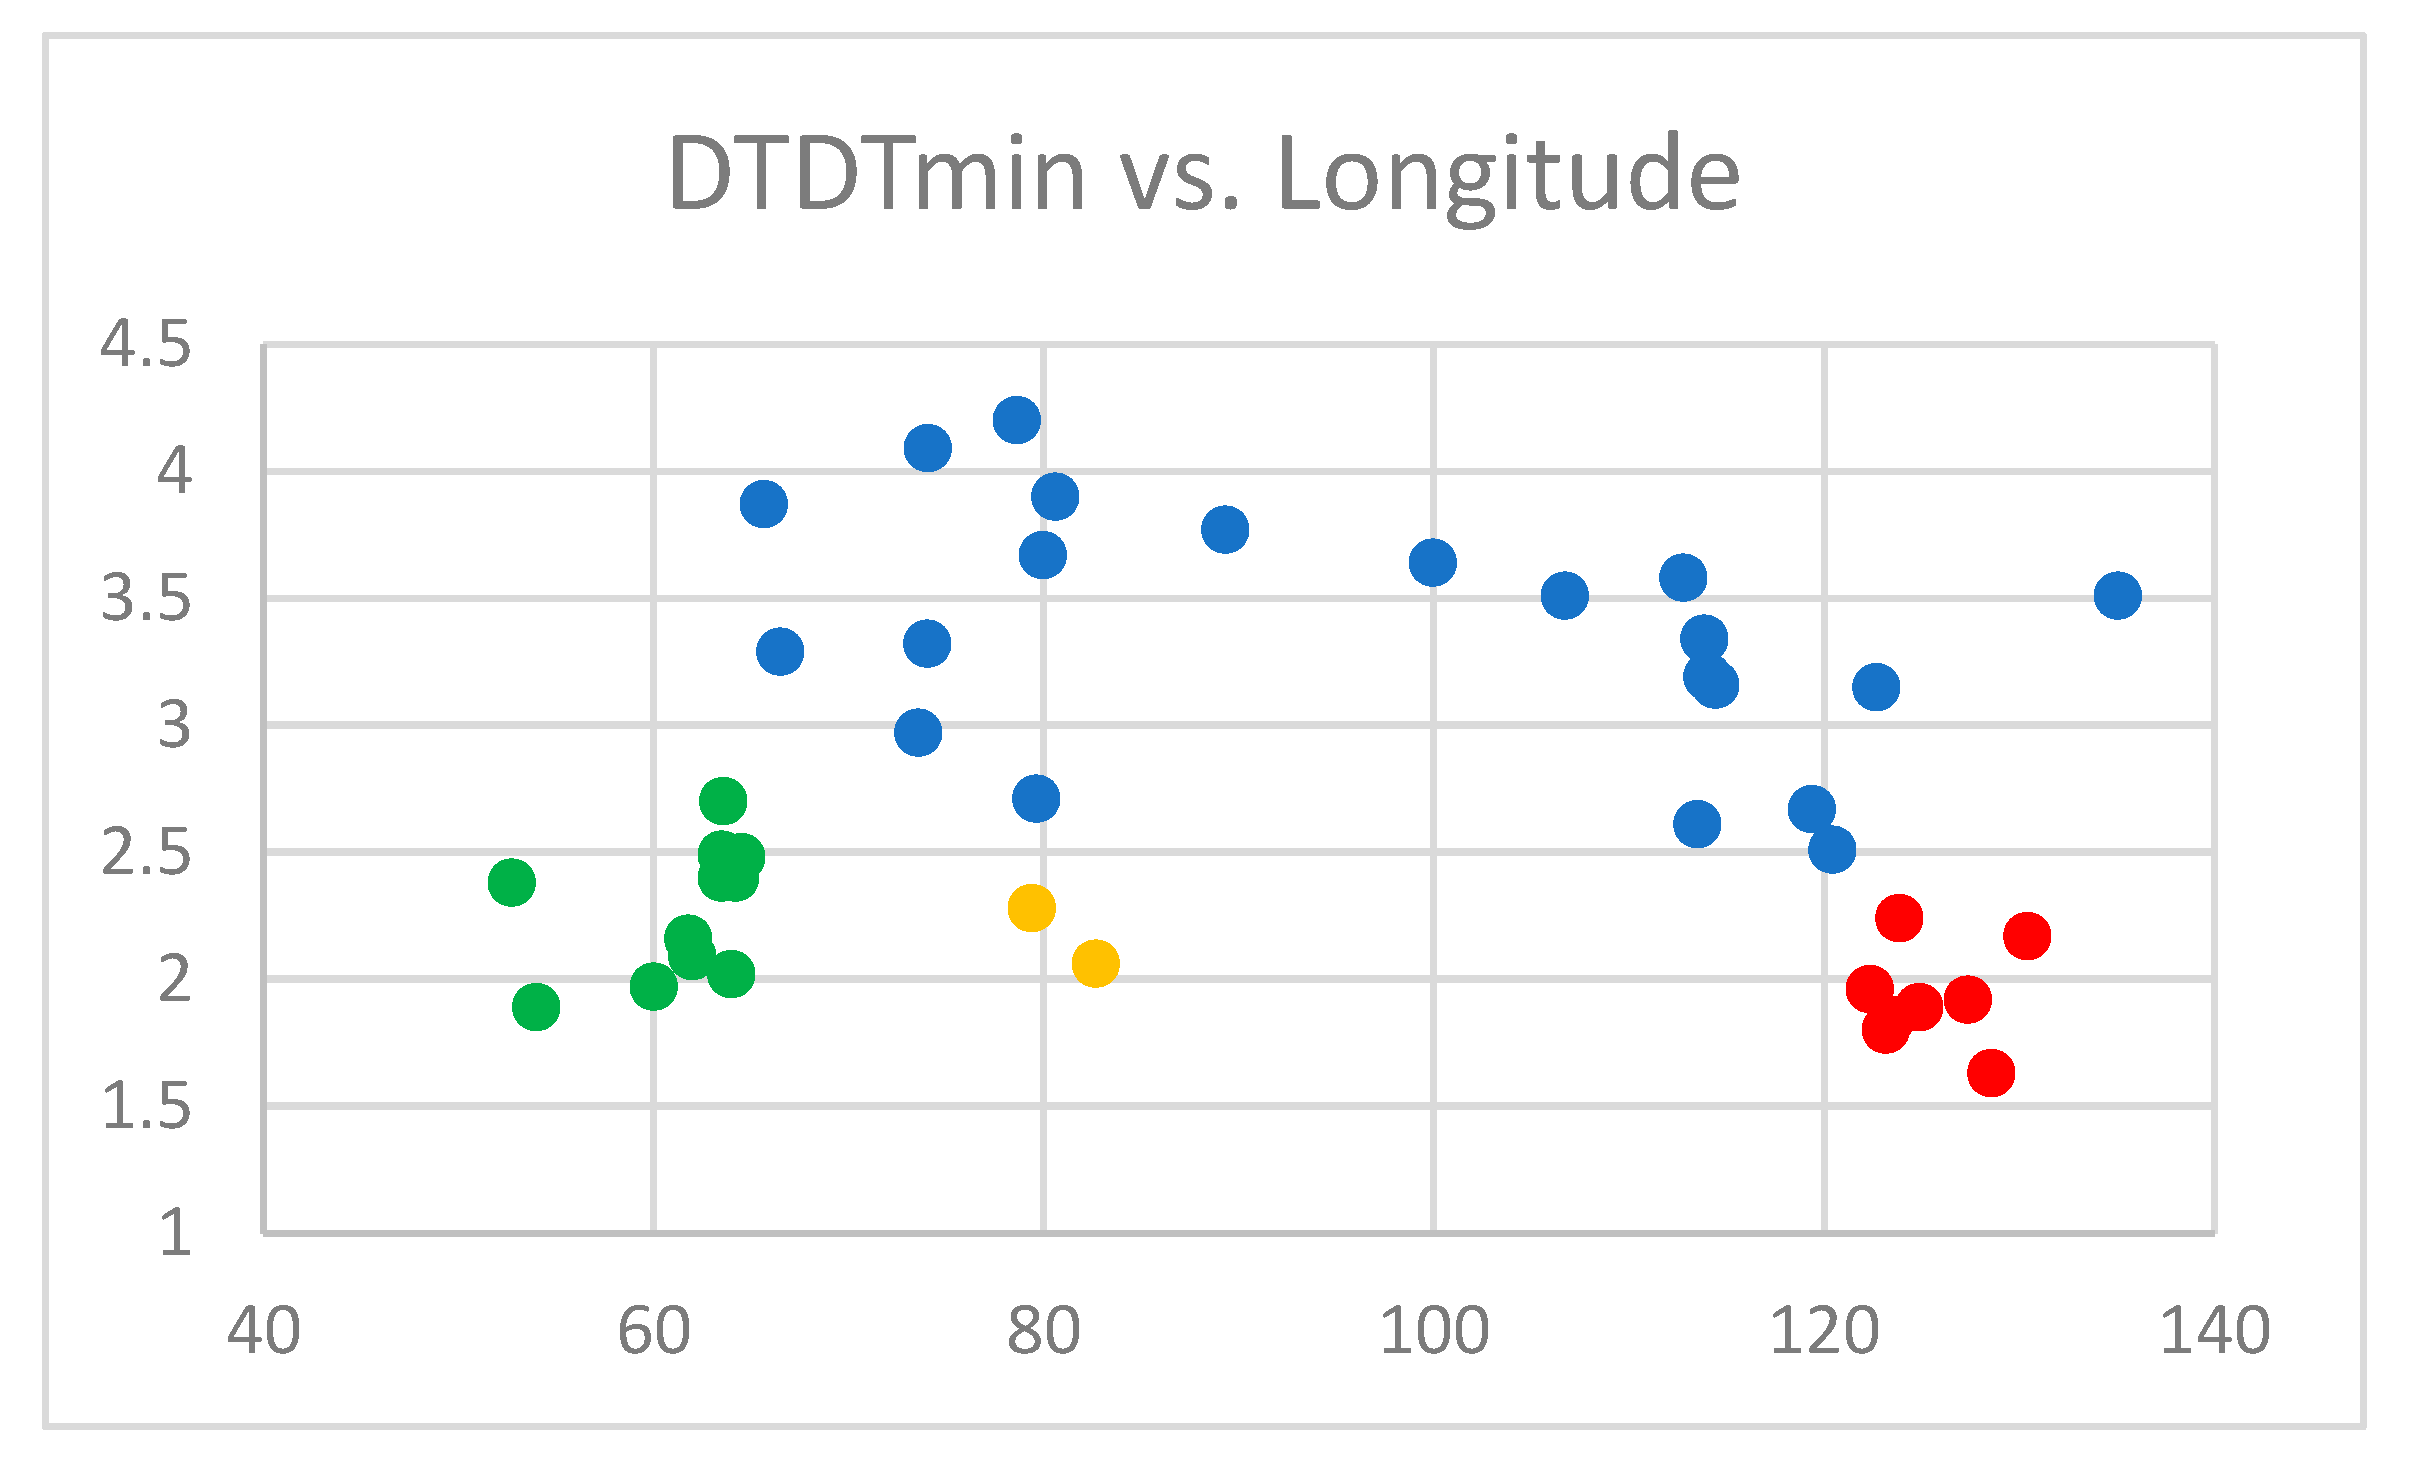
The DTDTmin metric is calculated for each of the 42 stations (Table 1; Figure 1). The stations in close proximity to the Pacific Ocean, Atlantic Ocean, and Great Lakes are highlighted in Figure 1. While clearly distinct populations (p < 0.001), the two populations were not unambiguously distinct, with some overlap in the DTDTmin range of 2.5–3.0. In addition, the Atlantic coast climate stations (green in Figure 1) were higher in value than the Pacific Ocean stations (red in Figure 1) in a statistically significant fashion (p < 0.01). The Atlantic Ocean climate stations, although located at lower latitudes, were colder due to the differential effects of the Atlantic and Pacific Oceans, especially in winter. Thus, the DTDTmin was adjusted by removing the winter months of December, January, and February, months in which temperatures dropped below 0 °C and local ice formed at the shores of the Atlantic Ocean. The calculation for comparison purposes was performed for all climate stations and is reported in Table 2 and displayed in Figure 2. Comparing the Pacific and Atlantic coastal stations after this adjustment which differentially impacted the Atlantic stations (red and green, respectively, in Figure 3), the two populations are no longer distinct (p > 0.3). In addition, the difference between the coastal stations becomes unambiguously distinct, with a threshold of the adjusted DTDTmin of approximately 2.3 (the highest value of a coastal station is 2.24 and that of the lowest inland station is 2.39). In addition to the Pacific and Atlantic Ocean coastal stations, two other stations were identified as coastal, Toronto Island A and Pelee Island, stations located in the Great Lakes in central Canada (identified as orange in Figure 2, Figure 3 and Figure 4). The Great Lakes are the largest freshwater bodies in the world [15]. The impact, however, was not present in stations near but not at the shores or on islands of the Great Lakes (Toronto Pearson A, Thunder Bay A). The geographic distribution of the coastal stations is shown in Figure 4.
Table 2.
Coastalization/continentality measures for all stations. DTDTmin (adjusted) removes the winter months of December, January, and February. Cont is continentality calculated by the difference between warmest and coldest months of the year using climate normals (thirty-year averages). Cont A is Cont normalized by latitude.

Figure 2.
DTDTmin as a function of station longitude (° W). Green indicates stations along the Atlantic coast, orange indicates coastal stations in the Great Lakes and red indicates coastal stations along the Pacific Coast. Blue dots refer to locations that are not identified as coastal locations.
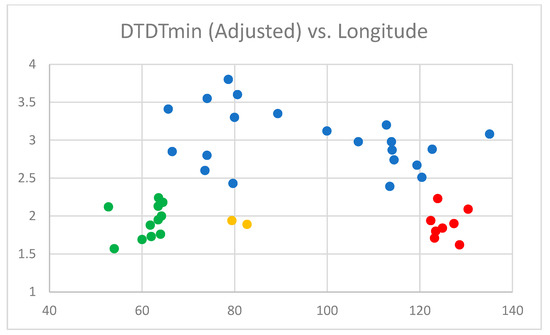
Figure 3.
DTDTmin (adjusted by removing winter months) as a function of station longitude (° W). Green indicates stations along the Atlantic coast, orange indicates coastal stations in the Great Lakes and red indicates coastal stations along the Pacific Coast. Blue dots refer to locations that are not identified as coastal locations.
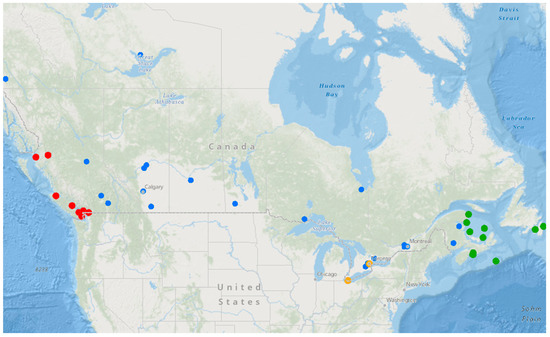
Figure 4.
Map of station locations. Green indicates stations along the Atlantic coast, orange indicates coastal stations in the Great Lakes and red indicates coastal stations along the Pacific Coast. Blue dots refer to locations that are not identified as coastal locations.
3.2. Continentality
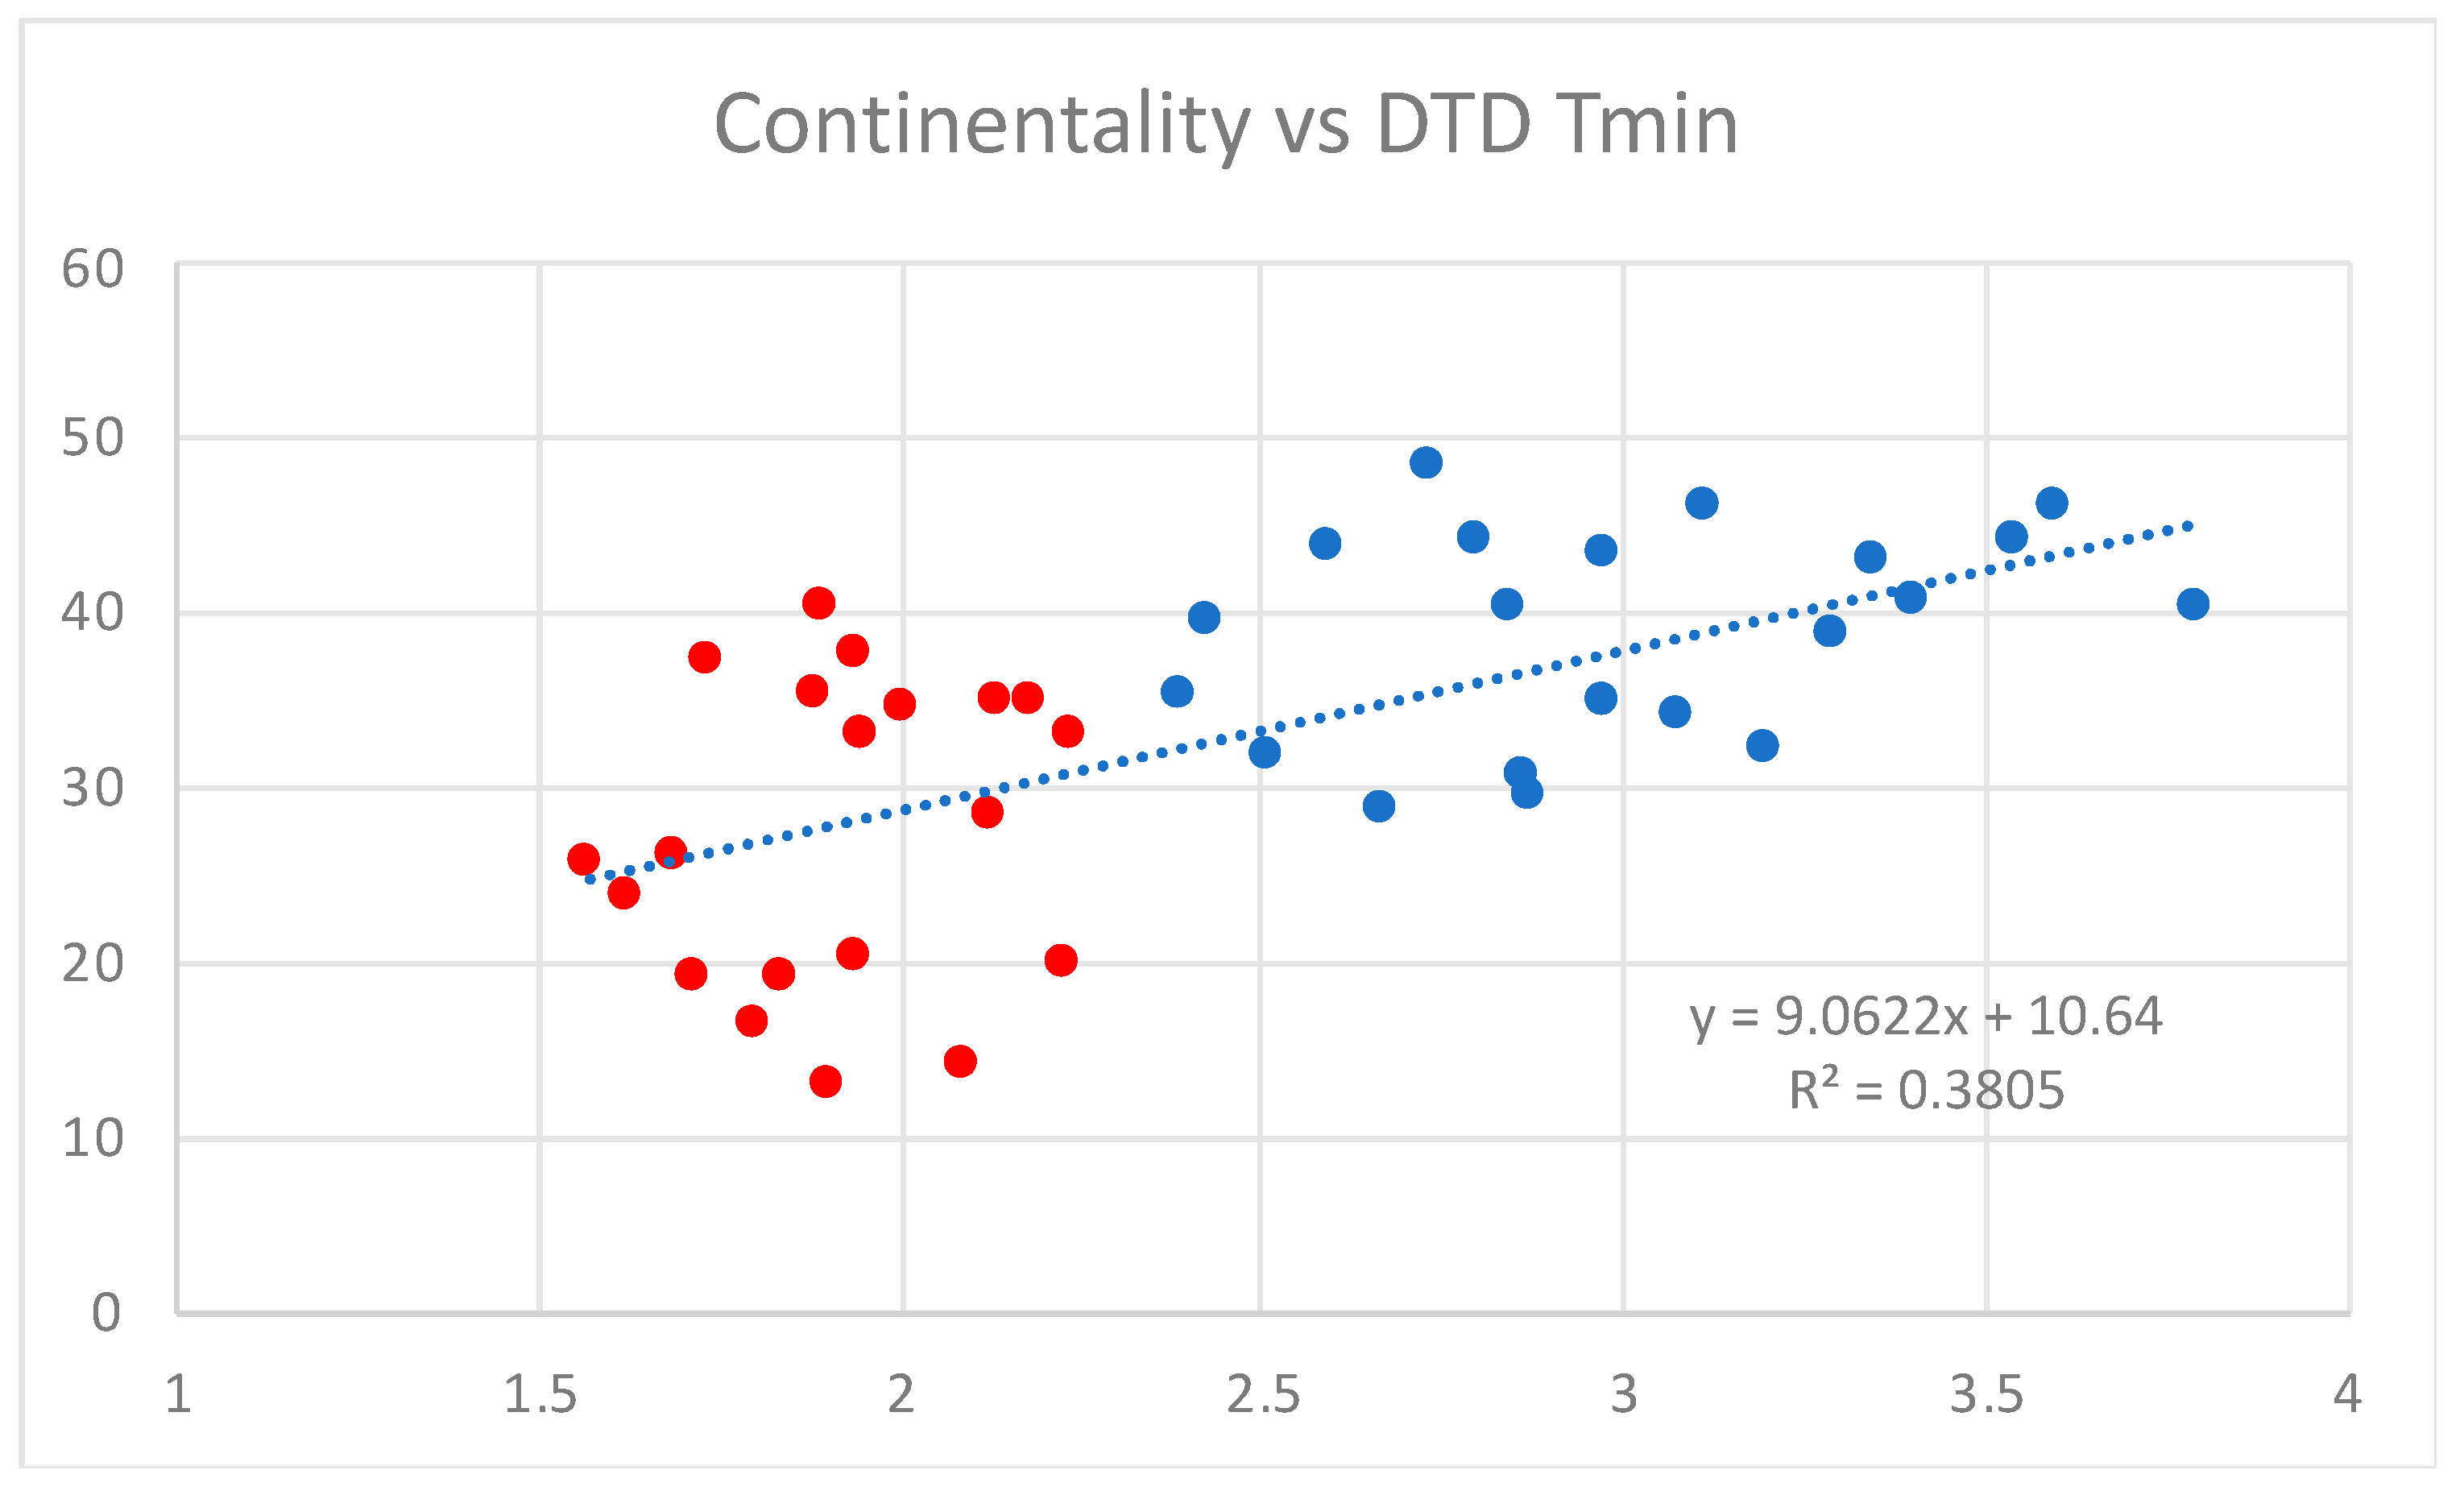
The traditional measure of continentality [3] is reported in Table 2, along with the latitude-normalized continentality [2,4]. These measures are compared to DTDTmin in Figure 5 and Table 3. In Figure 4, DTDTmin is plotted against the adjusted continentality. The coastal stations are in red and inland stations in blue. As noted above, the difference between coastal and inland using DTDTmin is distinct with a threshold of approximately 2.3. However, while the continentality does capture some of this distinction with inland stations values higher than that of coastal stations, the distinction is not as clear. Over half of the combined total of coastal and inland stations exist in the range of 30–40. Thus, continentality identifies the strongly coastal and strongly continental, it is not clear for those between. This is further illustrated by looking at the results in Table 3. In Table 3, the data are binned in coastal and inland stations for the four metrics, DTDTmin, DTDTmin A, Cont, and Cont A. The means and standard deviations are reported, as well as the ratio of the two, the signal to noise ratio. The larger this value, the clearer the metric. For the coastal stations, both DTDTmin and DTDTmin A have signal to noise ratios that are double to triple that of the Cont and Cont A, indicating, as Figure 4 suggests, that DTDTmin A performs as the clearest metric of coastalization. For the inland stations, this signal to noise ratio is higher for DTDTmin and DTDmin A compared to Cont and Cont A but the difference is much smaller.

Figure 5.
Continentality plotted against DTDTmin (winter corrected). Points in red indicate coastal stations and points in blue represent inland stations.
Table 3.
Coastalization and continentality measures for coastal and inland locations. DTDTmin A refers to winter corrected DTDTmin values. Cont A is normalized for latitude.
3.3. Winter Correction
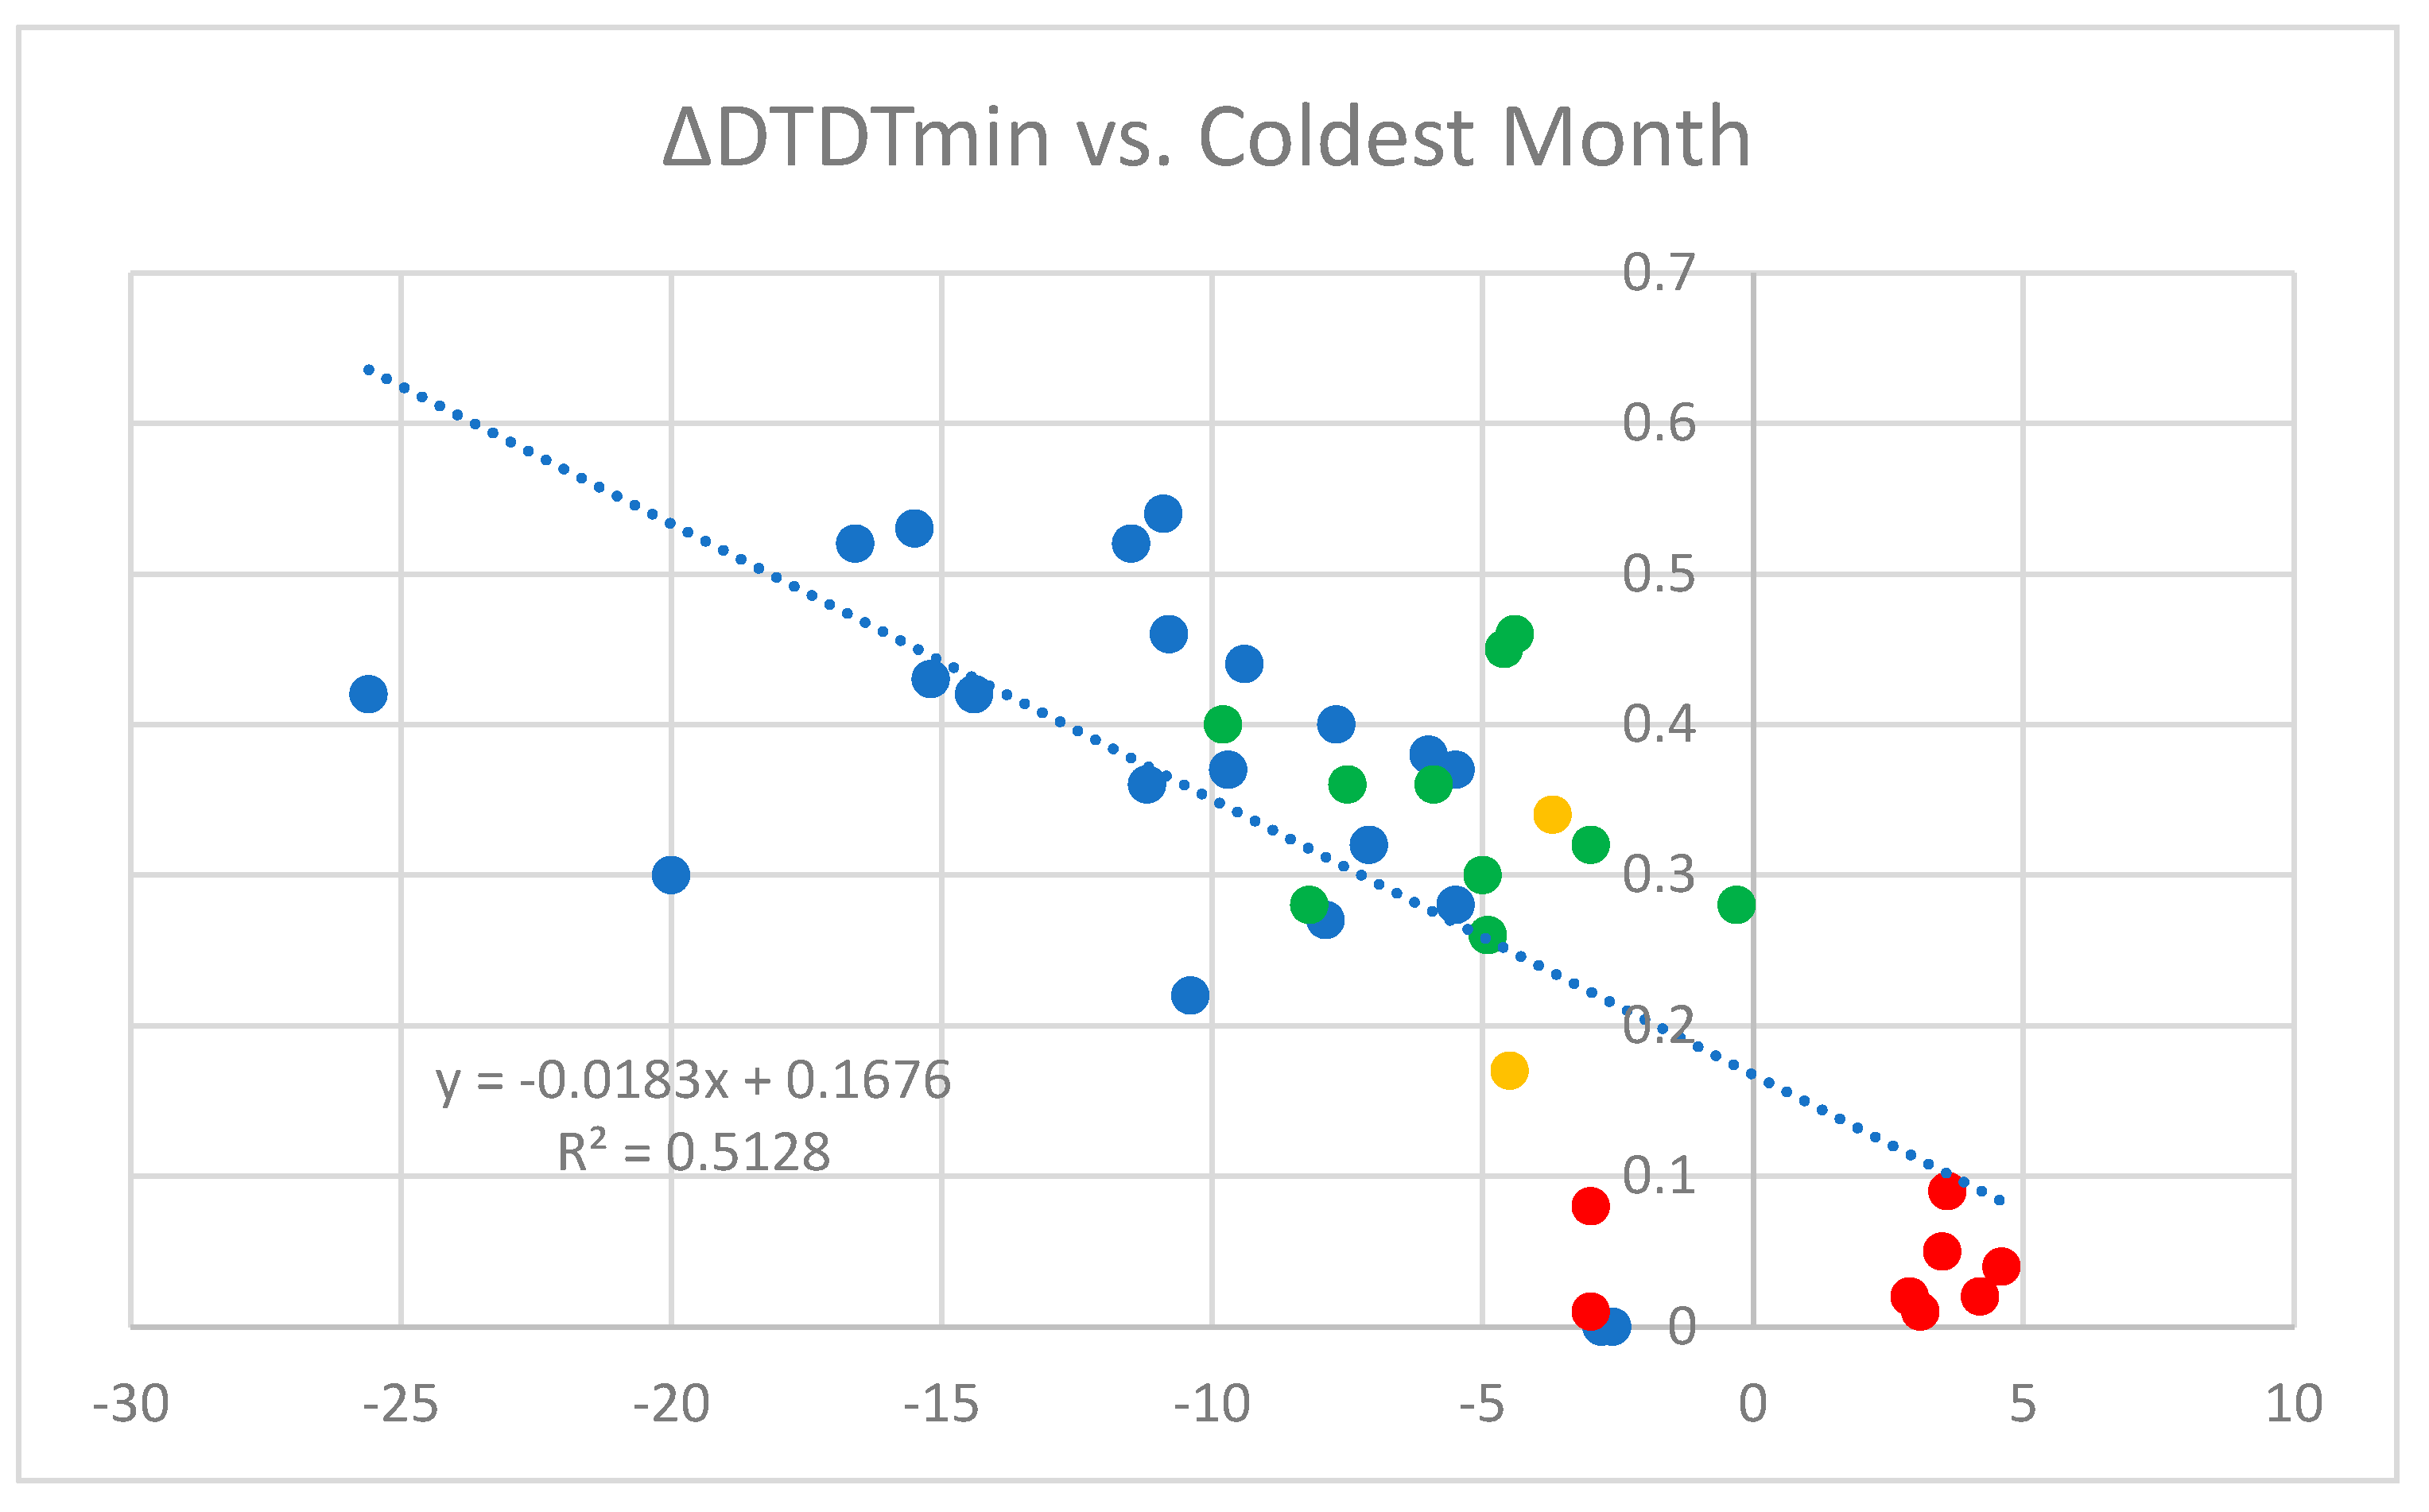
We return to the winter correction that essentially equalized the DTDTmin metric for the stations from the Pacific coast and the Atlantic coast. As noted above, removing data for the climatological winter months, December, January and February, suggests that the nature of winter affects this metric. The correction was applied to the Pacific coast stations but the impact was considerably less. In Figure 6, plots the correction versus the temperature of coldest month of the year, a proxy for winter taken from Table 2. In this Figure, the Pacific coast stations are in red, Great Lakes coastal stations in orange and Atlantic coastal stations in green. The relationship with the coldest month of the year is a strong one, accounting for over 50% of the variability (R2 = 0.51), indicating that DTDTmin behaves differently under colder conditions, particularly conditions below 0 °C. We speculate that formation of coast ice mitigates the availability of oceanic moisture and the presence of snow cover modifies the local energy balance in colder regions. All Atlantic coast stations were in the colder, below 0 °C, regime. This also leads to the speculation the transition to this winter regime may also impact the use of the traditional continentality, that winter cooling may bias such measures, perhaps skewing the metric to indicate a climate more continental than actually experienced in other seasons.
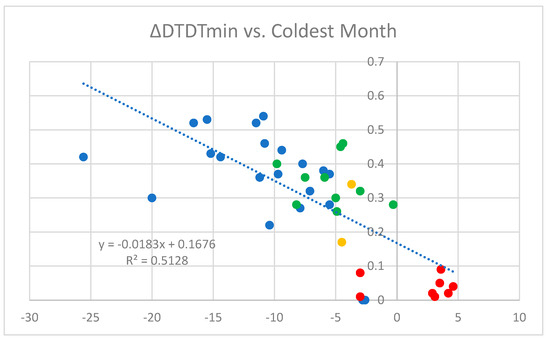
Figure 6.
∆DTDTmin (difference between annual and winter corrected DTDTmin) as a function of coldest month of the year (from climate normals).
4. Discussion
In this work, the coastalization metric introduced by [1] was applied to Canadian climate stations. The annually averaged day to day temperature variability of the minimum temperature proved to be a more effective identifier of coastal proximity than more traditional measures of continentality. Three coastal areas, the Atlantic Ocean, the Pacific Ocean, and the Great Lakes, were examined. A marine signal was clearly detected for all three areas compared to climate stations in land of these large water bodies. The behaviour for the Pacific coast was distinct from the other two regions. This is likely the result of a colder climate in the Great Lakes and Atlantic regions. By removing the winter months, December, January, and February, the metric calculation for the Atlantic Ocean and Great Lakes, the metric became consistent with Pacific Ocean values. The removal of these months from the Pacific Ocean climate stations yielded only a minor change in the metric. The “winter” effect was not identified in the analysis of climate stations along the China east coast [1] and southern coast [14] and seems to be related not to a seasonal drop in temperature, per se, but rather crossing the 0 °C threshold and the changes in climate as a result (e.g., ice formation). This warrants further investigation. Due to the narrower range of latitudes for the Canadian climate compared to [1], a latitudinal correction to DTDTmin was not found necessary.
5. Conclusions
A thermal metric previously applied to the east coast of China by [1,14] has been adapted for Canadian climate station data. Three coastal areas, the Atlantic Ocean, the Pacific Ocean, and the Great Lakes, were examined. It was necessary to apply a “winter” correction to account for a substantially altered climate when the temperature drops below 0 °C. This enabled consistency among the three marine regions examined. The DTDTmin metric was found to more clearly identify marine climates compared to more traditional measures of continentality.
Funding
This research was funded by NSERC, RGPIN-2018-06801.
Institutional Review Board Statement
Not applicable.
Informed Consent Statement
Not applicable.
Data Availability Statement
Not applicable.
Conflicts of Interest
The author declares no conflict of interest. The funders had no role in the design of the study; in the collection, analyses, or interpretation of data; in the writing of the manuscript, or in the decision to publish the results.
References
- Gough, W.A.; Shi, B. Impact of coastalization on day to day temperature variability along China’s east coast. J. Coast. Res. 2021, 36, 451–456. [Google Scholar] [CrossRef]
- Driscoll, D.M.; Yee Fong, J.M. Continentality: A basic climate parameter re-examined. Int. J. Clim. 1992, 12, 185–192. [Google Scholar] [CrossRef]
- Conrad, V. Usual formulas of continentality and their limits of validity. EOS 1946, 27, 663–664. [Google Scholar] [CrossRef]
- Szymanowski, M.; Bednarczyk, P.; Kryza, M.; Nowosad, M. Spatial interpolation of Ewert’s index of continentality in Poland. Pure Appl. Geophys. 2017, 174, 623–642. [Google Scholar] [CrossRef] [Green Version]
- Sakakibara, Y.; Owa, K. Urban–rural temperature differences in coastal cities: Influence of rural sites. Int. J. Climatol. 2005, 25, 811–820. [Google Scholar] [CrossRef]
- Gough, W.A. Theoretical considerations of day-to-day temperature variability applied to Toronto and Calgary, Canada data. Theor. Appl. Climatol. 2008, 94, 97–105. [Google Scholar] [CrossRef]
- Tam, B.Y.; Gough, W.A.; Mohsin, T. The impact of urbanization on day to day temperature variation. Urban Clim. 2015, 12, 1–10. [Google Scholar] [CrossRef]
- Gough, W.A.; Hu, Y. Day to day temperature variability for four urban areas in China. Urban Clim. 2016, 17, 80–88. [Google Scholar] [CrossRef]
- Anderson, C.A.; Gough, W.A.; Mohsin, T. Characterization and estimation of urban heat island at Toronto: Revisiting the choice of rural sites using a measure of day to day variation. Urban Clim. 2018, 25, 187–196. [Google Scholar] [CrossRef]
- Tam, B.Y.; Gough, W.A. Examining Past Temperature Variability in Moosonee, Thunder Bay and Toronto, Ontario, Canada through a Day-to-Day Variability Framework. Theor. Appl. Climatol. 2012, 110, 103–113. [Google Scholar] [CrossRef]
- Gough, W.A.; He, D. Diurnal temperature asymmetries and fog at Churchill, Manitoba. Theor. Appl. Climatol. 2015, 121, 113–119. [Google Scholar] [CrossRef]
- Laidler, G.J.; Ford, J.; Gough, W.A.; Ikummaq, T.; Gagnon, A.S.; Kowal, S. Travelling and hunting in a changing Arctic: Assessing Inuit vulnerability to sea ice change in Igloolik, Nunavut. Clim. Chang. 2009, 94, 363–397. [Google Scholar] [CrossRef]
- Bonacci, O.; Bonacci, D.; Roje-Bonacci, T. Different air temperature changes in continental and Mediterranean regions: A case study from two Croatian stations. Theor. Appl. Climatol. 2021, 145, 1333–1346. [Google Scholar] [CrossRef]
- Tong, X.; Wang, P.; Wu, S.; Luo, M. Urbanization effects on high frequency temperature variability over South China. Urban Clim. 2022, 42, 101092. [Google Scholar] [CrossRef]
- Hewer, M.J.; Gough, W.A. Lake Ontario Ice Coverage: Past, Present and Future. J. Great Lake Res. 2019, 45, 1080–1089. [Google Scholar] [CrossRef]


Publisher’s Note: MDPI stays neutral with regard to jurisdictional claims in published maps and institutional affiliations. |
© 2022 by the author. Licensee MDPI, Basel, Switzerland. This article is an open access article distributed under the terms and conditions of the Creative Commons Attribution (CC BY) license (https://creativecommons.org/licenses/by/4.0/).