Communication

Main Mechanical Forces to Analyse the Chemical Interactions Shaping Backbone Torsion Angles in DNA Tertiary Structures

by
Michele Larocca
1,*,
Giuseppe Floresta
2,
Daniele Verderese
3 and
Agostino Cilibrizzi
4,5
1
Dipartimento di Chimica e Biologia “Adolfo Zambelli”, Università di Salerno, Via Giovanni Paolo II, 84084 Fisciano, Italy
2
Department of Drug and Health Sciences, University of Catania, Viale A. Doria 6, 95125 Catania, Italy
3
Department of Pharmacy, Università di Salerno, Via Giovanni Paolo II, 132, 84084 Fisciano, Italy
4
Institute of Pharmaceutical Science, King’s College London, Stamford Street, London SE1 9NH, UK
5
Centre for Therapeutic Innovation, University of Bath, Bath BA2 7AY, UK
*
Author to whom correspondence should be addressed.
AppliedChem 2025, 5(4), 26; https://doi.org/10.3390/appliedchem5040026 (registering DOI)
Submission received: 5 August 2025 / Revised: 2 September 2025 / Accepted: 24 September 2025 / Published: 6 October 2025

Abstract

The genetic material in living systems is mainly stored in DNA molecules, which in turn play a dominant biological role in relation to the coding and transfer of genetic information, the biosynthesis of proteins and RNA and the packaging and regulation of DNA expression and accessibility. These features, strictly dictated by the three-dimensional structure of DNA, are governed by non-covalent chemical interactions that drive the folding process of these biological macromolecules. The Main Mechanical Forces (MMFs) approach is a recently formulated calculation method, based on the accurate prediction of structural features of biomolecules through an in-depth assessment of the interplay between specific non-covalent chemical interactions and related mechanical forces developed during the folding process. By adopting the MMFs method in the context of nucleic acids, we report here the results obtained in terms of predicting three-dimensional DNA oligomer tertiary structures. To this end, we have developed tailored nucleic acid-specific equations, enabling to predict the torsion angles (with a relevant level of agreement with experimental values) of the phosphate-sugar backbone of the three model molecules A-, B- and Z- DNA used in this study. To increase the validity of this methodology, we have conducted RMSD measurements, indicating that there is a weak but rather acceptable match between the calculated vs. predicted A-DNA structure, whereas the prediction of the BII-DNA and Z-DNA tertiary structures was fully correct.

1. Introduction

DNA or deoxyribonucleic acid (also known as the double helix) represents the predominant genetic material in living organisms, enabling the coding and transfer of genetic information [1]. The main features of a DNA structure are the complementarity of the nitrogenous base sequences on the two strands, which determine its physicochemical properties, as well as the polymeric double-helical nature [2]. Overall, DNA provides information for the correct biosynthesis of proteins and RNA molecules [1]. Additionally, the base sequence is the repository of information that enables both the packaging of the polymer and the regulation of its expression and accessibility. Indeed, the three-dimensional structure of DNA arises from the chemical and structural features of its two polynucleotide chains. Since these two chains are held together by hydrogen bonding interactions between the bases on the two strands, all of the nitrogenous bases are located on the inside of the double helix, while the sugar-phosphate backbone sits on the outer region of the structure [3]. This results in nucleic acids, being conformationally complex molecules, with the backbone consisting of seven bonds with rotational freedom, while the sugars have five bonds that can undergo pseudorotation. In this context, to interpret how nucleic acids fold, it is necessary to establish theoretical rules that are useful to limit the very large number of degrees of freedom normally present in this class of molecules [4]. To this end, in this work we sought to decipher possible principles of the nucleic acid folding process, based on the chemical interactions that occur amongst monomer units, ultimately leading to 3D folded DNA molecules. In particular, we have adopted the Main Mechanical Forces (MMFs) approach, previously set up to assess the folding features of peptides and oligopeptides [5,6,7,8,9]. In the present study, the MMFs method enabled us to identify with a high degree of confidence the types of chemical interactions that are determinant to calculate the backbone torsion angles (α, β, γ, δ, ε and ζ) of A-, B- and Z-DNA tertiary structures. The results indicate that the main chemical interactions that rule the folding of DNA molecules are the phosphate group electrostatic repulsions, the intra-strand π-π stacking and the inter-strand H-bonds between nitrogenous bases. In principle, the MMFs approach basically focuses on verifying specific chemical interplays, where the interacting atoms primarily establish monopole–monopole interactions, that can be simply described by the Coulomb force once the interatomic initial distances have been determined. In turn, it is possible to define the equations related to the potential energy and torque moment of the monopole–monopole system, having both the angles as the physical measures to be determined. As a result, by equalising the equations of potential energy and torque moment, it is possible to calculate the values of the angles of interest [5,6,7,8,9]. In this work, the specific rotations (i.e., precursor torsion angles) of each relevant chemical interaction (i.e., phosphate group electrostatic repulsions, intra-strand π-π interactions and nitrogenous base inter-strand H-bonds) were determined in three oligonucleotide model structures, namely PDB codes 440D (A-DNA) [10], 1AGH (BII-DNA) [11] and 1DCG (Z-DNA) [12]. Subsequently, for each DNA model structure (A, B or Z), tailored equations were established in order to calculate the related sugar-phosphate backbone torsion angles, which showcase a substantial agreement with the values previously reported in the literature for experimentally determined structures of the three oligonucleotides [4]. The superimposition of the calculated/predicted structures with those obtained experimentally primarily enabled us to observe a highly remarkable output with regard to the BII-DNA structure (RMSD = 2.3384 Å). Moreover, the result achieved with A-DNA (RMSD = 3.6463 Å) and Z-DNA (RMSD = 3.0186 Å) also highlights the solid efficiency of the MMFs method in predicting the 3D shape of these structures. A recent computational advance on the prediction of the 3D DNA structure was realized by developing a suitable software providing mean RMSD values in the range of 2.36–4 Å [13]. Subsequently, deep-learning approaches were also developed that provided reliable results, although some drawbacks were highlighted as key points to be further investigated [14]. In this context, our MMFs-based method is in line with these recent developments in the field, providing further information to support the setting up of suitable methods for DNA structural prediction.
Overall, the approach reported herein represents a valid tool for the prediction of DNA tertiary structure, providing an ideal balance between the easy methodology of computation, along with highly reliable structural prediction. Future work in this context will focus on the enhancement of predictive accuracy through taking into account sugar puckering parameters and sequence-dependent corrections, ultimately leading to improved calculation performances.

2. Materials and Methods

Initially, to calculate the backbone torsion angles of each of the three DNA model structures selected for this work (i.e., 440D (A-DNA) [10], 1AGH (BII-DNA) [11] and 1DCG (Z-DNA) [12]), we have directly translated the MMFs approach to the analysis of oligonucleotides, in a similar fashion to previous calculations, where we used the method to determine the backbone dihedral angle φ in peptides and oligopeptides [5,6,7,8,9]. Surprisingly, from the early phases of this study, we could observe that the folding factor, previously playing a critical role in the case of oligopeptides, is no longer required to determine torsion angles in oligonucleotides. Therefore, this led to the setting up of a straightforward calculation method, which is easier to apply for the study of DNA structures overall. Firstly, from the PDB files of the experimental structures, we have determined the initial distance (ri) among the interacting atoms of interest using VMD [15]. After the acquisition of ri values, by handling each interaction as a monopole-monopole interaction, it became possible to calculate the Coulomb force (Fi) acting between two interacting atoms (Equation (1)):
Fi = K·(δq)·(δq)/(ri)2
with K = 1.12·108 N·m2/C2 [5], while δq values are previously reported in the literature [16].
From the Coulomb force, we have set up the following Equation (2) which enables us to calculate the potential energy of the monopole–monopole system, for a partial torsion angle:
Ui = Fi·ri·cos(δφ)
where δφ is the partial torsion angle to be determined. In parallel, to calculate the torque moment it is necessary to establish the accurate value of the final distance (rf) of each occurring interaction. We have retrieved these distance values from the literature, namely rf for a dipolar interaction was fixed at 2.9 Å [5,6,7,8,9], except in the case of the π-π stackings, where the value of 4.0 Å [5,6,7,8,9,17] was used. With the suitable final distance (rf) for each occurring interaction, it was possible to define the equation for the torque moment (Equation (3)):
τ = Fi·rf·sin(δφ)
Lastly, once the equations for the potential energy (Equation (2)) and for the torque moment (Equation (3)) were both established, the calculation of δφ could be achieved through Equations (4)–(7).
U = τ
Fi·ri·cos(δφ) = Fi·rf·sin(δφ)
tg(δφ) = Fi·ri/Fi·rf
δφ = arctan(Fi·ri/Fi·rf)
With this newly developed calculation method, the following five precursor torsion angles were calculated (details of the atoms involved in the interactions are reported in the Supplementary Materials):
P = precursor torsion angle arising from the electrostatic repulsion of the phosphate groups;
π = precursor torsion angle arising from the intra-strand π-π stacking of the nitrogenous bases;
H1, H2 and H3 = precursor torsion angles arising from the inter-strand H-bonds of the nitrogenous bases.
For each structure, the predicted models, built using the average backbone torsion angles derived from Equations (8)–(43) (Table 1), were superimposed with the corresponding experimental crystallographic results [4]. Structural superposition was performed using the YASARA software (version 22.9.24) suite and applied to the sugar-phosphate backbone atoms, removing the influence of the nitrogenous bases to isolate backbone topological congruency. For each nucleotide residue, atoms corresponding to the base and the sugar atoms C1′ and C2′ were excluded from the superposition. This strategy enabled a more focused analysis on the conformational agreement of the phosphate-deoxyribose backbone, avoiding deviations due to base-specific orientations. Following superposition, the root-mean-square deviation (RMSD) values were calculated to quantify the structural agreement between the predicted and experimental models. The RMSD values obtained were as follows: A-DNA: 3.6463 Å; BII-DNA: 2.3384 Å; Z-DNA: 3.0186 Å.

3. Results

In this work, we have focused our attention on the possibility of finding a direct and simplified way to calculate the backbone torsion angles of A-, B- and Z-DNA tertiary structures. By adopting the MMFs approach, it was possible to calculate five precursor torsion angles (P, π, H1, H2 and H3). From these latter, through the suitably designed equations reported in Table 1 (Equations (8)–(43)), we have calculated the sugar-phosphate backbone torsion angles α, β, γ, δ, ε and ζ in the three oligonucleotide structures selected as proof-of-concept models for the study. With regard to the precursor torsion angles, we clarify herein that Equations (8)–(43) were appropriately designed to also enable the application of the model to mismatched pairs. As an example, when a specific inter-strand H-bond is missing, the specific equation used to determine the torsion angle of interest can be easily applied by simply adding 0° to the precursor H-bond torsion angle.
In Table 1, it can be observed that each particular DNA structure in turn requires distinct equations to calculate the backbone torsion angles. Furthermore, for Z-DNA it is also necessary to input a different factor in the case of either purines or pyrimidines. Equations (8)–(43) were built by comparing the calculated torsion angles with the average torsion angles values from the literature [4], as acquired through crystallographic analyses. In more detail, backbone torsion angles were calculated for each single base pair (see details in the Supplementary Materials), then these values were averaged to single values for each torsion angle and compared to the values reported in the literature [4], obtaining a high agreement. The average value results obtained with Equations (8)–(43) are listed in Table 2.
The values obtained arise from postulated and established chemical interactions that occur amongst the bases and the phosphate groups that, in turn, allowed us to determine the above-mentioned precursor torsion angles. To obtain such values, it was necessary to determine the interatomic distances between the interacting groups. These were retrieved from the PDB file of the three DNA structures, using VMD [15]. For each interaction and related precursor angle (P, π, H1, H2 and H3), the corresponding distances were measured and averaged to specific values that were used to build the predicted structures, in combination with the averaged backbone torsion angles reported in Table 2. In Table 3, the average interatomic distances calculated after determining the precursor torsion angles are listed.
In Table 3, the average interatomic distances calculated after determining the precursor torsion angles are listed. Using the data of average backbone torsion angles reported in Table 2, we have modelled each of the studied structures and subsequently compared the output to the corresponding experimental tertiary structure.
The RMSD values obtained after backbone superposition reflect the ability of the MMFs-derived torsion angles to recapitulate the essential features of the DNA tertiary structure, with deviations attributable primarily to minor discrepancies in local sugar puckering and groove width variability likely not captured by the averaged angle approximation.
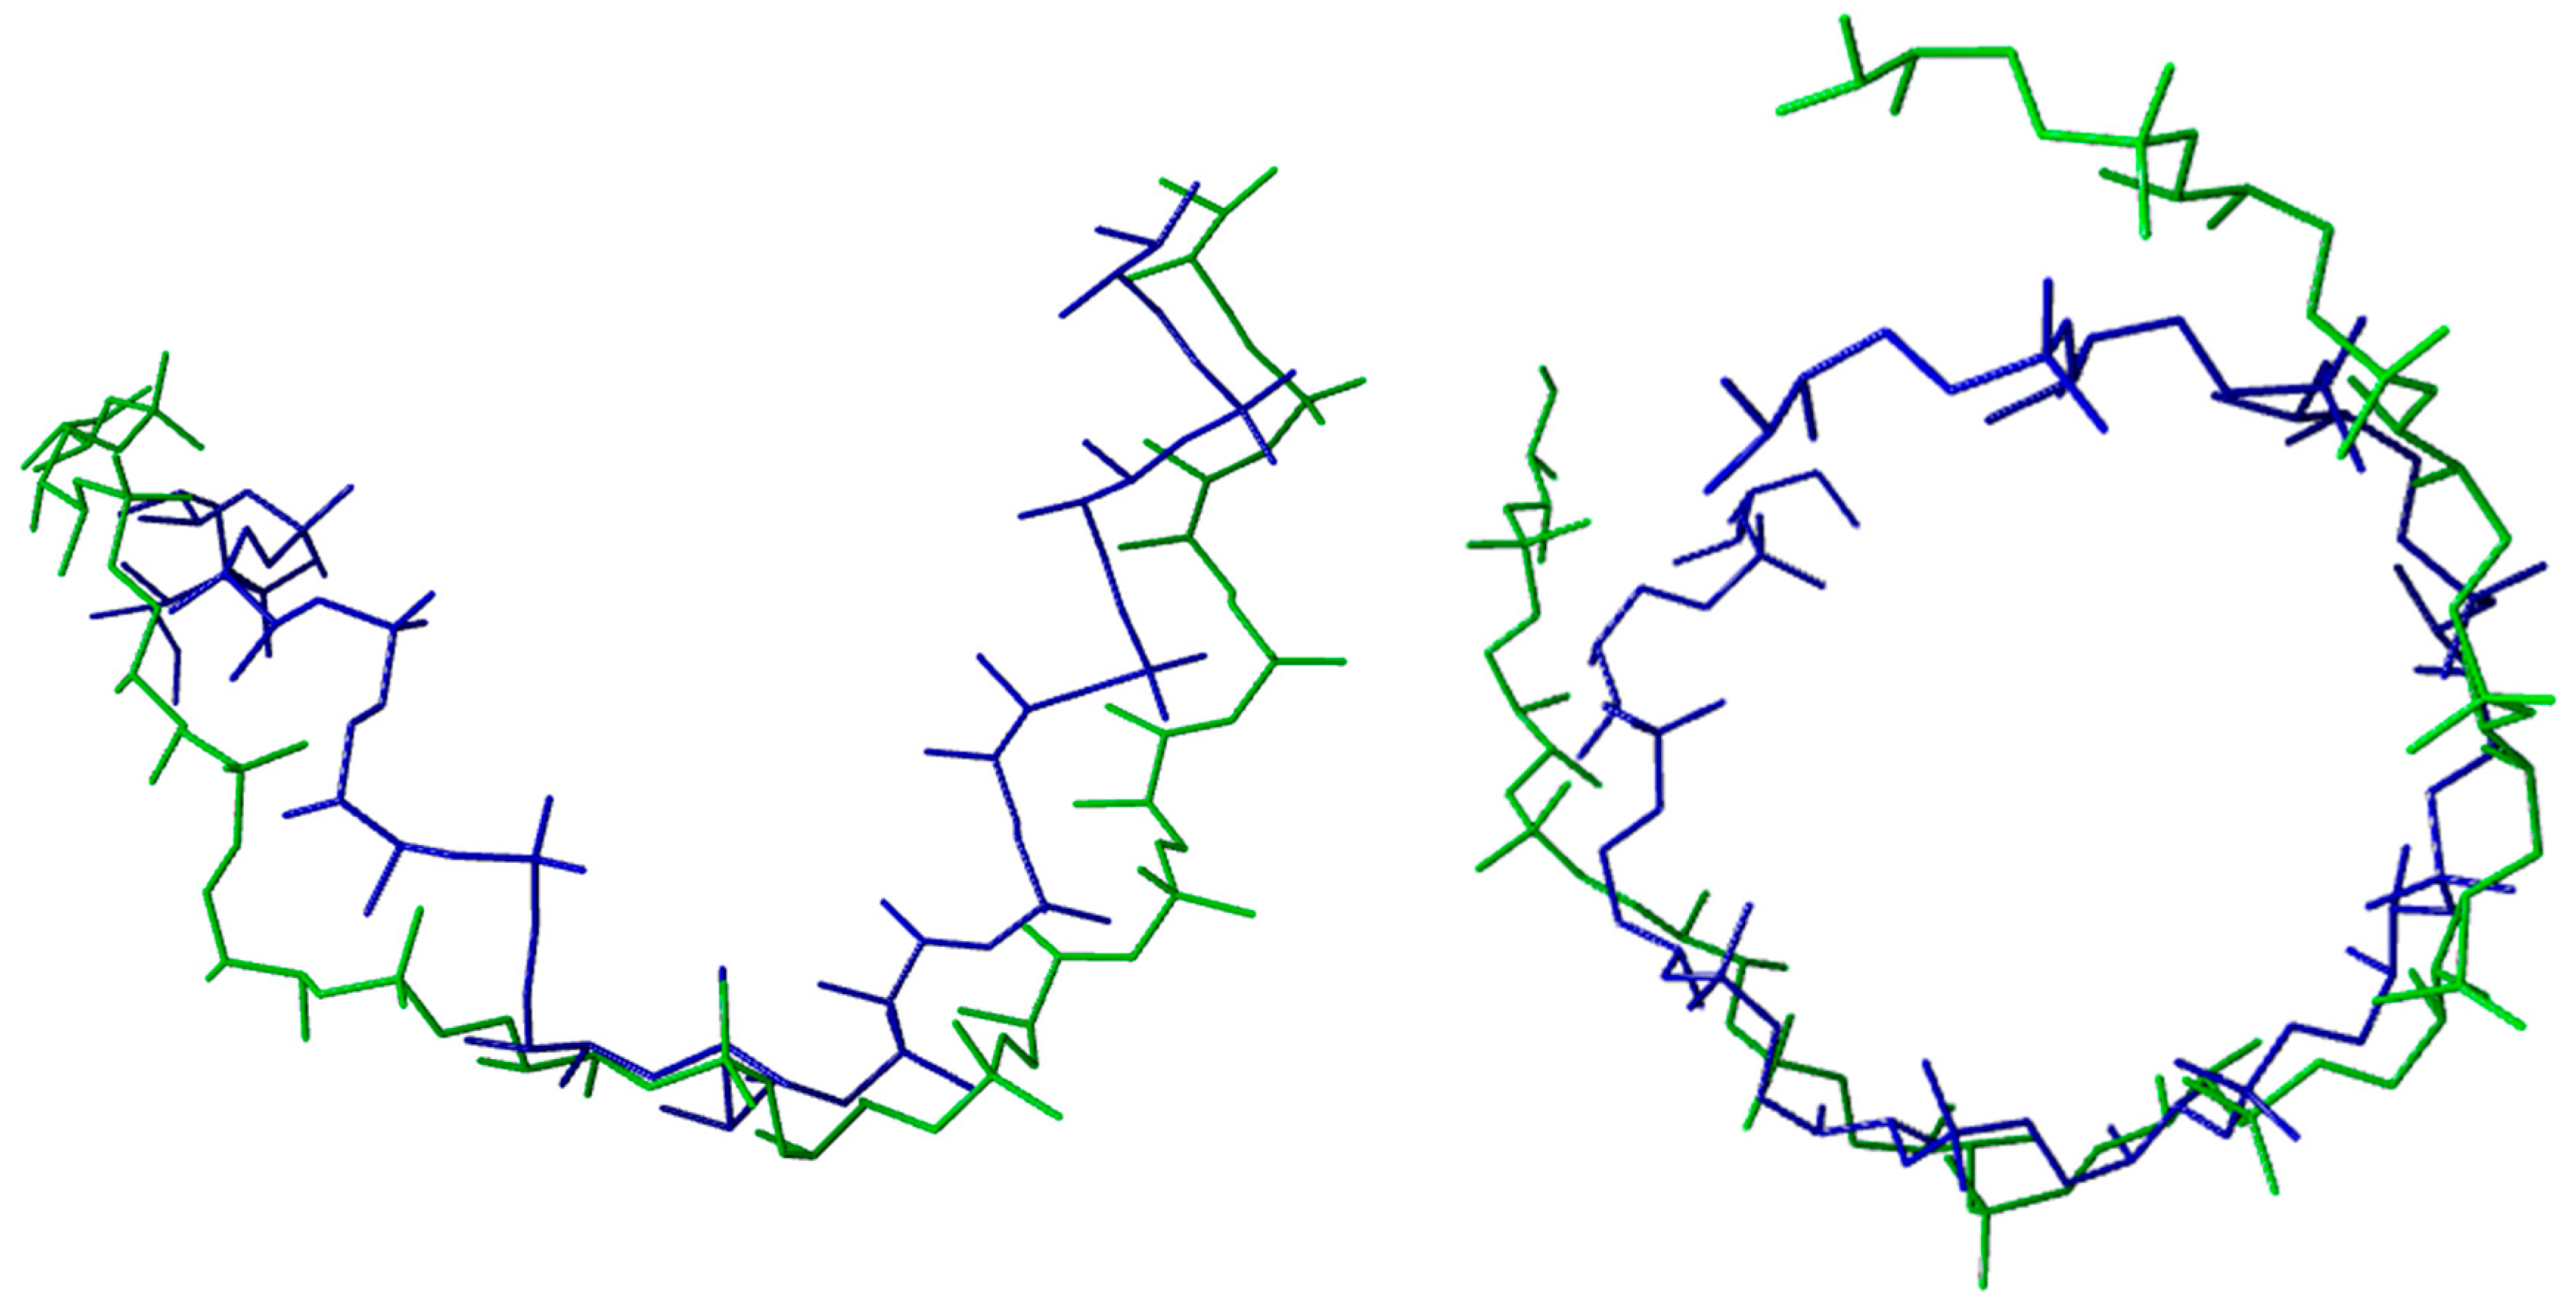
The lowest RMSD (2.3384 Å) was observed for BII-DNA (Figure 1), suggesting a particularly high agreement between the predicted and experimental structures. This is likely due to the relatively regular and extended geometry of B-DNA, which may be more effectively modelled using averaged torsion values derived from electrostatic and π-stacking interactions. The result confirms that the MMFs model is particularly suited to canonical forms such as BII-DNA, where structural variability is limited, and backbone conformations are well-conserved. In contrast, A-DNA presented a slightly higher RMSD value of 3.6463 Å (Figure 2). While still within a reasonable range, this elevated value may be attributed to the more compact nature of A-DNA helices and the greater inclination of base pairs, which could introduce geometric nonlinearity not fully addressed by torsion-based modelling alone. Additionally, the hydration state and helical conformation increase the differences in A-DNA, which may contribute to residual structural shifts, thereby increasing the deviation. Z-DNA also yielded a moderate RMSD (3.0186 Å, Figure 3), with structural differences likely arising from its left-handed helical twist and the alternating purine–pyrimidine sequence that imposes asymmetric constraints. Despite these complexities, the MMFs approach demonstrated robustness in modelling both purine and pyrimidine residues, supported by the tailored equations presented in Table 1. The RMSDs achieved underscore the potential of the method to handle non-canonical DNA conformations with a reasonable degree of precision.
Importantly, superposition was performed exclusively on the backbone atoms, with base moieties and C1′, C2′ carbons excluded to eliminate conformational noise from base stacking variations. This allowed for a cleaner assessment of the predictive performance of the MMFs-derived torsion angles, isolating structural features directly tied to backbone geometry.

4. Discussion and Conclusions

This study focuses on the definition of suitable equations (particularly, Equations (8)–(43)) to calculate and predict the sequence-determined torsion angle distribution of the sugar-phosphate backbone angles (α, β, γ, δ, ε and ζ) in three selected DNA tertiary structures (PDB codes 1AGH for A-DNA, 440D for BII-DNA and 1DCG for Z-DNA). These latter were used as model systems to validate this proof-of-concept calculation approach. To this end, we have adopted the MMFs theoretical methodology [5,6,7,8,9], previously set up for peptide structural prediction studies, in order to establish whether the method would also be a valid tool in structural prediction studies of DNA tertiary structures. Based on monopole–monopole interaction and also considering the empirical potential energy functions (such as potential energy and torque moment), the MMFs [5,6,7,8,9] approach enabled us to establish herein the most relevant non-covalent chemical interactions that define the folding mechanism, as well as the structural arrangement of the sugar-phosphate backbone of the model DNA tertiary structures. Overall, the following non-covalent chemical interactions were main determinants of the folding process: intra-strand electrostatic repulsion within phosphate groups, intra-strand π-π stacking at the level of the nitrogenous bases and the well-known inter-strand H-bonding. After comparison of calculated and experimental structures of the model oligonucleotides, we found that the method possesses a high accuracy in predicting both the structure (RMSD = 2.3384 Å) and folding mechanism in BII-DNA, while also providing remarkably valid outputs in relation to the tertiary structures of A-DNA (RMSD = 3.6463 Å) and Z-DNA (RMSD = 3.0186 Å). In comparison with established modelling platforms or molecular dynamics simulations, the MMFs approach should be regarded as a complementary and simplified strategy. Traditional MD-based methods provide highly accurate descriptions of nucleic acid conformations, especially when sequence-dependent effects, hydration and ionic environments are included, but they are computationally demanding and require careful parametrization. By contrast, the MMFs methodology relies on a reduced set of dominant chemical interactions and closed-form analytical equations, allowing a rapid and transparent estimation of torsion angles with negligible computational cost. While this inevitably comes at the expense of the fine-grained accuracy attainable with full-scale MD simulations, the RMSD values obtained (2–4 Å) remain comparable to those reported by more advanced approaches. Therefore, the MMFs method should not be considered a replacement for molecular dynamics or elastic network models, but rather a lightweight and theory-driven tool that can provide a fast first approximation of DNA tertiary structure, guiding further in-depth computational or experimental analyses. In summary, the RMSD values corroborate the efficacy of the MMFs method for modelling DNA structures at the backbone level. The approach offers a compelling balance between computational simplicity and experimental structural adherence, making it a promising tool for predicting DNA tertiary structure from basic principles. For the benefit of clarity, the method presented herein represents a preliminary investigation that leads to a valid starting point for the calculation/prediction of torsion angle in DNA structures. Undoubtedly, suitable improvements are needed, focusing on the introduction of possible additional factors (for instance, to account for the impact of the hydration and the puckering of the sugar), in order to refine coarse RMSD values, in particular in the case of A-DNA structures. Therefore, future work will focus on expanding this analysis by refining the torsion angle inputs with sequence-dependent corrections or, in parallel, integrating sugar puckering parameters to further enhance the predictive accuracy. In turn, this would also enable the application of these calculation principles to the study of alternative three-dimensional DNA structures, such as non-canonical DNA forms [18,19,20], including triplex, G-quadruplexes and i-motifs, which are receiving significant attention due to their involvement in telomers maintenance, as well as potential roles in diseases like cancer and neurodegenerative disorders.

Supplementary Materials

The following supporting information can be downloaded at https://www.mdpi.com/article/10.3390/appliedchem5040026/s1.

Author Contributions

The manuscript was written through the contributions of all authors and all authors have given approval for the final version of the manuscript. M.L.: Theory and methodology of calculation (data analysis, validation and curation), writing the first draft, revising the manuscript, supervision. G.F.: Structural alignment and analysis, writing the first draft, revising the manuscript. D.V.: Calculation (data analysis, validation and curation), writing the first draft. A.C.: Data analysis and curation, supervision, writing and revising the manuscript. All authors have read and agreed to the published version of the manuscript.

Funding

This research received no external funding.

Institutional Review Board Statement

Not applicable.

Informed Consent Statement

Not applicable.

Data Availability Statement

The original contributions presented in this study are included in the article/Supplementary Materials. Further in-quiries can be directed to the corresponding author(s).

Conflicts of Interest

The authors declare no conflicts of interest.

References

  1. Travers, A.; Muskhelishvili, G. DNA structure and function. FEBS J. 2025, 282, 2279–2295. [Google Scholar] [CrossRef]
  2. Watson, J.D.; Crick, F.H.C. Molecular structure of nucleic acids. Nature 1953, 171, 737–738. [Google Scholar] [CrossRef]
  3. Alberts, B.; Johnson, A.; Lewis, J.; Raff, M.; Roberts, K.; Walter, P. Molecular Biology of the Cell, 4th ed.; Garland Science: New York, NY, USA, 2002. [Google Scholar]
  4. Schneider, B.; Neidle, S.; Berman, H.M. Conformations of the sugar-phosphate backbone in helical DNA crystal structures. Biopolymers 1997, 42, 113–124. [Google Scholar] [CrossRef]
  5. Larocca, M.; Foglia, F.; Cilibrizzi, A. Dihedral Angle Calculations to Elucidate the Folding of Peptides through its Main Mechanical Forces. Biochemistry 2019, 58, 1032–1037. [Google Scholar] [CrossRef] [PubMed]
  6. Larocca, M.; Floresta, G.; Cilibrizzi, A. Principles that Rule the Calculation of Dihedral Angles in Secondary Structures: The cases of an α-helix and a β-sheet. J. Mol. Struct. 2021, 1229, 129802. [Google Scholar] [CrossRef]
  7. Larocca, M. Polypeptides folding: Rules for the calculation of the backbone dihedral angles ϕ starting from the amino acid sequence. ChemRxiv 2020, chemrxiv.12000132.v2. [Google Scholar] [CrossRef]
  8. Larocca, M.; Floresta, G.; Verderese, D.; Cilibrizzi, A. ‘Main Mechanical Forces-Chemical Interactions′ Interplay as a Tool to Elucidate Folding Mechanisms. Pept. Sci. 2024, 116, e24365. [Google Scholar] [CrossRef]
  9. Larocca, M.; Floresta, G.; Verderese, D.; Cilibrizzi, A. Dominant Chemical Interactions Governing the Folding Mechanism of Oligopeptides. Int. J. Mol. Sci. 2024, 25, 9586. [Google Scholar] [CrossRef] [PubMed]
  10. Gao, Y.-G.; Robinson, H.; Wang, A.H.-J. High-resolution A-DNA crystal structures of d(AGGGGCCCCT). Eur. J. Biochem. 1999, 261, 413–420. [Google Scholar] [CrossRef] [PubMed]
  11. Feng, B.; Stone, M.P. Solution structure of an oligodeoxynucleotide containing the human n-ras codon 61 sequence refined from 1H NMR using molecular dynamics restrained by nuclear Overhauser effects. Chem. Res. Toxicol. 1995, 8, 821–832. [Google Scholar] [CrossRef] [PubMed]
  12. Gessner, R.V.; Frederick, C.A.; Quigley, G.J.; Rich, A.; Wang, A.H. The molecular structure of the left-handed Z-DNA double helix at 1.0-A atomic resolution. Geometry, conformation, and ionic interactions of d(CGCGCG). J. Biol. Chem. 1989, 264, 7921–7935. [Google Scholar] [CrossRef] [PubMed]
  13. Zhang, Y.; Xiong, Y.; Xiao, Y. 3dDNA: A Computational Method of Building DNA 3D Structures. Molecules 2022, 27, 5936. [Google Scholar] [CrossRef] [PubMed]
  14. Li, J.; Chiu, T.P.; Rohs, R. Predicting DNA structure using a deep learning method. Nat. Commun. 2024, 15, 1243. [Google Scholar] [CrossRef] [PubMed]
  15. Humphrey, W.; Dalke, A.; Schulten, K. VMD: Visual molecular dynamics. J. Mol. Graph. 1996, 14, 33–38. [Google Scholar] [CrossRef] [PubMed]
  16. Cornell, W.D.; Cieplak, P.; Bayly, C.I.; Gould, I.R.; Merz, K.M., Jr.; Ferguson, D.M.; Spellmeyer, D.C.; Fox, T.; Caldwell, J.W.; Kollman, P.A. A Second Generation Force Field for the Simulation of Proteins, Nucleic Acids, and Organic Molecules. J. Am. Chem. Soc. 1995, 117, 5179–5197. [Google Scholar] [CrossRef]
  17. Hunter, C.A.; Sanders, J.K.M. The nature of pi.-.pi. interactions. J. Am. Chem. Soc. 1990, 112, 5525–5534. [Google Scholar] [CrossRef]
  18. Liao, T.-C.; Ma, T.-Z.; Chen, S.-B.; Cilibrizzi, A.; Zhang, M.-J.; Li, J.-H.; Zhou, C.-Q. Human telomere double G-quadruplex recognition by berberine-bisquinolinium imaging conjugates in vitro and in cells. Int. J. Biol. Macromol. 2020, 158, 1299–1309. [Google Scholar] [CrossRef]
  19. Obara, P.; Wolski, P.; Pańczyk, T. Insights into the Molecular Structure, Stability, and Biological Significance of Non-Canonical DNA Forms, with a Focus on G-Quadruplexes and i-Motifs. Molecules 2024, 29, 4683. [Google Scholar] [PubMed]
  20. Tateishi-Karimata, H.; Sugimoto, N. Chemical biology of non-canonical structures of nucleic acids for therapeutic applications. Chem. Commun. 2020, 56, 2379–2390. [Google Scholar] [CrossRef] [PubMed]
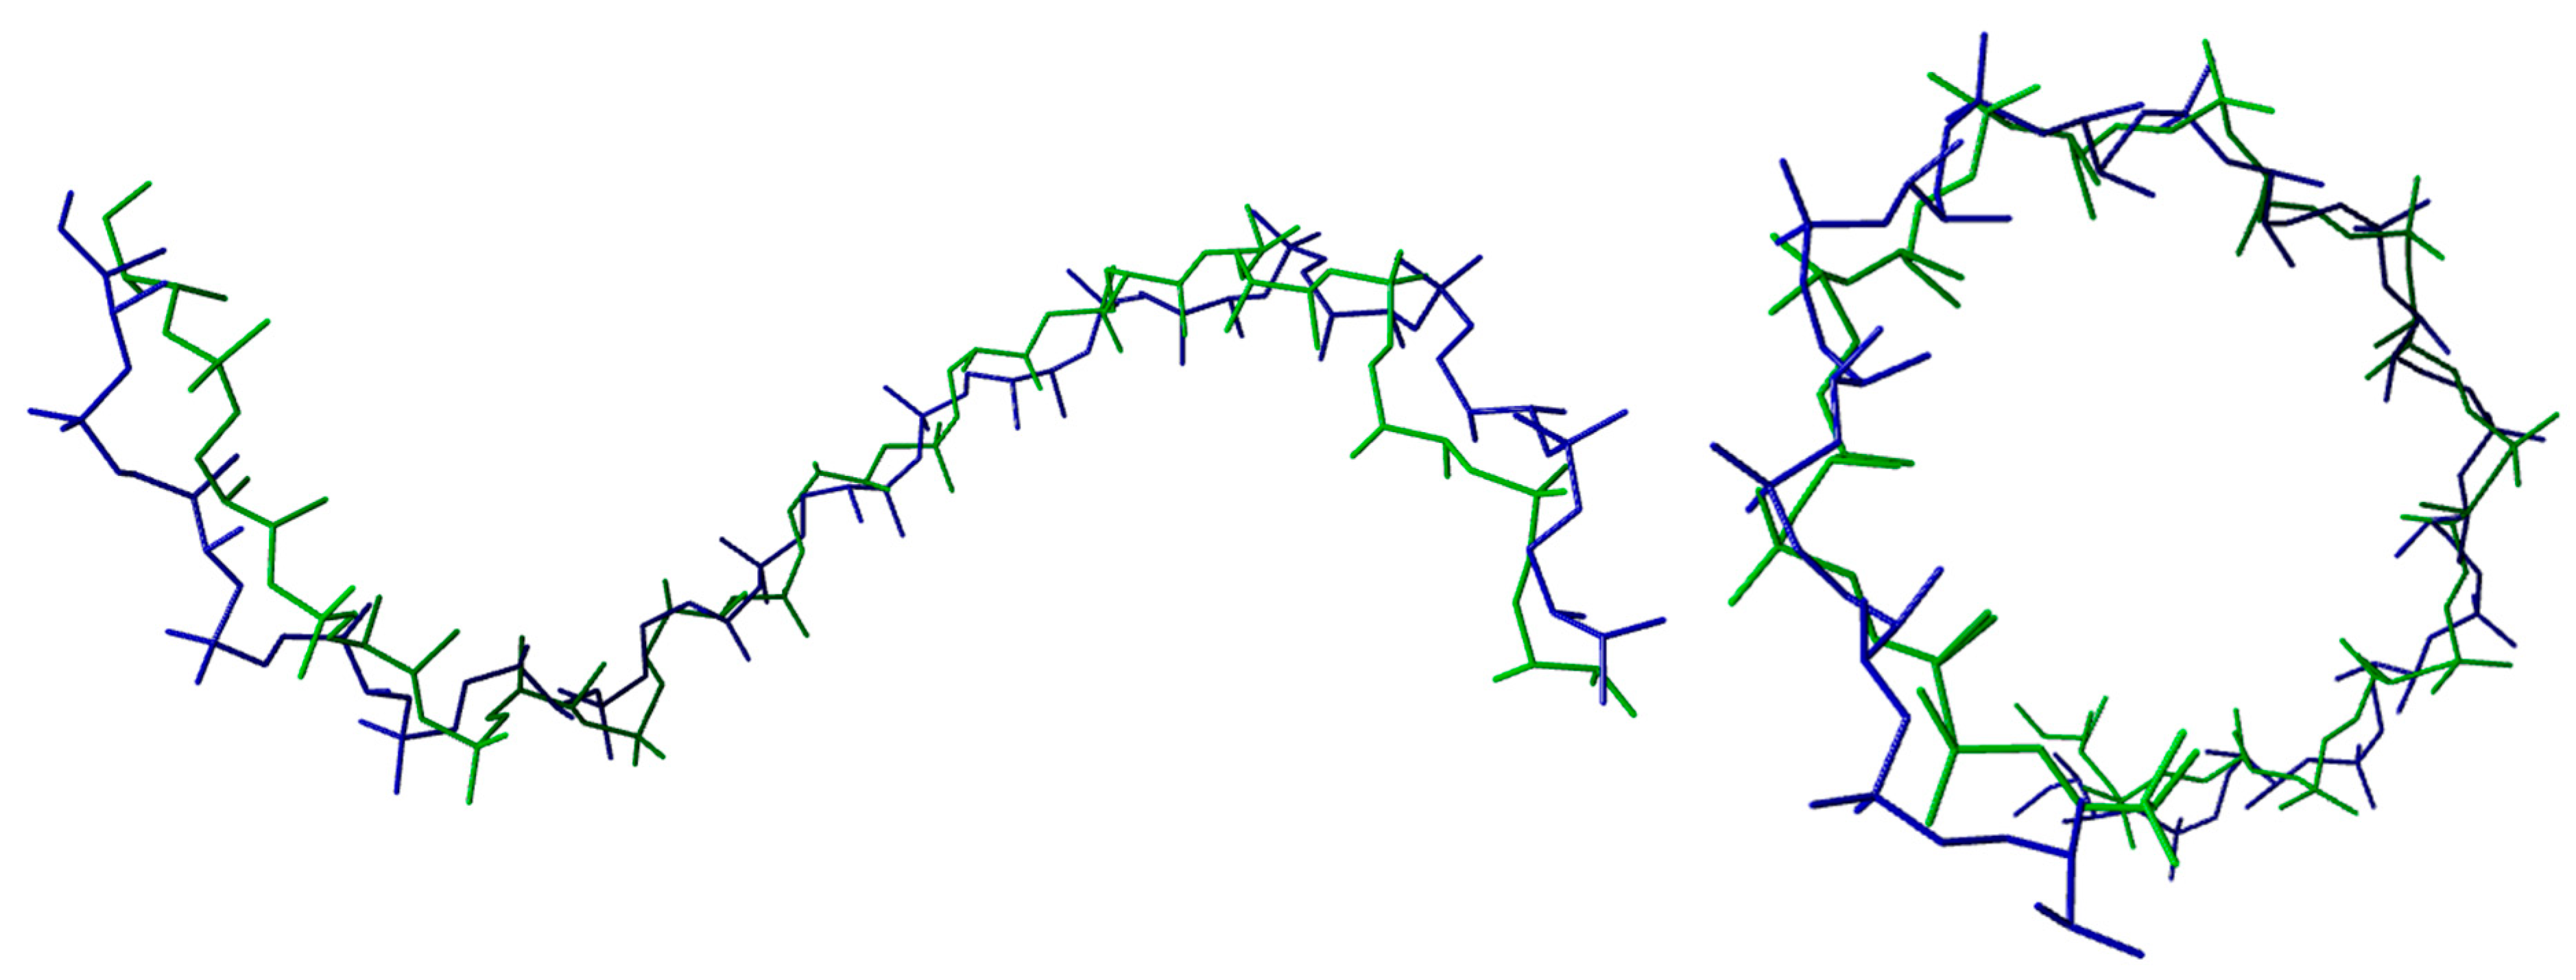
Figure 1. Structural superposition of BII-DNA (PDB code: 1AGH). The original crystallographic structure is shown in green, while the MMFs-calculated model is displayed in blue. Both structures have been simplified by removing the nucleobases and the C1′ and C2′ atoms of the sugar moiety, in order to highlight the phosphate-deoxyribose backbone. The superposition reveals a consistent global backbone conformation, with minor deviations attributable to local structural features.
Appliedchem 05 00026 g001
Figure 2. Structural superposition of A-DNA (PDB code: 440D). The original crystallographic structure is shown in green, while the MMFs-calculated model is displayed in blue. Both structures have been simplified by removing the nucleobases and the C1′ and C2′ atoms of the sugar moiety, in order to highlight the phosphate-deoxyribose backbone. The superposition reveals a consistent global backbone conformation, with minor deviations attributable to local structural features.
Appliedchem 05 00026 g002
Figure 3. Structural superposition of Z-DNA (PDB code: 1DCG). The original crystallographic structure is shown in green, while the MMFs-calculated model is displayed in blue. Both structures have been simplified by removing the nucleobases and the C1′ and C2′ atoms of the sugar moiety, in order to highlight the phosphate-deoxyribose backbone. The superposition reveals a consistent global backbone conformation, with minor deviations attributable to local structural features.
Appliedchem 05 00026 g003
Table 1. Equations (8)–(43) established to calculate the backbone torsion angles from the precursor torsion angles (P, π, H1, H2 and H3), firstly determined through the MMFs approach. P = precursor torsion angle arising from the electrostatic repulsion of the phosphate groups; π = precursor torsion angles arising from the intra-strand π-π stacking of the nitrogenous bases; H1, H2 and H3 = precursor torsion angles arising from the inter-strand H-bonds.
DNA TERTIARY STRUCTURE
A-DNAB-DNAZ-DNA
AT or TAGC or CGAT or TAGC or CGPURINESPYRIMIDINES
Equations to Calculate the Sugar-Phosphate Backbone Torsion Anglesα° = 360° − P
(8)
α° = 360° − P
(14)
α° = 360° − P
(20)
α° = 360° − P
(26)
α° = P
(32)
α° = 360° − (P + H1 + H2 + H3)
(38)
β° = P + π + H1 + H2 + H3
(9)
β° = P + π + H1 + H2 + H3
(15)
β° = π + H1 + H2 + 30°
(21)
β° = π + H1 + H2 + H3
(27)
β° = (P/2) + π + H1 + H2 + H3
(33)
β° = P + π + H1 + H2 + H3
(39)
γ° = π
(10)
γ° = π
(16)
γ° = π
(22)
γ° = π
(28)
γ° = (P/3) + π + H1 + H2 + H3
(34)
γ° = π
(40)
δ° = (P/2) + π
(11)
δ° = (P/2) + π
(17)
δ° = π + H1 + H2 + 30°
(23)
δ° = π + H1 + H2 + H3
(29)
δ° = H1 + H2 + H3
(35)
δ° = π + H1 + H2 + H3
(41)
ε° = P + π + H1 + H2 + 30°
(12)
ε° = P + π + H1 + H2 + H3
(18)
ε° = 2P + π + H1 + H2
(24)
ε° = 2P + π + H1 + H2 + H3
(30)
ε° = P + π + H1 + H2 + H3
(36)
ε° = P + (2∙π) + H1 + H2 + H3
(42)
ζ° = 360° − (H1 + H2)
(13)
ζ° = 360° − (H1 + H2)
(19)
ζ° = P + π + H1 + H2
(25)
ζ° = 360° − [(P/2) +π + H1 + H2 + H3]
(31)
ζ° = 360° − π
(37)
ζ° = (π + H1 + H2 + H3)/2
(43)
Table 2. Calculated and experimental average backbone torsion angles for A-, B- and Z-DNA.
A-DNA (PDB CODE: 440D)
Average Torsion Angles (°)αβγδεζ
Calculated295 ± 3181 ± 450 ± 382 ± 3213 ± 5294 ± 1
Experimental293 ± 17174 ± 456 ± 1481 ± 7203 ± 12289 ± 12
BII-DNA (PDB CODE: 1AGH)
Average Torsion Angles (°)αβγδεζ
Calculated293 ± 3146 ± 449 ± 4146 ± 4249 ± 5180 ± 4
Experimental298 ± 15146 ± 848 ± 11144 ± 7246 ± 15174 ± 14
Z-DNA (PDB CODE: 1DCG)—PURINES
Average Torsion Angles (°)αβγδεζ
Calculated69 ± 3191 ± 3180 ± 299 ± 1226 ± 4302 ± 1
Experimental71 ± 13183 ± 9179 ± 995 ± 8240 ± 9301 ±16
Z-DNA (PDB CODE: 1DCG)—PYRIMIDINES
Average Torsion Angles (°)αβγδεζ
Calculated191 ± 2219 ± 750 ± 7150 ± 8269 ± 1475 ± 4
Experimental201 ± 20225 ± 1654 ± 13141 ± 8 267 ± 975 ± 9
Table 3. Average distances of interacting atoms that determine the backbone torsion angles. H3 refers to only GC or CG base pairs. The atoms involved in all of the described chemical interactions are reported in a spreadsheet in the Supplementary Materials.
Chemical InteractionsPhosphate Groups Electrostatic RepulsionIntra-Strand
π-π Stacking
H-Bond 1H-Bond 2H-Bond 3
(Only for GC or CG Base Pairs)
Average Interatomic Distances (Å) for A-DNA Structure
(PDB CODE: 440D)
6.31 ± 0.814.76 ± 0.441.89 ± 0.091.89 ± 0.071.80 ± 0.12
Average Interatomic Distances (Å) for BII-DNA Structure
(PDB CODE: 1AGH)
6.98 ± 0.794.65 ± 0.581.86 ± 0.101.85 ± 0.041.88 ± 0.06
Average Interatomic Distances (Å) for Z-DNA Structure
(PDB CODE: 1DCG): PURINES
7.63 ± 1.036.37 ± 0.141.86 ± 0.041.92 ± 0.011.86 ± 0.05
Average Interatomic Distances (Å) for Z-DNA Structure
(PDB CODE: 1DCG): PYRIMIDINES
7.52 ± 0.954.92 ± 1.351.85 ± 0.031.95 ± 0.041.93 ± 0.03
Disclaimer/Publisher’s Note: The statements, opinions and data contained in all publications are solely those of the individual author(s) and contributor(s) and not of MDPI and/or the editor(s). MDPI and/or the editor(s) disclaim responsibility for any injury to people or property resulting from any ideas, methods, instructions or products referred to in the content.