Article

Justification of Complex Physical–Chemical Criteria for Flotation Processing Efficiency in Waste Recycling Using Paper De-Inking as an Example †

by
Tatyana Aleksandrova
1,2,
Valentin Kuznetsov
1,* and
Nikita Shlykov
2
1
Mineral Processing Department, Empress Catherine II Saint-Petersburg Mining University, Saint-Petersburg 199106, Russia
2
Department of Machines and Automated Systems, Saint-Petersburg State University of Industrial Technologies and Design, Saint-Petersburg 191186, Russia
*
Author to whom correspondence should be addressed.
This paper is an extension of a conference paper. Aleksandrova, T.N.; Kuznetsov, V.V.; Shlykov, N.A. Physicochemical criteria for assessing the efficiency of flotation paper deinking technologies. In Proceedings of the 2025 VI Russian National Scientific and Practical Conference “Modern Trends in the Development of Chemical Technology, Industrial Ecology and Environmental Safety”, Saint-Petersburg, Russia, 10–11 April 2025.
AppliedChem 2025, 5(3), 20; https://doi.org/10.3390/appliedchem5030020
Submission received: 9 June 2025 / Revised: 18 July 2025 / Accepted: 21 August 2025 / Published: 27 August 2025

Abstract

In this work, a set of methods for the study of the physical–chemical properties of flotation processing products was applied to establish parameters for the technological mode of anthropogenic raw material flotation processing using waste paper as an example. The proposed methods include the criterion Ef estimation, which characterizes the interfacial characteristics during flotation, and the criterion J determination, which characterizes the degree of purification of the obtained paper mass. The estimation of criterion Ef is based on the measurement of electric potential difference during flotation. The estimation of criterion J is based on spectrophotometric studies of the flotation product’s optical properties. Based on dispersion analysis, it was established that the proposed criteria are statistically dependent on the variation of the flotation purification mode parameters. The results of the study of flotation processing products show that the criterion Ef is sensitive to the recovery selectivity of dye particles in the froth product. In conjunction with the criterion of optical purity, J, it can be used to assess the effectiveness of proposed solutions of hardware design and the technological mode of flotation separation.

1. Introduction

Today, the main paradigm of industrial and environmental development is the creation and improvement of low-waste and waste-free technologies that will help to achieve maximum utility of processed raw materials and generated production waste [1,2,3]. The most promising areas of implementation of such technologies are the mining and metallurgical industry [4,5,6] and a whole range of chemical industry facilities [7,8,9]. This is due to not only the scale of potential technogenic resource generation but also the hardware and technological capabilities available for their processing [10,11,12]. However, recycling of these resources requires the application of rather complex technological solutions that ensure the fulfillment of economic and environmental requirements [13,14,15].
Waste paper is an example of such a raw material. In the production of graphic papers, sanitary napkins, and lightweight paperboard topliners, this raw material is becoming increasingly important. Today, many companies have abandoned the use of virgin fibers in favor of raw materials consisting of 100% recovered paper. An important condition for the use of recycled fibers in the production of high-quality products is the removal of components from recovered paper that negatively affect optical clarity, which can be caused, for example, by printing inks. The complexity of this task is due to the need to maintain specific conditions for the optical purity of the final product, which creates the need to improve the technologies applied for waste paper processing [16,17,18].
The perceived purity of paper fibers depends on the optical capabilities of the human eye. Visible particle size ranges from 30 to 80 μm. The criterion for evaluating the region of “invisible” components is the degree of reflectance of the fiber stock at 457 nm wavelength, which is defined as brightness. Typical representatives of components that reduce the brightness of waste paper are conventional printing inks, oil-based binders, and water-based flexo inks with fixatives. A proven solution to remove ink from recovered paper for recycling is flotation [19,20]. To assess the results of flotation de-inking, various spectrophotometric techniques can be used to measure the various optical properties of the obtained fibers or the contact solution [21,22].
Flotation de-inking has several significant advantages over mechanical paint removal processes such as laundering and centrifugal cleaning [23,24,25]:
High fiber yield, i.e., low number of fine torn wood structures;
Selective recovery of dye particles and, as a consequence, de-inking of the obtained paper.
Improving the efficiency of these technologies is possible by improving reagent regimes and equipment design with the use of various approaches to modeling of separation processes [26,27,28]. The use of modeling techniques allows the pilot test costs to be significantly reduced and the existing technologies to be replicated for a wider range of recovered paper raw materials. Justification of process models requires physical–chemical parameters of flotation separability applied specifically to the raw materials [29,30,31].
Parameters that can characterize the dynamic of the flotation separation process can be obtained from the surface properties of the materials. One such property is the value of the electrokinetic potential (zeta potential) from the electric double layer forming on the particle–water interface. The value of this charge determines the interaction of the solid surface with the flotation reagents and affects the flotation performance [32]. However, existing techniques for zeta potential measurements cannot adequately determine its values, its changes, and its distribution for different particles in the flotation process without disrupting it. For this purpose, the principle of the Dorn effect can be used. This effect arises from the charged particles’ motion in a specific direction, thus creating an electromagnetic field during processes like sedimentation [33,34]. For the assessment of flotation separation efficiency, this principle is used to prove the correlation between the bubble size distribution and value of the zeta potential [35].
Thus, the purpose of this work was to substantiate a set of criteria for numerical characterization of flotation efficiency using recovered paper as an example.

2. Materials and Methods

The object of the study was samples of office paper with 50% of the sheet area sealed with printer ink. The paper density was 80 g/m2. Determination of the studied paper samples composition was carried out in two stages. First, the ash content of the paper was determined by burning the sample in a muffle furnace. Then, the elemental composition of the obtained ash was investigated by X-ray fluorescence spectroscopy.
Flotation experiments of de-inking were carried out on a pneumomechanical flotation machine with forced air supply and disk impeller (type FML0.3–189FL). The volume of the cell was 100 mL. The solid content in the process was 5–7%. Waste paper was preliminarily pulverized on a laboratory pulper with a specified pulverization time at pH = 9.5–9.8 created by sodium carbonate. The impeller speed was 1200 rpm with a developing drive power of 120 W. The obtained macular mass was investigated using potentiometric study of the interfacial characteristics to evaluate the flotation separation efficiency. This approach is based on the resulting potential difference between electrodes located at different heights during the settling of heterogeneously charged particles. This approach was used to evaluate the efficiency of flotation separation in [36,37,38]. The schematic diagram of the installation for the study of the interfacial characteristics using potentiometry methods is shown in Figure 1. Two electrodes made of titanium alloy VT1-0 are placed in the water column. The height of the column is 35.5 cm. The length of the electrodes is 20.5 cm. The diameter of the electrodes is 0.8 cm. The ends of the electrodes are placed at different heights. The height difference is 5 cm. A voltmeter is connected to the ends of the electrodes in the air by terminals to record the values of the resulting potential difference. An air supply tube is connected to the column from below, which is connected to an air compressor (R385, «Distiv», Rostov-on-don, Russia). The air compressor should provide air flow rate not less than 0.5 L/min. The height of the compressor should be higher than the top edge of the column. At the bottom of the column a plastic grid with a sieve mesh diameter of 0.5 cm is installed to ensure dispersion of the supplied air [39].
To determine the interfacial characteristics for the solid–liquid–gas system, first take a sample of the material under study based on the required value of the solid content for flotation separation. The sample is placed in the column and the volume of the mixture is brought to 150 mL with distilled water and stirred for 5 to 10 min. After loading the suspension into the column, the air supply is switched on and the values of the resulting potential difference are recorded on a voltmeter for at least 10 min. The potential difference starts to be recorded from 30 s after the air supply. The values obtained are interpreted using the following equation:
U   =   E f ln t   +   C
where U —measured values of the resulting potential difference, V; t —analysis time, sec; E f —the parameter characterizing interfacial phenomena in the flotation system, V/s; C —correction factor, taking into account the background due to ionic composition of the medium. Parameter values E f and C were determined by applying the least squares method.
The Ef criterion value characterizes the non-uniformity of motion of particles with different surface charge in a medium with an upward air flow. Due to selective hydrophobization of the surface of some particles after the collector adsorption, the direction of their movement will be changed. The collector adsorption also results in the change of the particles’ zeta-potential value. Moving of these charged particles will result in the electric potential difference in the cell. The value of this difference correlates with the amount and velocity of homonymously charged particles moving in same direction and their charge. Therefore, through the flotation process, the amount of the particles that will be transported to the froth and that will sink will change. The rate of this change directly correlates with the flotation separability and in our work is characterized by the Ef criterion.
In order to quantitatively characterize the optical properties of the waste paper pulp, a spectrophotometric method was used to study the extracts of contact solutions. For this purpose, the spectrophotometer “Unico 2100” (United Products & Instruments, Inc., Dayton, NJ, USA) was used.
Comparison of optical properties of the obtained waste paper pulp after flotation separation of dye was carried out on the basis of the optical purity criterion (J) in the step dependence of the transmittance coefficient and wavelength of the passing light beam:
T   =   A λ J
The higher the transmittance, the cleaner the obtained macular mass. Thus, the higher the value of J, the higher the transmittance of the extracted sample in the larger wave range. Froth products of flotation cleaning of waste paper pulp were analyzed by laser diffractometry method from the position of distribution of paint and fiber particles by size. The device used was the laser diffraction particle analyzer “Malvern Mastersizer 2000”. The essence of optical–microscopic studies of flotation products of the waste paper pulp was to analyze the size distribution of paint particles in the froth and chamber flotation products. The samples were analyzed by optical microscope Axio Lab A1 in the light field at magnification 12.6×. The contrast of dye color compared to waste paper fibers allowed us to implement software image analysis (DG Analyzer 1.5 program Win 32 bit, ver. 1.0). The obtained image was converted into black and white scale. Paint particles represented white areas. The program calculated geometric parameters of these regions and uploaded the result as values of equivalent diameters of each region. Filling of closed regions was used to eliminate falsely detected objects. Representativeness of the obtained results was ensured by processing 5 images of different sample areas and joint mathematical processing of the selected objects.
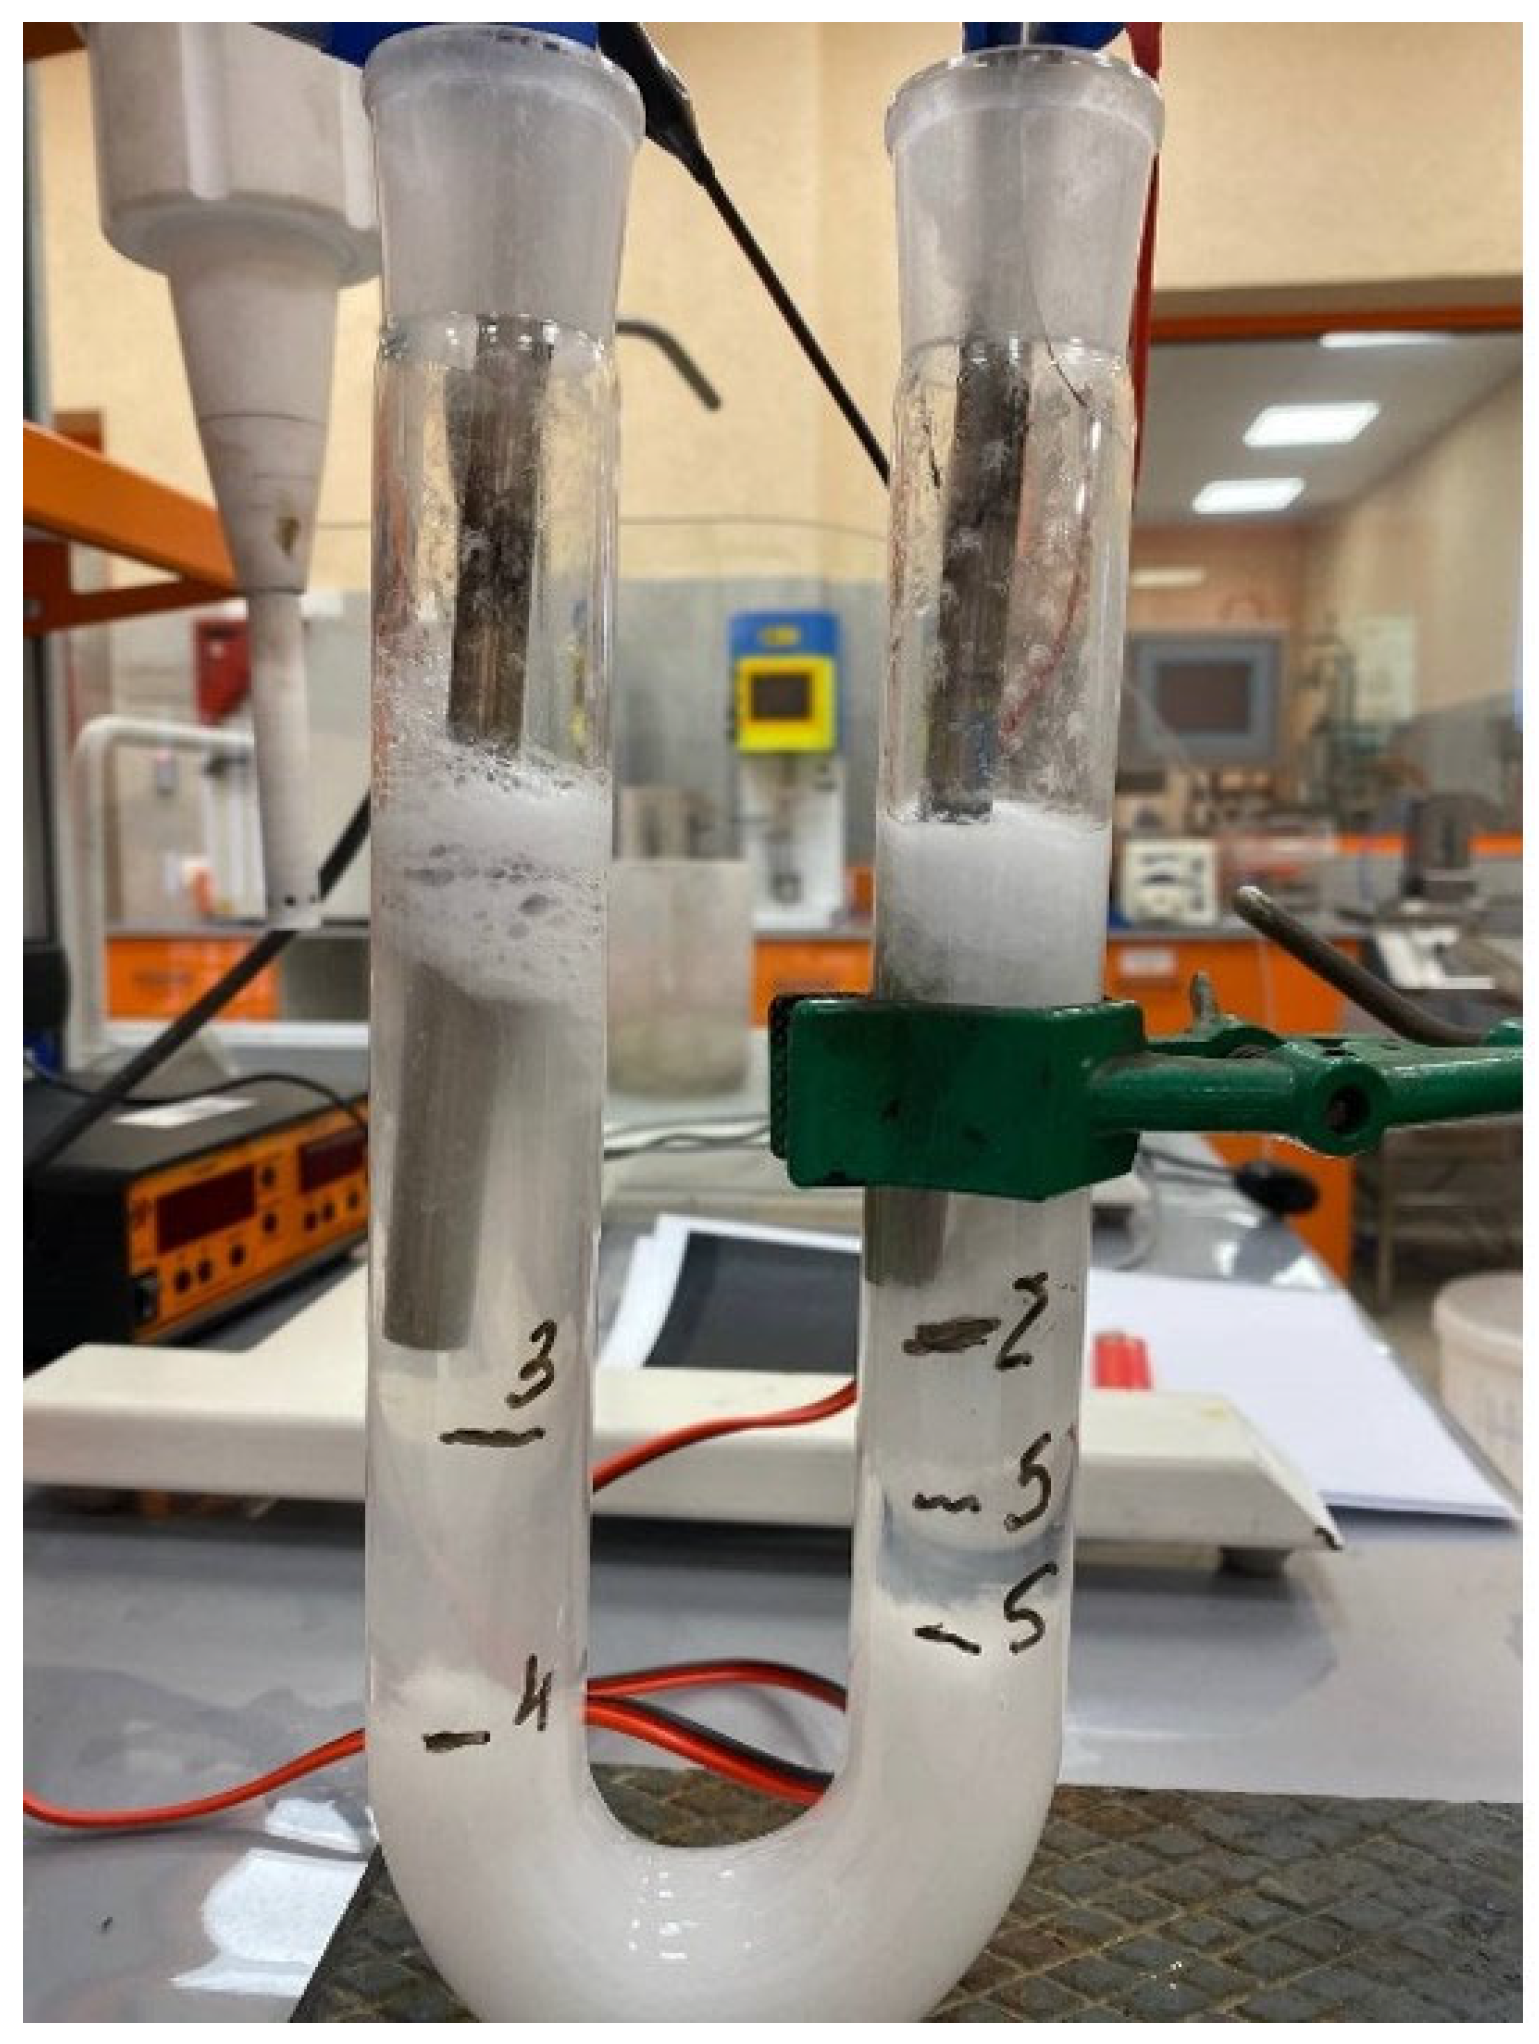
The essence of the studies was to determine the electrokinetic potential of the sample particles by electrophoresis. The studies were carried out in a U-shaped tube using electrodes made of VT1-0 alloy (Figure 2). A clean electrophoresis device washed with distilled water was half filled with lateral liquid. The device was fixed in a tripod, and electrodes were placed in its upper part so that their lower end was at a distance of 1.0 ÷ 1.5 cm from the top of the tube. The colloidal solution under study is poured into a funnel with a capillary, and the capillary, through the narrow tube of the device, is immersed in the lateral liquid. The apparatus is slowly filled with the colloidal solution of the macular mass, which remains at the bottom of the apparatus, displacing the lateral liquid upwards. The device was filled with ash until the electrodes were immersed in the lateral liquid by 0.5 ÷ 1.0 cm. Then a voltage of 109.7 V was applied to the electrodes and the height of displacement of the ash level and the time of this displacement were measured. Calculation of electrokinetic potential ( ζ ) was performed according to the formula:
ζ   =   η v ε ε 0 H
where η—media viscosity (N×s/m2); ε—dielectric constant; ε0—electrical constant equal to 8.85 × 10⁻¹² F/m; v —linear velocity of particles (m/s); H—gradient of the externally applied electric field (V/m).

3. Results

3.1. Results of Sample Elemental Composition Analysis

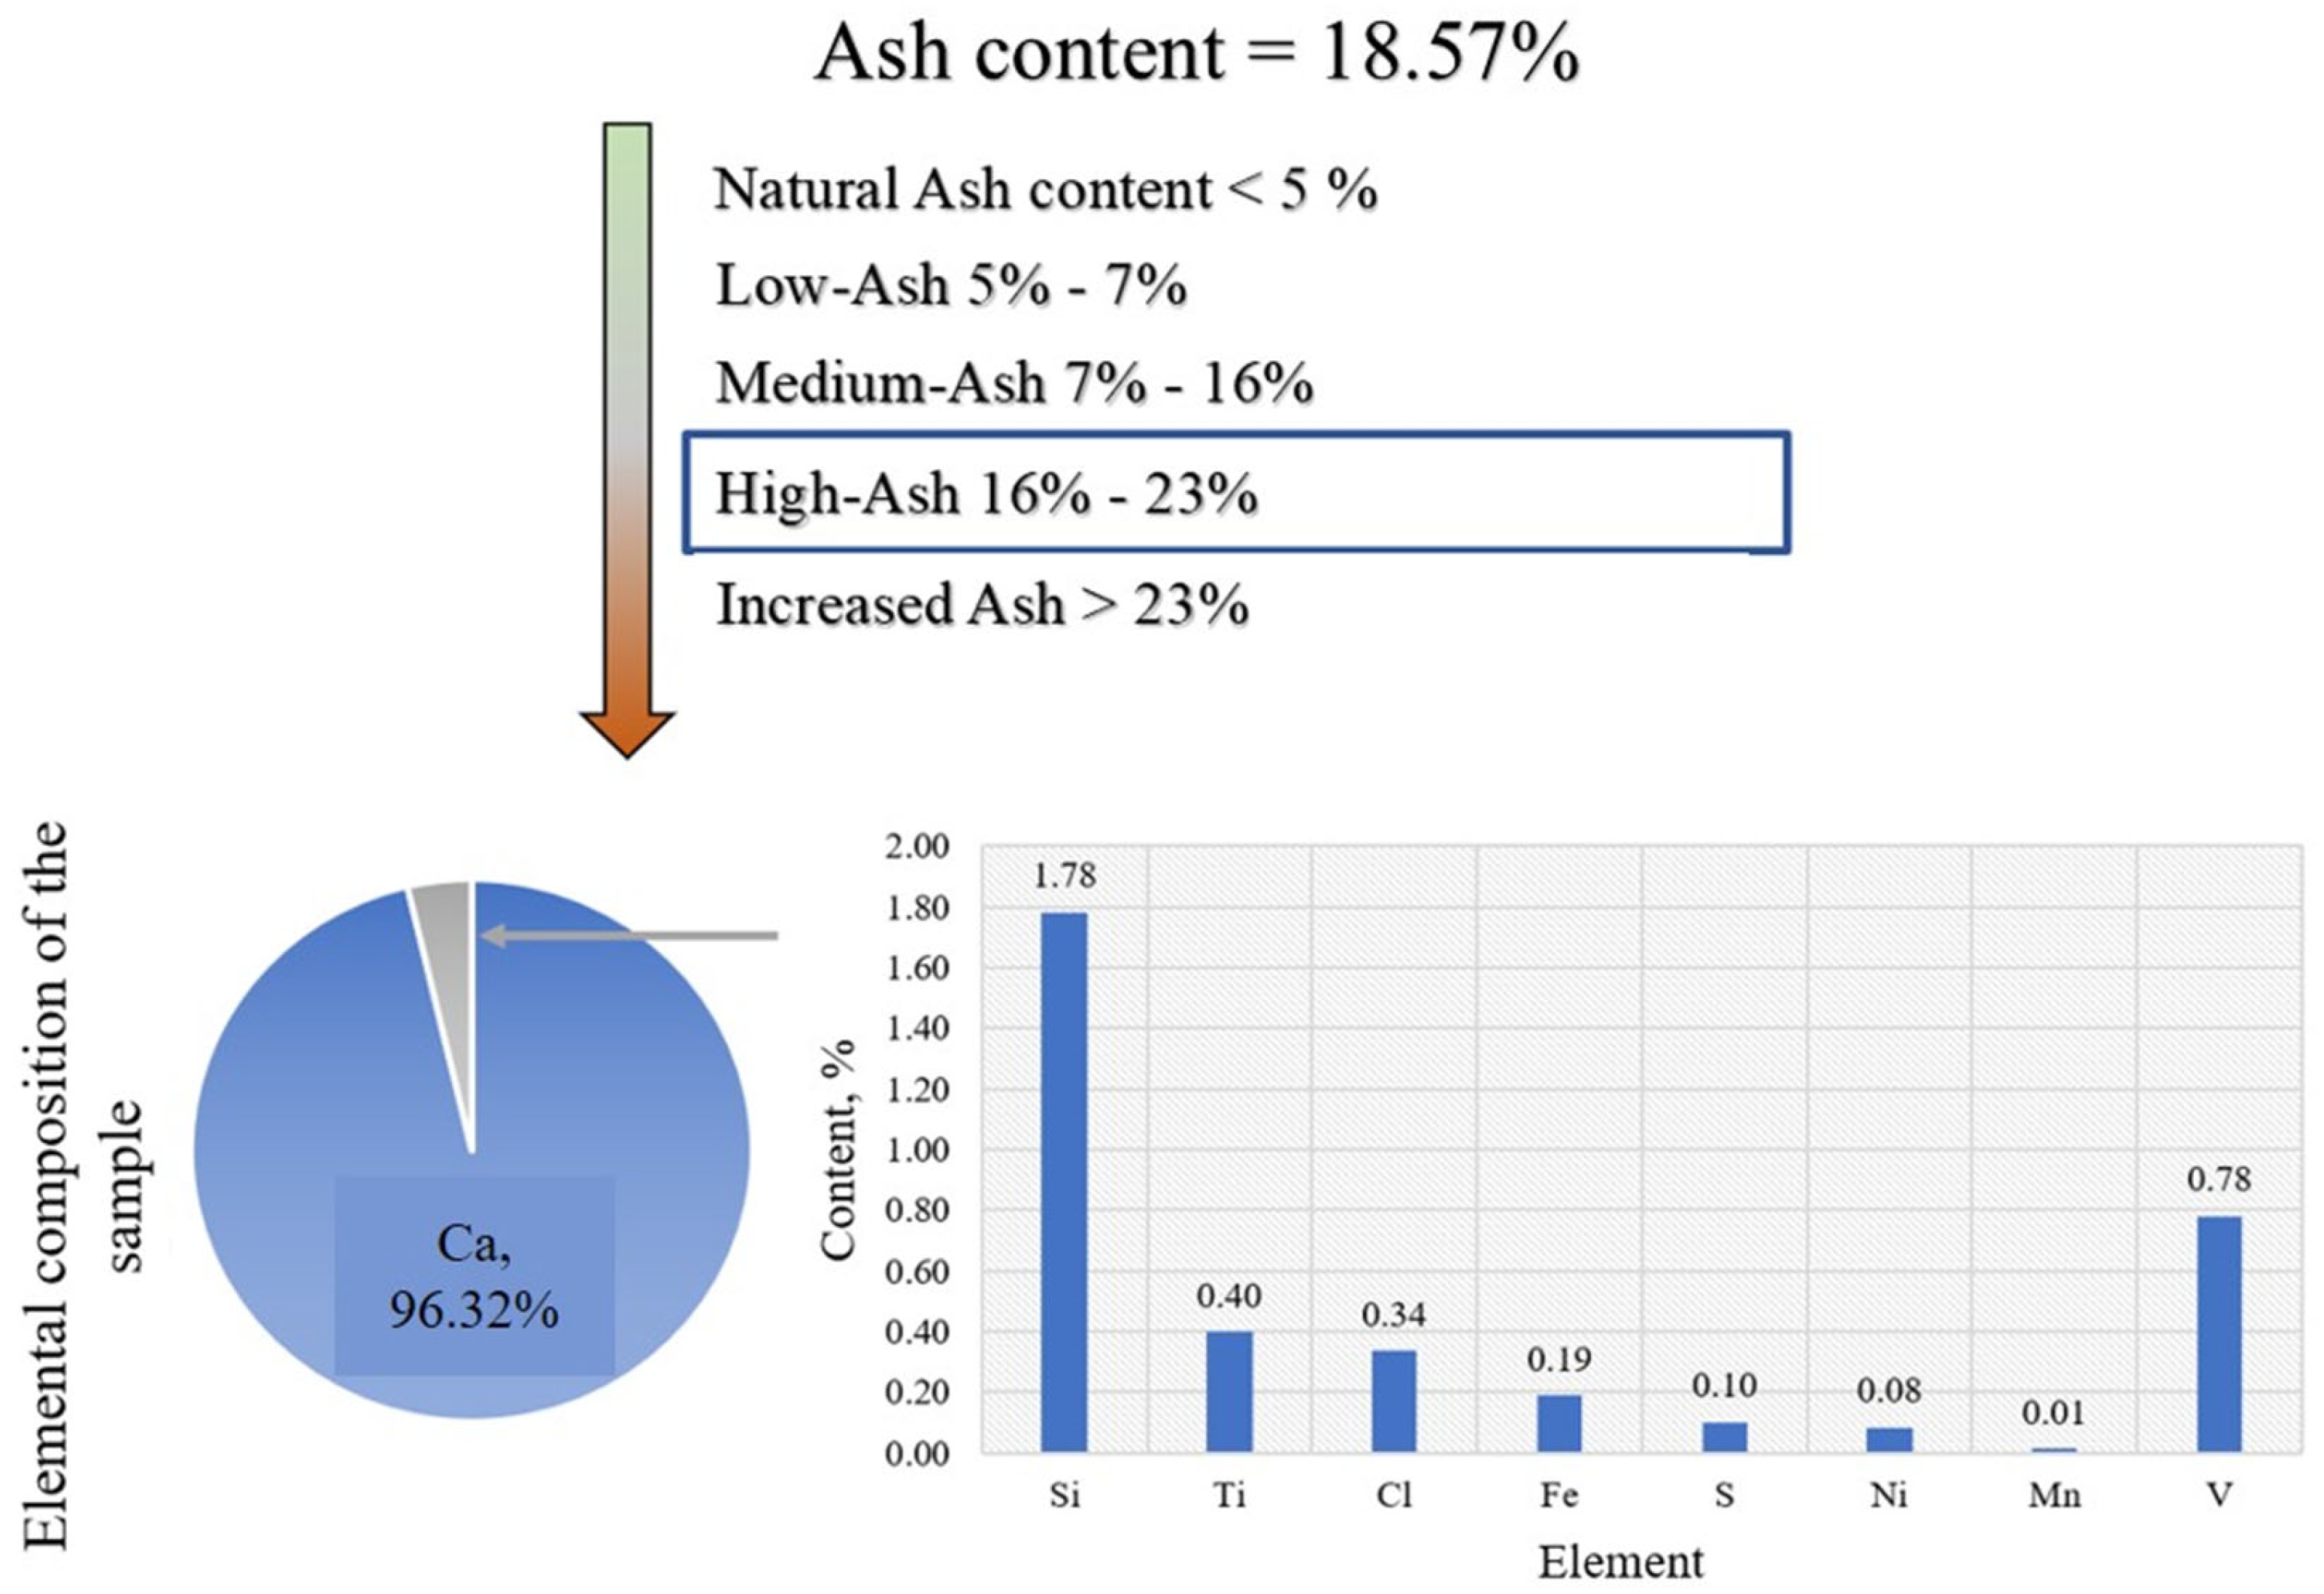
The results of elemental composition studies are presented in Figure 3. It was found that the investigated samples of waste paper belong to the category of high ash. A total of 96.31% of the inorganic part of the ash residue is represented by calcium, which is a constituent of reagents used for paper bleaching and alkaline pulping [31]. Chlorine is also associated with paper bleaching compounds. Silicon and sulfur are associated with the inorganic part of the filler, as calcium sulfates and silicates are used to increase the density of paper. Titanium and vanadium contents are due to additions of titanium oxide and vanadium oxide particles to increase the optical frequency of the paper and reduce transparency.

3.2. Results of Determination of Ef and J Criteria Under Variation of Collector Dosage and Sample Residence Time in the Pulper

Generalized results of the conducted series of studies of the process and products of flotation separation of ink from waste paper under different collector consumption (sodium oleate) and time of paper mass grinding in the pulper using methods of potentiometric study of interfacial characteristics are presented in Table 1.
Thus, according to the results of the analysis of the obtained results, the greatest selectivity of dye removal will be achieved at the residence time value of 10 min and the collector consumption 500 g/t.
The obtained results were processed using the method of analysis of variance (ANOVA) to determine the statistical significance of the differences in the mean values of the factor Ef under variation of the values of residence time in the pulper and collector consumption. The results of determining the criteria of dispersion analysis of the influence of factors on the analyzed criterion are presented in Table 2.
At the given value of degrees of freedom to refute the null hypothesis about the absence of statistically distinguishable difference between the mean values of the factor Ef under variation of the collector dosage and pulper operation time, the value of Fisher’s criterion should be for factor A > 3.239, for factor B > 4.494, and for the interaction of factors A and B > 3.239. Thus, the null hypothesis for all cases is refuted—the differences in the parameter Ef are statistically significant.
Summarized results of the conducted series of studies of the process and products of flotation separation of ink from recovered paper under different collector consumption (sodium oleate) and time of pulverization of recovered paper mass in the pulper using spectrophotometric methods of extracts of cleaned recovered paper are presented in Table 3.
The value of J criteria characterizes the degree of purity of the recovered waste paper mass. The maximum value of the criterion J is reached at the maximum investigated value of sodium oleate consumption, which is probably associated with the extraction of recovered waste paper in the form of micellar structures with molecules of the collector due to its high concentration. As a consequence, the value of the criterion Ef begins to decrease, indicating a change in the direction of movement of particles of waste paper fibers in the field.
The results of determining the criteria of variance analysis of the influence of factors on the analyzed criterion are presented in Table 4.
At the given value of degrees of freedom to refute the null hypothesis about the absence of statistically distinguishable difference between the mean values of the criterion J at variation of the collector consumption and the pulper operation time, the value of Fisher’s criterion should be for factor A > 3.239, for factor B > 4.494, and for the interaction of factors A and B > 3.239. Thus, the null hypothesis for all cases is refused—the differences in parameter J are statistically significant.
On the basis of the results of dispersion analysis, it is established that the proposed criteria characterizing the process of waste paper cleaning react to the variation of the values of the collector dosage and residence time in the pulper, which confirms the possibility of building a predictive model of the values of these criteria to find an effective cleaning mode.
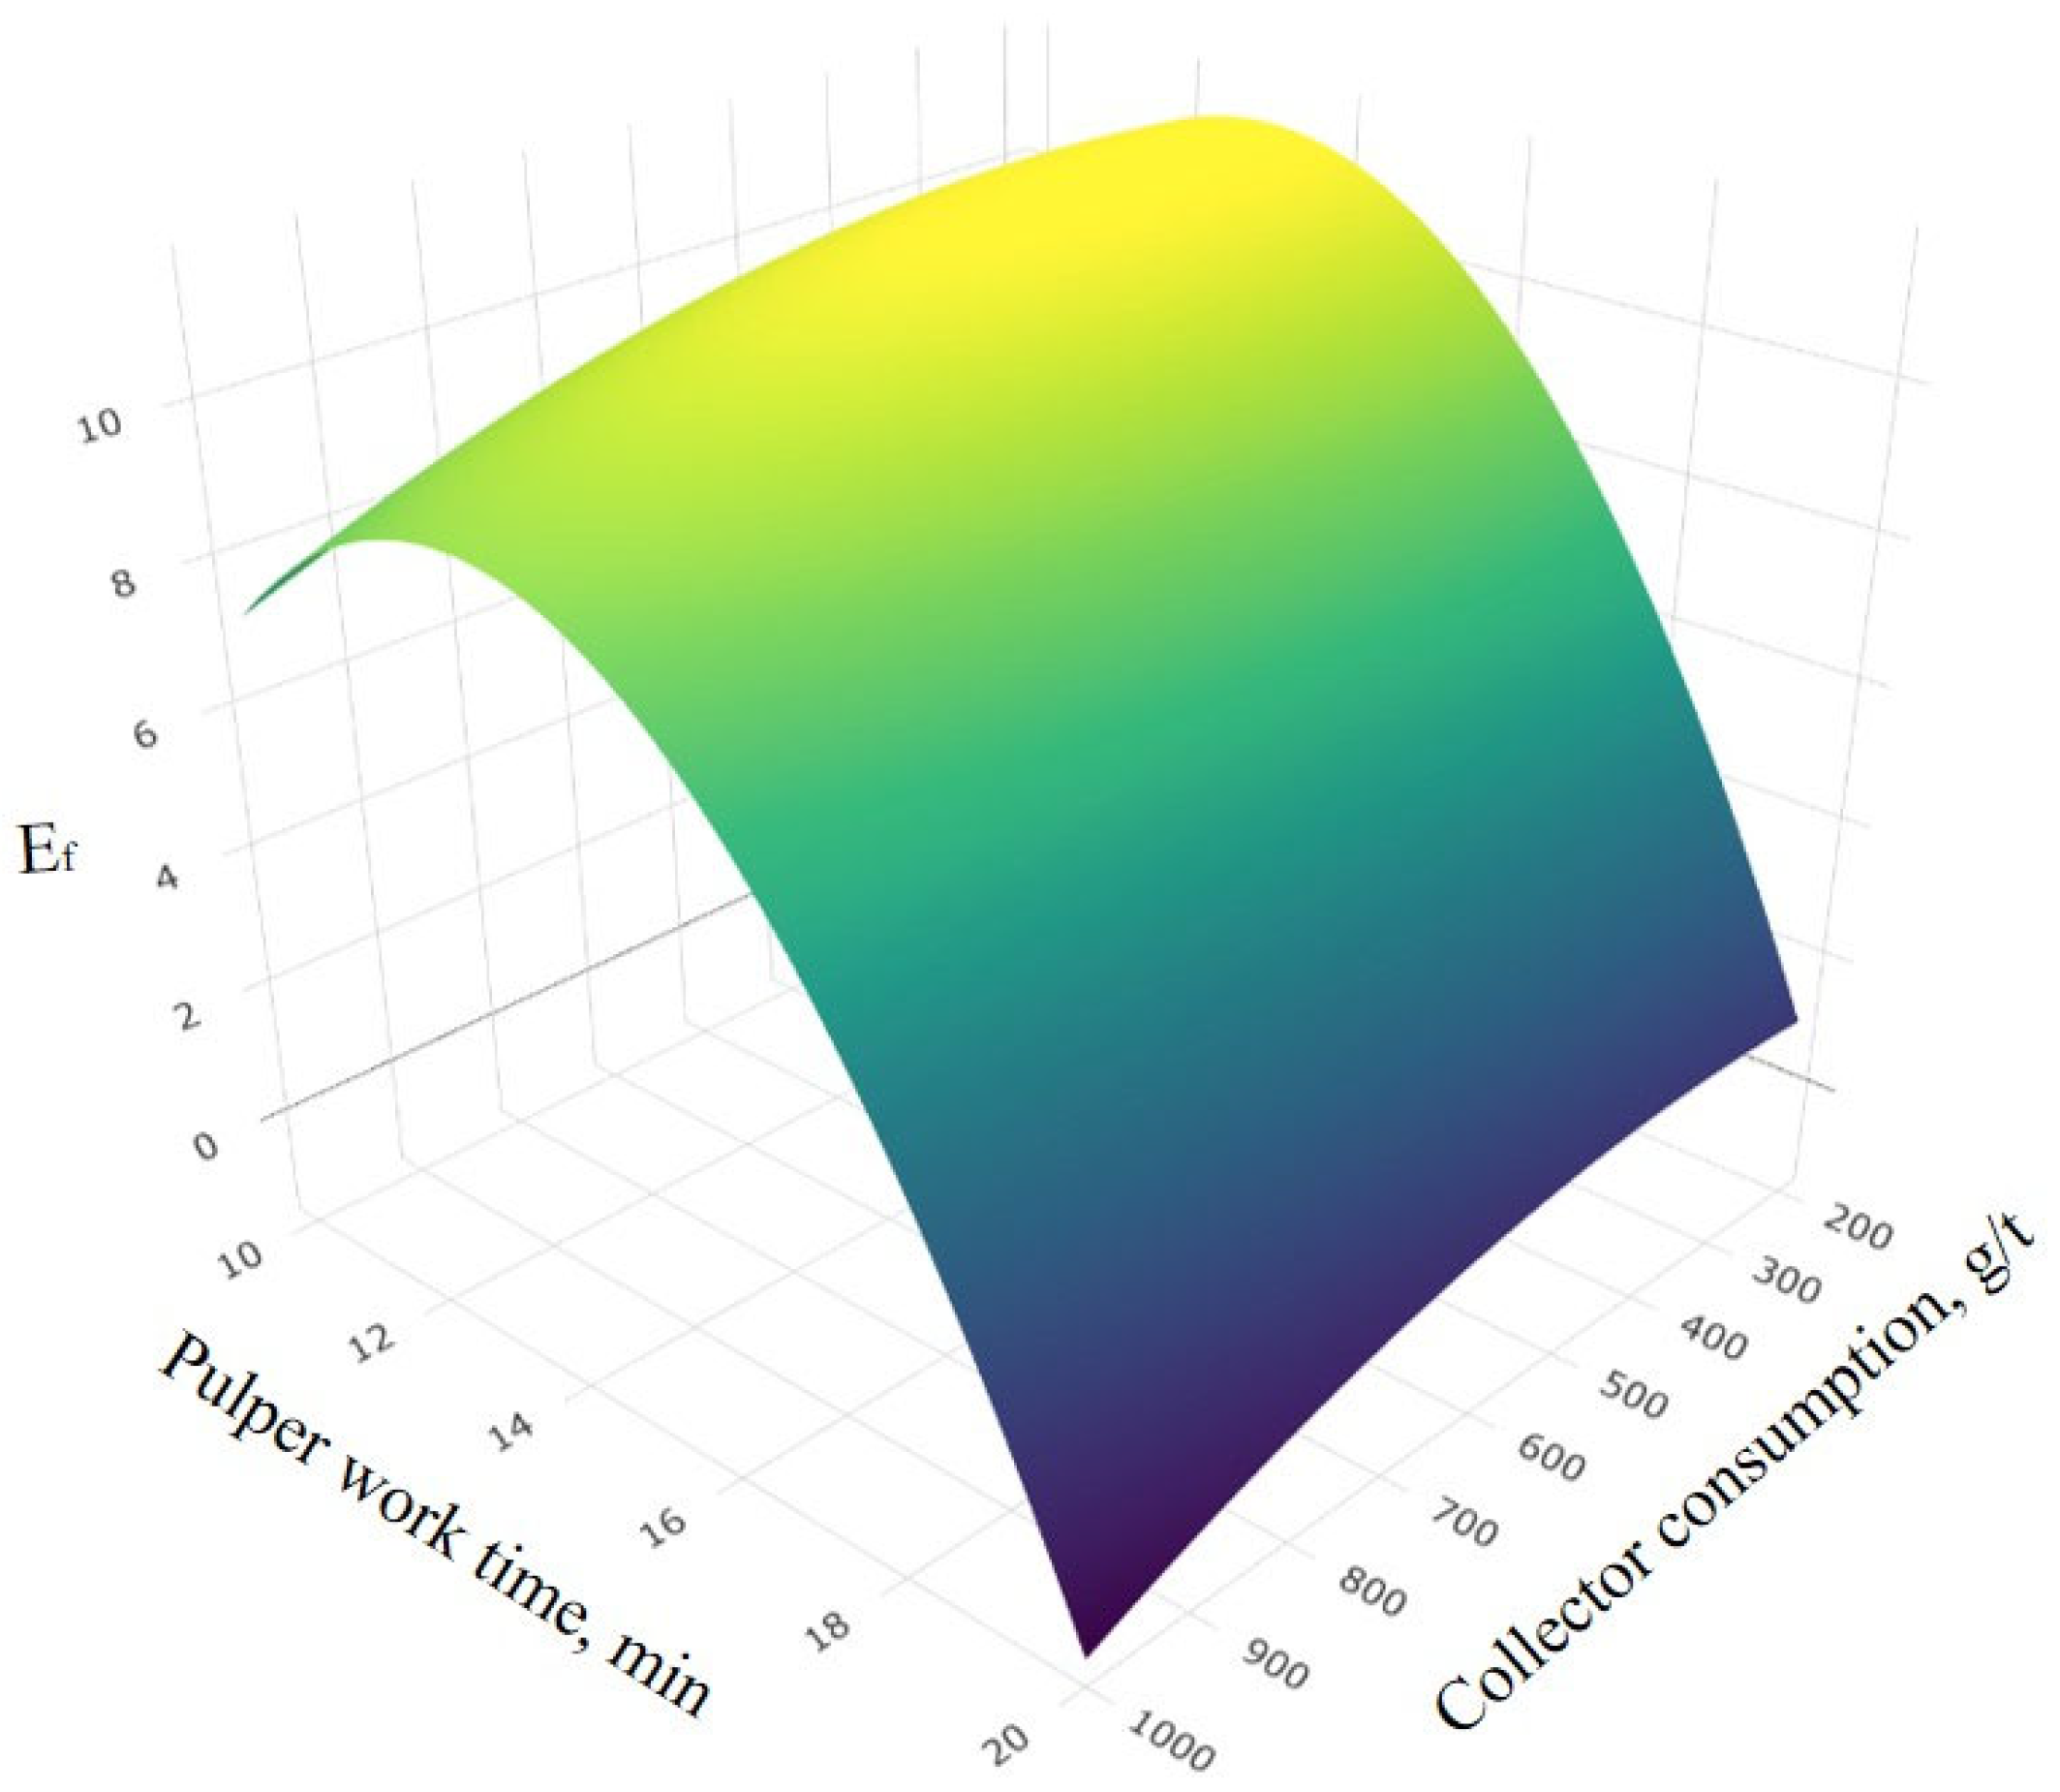
It was established that the dependence of the interfacial characteristic factor Ef on the flotation parameters has an extreme character. The absolute value of Ef criteria depends on the rate of the uniformly charged particles’ movement in the process, so the higher the motion rate, the higher flotation separation probability of the particles that charged differently. This correlation allows us to conclude that the parameter Ef can be used to assess the flotation separability for de-inking and selection of reagent mode.
The obtained dependence of the Ef factor on the flotation parameters (collector consumption—R and pulverization time in the pulper—t) can be expressed in the form of a plane equation:
E f   =   0.197   +   0.031 R     0.742 t     0.031 t 2     0.000034 R 2     0.00004 R t
Figure 4 shows the graphical interpretation of the dependence of the Ef factor on the flotation parameters.
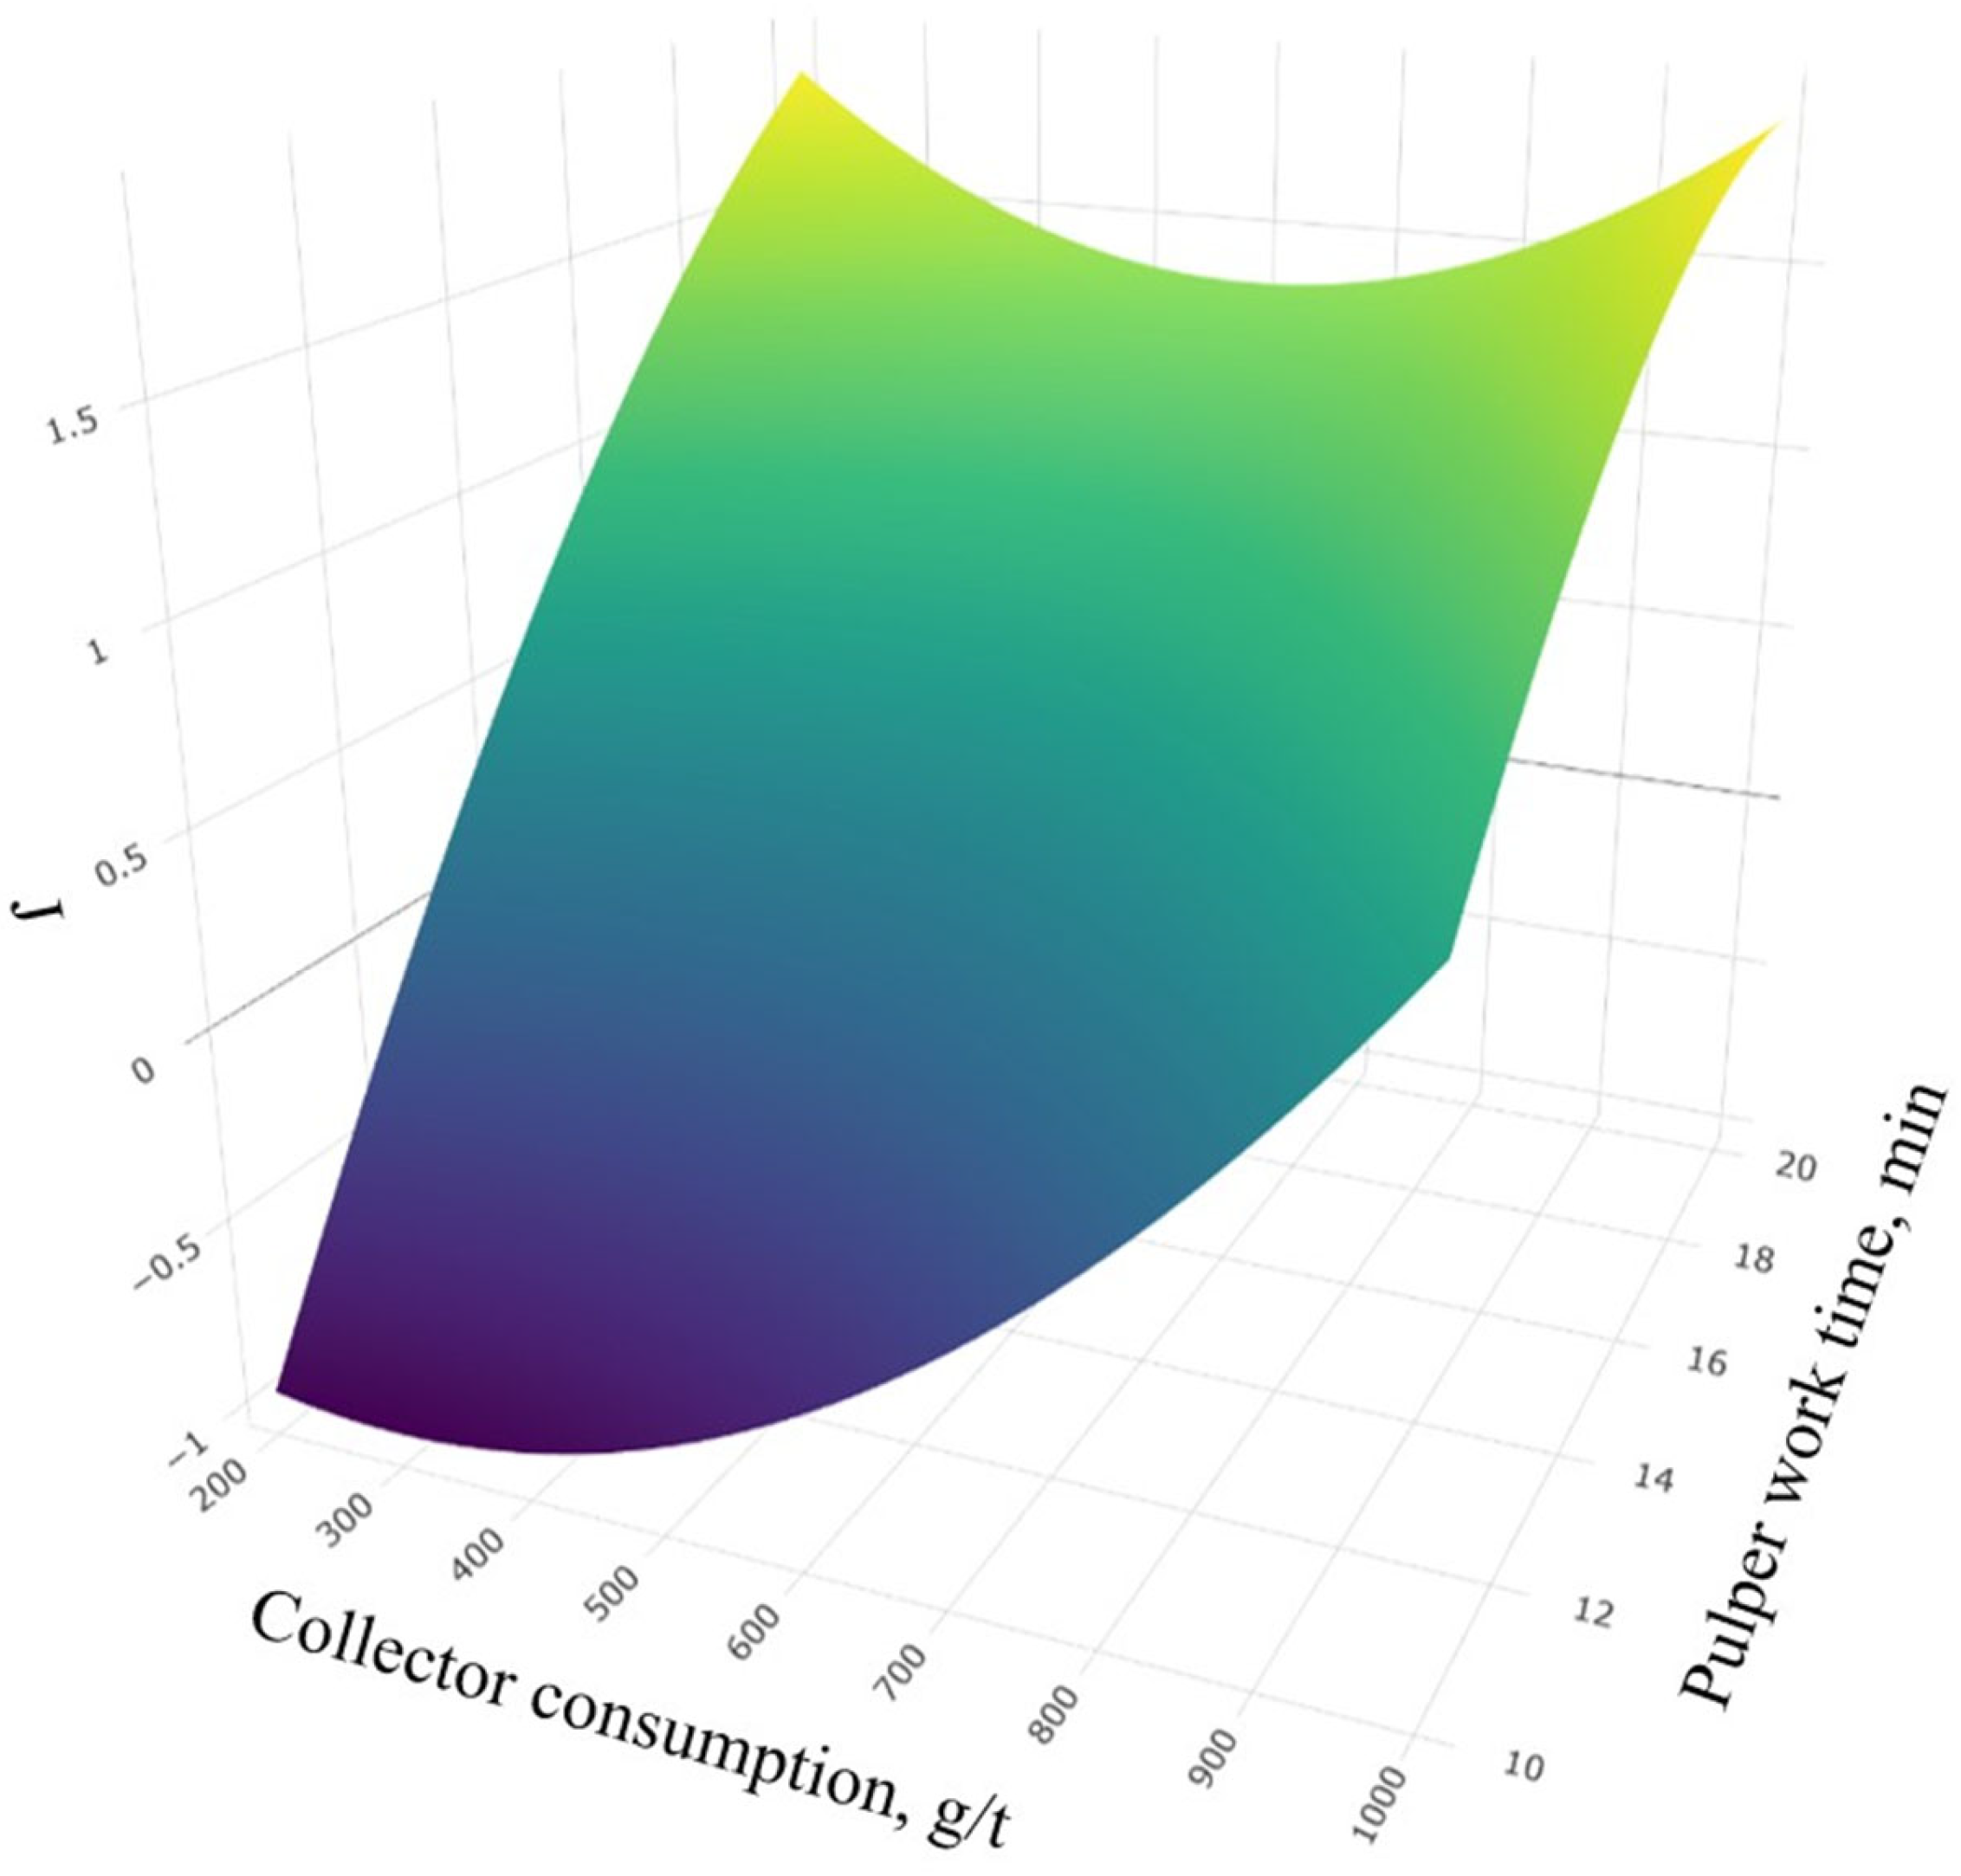
Based on the obtained results, it was established that the dependence of the J criterion of waste paper cleaning product on flotation parameters reaches its peak at the maximum studied values of the collector consumption and time of stay of waste paper mass in the pulper. This correlation allows us to conclude that the parameter J can be used to assess the purity of recovered paper.
The obtained dependence of the factor J on the flotation purification parameters (collector consumption—R and pulverization time in the pulper—t) can be expressed in the form of a plane equation:
J   =   0.174   +   0.0078 R     0.4366 t     0.0213 t 2     0.000002 R 2     0.0002 R t
Figure 5 shows the graphical interpretation of the dependence of factor J on flotation parameters.

3.3. Results of Research of Flotation Purification Products of Waste Paper Pulp at Residence Time in the Pulper for Which the Maximum Values of the Criterion Are Achieved Ef

The electrophoretic studies established the value of electrokinetic potential for waste paper pulp after 10 min in the pulper:
ζ   =   1.003     10 3 N   ×   s m 2   ×   0.0000037896   m / s 80     8.85   ×   10 12 F m   ×   109.7   V / ( 0.1   m )   =   0.00489   V
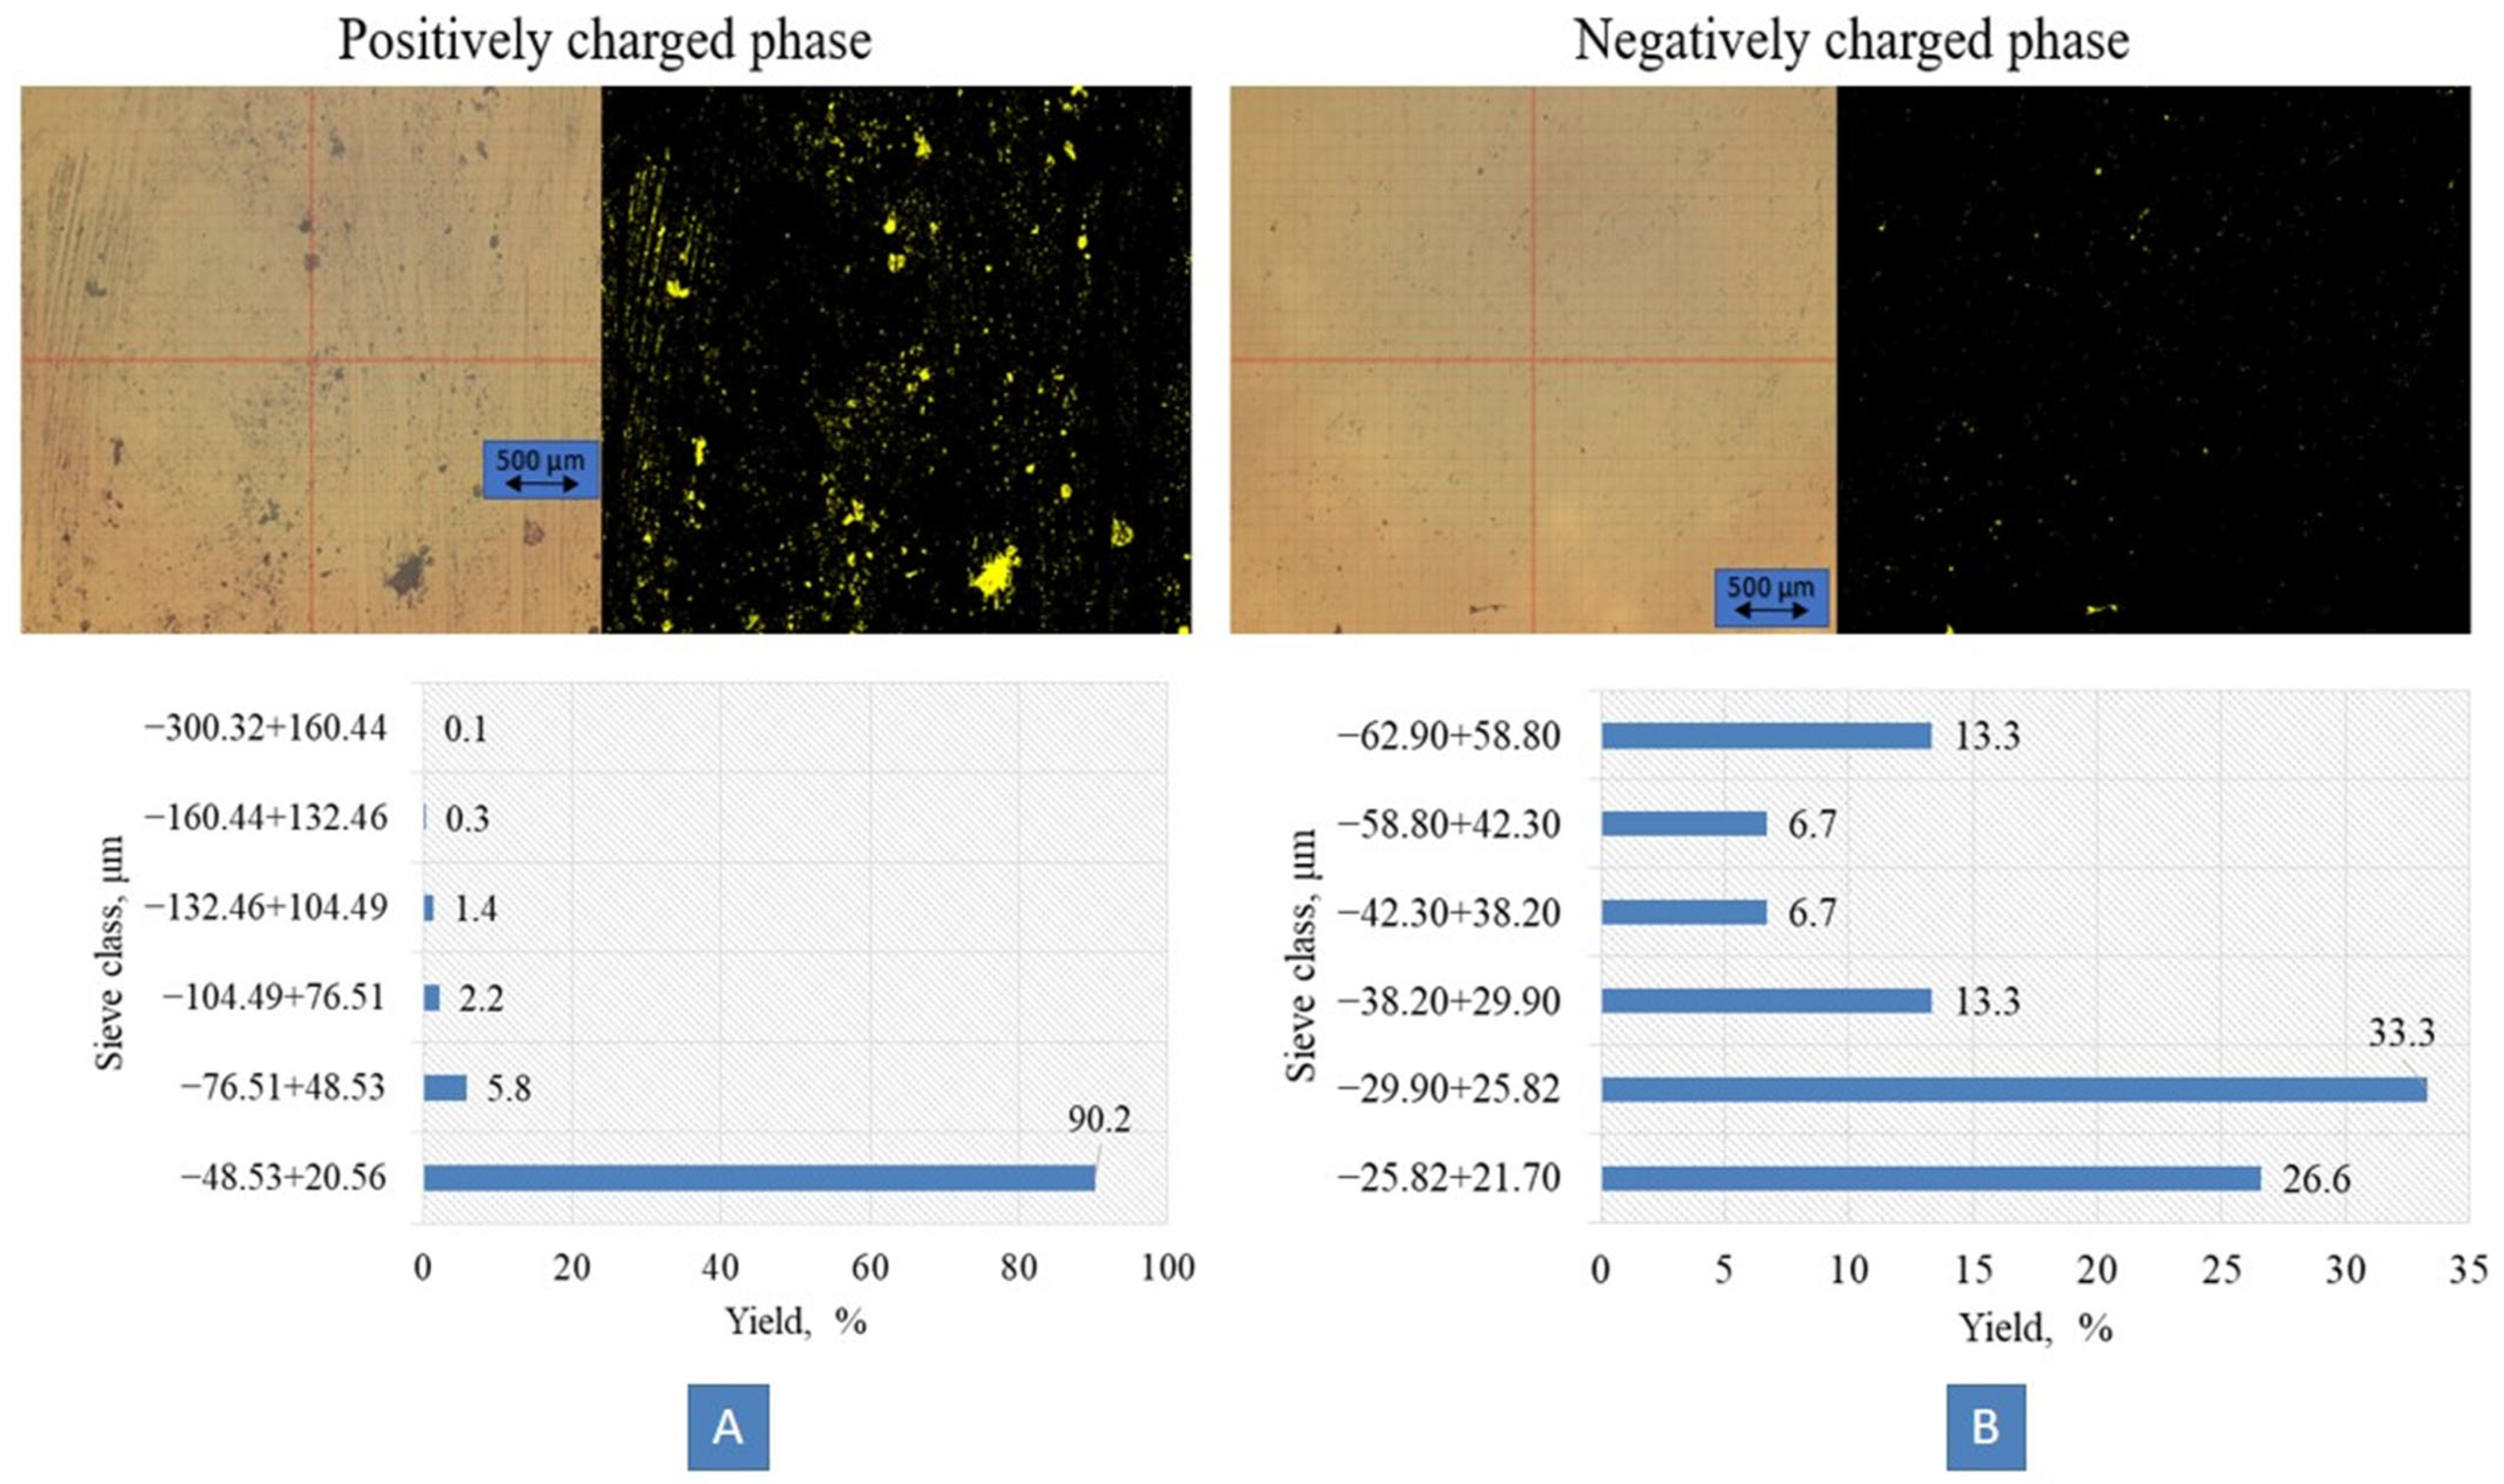
The electrophoretic studies sampled the pole-shifted phases. A positive displacement of the lateral liquid–solid interface was found for the negatively charged pole, indicating the predominance of particles with a positive electrokinetic potential value. Samples of the displaced electrode phases were collected to analyze the morphology of the paint particles using contrast optical–microscopic techniques. The results of the charged phase studies are presented in Figure 6.
According to the results, it was found that the positively charged phase is dominated by contrast paint particles, occupying on average 3.6% of the photographed field. About 90% fall on paint particles of size class −48.53 microns + 20.56 microns (Figure 6A). In the negatively charged phase, there are contrast paint particles, occupying on average 0.025% of the photographed field. About 73% are paint particles of size class −38.2 μm + 21.7 μm (Figure 6B). Thus, it is established that the main contribution to the positive electrokinetic potential of the waste paper mass is made by paint particles, the basic size of which is 34.55 microns on average.
Graphical interpretation of the combined results of optical–microscopic and laser diffraction studies of the froth products of flotation at the residence time in the pulper of 10 min is presented in Figure 7.
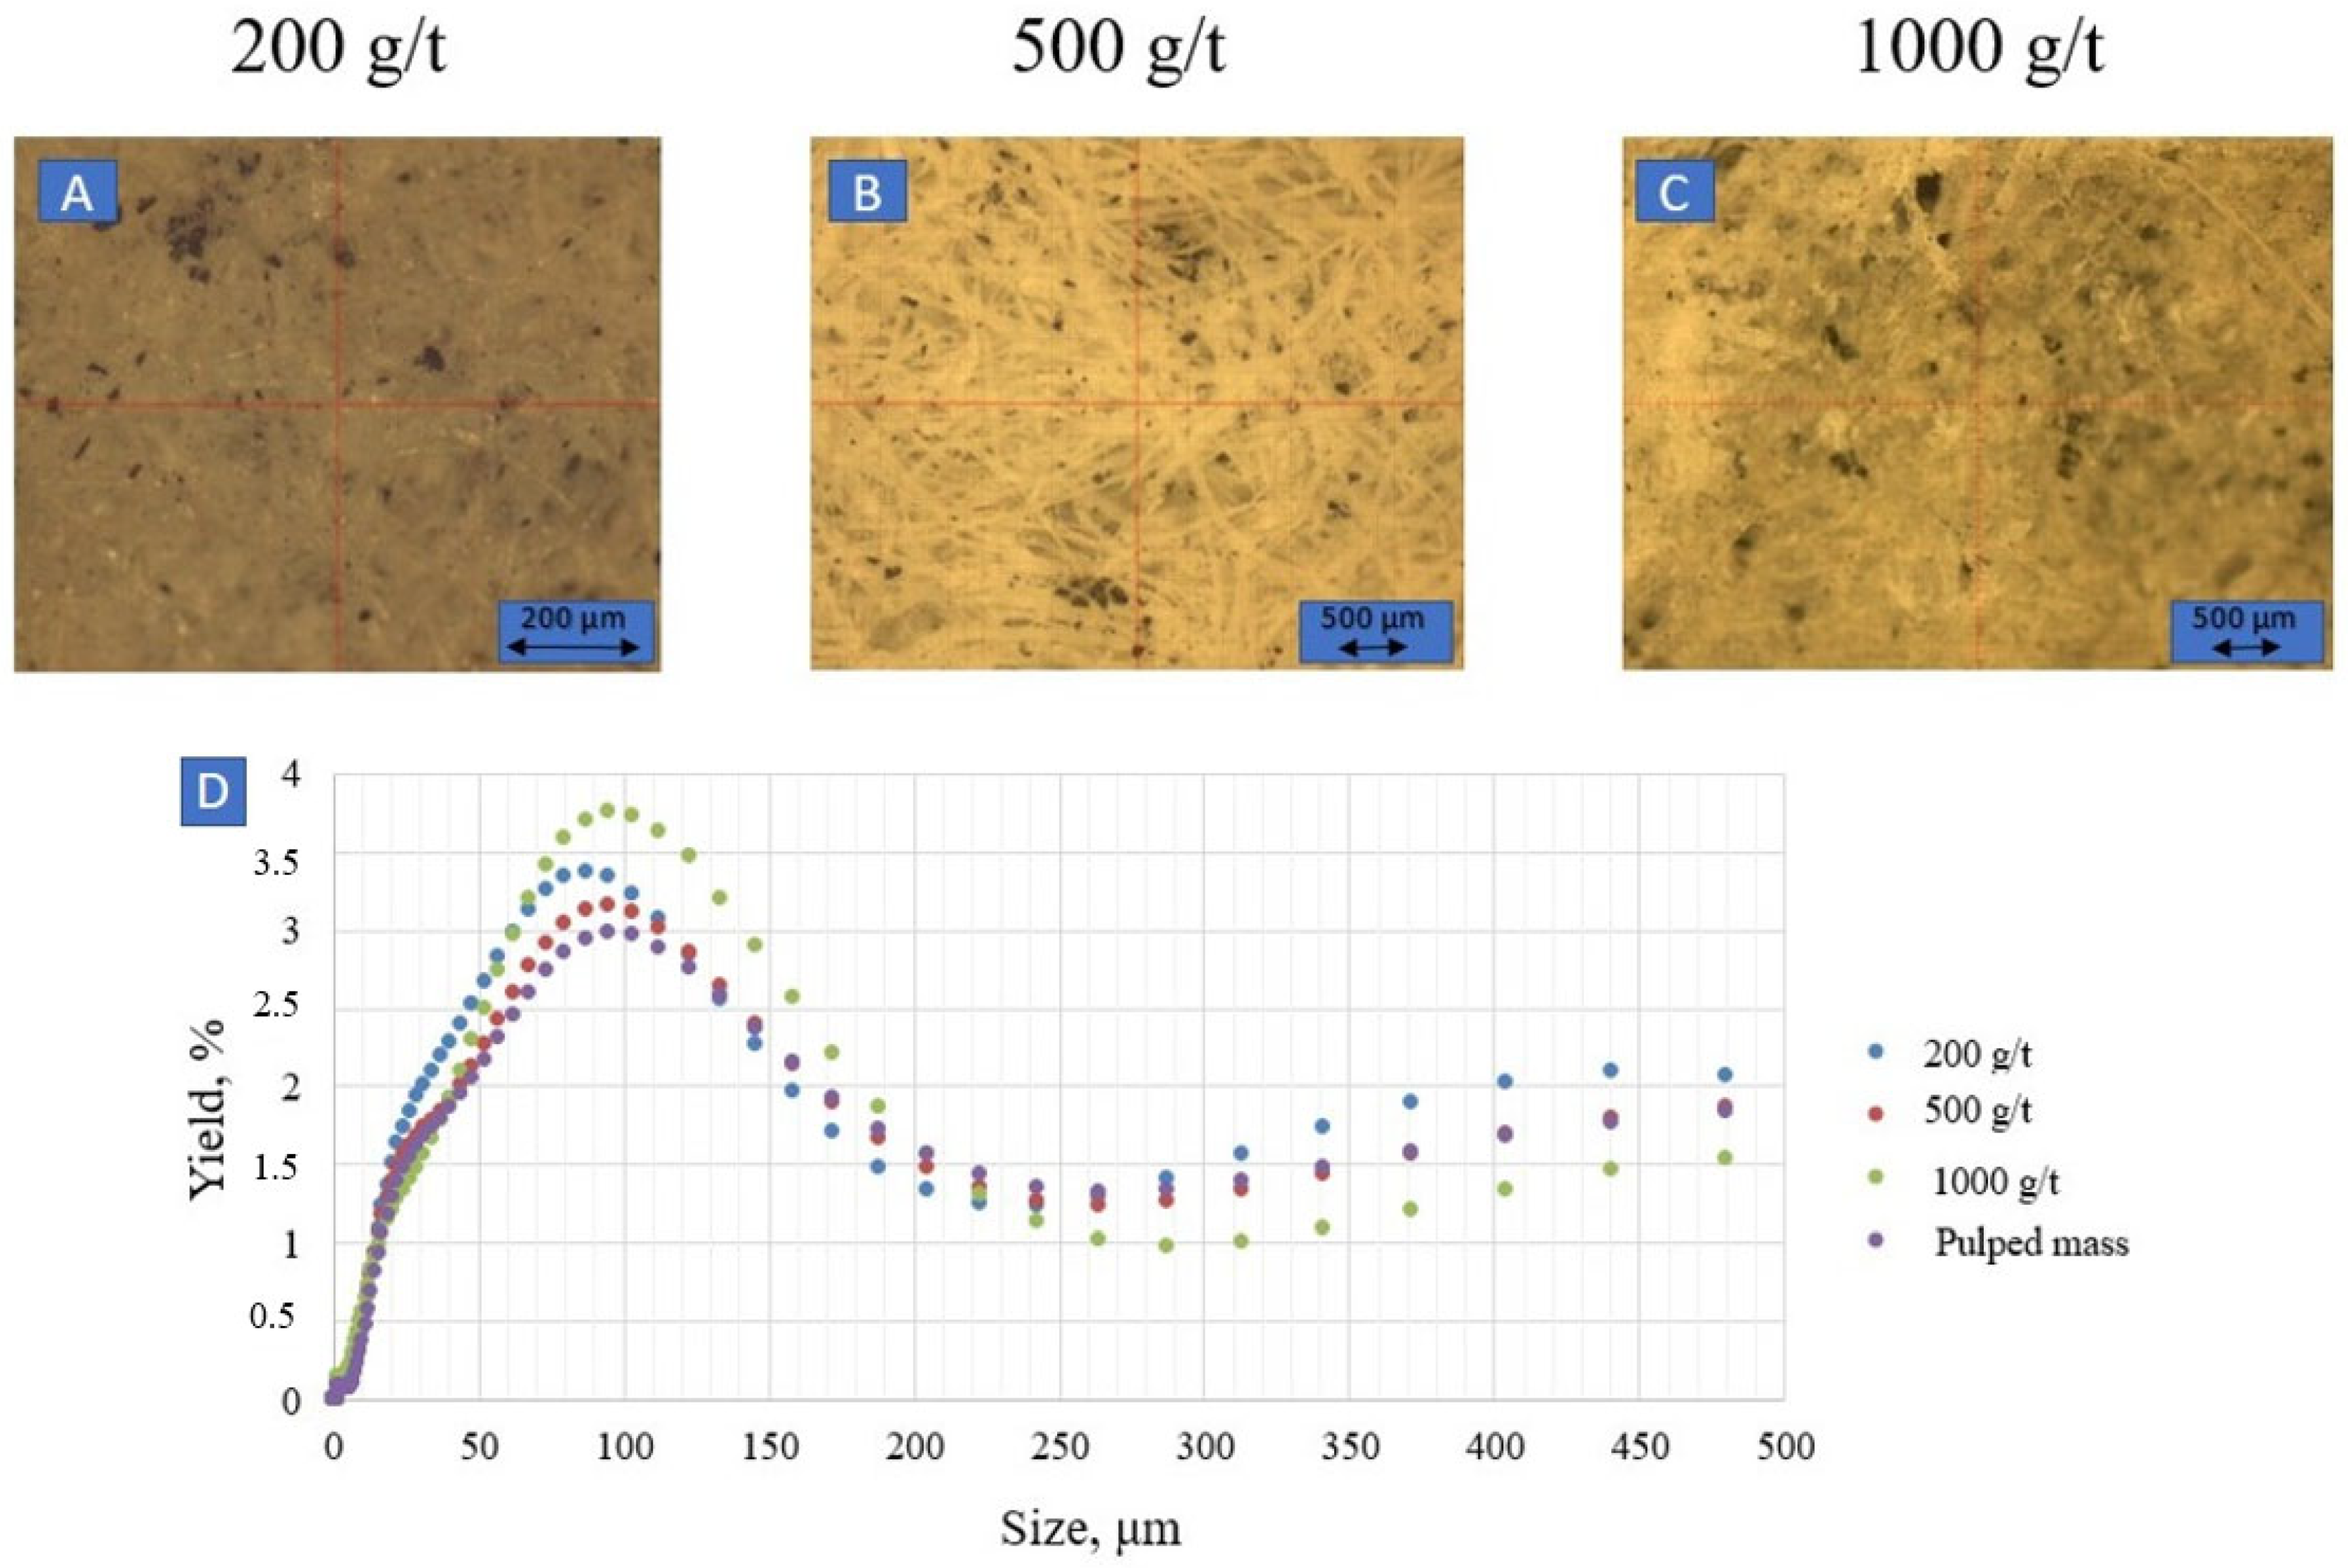
According to the results, it was found that as the collector dosage increased, increasingly larger paint particles began to be transported to the froth product (Figure 7D). At a collector consumption of 200 g/t, the average equivalent particle diameter was 36.59 μm (Figure 7A,D), and in the case of 500 g/t, the average equivalent particle diameter was 41.59 μm (Figure 7B,D). This is probably due to the increased hydrophobizing action of the collector on the surface of the paint particles and their more efficient extraction into the froth product.
Two peaks in particle size distributions of waste paper particles are vividly expressed in the figure. Peaks in the range from 80 μm to 110 μm are characteristic of paint particles, which is confirmed by previous optical–microscopic studies. Peaks in the coarseness range from 430 μm to 500 μm are characteristic of waste paper folding wood fibers. The figure shows that as the collector dosage increases from 200 g/t to 500 g/t, the distribution peak drops, indicating that a wider particle size class is recovered into the froth product. When the dosage is increased from 500 g/t to 1000 g/t, the characteristic peak in the range of 80 to 110 μm increases significantly, indicating a higher recovery of recovered waste paper particles (Figure 7C,D).
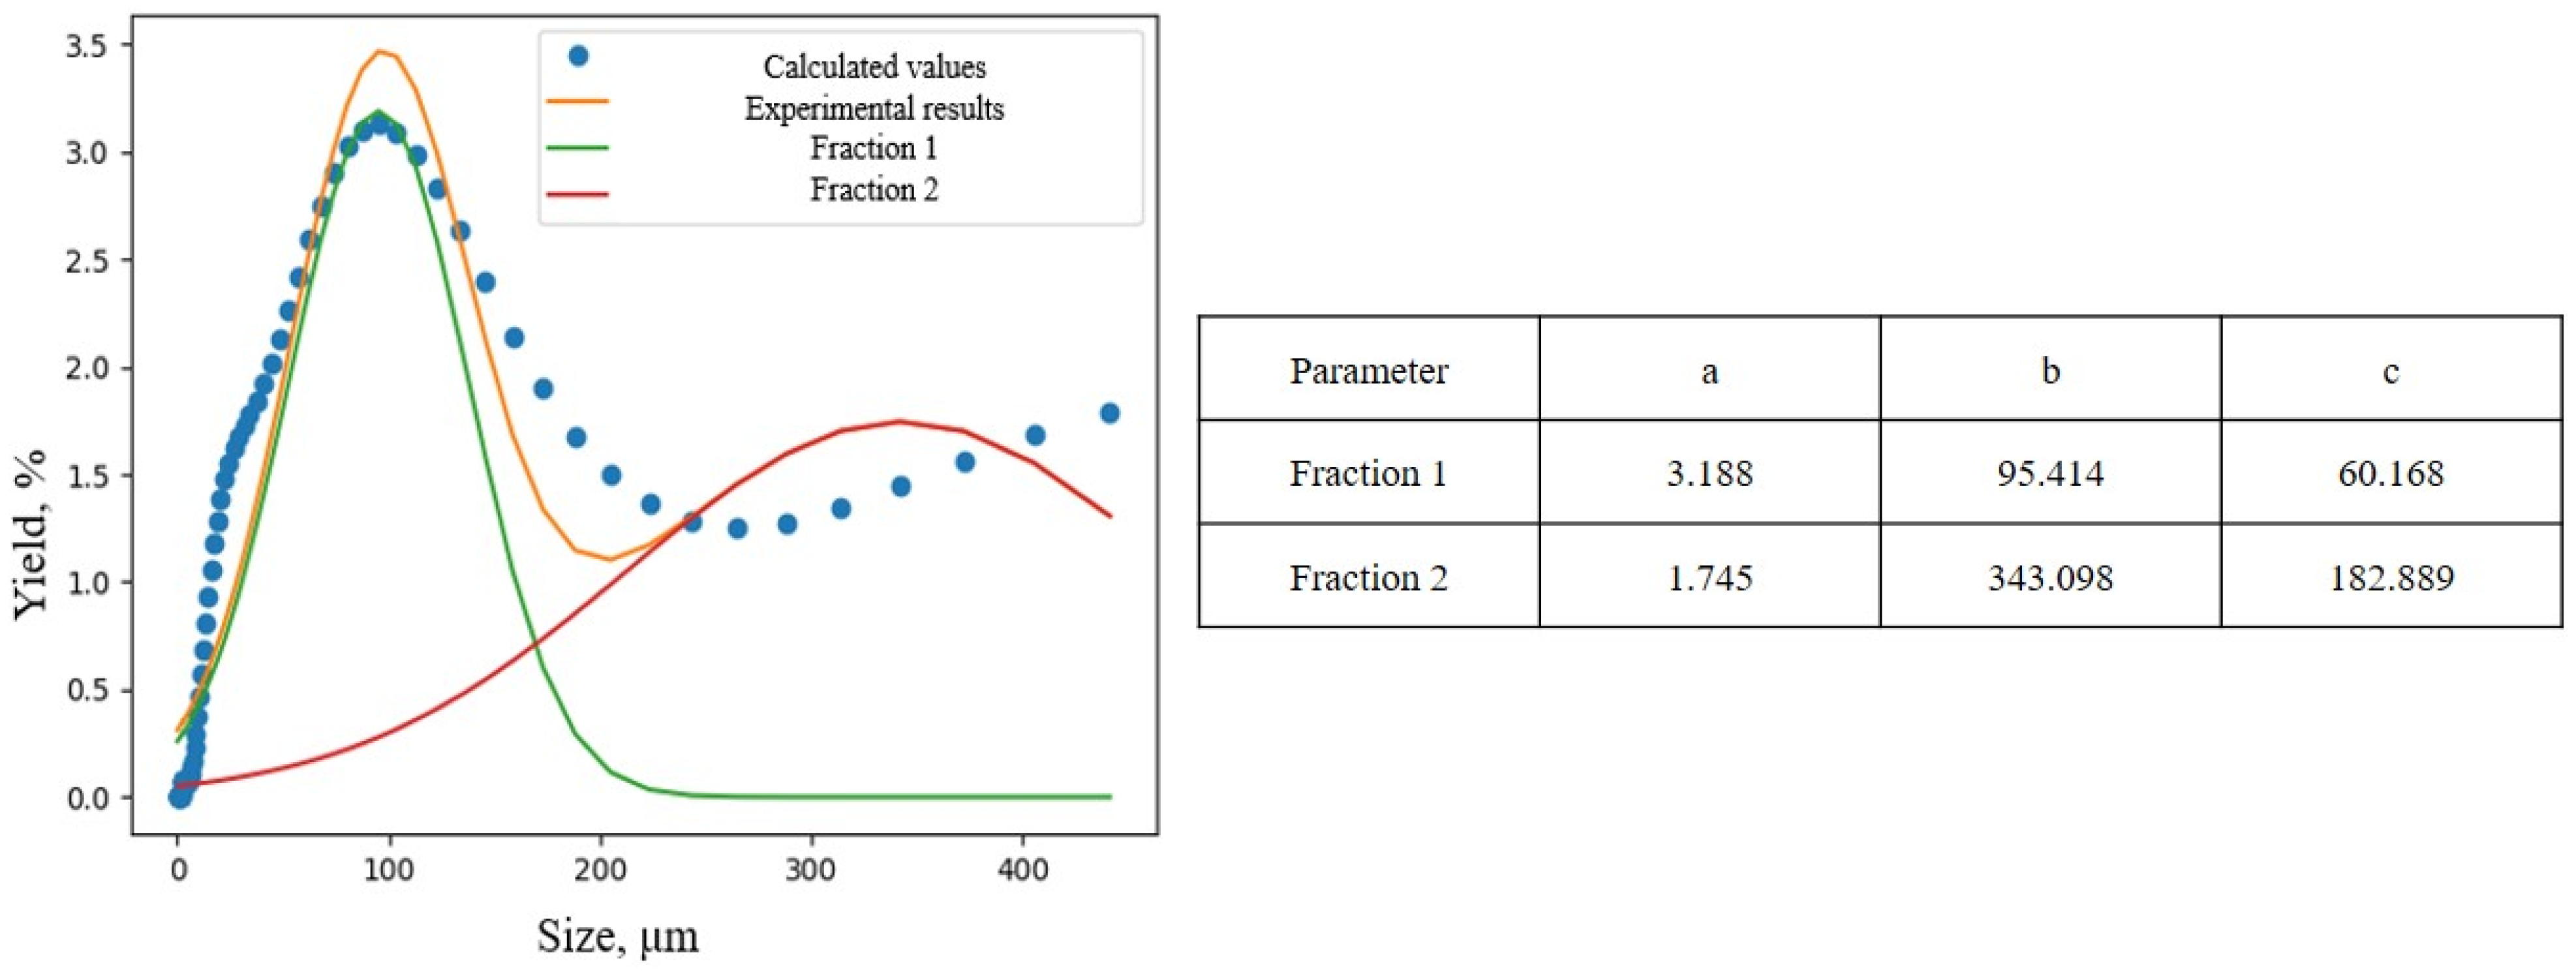
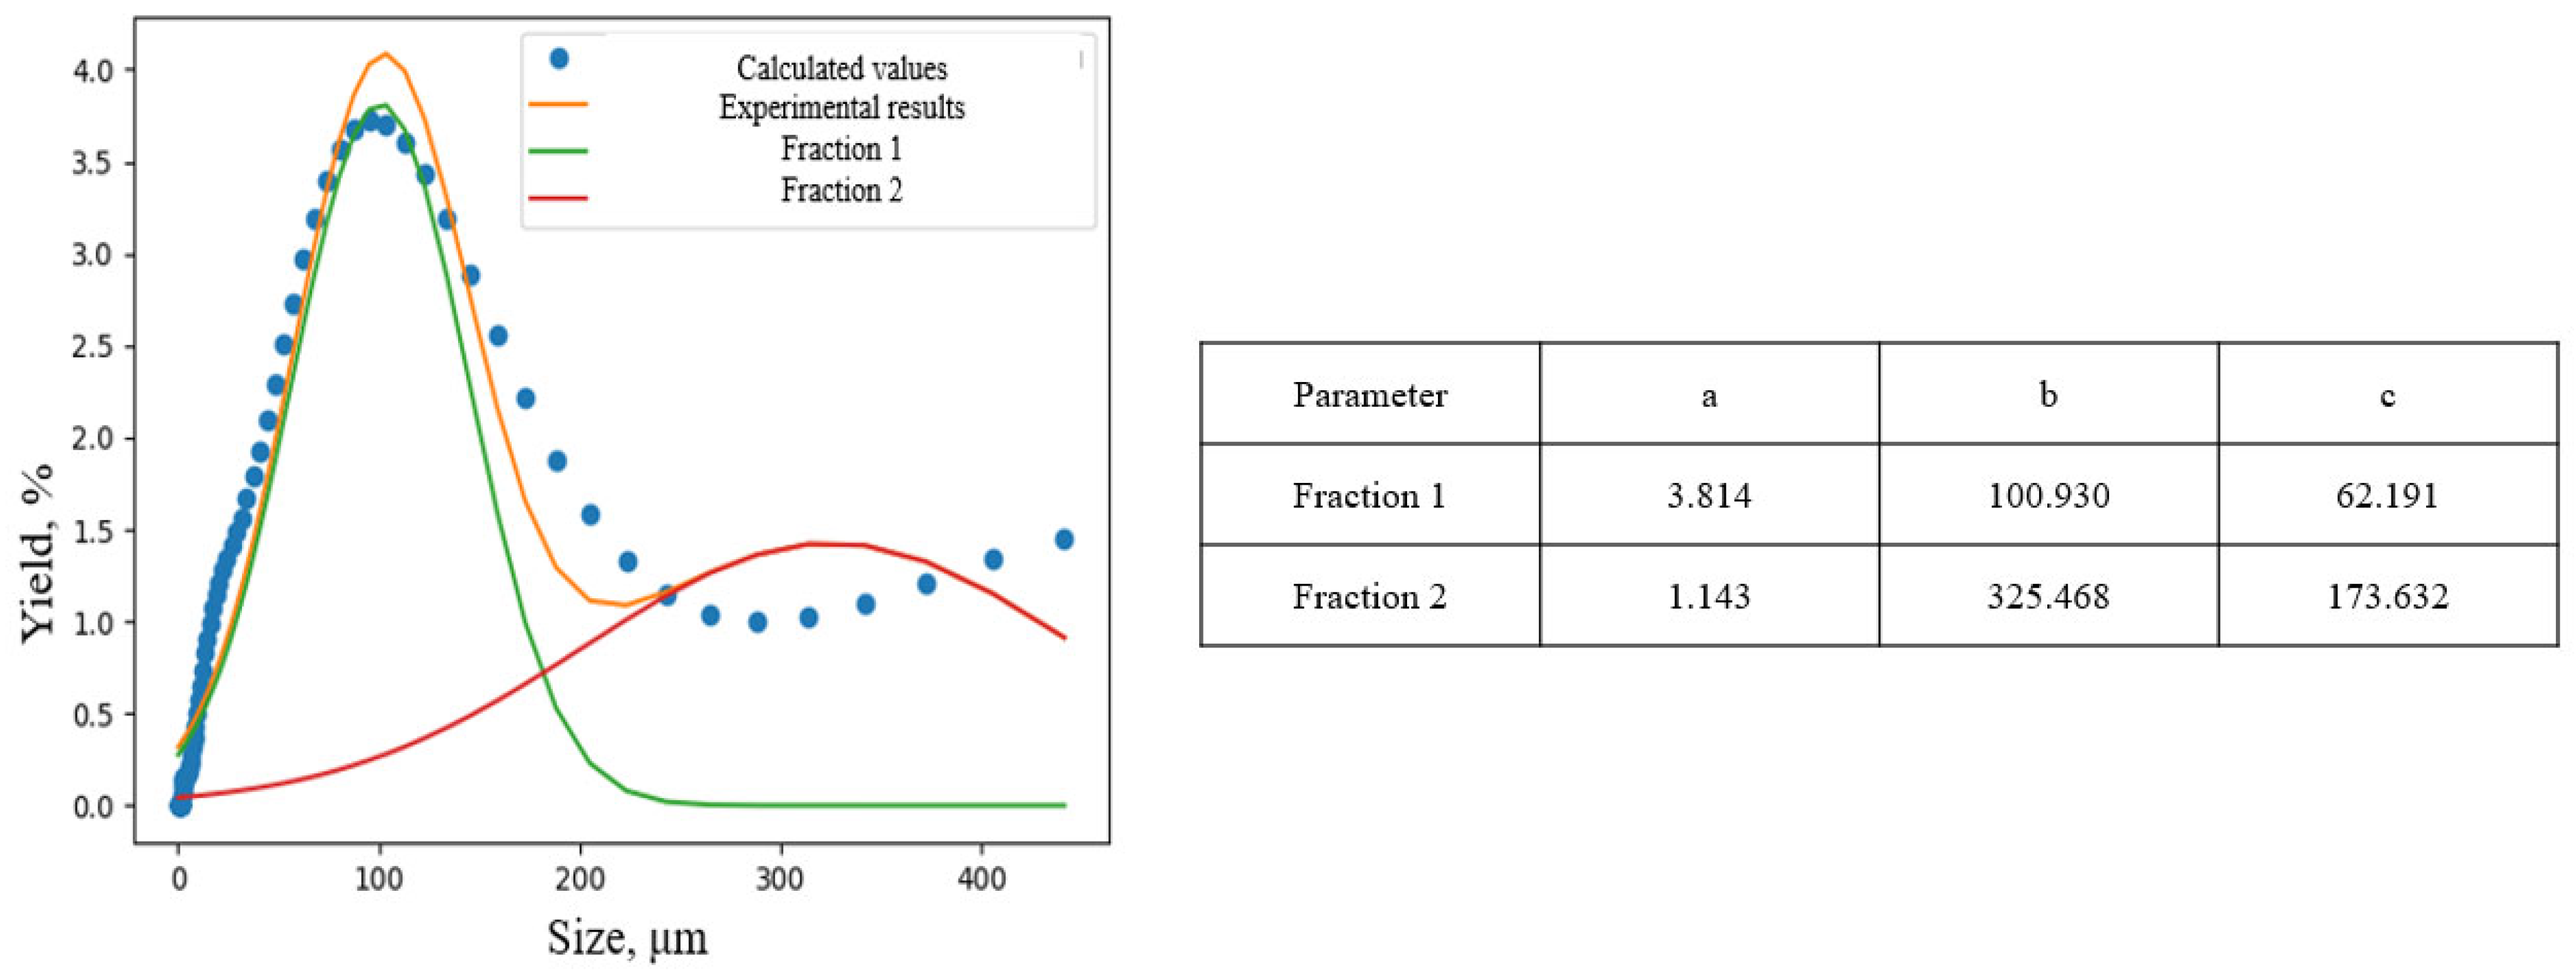
In order to quantify the obtained distributions and to identify characteristic fractions for paint and waste paper in the distribution, an interpretation was made using a set of several Gaussian distributions. The essence of this approach is to search for individual peaks of the value of partial outputs of particle size values, and it is interpreted as the sum of several Gaussian distributions:
γ   =   i   =   1 n a n e d     b n 2 2 c n 2
where γ —size fraction yield, %; d—size, μm; a n , b n , c n —Gaussian distribution parameters.
The parameter b in the Gaussian curve assignment is responsible for the peak abscissa. The search for the parameters of Gaussian curves and their number was performed using the least squares method. The sum of squares of differences between the experimental and calculated values served as a criterion of accuracy of the proposed interpolation dependence.
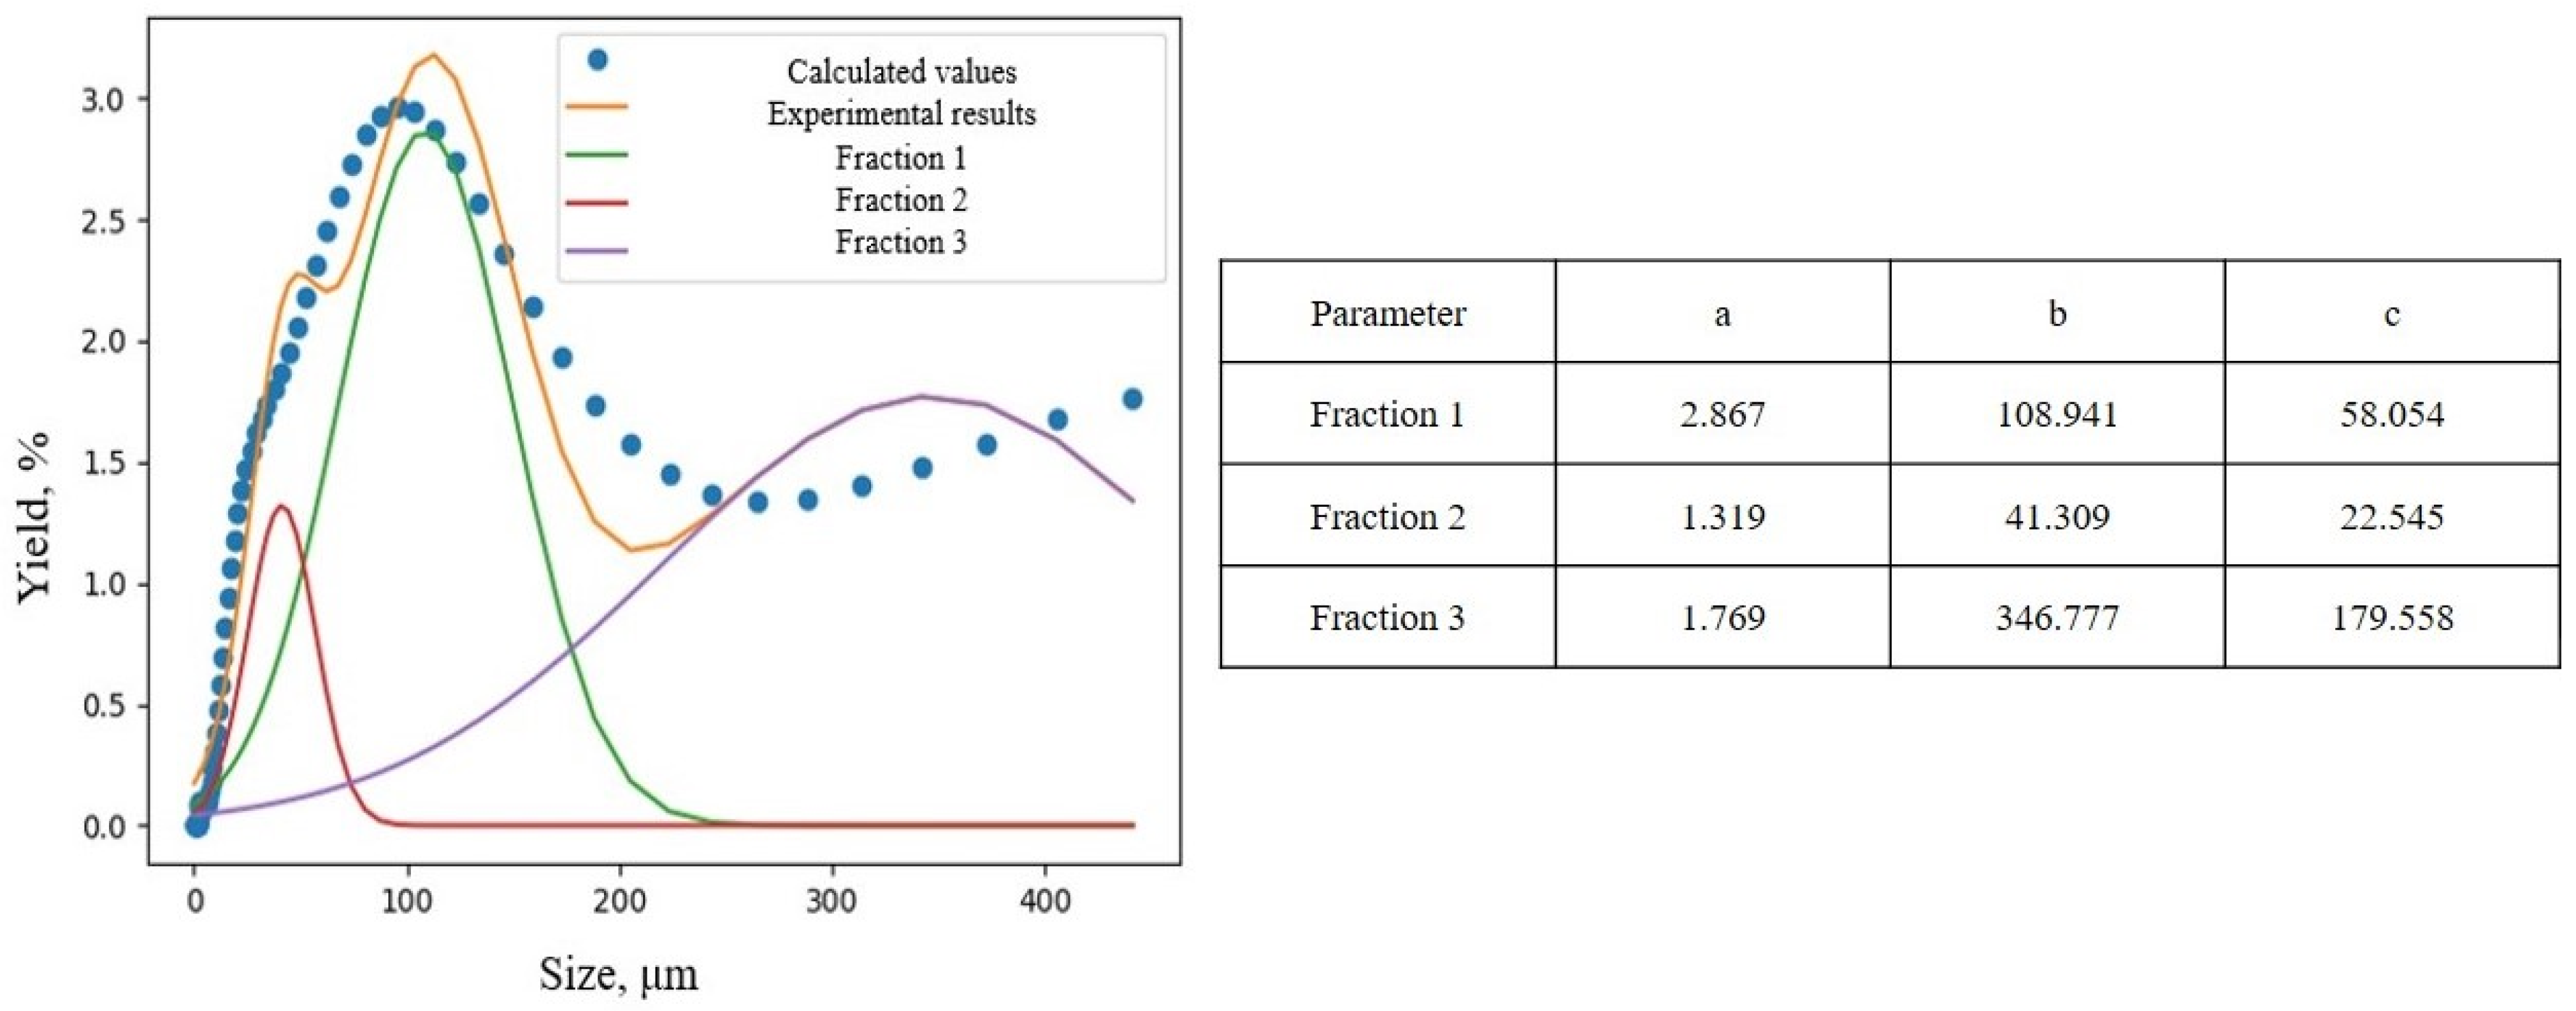
The results of interpretation of the product size distribution after pulverization in the pulper are presented in Figure 8.
For the product after pulverization, it was found that the total distribution of the product after pulverization in the pulper can be divided into three narrow classes with peak abscissa values of 41.309 μm, 108.941 μm and 346.777 μm. The first two peaks refer to the size of paint flecks, while the peak with the largest abscissa value refers to the size of waste paper fibers.
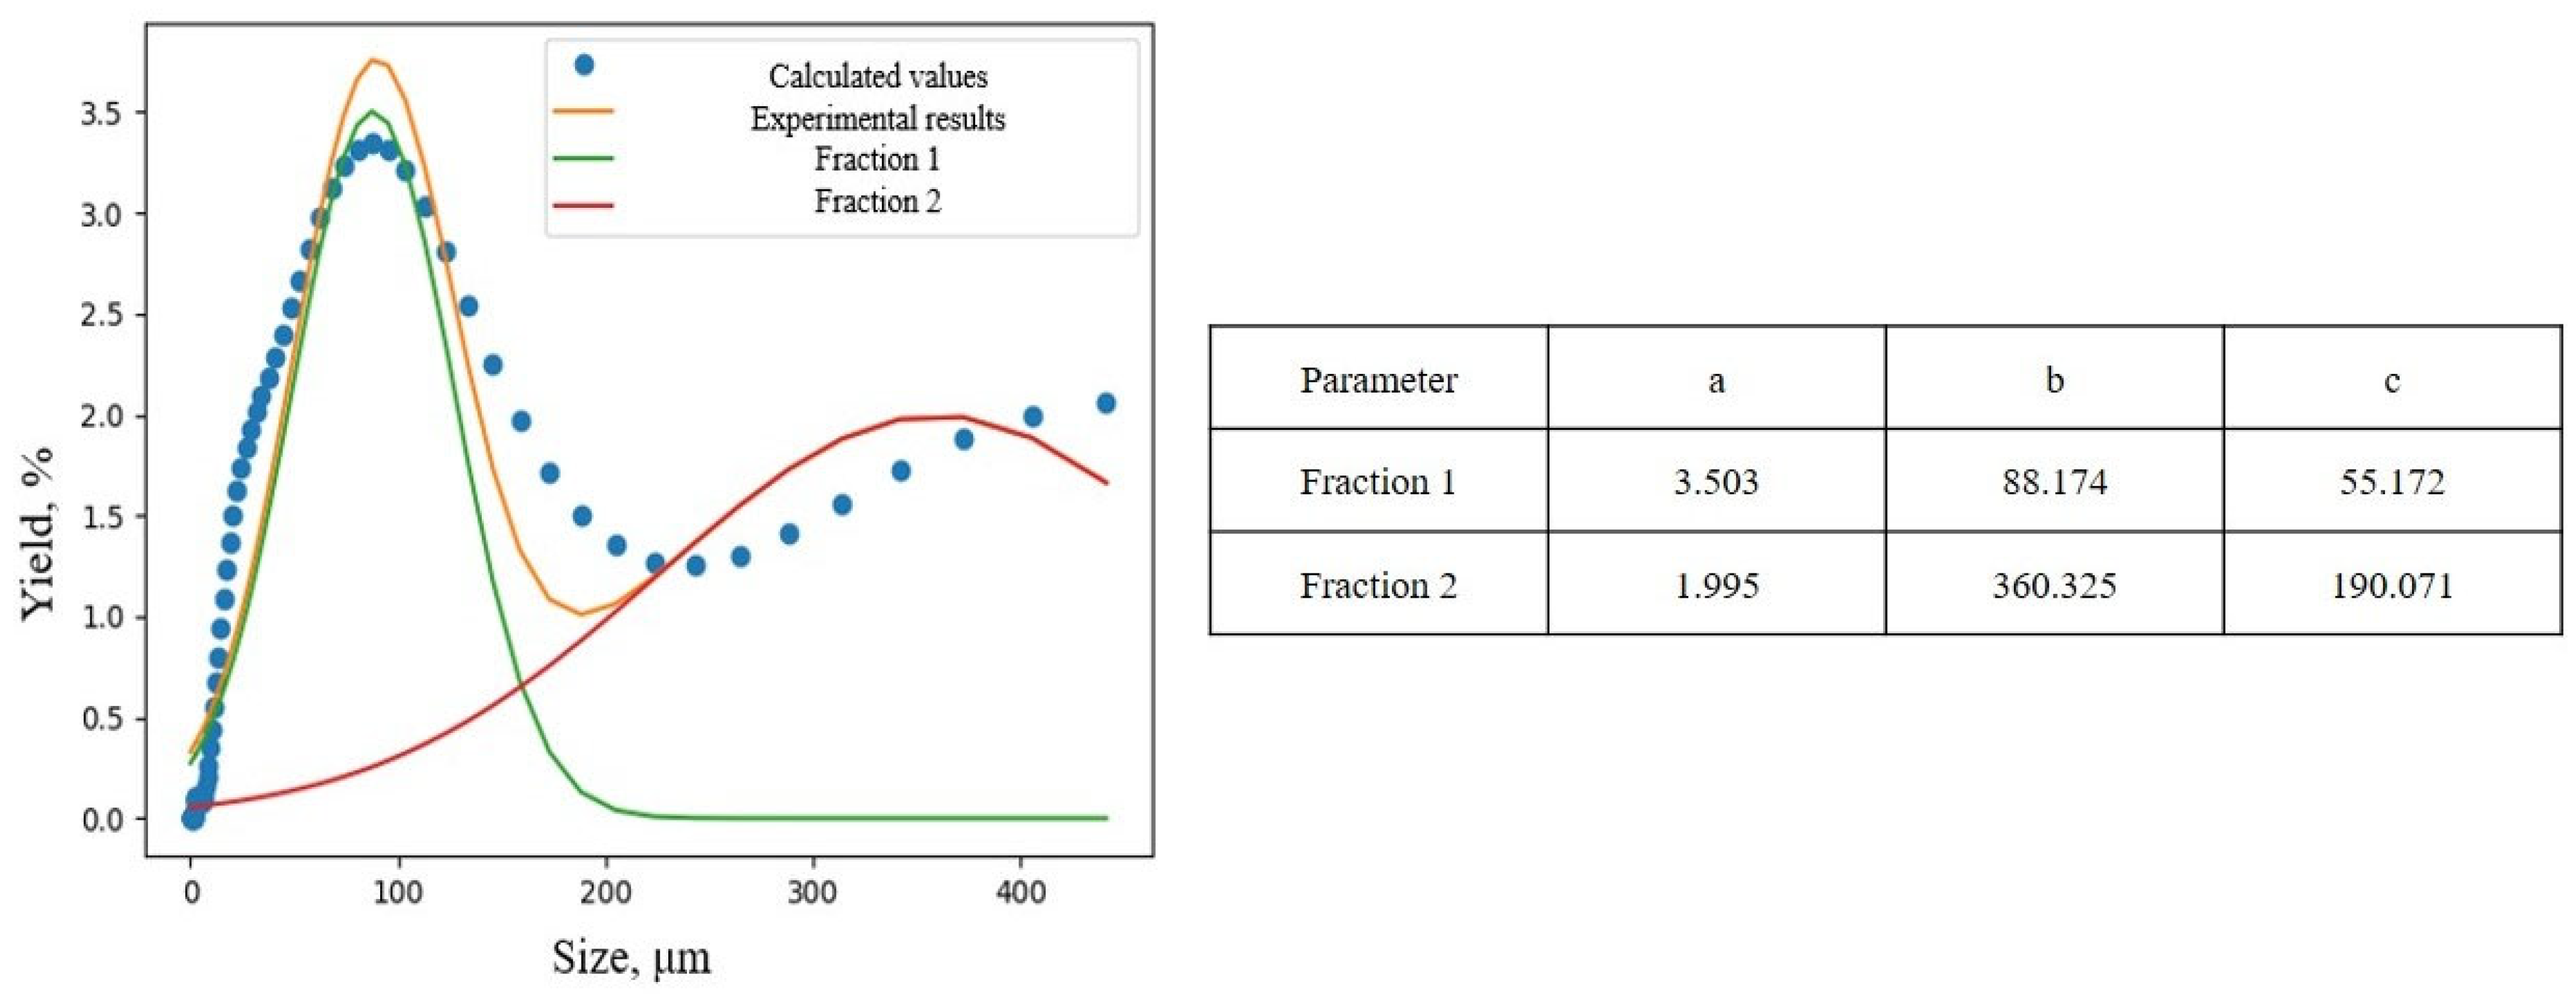
The results of interpretation of flotation product size distribution at collector dosage = 200 g/t are presented in Figure 9.
For the flotation product at the collector consumption = 200 g/t, it was found that the total size distribution can be divided into two narrow classes with the values of abscissa peaks 88.174 μm and 360.325 μm. The first peak refers to the size of paint particles, and the peak with the highest abscissa value refers to the size of waste paper fibers.
The results of interpretation of the size distribution of the flotation product at a flow rate of collector = 500 g/t are presented in Figure 10.
For the flotation product at a collector consumption = 500 g/t, it was found that the total size distribution can be divided into two narrow classes with peak abscissa values of 95.414 μm and 343.098 μm. The first peak refers to the size of paint flecks, and the peak with the largest abscissa value refers to the size of waste paper fibers.
The results of interpretation of flotation product size distribution at collector consumption = 1000 g/t are shown in Figure 11.
For the flotation product at collector consumption = 1000 g/t, it was found that the total size distribution can be divided into two narrow classes with peak abscissa values of 100.93 μm and 325.468 μm. The first peak refers to the size of ink particles, and the peak with the largest abscissa value refers to the size of waste paper fibers.
The pattern of change in the average equivalent diameter of the paint particles with increasing collector consumption is probably stipulated by the increasing amount of large particles in the froth product that are recovered during flotation. The presence of the peak with the abscissa value of 41.309 μm in pulverized product and its absence in the flotation product can be explained by the distribution’s peak merging due to the joint recovery of the large and small ink particles to the froth. The drop of the distribution peak height in the froth product obtained by the 500 g/t dosage could be explained by the recovering of larger ink particles in the froth that result in a shift in the peak’s abscissa and height. These results could be also explained by the possibility of formation of micelles of the collector molecules. As with the increasing collector dosage, the probability of collector molecules colliding and forming aggregates will also rise. Depending on the size and mass of those aggregates, they could be recovered into the froth or remain in the cell.

4. Conclusions

The conducted dispersion analysis showed that the change of technological parameters of flotation leads to statistically significant changes in the values of the presented criteria Ef and J. Criteria Ef can be used for numeric assessment of the flotation de-inking separability, as the absolute value of these criteria is very sensible to the amount of the charged particles moving in the flotation cell. Criterion J values characterize the purity of the obtained product, and the higher the values of the collector consumption and time of grinding in the pulper, the higher the value of J. Optical–microscopic and laser diffractometric studies have shown that with increasing collector dosage, there is a decrease in the selectivity of paint particle recovery to the froth, due to the probable formation of micelles from the molecules of the collector and fibers of waste paper. Hydrophobicity of apolar fragments of sodium oleate causes hydrophobicity of the formed aggregates and increases the probability of their extraction into the foam product, which correlates with the change in the values of criteria Ef and J. Thus, the cumulative analysis of the values of criteria Ef and J will allow selecting and justifying an effective mode of flotation recycling of waste paper.

5. Patents

The described method for determining interfacial characteristics is patented. Patent No. 2835415 C1 Russian Federation, MPK B03D 1/02, B03B 7/00.

Author Contributions

Conceptualization, T.A.; methodology, T.A. and V.K.; validation, V.K. and N.S.; formal analysis, T.A. and V.K.; investigation, V.K. and N.S.; writing—original draft preparation, T.A., V.K. and N.S.; writing—review and editing, T.A. and V.K.; visualization, V.K.; supervision, T.A. All authors have read and agreed to the published version of the manuscript.

Funding

This research received no external funding.

Institutional Review Board Statement

Not applicable.

Informed Consent Statement

Not applicable.

Data Availability Statement

The original contributions presented in this study are included in the article. Further inquiries can be directed to the corresponding author(s).

Conflicts of Interest

The authors declare no conflicts of interest.

References

  1. Chanturia, V.A.; Shadrunova, I.V.; Gorlova, O.E. Adaptation of separation processes of mineral processing to technogenic raw materials: Problems and solutions. Obogashchenie Rud 2012, 5, 43–50. [Google Scholar]
  2. Shadrunova, I.V.; Orekhova, N.N. Ecological and economic aspects processing of technogenic hydromineral raw materials. Min. Inf. Anal. Bull. 2014, S1, 161–179. [Google Scholar]
  3. Pashkevich, N.V.; Khloponina, V.S.; Pozdnyakov, N.A.; Avericheva, A.A. Analysing the problems of reproducing the mineral resource base of scarce strategic minerals. J. Min. Inst. 2024, 270, 1004–1023. [Google Scholar]
  4. Antoninova, N.Y.; Sobenin, A.V.; Usmanov, A.I.; Shepel, K.V. Assessment of the possibility of using iron-magnesium production waste for wastewater treatment from heavy metals (Cd2+, Zn2+, Co2+, Cu2+). J. Min. Inst. 2023, 260, 257–265. [Google Scholar] [CrossRef]
  5. Kongar-Syuryun, C.B.; Aleksakhin, A.V.; Eliseeva, E.N.; Zhaglovskaya, A.V.; Klyuev, R.V.; Petrusevich, D.A. Modern Technologies Providing a Full Cycle of Geo-Resources Development. Resources 2023, 12, 50. [Google Scholar] [CrossRef]
  6. Penya, A.F.; Bazhin, V.Y.; Makushin, D.V. Valuable aluminum alloys obtained from secondary metallized raw materials. Ipolytech J. 2024, 28, 647–656. (In Russian) [Google Scholar] [CrossRef]
  7. Pashkevich, M.; Patokin, D.; Danilov, A. Processing the Nitrocellulose-containing Waste from the Chemical Industry to Obtain Mineral Soil Additives. Ecol. Ind. Russ. 2024, 28, 10–17. (In Russian) [Google Scholar] [CrossRef]
  8. Orekhova, N.N.; Fadeeva, N.V.; Musatkina, E.N. Study and justification of the combination of beneficiation processes for obtaining flake graphite from technogenic carbon-containing dusts. J. Min. Inst. 2024, 269, 777–788. [Google Scholar]
  9. Papagianni, S.; Moschovi, A.M.; Sakkas, K.M.; Chalaris, M.; Yakoumis, I. Preprocessing and Leaching Methods for Extraction of REE from Permanent Magnets: A Scoping Review. AppliedChem 2022, 2, 199–212. [Google Scholar] [CrossRef]
  10. Nikolaeva, N.V.; Kallaev, I.T. Features of copper–molybdenum ore grinding. MIAB. Mining Inf. Anal. Bull. 2024, 1, 52–66. (In Russian) [Google Scholar] [CrossRef]
  11. Efimov, D.A.; Gospodarikov, A.P. Technical and technological aspects of the use of Reuleaux triangular profile rolls in crushing units in the ore processing plant. MIAB. Mining Inf. Anal. Bull. 2022, 10-2, 117–126. (In Russian) [Google Scholar] [CrossRef]
  12. Nazari, S.; Li, J.; Khoshdast, H.; Li, J.; Ye, C.; He, Y.; Hassanzadeh, A. Effect of roasting pretreatment on micro-nanobubble-assisted flotation of spent lithium-ion batteries. J. Mater. Res. Technol. 2023, 24, 2113–2128. [Google Scholar] [CrossRef]
  13. Romashev, A.O.; Nikolaeva, N.V.; Gatiatullin, B.L. Adaptive approach formation using machine vision technology to determine the parameters of enrichment products deposition. J. Min. Inst. 2022, 256, 677–685. [Google Scholar] [CrossRef]
  14. Danilov, A.; Serdiukova, E. Review of Methods for Automatic Plastic Detection in Water Areas Using Satellite Images and Machine Learning. Sensors 2024, 24, 5089. [Google Scholar] [CrossRef] [PubMed]
  15. Dai, G.; Li, P.; Peng, C.; Tian, E.; Wang, Y.; Huang, J.; Duan, C. Capture and extraction of gold from aqueous solution via the iron electrocoagulation method. ACS EST Eng. 2023, 3, 1188–1196. [Google Scholar] [CrossRef]
  16. Fischer, A. Deinking–How to Get the Ink Off the Paper. In Inkjet Printing in Industry: Materials, Technologies, Systems, and Applications; John Wiley & Sons: Hoboken, NJ, USA, 2022; Volume 1, pp. 449–463. [Google Scholar]
  17. Medvedeva, S.A.; Timofeeva, S.S.; Volchatova, I.V. Evaluation perspectives of scientific and practical potential complex treatment of living cells for modernization timber processing complex. Chem. Veget. Raw Mater. 2013, 4, 5–12. [Google Scholar] [CrossRef]
  18. Yang, S.; Shen, J.; He, T.; Chen, C.; Wang, J.; Tang, Y. Flotation de-inking for recycling paper: Contrasting the effects of three mineral oil-free offset printing inks on its efficiency. Env. Sci. Poll. Res. 2022, 29, 89283–89294. [Google Scholar] [CrossRef]
  19. Kemper, M. State-of-the-art and new technologies in flotation deinking. Int. J. Min. Proc. 1999, 56, 317–333. [Google Scholar] [CrossRef]
  20. Gavrilović, T.; Despotović, V.; Zot, M.-I.; Trumić, M.S. Prediction of Flotation Deinking Performance: A Comparative Analysis of Machine Learning Techniques. Appl. Sci. 2024, 14, 8990. [Google Scholar] [CrossRef]
  21. Nyman, J.; Ivaska, A. Spectrophotometric determination of calcium in paper machine white water by sequential injection analysis. Anal. Chim. Acta 1995, 308, 286–292. [Google Scholar] [CrossRef]
  22. Rudolfs, W.; Hanlon, W.D. Color in Industrial Wastes: I. Determination by Spectrophotometric Method. Sew. Ind. Wastes 1951, 23, 1125–1132. [Google Scholar]
  23. Midukov, N.P.; Efremov, D.S.; Kurov, V.S.; Smolin, A.S. The preparation of fibers for cardboard production. Chem. Veget. Raw Mater. 2018, 3, 279–286. [Google Scholar] [CrossRef]
  24. Midukova, M.A.; Smirnova, E.G.; Smolin, A.S. Improving of deinking technology of printing recovered paper. Izv. St.-Peterbg. Lesoteh. Akad. 2022, 238, 267–275. (In Russian) [Google Scholar] [CrossRef]
  25. Vashisth, S.; Bennington, C.P.; Grace, J.R.; Kerekes, R.J. Column Flotation Deinking: State-of-the-art and opportunities. Res. Conser. Rec. 2011, 55, 1154–1177. [Google Scholar] [CrossRef]
  26. Martsulevych, N.A.; Kazakov, A.V.; Flisiuk, O.M. Modeling of the flotation process in an industrial apparatus. Theor. Found. Chem. Eng. 2024, 58, 97–102. [Google Scholar] [CrossRef]
  27. Bloom, F.; Heindel, T.J. Modeling flotation separation in a semi-batch process. Chem. Eng. Sci. 2003, 58, 353–365. [Google Scholar] [CrossRef]
  28. Amand, F.J.S. Hydrodynamics of deinking flotation. Int. J. Min. Proc. 1999, 56, 277–316. [Google Scholar] [CrossRef]
  29. Huber, P.; Rousset, X.; Zeno, E.; Vazhure, T. Parameters of deinking efficiency in an industrial flotation bank. Ind. Eng. Chem. Res. 2011, 50, 4021–4028. [Google Scholar] [CrossRef]
  30. Matveeva, T.N.; Gromova, N.K.; Lantsova, L.B. Promising reagents for the extraction of strategic metals from difficult-to-enrich mineral raw materials. J. Min. Inst. 2024, 269, 757–764. [Google Scholar]
  31. Mishurina, O.A.; Mullina, E.R.; Chuprova, L.V.; Ershova, O.V.; Chernyshova, E.P.; Permyakov, M.B.; Krishan, A.L. Chemical aspects of hydrophobization technology for secondary cellulose fibers at the obtaining of packaging papers and cardboards. Int. J. Appl. Eng. Res. 2015, 10, 44812–44814. [Google Scholar]
  32. Fuerstenau, D.W. Zeta potentials in the flotation of oxide and silicate minerals. Adv. Colloid Interface Sci. 2005, 114, 9–26. [Google Scholar] [CrossRef]
  33. Dorn, E. On the propagation of electricity through flowing water in pipes and related phenomena. Ann. Phys. 1880, 246, 46–77. [Google Scholar] [CrossRef]
  34. Booth, F. Sedimentation Potential and Velocity of Solid Spherical Particles. J. Chem. Phys. 1954, 22, 1956–1968. [Google Scholar] [CrossRef]
  35. Usui, S.; Sasaki, H.; Matsukawa, H. The dependence of zeta potential on bubble size as determined by the dorn effect. J. Colloid Interface Sci. 1981, 81, 80–84. [Google Scholar] [CrossRef]
  36. Aleksandrova, T.N.; Kuznetsov, V.V.; Shlykov, N.A. Physicochemical criteria for assessing the efficiency of flotation paper deinking technologies. In Proceedings of the 2025 VI Russian National Scientific and Practical Conference “Modern Trends in the Development of Chemical Technology, Industrial Ecology and Environmental Safety”, Saint-Petersburg, Russia, 10–11 April 2025. [Google Scholar]
  37. Aleksandrova, T.N.; Kuznetsov, V.V.; Prokhorova, E.O. Investigation of Interfacial Characteristics as a Key Aspect of the Justification of the Reagent Regime for Coal Flotation. Minerals 2025, 15, 76. [Google Scholar] [CrossRef]
  38. Aleksandrova, T.N.; Kuznetsov, V.V. A New Approach to Determining Aeration Intensity in Flotation. J. Min. Sci. 2022, 58, 812–822. [Google Scholar] [CrossRef]
  39. Aleksandrova, T.N.; Kuznetsov, V.V.; Shlykov, N.A. Method for Potentiometric Determination of Interphase Characteristics in Flotation Systems. Patent No. 2835415 C1, 17 July 2024. [Google Scholar]
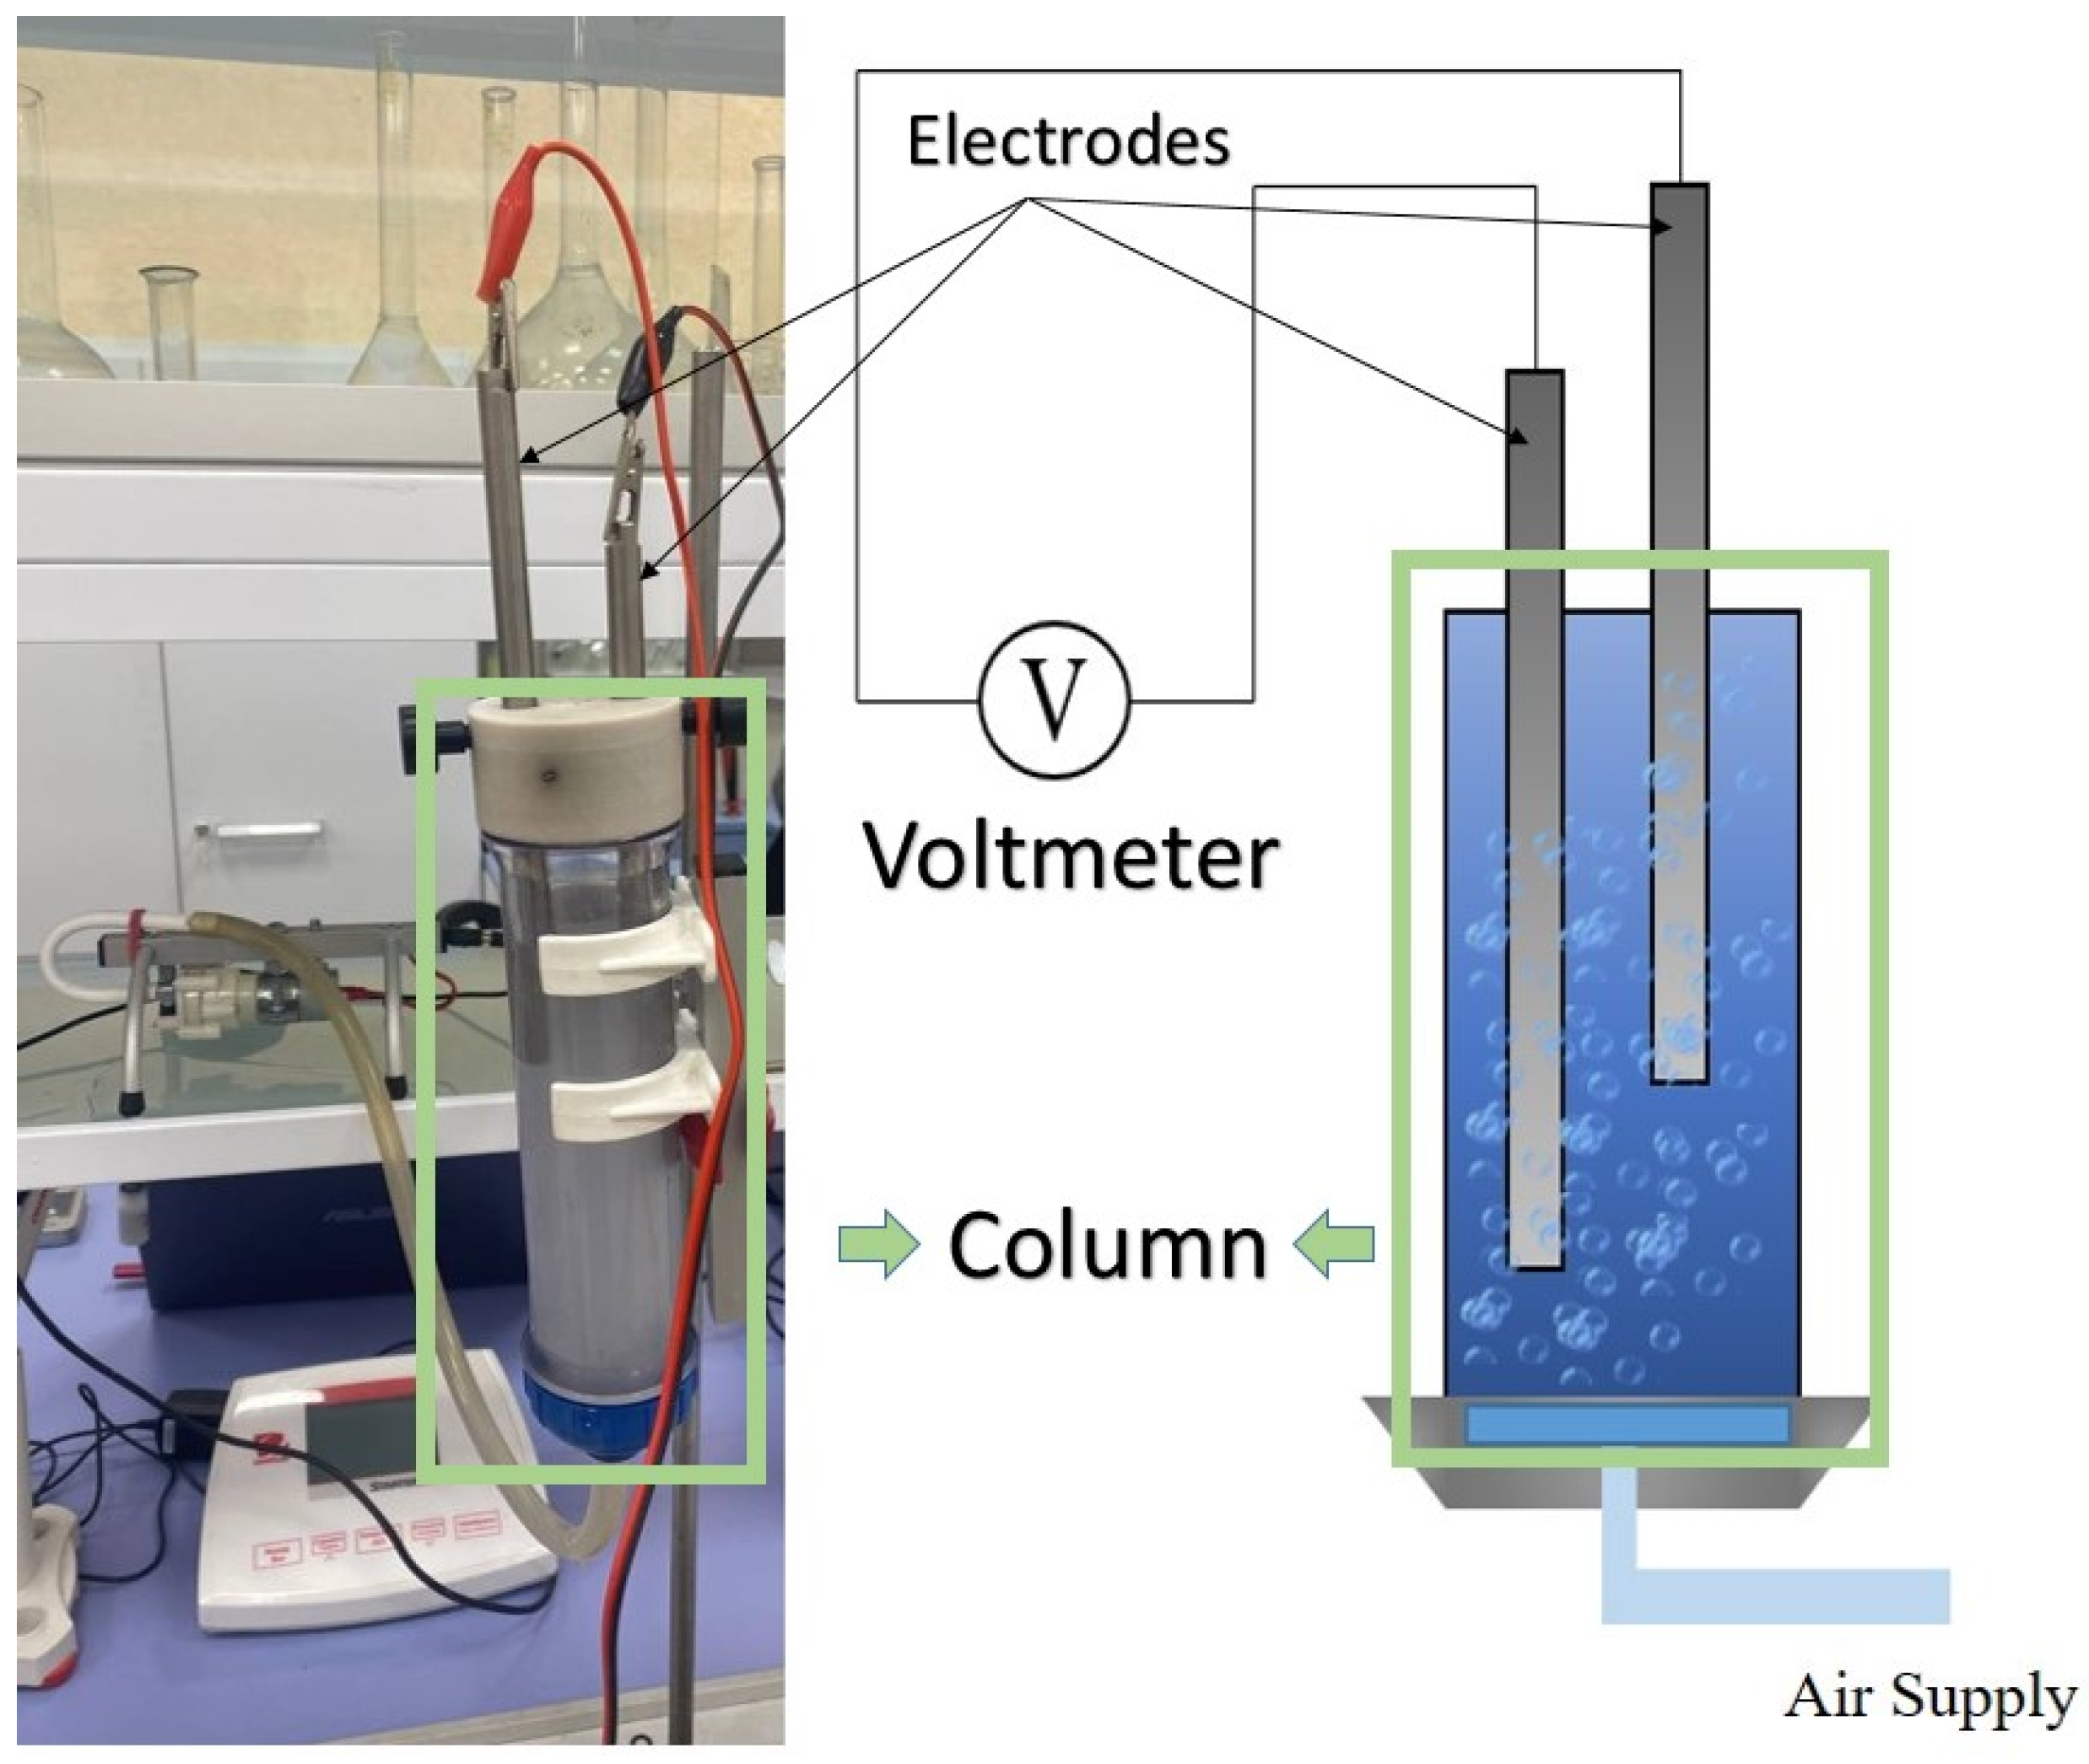
Figure 1. Installation for potentiometric determination of interfacial characteristics.
Appliedchem 05 00020 g001
Figure 2. Installation for electrophoretic studies (U-shaped tube with two electrodes located at each end of the tube that induce electromagnetic field).
Appliedchem 05 00020 g002
Figure 3. Results of elemental analysis of ash residue from waste paper pulp.
Appliedchem 05 00020 g003
Figure 4. Dependence of Ef criteria on flotation parameters.
Appliedchem 05 00020 g004
Figure 5. Dependence of factor J on flotation parameters.
Appliedchem 05 00020 g005
Figure 6. Graphical interpretation of the results of electrophoretic studies of waste paper pulp ((A)—results for the positively charged phase analysis, (B)—results for the negatively charged phase analysis).
Appliedchem 05 00020 g006
Figure 7. Results of studies of dye particles in the waste paper mass of flotation froth products ((A)—results of optical–microscopic study of the froth product with the collector dosage of 200 g/t, (B)—results of optical–microscopic study of the froth product with the collector dosage of 500 g/t, (C)—results of optical–microscopic study of the froth product with the collector dosage of 1000 g/t, (D)—graphical interpretation of the laser diffraction size analysis for the different froth products).
Appliedchem 05 00020 g007
Figure 8. Distribution of waste paper and paint particles in the pulverization product by characteristic fractions.
Appliedchem 05 00020 g008
Figure 9. Distribution of waste paper and paint particles in the flotation cleaning product by characteristic fractions at collector dosage = 200 g/t.
Appliedchem 05 00020 g009
Figure 10. Distribution of waste paper and paint particles in the flotation cleaning product by characteristic fractions at collector dosage = 500 g/t.
Appliedchem 05 00020 g010
Figure 11. Distribution of waste paper and paint particles in the flotation cleaning product by characteristic fractions at collector consumption = 1000 g/t.
Appliedchem 05 00020 g011
Table 1. Results of determination of Ef criterion values under change of flotation parameters.
Flotation ParametersEf Mean, mV/sStandard Deviation
Collector Consumption, g/tResidence Time in Pulper, minCell Product Yield, %
010-5.320.46
2001083.26.610.47
5001077.514.400.91
10001074.80.580.05
020-4.470.18
2002075.14.710.16
5002073.110.650.69
10002069.20.090.01
Table 2. Results of determining the parameters of the analysis of variance for the criterion Ef.
Sum of Squares of the DifferenceDegrees of FreedomRMS DeviationsValue of Fisher’s Criterion
Total487.502321.20-
Intragroup interaction of indicators483.89769.13-
Factor A—Collector Consumption455.933151.98673.51
Factor B—Residence time in the pulper18.3616.1227.12
Interaction of factors9.6033.2014.19
Errors3.61160.23-
Table 3. Results of determination of J criterion values under change of flotation parameters.
Flotation ParametersJ MeanStandard Deviation
Collector Consumption, g/tResidence Time in Pulper, minCell Product Yield, %
010-−1.870.25
2001083.2−1.480.17
5001077.50.700.13
10001074.81.310.17
020-0.000.00
2002075.10.780.68
5002073.11.150.14
10002069.21.520.01
Table 4. Results of determining the parameters of the analysis of variance for the J criterion.
Sum of Squares of the DifferenceDegrees of FreedomRMS DeviationsValue of Fisher’s Criterion
Total35.85231.56-
Intragroup interaction of indicators34.6374.95-
Factor A—Collector Consumption21.3937.1393.32
Factor B—Residence time in the pulper8.5712.8637.41
Interaction of factors4.6731.5620.36
Errors1.22160.08-
Disclaimer/Publisher’s Note: The statements, opinions and data contained in all publications are solely those of the individual author(s) and contributor(s) and not of MDPI and/or the editor(s). MDPI and/or the editor(s) disclaim responsibility for any injury to people or property resulting from any ideas, methods, instructions or products referred to in the content.