Abstract
Naturally ventilated cavity walls (VCWs) retrofit conventional cavity walls with vents that enable buoyancy- or wind-driven airflow and reduce cooling loads during summer. When closed, they retain the thermal performance of traditional walls. Previous studies evaluated VCWs under steady-state conditions but did not capture regional, transient solar heating effects. This study assesses VCW performance across major U.S. climate types using a transient 3D solar heating model for east-, south-, and west-facing façades in four representative cities. Simulated façade temperatures were validated using published measurements and then applied to a regression-based energy model to estimate cooling load reductions. Results show 30–40% savings for east/west façades and 10–20% for south façades, with monthly reductions exceeding 1.0 kWh/m2 in all regions. On-peak savings (3–7 PM) were at least 1.5× off-peak values, indicating strong peak-shaving capability. Overall, VCWs offer a low-cost, climate-adaptive retrofit strategy that improves façade energy performance and reduces peak cooling demand.
1. Introduction
Reducing building energy consumption has become one of the prominent tasks in designing a sustainable structure, since buildings account for a significant portion of total energy use in the United States [1]. Among all building systems, the heating and cooling load takes up a considerable percentage of building energy use. The performance of the building envelope plays an imperative role in regulating these forces in terms of facilitating the process of heat flow between the internal and external environments. Improving the envelope design is therefore essential not only for energy efficiency but also for occupant comfort and long-term building sustainability.
Conventional cavity walls are widely used in U.S. residential, commercial, and institutional buildings. In their traditional form, these walls consist of an exterior veneer, an air cavity, and an insulated inner layer. While the major aim of the air cavity is to act as a capillary barrier to control moisture, it has not been designed to optimize energy performance in the past. However, current studies [2,3,4,5,6,7] have indicated that if the air cavity can be ventilated, there would be considerable reductions in solar heat gains and corresponding cooling requirements during the cooling seasons of the year. The reduction in cooling loads is particularly critical during daily and seasonal peak demand periods, as peak electricity consumption places severe strain on the power grid and dictates utility-rate pricing.
This concept, referred to in this paper as the naturally ventilated cavity wall (VCW), introduces inlet and outlet vents on the exterior veneer [2,3]. When the vents are open, either buoyancy-driven or wind-driven flow across the cavity supports convective heat transfer between the wall and the external environment, thus lowering the wall cooling load (Figure 1). When closed in the absence of cooling requirements, the wall maintains the performance characteristic of a conventional sealed cavity wall while continuing to provide the purpose of insulation. Such versatility provides a promising passive retrofit option with less disruption to existing stocks [4,5]. Because these effects depend strongly on solar exposure, VCWs are particularly relevant in U.S. regions with high cooling demand and long summer peak-load periods.
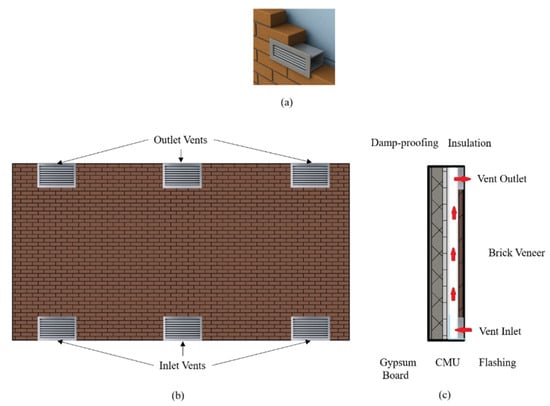
Figure 1.
Schematic of a ventilated cavity wall (VCW). (a) Vent Example in 3D. (b) Wall Front Face. (c) Wall Section. Reproduced from the previous study on naturally ventilated cavity wall configurations [2]. Red arrows indicate the direction of buoyancy-driven airflow within the ventilated cavity, entering through the lower vent inlets and exiting through the upper vent outlets.
Despite its potential, there has not been any extensive assessment of the performance of VCWs in the various climate zones in the U.S. The existing literature has explored either laboratory setups or parametric studies related to wall configurations [6,7]. There is very little information available to architects, designers, and policymakers on the larger significance of adopting VCW technology in different climate zones in the U.S. Addressing this gap is essential to determine whether VCWs represent a broadly viable solution for reducing cooling loads in U.S. buildings. In particular, prior studies such as Na & Shen [2] focused on steady-state or orientation-specific performance, leaving open questions regarding regional transient behavior, peak-load implications, and broader applicability.
The primary objective of this study is to provide a comprehensive regional assessment of naturally ventilated cavity walls (VCWs) across multiple U.S. climate zones. Building upon previous simulation work, this research specifically evaluates the system’s potential for reducing overall cooling loads and, critically, performs a quantitative economic assessment of its peak-electricity load reduction capacity. This work validates the VCW as a viable, low-cost passive strategy and offers region-specific design guidance to maximize both energy efficiency and grid-level peak-shaving benefits.
Building on these objectives, this study further advances prior work by incorporating a new transient regional modeling framework, a normalized irradiance analysis for comparing climatic regimes, a peak-load and time-of-use (TOU) evaluation, and orientation-weighted scenarios to capture realistic façade performance. These contributions extend earlier VCW and ventilated façade studies, including Na & Shen [2], which focused primarily on steady-state or single-orientation behavior.
2. Literature Review
Reducing building energy consumption is one of the critical challenges in sustainable design, as the building sector accounts for a significant portion of total energy use in the U.S. [1]. Building envelopes, which are the major barrier between the building interior and exterior environments [8], play a key role in building energy performance [4,5]. A well-designed envelope could greatly reduce the building’s cooling and heating demand by minimizing heat transfer, thus reducing the energy requirements for the building’s HVAC systems [9,10]. The key design parameters affecting envelope performance include building shape and orientation, shading devices, insulation, wall and roof assemblies, and aspect ratio [8]. Modern construction practice emphasizes airtightness and high insulation levels to minimize unwanted heat exchange [9,10], although over-airtight environments might reduce the opportunity of passive cooling losses and aggravate the risk of overheating during cooling periods [2].
2.1. Ventilated and Naturally Ventilated Wall Systems
In response to these challenges, ventilated wall systems have gained increasing attention as a passive strategy to improve thermal performance [4,5] illustrates the configuration of an example of VCW. A naturally ventilated cavity wall is an enhanced version of the conventional wall where inlet and outlet openings are installed on the external veneer to facilitate buoyancy-induced or wind-driven air flow in the wall cavity [11,12]. In this context, the ventilation airflow enhances convection currents between the wall surfaces and the ambient air, thus reducing solar heat in cooling seasons [2,3]. The vents may be closed during the heating periods to prevent energy loss [2]. This allows VCWs to be a versatile retrofitting solution for existing cavity walls [13].
Traditional cavity walls in U.S. buildings, here referred to as non-ventilated cavity walls (NVCWs). They typically include an outer masonry veneer, an air gap, and an insulated backup wall [8]. The major purpose of the cavity is a capillary barrier for moisture management, given that the small weep holes can provide some ventilation capability [11]. Modern building standards, such as TMS 402/602-16, continue to recognize the importance of such functions as moisture management, as opposed to ventilation for heat transfer purposes [13,14]. Therefore, despite the vast prevalence of cavity walls in the U.S. building stock, the practice of cavity wall ventilation retrofits remains limited [2,11,12].
2.2. Similar Passive and Ventilated Façade Concepts
Ventilated cavity walls, in their conceptual origins, stem from other passive designs utilizing solar- or buoyancy-powered air flow, including Trombe walls and solar chimneys [15,16,17]. These ideas promote air movement to improve indoor comfort and remove excess heat. Modern double skin façades (DSFs) [18,19,20] and opaque ventilated façades (OVFs) [21,22] also incorporate cavity ventilation, natural or forced, to enhance insulation and cooling performance. The current reviews by Cuce et al. [4] and Abou Ibrahim et al. [5] confirm cooling capacity reductions between 20 and 50%, depending on their solar orientation, cavity configurations, and climatic regimes. Ventilated façades have gradually come to be acknowledged in low-carbon envelope design.
Experimental work and field measurements, such as Lin et al. [6] and Fantucci et al. [7], have also investigated the summer performance of ventilated façades and supported the accuracy of numerical predictions with experimental data obtained with full-scale models. These experimental works have demonstrated the efficiency in reducing internal wall surface temperatures and in enhancing facade summer rejection, although they were mostly carried out in Euro-Mediterranean climates or non-U.S. climates [3,18,21,22,23] rather than in North America.
Moreover, these full-scale and field-based studies generally focus on individual façades or test cells in specific locations and do not provide a regionalized assessment of VCW performance or peak-load behavior across diverse U.S. climate zones.
2.3. Numerical and Computational Modeling Approaches
Thanks to improvements in computational processing, computational fluid dynamics (CFD) has become the dominant method for analyzing airflow and heat transfer within ventilated cavities [19,24,25,26,27]. CFD simulations provide high spatial resolution of temperature and velocity fields. This enables detailed parametric exploration of cavity geometry, vent size, and boundary conditions. These fundamental dependencies were mostly investigated in works such as Rodrigues and Aelenei [12] and Gan [28]. Modern approaches involving CFD and other software models [29,30] allowed further parametric studies of complex multi-zone façades.
However, the current computational cost of dynamical models of ventilated cavity walls is relatively high. Seasonal transient computational fluid dynamics (CFD) models are infeasible due to their high computational cost. In order to eliminate such limitations, approaches utilizing outputs from computational fluid dynamics models with regression models have been proposed in previous studies [2,6,7,30]. These models allow predictions of the overall performance of the proposed models.
Although the majority of computational work has been dedicated to investigations of the airflow and heat transfer in ventilated façades, few studies have subsequently related such computational results to their economic implications. In practice, the cooling load reductions achieved through façade ventilation translate directly into lowered peak electricity demand, which is increasingly important under time-of-use (TOU) pricing schemes and demand-side management programs. Therefore, understanding the relationship between façade energy performance and peak-load reduction provides a necessary bridge between building-scale modeling and system-level energy resilience, forming the motivation for the following section.
2.4. Peak-Load Reduction Strategies, and Time-of-Use (TOU) Economics
While reducing overall energy consumption is a primary goal, mitigating peak-electricity demand is particularly critical in regions with high cooling demand. Peak load often occurs during summer afternoons when cooling use surges, requiring activation of costly “peaker” plants and stressing existing infrastructure. Reducing this peak load offers substantial benefits, including avoiding costly infrastructure upgrades [31], lowering environmental emissions, and providing financial savings for end-users through demand-side management (DSM) programs [32]. Notably, these peak periods also correspond to highly differentiated electricity pricing, particularly in deregulated markets such as Texas, where prices can increase by orders of magnitude during peak events (Figure 2).
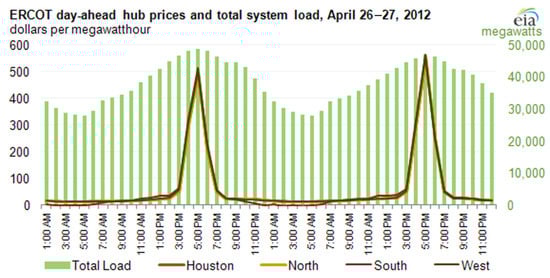
Figure 2.
An example of the differentiated price during peak time: wholesale electricity prices spike in Texas [33].
To address this grid challenge, electricity load management strategies can generally be classified into four types based on their effect on the daily consumption profile: base case, load shifting, peak shaving, and conservation/efficiency [34] (Figure 3). To incentivize load reduction during critical hours, utilities commonly employ Time-of-Use (TOU) pricing [35]. Under TOU rates, electricity costs are dramatically higher during defined on-peak hours (e.g., 3 PM to 7 PM). As the economic return from energy saving is maximized when the greatest load reduction occurs during these high-cost windows, the focus for passive systems shifts from general efficiency to peak-shaving capability [36,37].
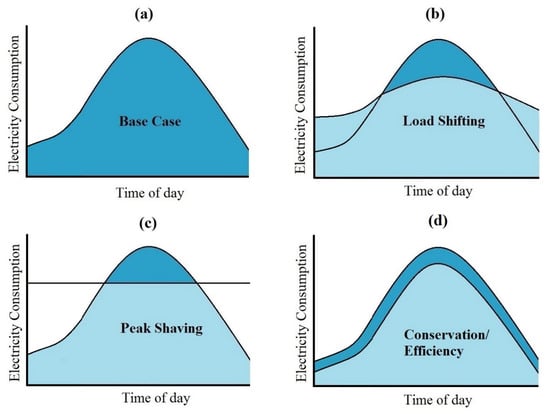
Figure 3.
Conceptual illustration of daily electricity consumption under four load-management strategies: (a) base case, (b) load shifting, (c) peak shaving, (d) conservation/efficiency. Reproduced from [38]. Dark blue represents the baseline electricity demand profile, while light blue represents the modified demand profile under each demand-side management strategy.
Building-related peak load reduction strategies fall into two main categories: active (e.g., smart thermostats [39], battery storage [40], and load shifting of major appliances [41]) and passive (conservation). Passive conservation strategies, which include high-performance insulation [36,37,42], advanced glazing [18,43], and ventilated façades [2,3,4,5,7,13,21,28,30,44], are particularly effective because they minimize the load before it reaches the cooling system. Evaluating a passive system like the VCW involves understanding its ability to provide the greatest savings during peak-stress hours. This ability can serve as a key metric of its economic and environmental value.
2.5. Research Gap
Although extensive work has been performed concerning double skin and ventilated facade solutions [3,4,5,6,7,15,16,17,18,19,20,21,22,23,27,28,29,30], naturally ventilated cavity walls in conventional masonry construction are less investigated, especially in the context of the U.S. climate zones. The existing studies mostly involve short-term or site-specific simulations [6,7,11,12,15,21,22,23,27], without taking into consideration the effects of solar radiation intensity in different regions on overall energy efficiency. Consequently, these real-life or full-scale studies do not offer a regional perspective on VCW retrofits or quantify their performance under different U.S. climatic regimes. Moreover, few studies address the practical adaptability of these systems, specifically the ability to open vents in summer and close them in other seasons as a low-cost retrofit strategy compatible with current construction practice [2,12,13].
More importantly, the literature lacks a dedicated quantitative analysis of how VCWs perform during peak-electricity demand periods (e.g., 3 PM to 7 PM). While Na & Shen [2] established the regression framework, the present study extends this by integrating region-specific transient simulations and peak-load metrics. Without metrics such as the Peak Energy Saving Rate () or a comparison of on-peak vs. off-peak performance, the system’s true economic value as a load-shaving technology remains critically unassessed. Additionally, optimization-based envelope studies such as Lin et al. [45] highlight the broader importance of façade configuration and thermal response in cooling load performance, reinforcing the need for regional evaluation of VCW retrofits.
- Quantify Regional Cooling Load: Calculate the cooling load reduction in VCWs in four climatic zones in the United States, utilizing transient solar models and regression models.
- Assess Peak-Load Performance: Perform quantitative regional analysis concerning the capacity to reduce the peak electric load of the VCW System during the critical on-peak period (3–7 PM).
- Determine Economic Viability: Calculate important performance parameters such as and Rp, and carry out a comparative study to evaluate the superior economic advantage of the VCW.
- Provide Design Guidance: Make recommendations to facilitate the design and implementation of the VCW retrofits in achieving the maximum possible energy savings, both in general and during peak periods.
3. Methodology
The methodology taken in the proposed work involves simulating the external wall surface temperatures of VCWs in summer climatic conditions, applying a previously validated regression-based energy model, and performing a comprehensive analytical assessment of the resulting energy performance. This combined strategy enables the estimation of overall energy saving in addition to its primary significance in terms of peak-load reduction in different climatic regions in the United States. The overall research workflow, which integrates the simulation models, energy performance calculations, and the advanced peak-load assessment for the combined study, is presented in the conceptual framework shown in Figure 4.
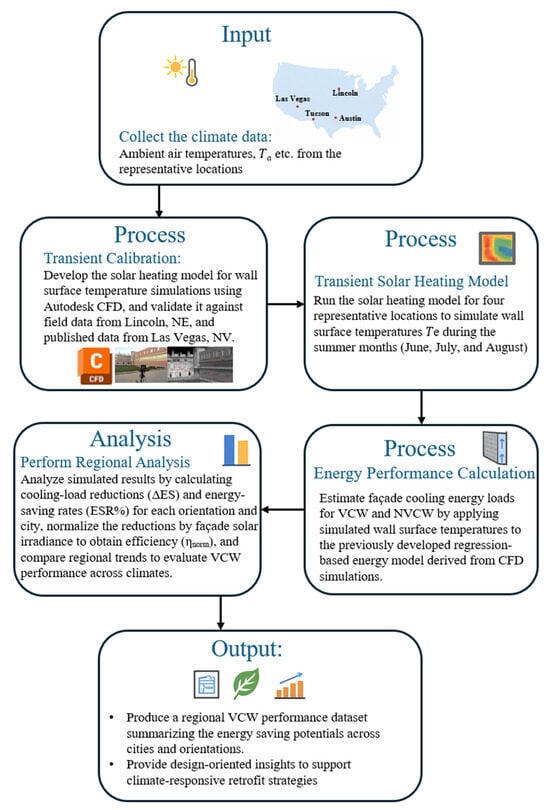
Figure 4.
Conceptual framework of the research workflow for assessing the regional energy-saving performance of ventilated cavity walls (VCWs).
3.1. Solar Heating Model for Simulating Wall Surface Temperatures
Figure 5 illustrates the base-case geometry of the ventilated cavity wall model developed in our previous study [2], which established regression relationships between surface temperature and cooling load reduction.
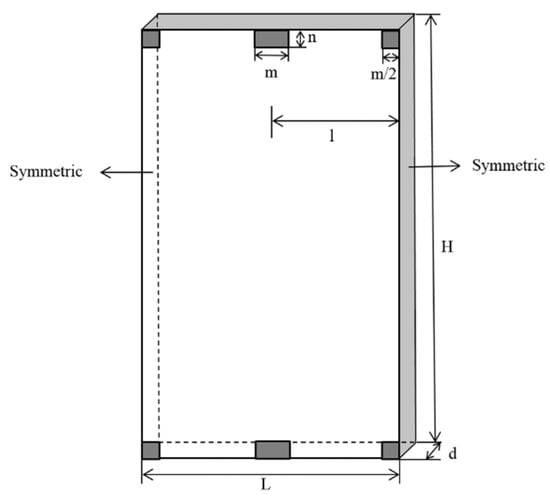
Figure 5.
Base-case geometry of the ventilated cavity wall (VCW) model used in the simulations. Reproduced from Na & Shen [2].
To supply region-specific surface temperatures, this study developed a transient 3D solar heating model (Figure 6) to generate hourly façade temperatures across representative U.S. climates. The resulting temperature profiles were used as inputs to estimate cooling load reductions based on the previously derived regression equations.
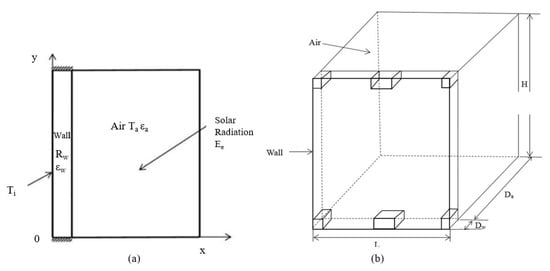
Figure 6.
Solar heating model. (a) Schematic of the simulation in cross-sectional view. (b) Geometry of the solar heating model in 3D.
The transient simulations were conducted in Autodesk CFD [46] with location-specific climatic inputs, extending our prior model to regional conditions.
Equations (1) and (2) were derived from the authors’ prior steady-state CFD study of passively ventilated cavity walls [2]. Their application to transient temperatures is justified by the quasi-steady thermal response of masonry walls, in which high thermal mass leads to gradual diurnal surface temperature variation. Sensitivity analyses in [2] confirmed that cooling load predictions remain accurate under such conditions, with both equations achieving R2 > 0.9. Accordingly, the same correlations were adopted here to estimate regional VCW performance.
where Ta and Te denote the ambient and exterior surface temperatures, respectively. Although the present work employs transient CFD modeling to evaluate regional performance, these regression formulas serve as reference relationships for comparing predicted cooling load tendencies under varying climatic conditions.
PVCW = −5.19 + 0.15 Ta + 0.08 Te
PNVCW = 0.24 Te − 5.19
The transient model (Figure 6) simulated the wall’s thermal response to solar radiation using Autodesk CFD’s built-in solar and thermal solvers [46]. Convective and radiative exchanges with ambient air were represented through boundary film coefficients and surface properties. To reduce computational cost, cavity airflow was not explicitly modeled; instead, buoyancy effects were incorporated through previously validated regression relationships. The full governing equations for the solar heating model, including the transient energy balance and definitions of radiative, convective, and solar flux terms, are provided in Appendix A.
To simplify the model and isolate regional solar effects, ground radiation was neglected by omitting ground material assignment. Wall thermal resistance and boundary temperatures were specified according to the parameters summarized in Table 1. Solar irradiance varied diurnally and by location based on solar geometry, with latitude (φ) and longitude (λ) defining site-specific sun paths. A clear-sky condition was assumed, and surface and air emissivities were prescribed to determine radiative heat exchange.

Table 1.
Summary of input parameters used in the simulation. These parameters define the boundary conditions for the transient CFD model and ensure consistent comparison across regional climates.
In both the current and previous studies [2], the north façade was excluded because negligible solar exposure produces almost no temperature differential (ΔTe–a), and therefore, no meaningful cooling load reduction. Similar simplifications have been adopted in ventilated façade and passive wall-cooling studies (e.g., [52,53]), in which cases solar-exposed orientations define façade cooling loads.
For the comparative peak-load assessment, cooling loads were considered in three different scenarios of building orientation: (1) East/West dominant (contribution 100:1 ratio), (2) Equal, and (3) South/North dominant (contribution 100:1 ratio) (more in Section 3.4).
The material properties, geometric dimensions, and location-specific climatic inputs used in the simulations are summarized in Table 2 and Table 3, respectively. All cases were simulated for the full summer period (June–August). Four representative U.S. cities (Table 3) were selected to capture typical boundary conditions across cold-humid, mixed/hot-dry, extremely hot-dry, and hot-humid ASHRAE climate zones [54]. These locations were chosen to illustrate regional variability in VCW performance rather than to provide exhaustive national coverage.
Table 2.
Physical properties of materials used in the wall model. The selected values represent typical construction materials and influence the thermal response and heat storage capacity of the wall assembly.
Table 3.
Representative U.S. climate zones selected to evaluate ventilated cavity wall performance.
Although the simulations were conducted for the full summer period (June–August). To provide a clear and interpretable visual comparison across climates, representative days were extracted from the full simulation results. For each city, the representative day was defined as the day whose 24 h wall surface temperature profile exhibited the smallest deviation from the corresponding hourly monthly means.
The numerical runs were carried out in controlled and idealized environments. The model considered heat transfer primarily through conduction and radiation between wall layers, while ambient conditions such as wind and air movement were represented through boundary parameters rather than fully resolved airflow fields. Moreover, the solar intensity pattern for a situation with clear skies was also applied.
3.2. Numerical Model Validation
The present numerical model in 3.1 was validated through the temperature measured by two experimental studies. One referred to a south wall temperature measurement on two July days in Las Vegas [55], while the other was conducted by the author in Lincoln [56]. The summary of the experimental settings is shown in Table 4.
Table 4.
Experimental settings used for model validation. These data define the boundary conditions and material configurations employed to verify the accuracy of the numerical simulation against measured wall-temperature profiles in Las Vegas and Lincoln.
The numerical model was validated by comparing simulated wall surface temperatures with measured data from two independent experimental studies. As shown in Figure 7, good agreement was observed for both locations and orientations, with minor deviations attributable to unmodeled environmental effects (e.g., clouds, wind, shading, and ground radiation).
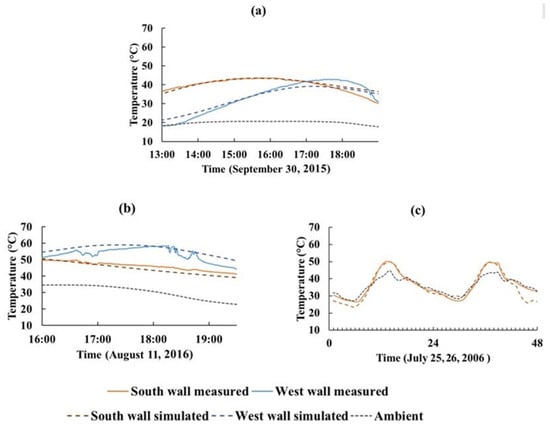
Figure 7.
Comparison of the simulated and measured wall temperatures in (a) a fall day in Lincoln, (b) a summer day in Lincoln, (c) two summer days in Las Vegas [55,56]. The agreement between the curves demonstrates the model’s reliability in predicting surface-temperature variation.
Quantitative agreement between simulated and measured temperatures was evaluated using RMSE, MBE, and the coefficient of determination (R2). As summarized in Table 5, RMSE values ranged from 1.1 to 1.5 °C, and R2 exceeded 0.94 across all cases, indicating strong model accuracy.
Table 5.
Quantitative comparison between simulated and measured temperature data for the South and West walls across different locations. Each RMSE, MBE, and R2 value represents the overall fit between instantaneous temperature profiles (30 s to 1 min intervals) for a representative validation day.
Sensitivity checks comparing coarse and fine meshes, as well as different timestep and iteration settings, showed negligible impact (<1%) on predicted wall surface temperatures; therefore, a 10,000-node mesh and a 600 s timestep were adopted.
3.3. Energy-Saving Intensity and Monthly Energy Analysis by Regions
Energy saving at different locations was estimated using steady-state VCW simulation results reported in the authors’ previous study [2]. With the formulas for estimating energy load for the base case VCW and NVCW, the energy saving intensity can be calculated by
where PS is the energy saving intensity; PNVCW is the energy load of the non-ventilated cavity wall; PVCW is the energy load of the naturally ventilated cavity wall (W/m2).
Ps = |PNVCW|−|PVCW|
The monthly energy load on the NVCW, VCW, and the energy saving in the different locations were estimated by calculating the integrations of the numeric data using MATLAB R2024a [57].
where is the monthly energy load of the non-ventilated cavity wall (KJ/m2); EVCW is the monthly energy load of the naturally ventilated cavity wall (KJ/m2); t is time (s); ∆ES is the monthly energy saving when using the naturally ventilated cavity wall (KJ/m2).
The monthly energy saving rate is the percentage of energy:
where is the percentage energy saving in one month. Calculations were performed separately for east-, south-, and west-facing façades under the representative summer months (June, July, and August) for each study location.
To facilitate cross-climatic comparison, the simulated cooling load reductions were further normalized by local solar irradiance to highlight the relative effectiveness of the VCW in different solar exposure environments. The normalized energy-saving efficiency (ηnorm) was defined as follows:
where (kWh·/m2·per month) is the average monthly solar irradiance incident on the façade for the corresponding location and orientation. The monthly solar irradiance incident on each façade orientation was estimated by converting the corresponding horizontal global irradiance obtained from the National Solar Radiation Database (NREL-NSRDB) [58]. The relationship can be expressed as follows:
where = average monthly solar irradiance incident on the façade (kWh/m2·per month), = monthly average global horizontal irradiance (kWh/m2·per month), and = façade irradiance conversion factor (dimensionless), determined based on solar geometry for each orientation and latitude.
The conversion factors for east, south, and west façades (Appendix B Table A1) account for the solar altitude and azimuth variation during the summer months (June–August) [59]. For each city, the horizontal irradiance was multiplied by the corresponding value to estimate the façade-level irradiance, as summarized in Appendix B Table A2.
3.4. Peak-Load Reduction and Comparative Orientation Analysis
Peak-load performance was evaluated during typical summer on-peak hours (3–7 PM). Building-level energy-saving intensity was obtained by area-weighting orientation-specific savings. North façades were assumed NVCW (Pn ≈ 0) due to negligible savings.
Three orientation scenarios were evaluated: N–S dominant, Equal, and E–W dominant, using k = 100 to define bound cases. To isolate orientation effects, the extreme ratios (100:1 and 1:100) were treated as conceptual limits for sensitivity analysis rather than realistic building configurations.
where , , and are the energy saving intensity of the buildings with north and south facing dominated wall orientation, equally wall area in the four orientations, east and west facing dominated wall orientation, respectively (w/m2); Pe, Ps, and Pw represent the energy saving of east, south, and west walls, respectively (w/m2).
The Peak Energy Saving Rate () was defined as the percentage reduction in cooling load during the on-peak period relative to the NVCW baseline. For each building-orientation scenario, peak-period energy consumption and savings were calculated using the same weighted approach applied in Equations (10)–(12), and was subsequently obtained using Equation (13).
where is the percentage of monthly cooling saving during the peak time from 3 PM to 7 PM; is the monthly cooling saving during peak time when using self-ventilated cavity wall (kWh/m2); ’ is the monthly total energy load of the non-ventilated cavity wall during peak time (kWh/m2).
Furthermore, the ratio of the peak to the off-peak time hourly average energy saving was computed to quantitatively determine if the VCW system preferentially mitigates load during the most critical hours (i.e., > 1).
where is the ratio of the hourly on-peak to the off-peak time average energy saving.
3.5. Economic and Emission Estimation Framework
To assess the broader energy-saving potential and environmental implications associated with VCW retrofits, the cooling energy savings were translated into carbon dioxide savings and dollar savings. The analysis adopted a representative U.S. grid emission factor per kWh of electricity saved, consistent with the national average grid mix. For economic estimation, typical summer time-of-use (TOU) electricity rates were assumed. The total monthly and peak-period savings were then estimated by multiplying the modeled energy-saving intensity (kWh/m2) by façade area and rate differentials. A representative small commercial or residential building façade area of 500 m2 was used to approximate total savings, assuming roughly equal orientation distribution across four façades. The total monthly and peak-period savings were then estimated by multiplying the modeled energy-saving intensity (kWh/m2) by the assumed façade area and TOU rate differentials. These simplified assumptions provide a consistent basis for comparison across the four regional case studies.
4. Results and Discussion
4.1. Wall Surface Temperature Patterns and Climatic Drivers
As shown in Figure 8, east- and west-facing walls consistently reached higher peak temperatures than south-facing walls across all climate zones. This pattern stems from solar geometry: east and west façades receive more direct morning and afternoon radiation, whereas the south façade receives comparatively diffuse radiation during midsummer peak hours.
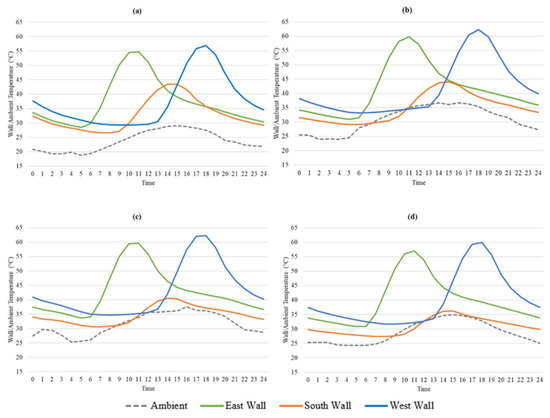
Figure 8.
Diurnal wall surface and ambient temperatures for typical summer days in four U.S. cities: (a) Lincoln, 12 July 2016, (b) Las Vegas, 4 July 2016, (c) Tucson, 6 July 2016, and (d) Austin, 7 July 2016. Each plot compares east-, south-, and west-facing façades with local ambient temperature.
The corresponding seasonal peak wall surface temperatures across all four cities are summarized in Appendix C Figure A1, providing a complementary overview of maximum thermal exposure during the summer months.
The critical parameter for the performance of a naturally ventilated cavity is not the absolute wall temperature, but the temperature differential between the exterior wall surface and the ambient air (ΔTe–a), which drives the buoyancy-induced airflow. Figure 9 summarizes the monthly average ΔTe–a, clearly demonstrating that east and west walls maintained a significantly larger driving potential for ventilation than south walls.
Figure 9.
Monthly average wall and ambient temperature difference.
Climatic conditions modulate the magnitude and duration of elevated wall temperatures. Hot-dry regions exhibit higher peak temperatures and longer periods of solar exposure, while cooler climates benefit from larger wall air temperature differentials that enhance buoyancy-driven heat removal.
Appendix C Figure A2 further illustrates the distribution of wall surface temperature durations across orientations and climates, highlighting the prolonged periods during which east and west façades maintain elevated temperatures and sustained ΔTe–a during summer.
In summary, the surface temperature analysis establishes that (1) east and west walls present the greatest opportunity for heat removal due to their large ΔTe–a, and (2) this potential exists across all studied climates, albeit with varying magnitudes. These thermal conditions form the fundamental basis for the cooling load reductions quantified in the following sections.
4.2. Regional Energy Performance Analysis
The temperature differentials between wall surfaces and ambient air (ΔTe–a) strongly influence the convective cooling potential of ventilated cavities. This section quantifies how these thermal patterns translate into regional cooling load reductions.
4.2.1. The Energy Consumption Rate
Leveraging the simulated temperature data from Section 4.1, the energy loads on both ventilated (VCW) and non-ventilated (NVCW) cavity walls were estimated using Equations (1) and (2). Full diurnal energy load curves for all regions are provided in Appendix C Figure A3.
Across all four cities, the simulated load curves followed the expected diurnal cycle driven by solar radiation. VCWs consistently reduced midday peak loads relative to NVCWs, with the largest reductions occurring when ΔTe–a was highest, reinforcing the role of buoyancy-driven ventilation in moderating heat transfer. This behavior was consistent across climates, though with varying magnitude reflecting local temperature and radiation intensities.
4.2.2. The Energy Saving Intensity
To better illustrate energy efficiency performance, the energy saving rates of the east, west, and south walls were calculated using Equations (1) and (2), and plotted in Figure 10. The energy saving profiles revealed that the wall orientation could have a significant impact on the energy saving magnitude. The results indicated that the peaks of the east and west wall energy saving rate were generally higher than that of the south wall across all regions.
Figure 10.
Diurnal energy saving for typical summer days in four U.S. cities: (a) Lincoln, 12 July 2016, (b) Las Vegas, 4 July 2016, (c) Tucson, 6 July 2016, and (d) Austin, 7 July 2016. Each plot compares the VCW vs. NVCW’s saving potential for east-, south-, and west-facing façades.
These peaks shifted with solar position—east walls in the late morning, south walls in early afternoon, and west walls in the late afternoon—corresponding to periods of intensified solar gains. This pattern reflects stronger buoyancy-driven ventilation during hours when ΔTe–a is highest, indicating that VCWs passively track and mitigate diurnal load fluctuations.
4.2.3. Summary of Monthly Energy Consumption, Energy Saving, and Energy Saving Rates by Regions
Monthly cooling loads for NVCW and VCW systems were obtained by integrating hourly results in MATLAB R2024a [57]. Because this subsection evaluates accumulated cooling demand, results are expressed in kWh/m2 rather than instantaneous W/m2. Figure 11a shows that ventilating the cavity reduced total cooling loads across all orientations and narrowed the performance gap between east/west façades and the typically lower-load south façade.
Figure 11.
Monthly energy consumption of (a) NVCW and VCW (b) monthly energy saving of VCW at the representative locations.
As shown in Figure 11b, east and west façades achieved relatively stable monthly savings of ~1.1–1.2 kWh/m2 across regions, whereas south-wall savings increased from June to August, reflecting the seasonal shift in the solar path. South-wall savings also increased with latitude, consistent with a larger ΔTe–a under cooler ambient conditions.
These trends mirror the ΔTe–a patterns in Figure 9: larger temperature differentials produce greater cooling load reductions.
The energy-saving rate (Figure 12) further confirms these differences. Across regions, east and west façades consistently achieved 30–40% , while south façades achieved roughly 10–20%. Lincoln showed the highest ESR%, driven by favorable solar geometry and cooler ambient conditions. In hot–dry climates such as Las Vegas and Tucson, high ambient temperatures reduced ΔTe–a, limiting despite strong solar gains.
Figure 12.
in the different locations in summer.
The measured aligns with documented reductions in Mediterranean ventilated façades (20–50%) [7], confirming that VCWs can achieve comparable performance with far simpler construction requirements. Unlike double-skin or opaque ventilated façades, VCWs can be integrated into conventional cavity walls with minimal structural modification, offering a cost-efficient retrofit strategy.
Table 6 summarizes the average for each region, highlighting the consistently higher performance of east and west façades relative to south façades across all climates.
Table 6.
Summary of monthly average (June, July, and August) energy-saving rates () by wall orientation and region.
To enable cross-location comparison under differing solar exposures, energy savings were normalized by incident irradiance (Table 7). The resulting normalized efficiencies (ηₙₒᵣₘ) provide a climate-independent measure of VCW performance and indicate a modest reduction at lower latitudes, reflecting diminishing incremental benefit as façade temperatures approach thermal equilibrium in extreme hot climates.
Table 7.
Normalized Energy-Saving Efficiency (ηₙₒᵣₘ) by Orientation and Location (June–August Average).
These findings suggest that, in mid-latitude regions, east and west façades tend to exhibit a more favorable balance between solar exposure and ventilation potential. South façades may require additional measures (e.g., reflective coatings, shading, and selective vent control) to achieve comparable performance. Collectively, these results quantify VCW cooling load reduction across representative U.S. climate zones, directly addressing the study’s objective of evaluating regional VCW performance (RO1).
4.2.4. Interpretation of Regional Variations
Regional differences in VCW performance are primarily governed by the balance between solar irradiance and ambient air temperature, which together determine the wall–air temperature differential (ΔTe–a) driving buoyancy-induced ventilation.
In hot–dry climates such as Las Vegas and Tucson, intense solar gains and clear-sky conditions elevate wall temperatures, but high ambient air temperatures reduce the wall–air temperature differential (ΔTe–a) that drives buoyancy-induced airflow. As a result, VCW cooling efficiency is lower than expected despite strong solar exposure.
In cooler climates such as Lincoln, larger diurnal temperature swings produce higher ΔTe–a values, enabling stronger natural convection and yielding higher even under lower solar intensities. These conditions favor more effective passive heat removal.
In hot–humid regions like Austin, VCW performance remained moderate. Although humidity was not explicitly modeled, elevated atmospheric moisture can reduce buoyancy forces and partially inhibit convection, consistent with documented observations [2].
Orientation further modulates these climatic effects, with east and west façades benefiting from concentrated morning and afternoon solar exposure that generates stronger transient ΔTe–a than the more diffuse midday irradiation received by south façades. Together, these results link the observed regional and orientation-dependent performance trends to the underlying physical drivers governing VCW behavior, including solar geometry, ambient temperature, and the resulting wall–air temperature differential (ΔTe–a) (RO2).
4.3. Peak-Load and Performance Assessment
4.3.1. The Impact of the Building Orientation on Its Peak Load Shaving
The orientation of a building, which determines the proportion of east, south, and west façades, significantly influences peak-load reduction. As explained in the methodology, the south/north-dominated and east/west-dominated cases represent bounding scenarios (ratios of 100:1 and 1:100), while the equal-orientation case reflects a balanced façade distribution.
Weighted energy-saving intensities for these scenarios (Appendix C Figure A4) show a clear hierarchy:
- East/west-dominated buildings consistently achieve the greatest peak-time energy savings;
- Followed by equal-orientation buildings;
- And finally, south/north-dominated buildings.
Minor deviations were observed only in brief afternoon periods in Lincoln, where strong south-wall summer performance temporarily elevated the south/north-dominated case.
Across regions, east/west-dominated and equal-orientation buildings maintained savings above their daily averages during 3–7 PM, the critical peak period. South/north-dominated buildings displayed more location-dependent performance, with Lincoln outperforming the hotter climates. This pattern aligns with the ΔTe–a dependence described earlier.
4.3.2. Summary of Monthly Peak Time Energy Consumption of NVCW, VCW, and Energy Savings by Regions
Appendix C Figure A5 summarizes the monthly peak-time energy use for NVCW and VCW systems. For NVCWs, west façades exhibited the highest peak cooling loads, reflecting prolonged afternoon solar exposure. VCWs reduced peak loads across all orientations and narrowed the disparity between the west and other façades.
Peak-time cooling-energy savings (Appendix C Figure A5b) show the following:
- West façades achieved the largest monthly savings (0.47–0.54 kWh/m2);
- East façades followed (0.12–0.18 kWh/m2);
- South façades showed the greatest variability, performing best in Lincoln and least in Tucson and Austin during June–July.
Figure 13 summarizes for each orientation. West walls achieved the highest (36–53%), followed by east walls (17–39%), while south walls exhibited a wide range (3–49%).
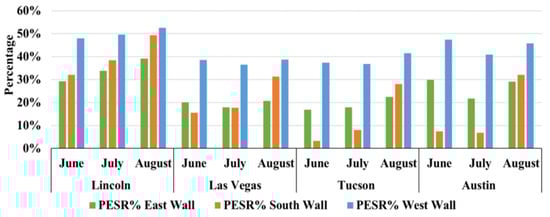
Figure 13.
The monthly of different wall orientations in Lincoln, Las Vegas, Tucson, and Austin in summer.
The south façade showed low early-summer performance in hot climates but consistent improvement from June to August across all locations. Lincoln again led all three orientations due to cooler ambient air and larger ΔTe–a.
Similarly, Figure 14 shows for entire buildings under the three façade distribution scenarios. Across the following climates:
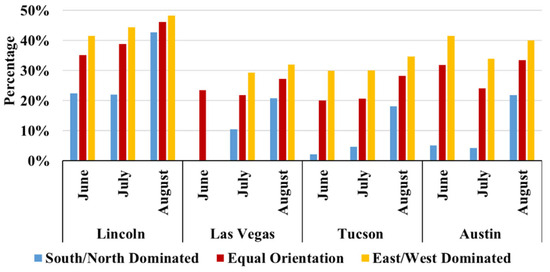
Figure 14.
The monthly of buildings with different orientations in Lincoln, Las Vegas, Tucson, and Austin in summer.
- East/west-dominated buildings achieved the highest (29–48%);
- Equal-orientation buildings followed (24–49%);
- South/north-dominated buildings achieved the lowest values (4–49%).
This ranking mirrors the orientation level trends and reinforces the strong influence of solar geometry. Lincoln consistently delivered the highest across all scenarios, and all locations exhibited increasing from June to August, especially for south/north-dominated buildings.
The ratio of peak to off-peak hourly savings (Appendix C Figure A6) exceeded 1.5 in most cases, confirming that VCWs provide disproportionately greater cooling benefits during utility peak-demand hours. Exceptions occurred only for the south/north-dominated cases in June (Tucson) and July (Austin), where high ambient temperatures suppressed ΔTe–a.
These peak-period results highlight VCWs’ intrinsic peak-shaving capability, addressing their relevance for cross-regional comparison and demand responsive performance evaluation (RO3).
4.4. Sustainability and Life-Cycle Implications
Lower exterior wall temperatures achieved by VCWs can reduce mean radiant temperature (MRT) near the façade by 1–3 °C, improving perimeter-zone comfort without additional cooling load [60,61,62]. By limiting façade heat gain, VCWs also reduce cooling loads, supporting more efficient operation of mechanical systems and improved envelope performance [63].
From a sustainability perspective, VCWs provide meaningful operational energy savings with minimal embodied-carbon impact, as retrofits require little new material and preserve existing wall assemblies [64,65,66]. Based on simulated results, normalized energy savings of 1.2–1.5% per month on east and west façades correspond to approximately 0.4–1.4 kg CO2/m2 avoided during summer operation, or roughly 500–600 kg CO2 per season for a representative 500 m2 façade under the U.S. average grid emissions factor [67].
VCWs further offer economic and grid-level benefits under Time-of-Use pricing structures, where modest peak-period energy reductions translate into measurable cost savings and reduced demand during critical hours [35,68]. These attributes align with emerging energy-code requirements and demand-response strategies, suggesting that VCWs could serve as a practical compliance or incentive pathway within ASHRAE, IECC, or utility DSM programs [10,69].
Beyond performance metrics, VCWs integrate readily with conventional masonry, rainscreen, or architectural façade systems, enabling scalable adoption without structural modification. Collectively, these characteristics position VCWs as a low-carbon, low-disruption retrofit strategy that enhances comfort, reduces peak demand, and supports sustainability and resilience objectives—particularly in façade-driven cooling climates.
5. Conclusions and Future Directions
5.1. Summary of Findings
This study presented and validated a simulation-based framework for evaluating the thermal and energy-saving performance of ventilated cavity walls (VCWs) across four representative U.S. cities with distinct climatic conditions. A transient 3D solar heating model built in Autodesk CFD was used to simulate façade surface temperatures under regional summer conditions, and the outputs were coupled with a validated regression-based model to estimate cooling load reductions.
Across climates, VCWs reduced cooling loads by approximately 30–40% on east and west façades and 10–20% on south façades, with monthly savings exceeding 1.0 kWh/m2 in all cities. Peak-period savings were, on average, 1.5× higher than off-peak savings, demonstrating strong intrinsic peak-shaving capability.
These results collectively show that VCWs provide a scalable, low-cost, and climate-robust façade retrofit strategy capable of enhancing envelope performance in diverse U.S. conditions.
5.2. Engineering Validation
The validated solar heating/CFD framework reproduced measured wall temperatures with high accuracy (RMSE ≈ 1 °C; R2 > 0.94). Integrating these simulations with regression-based cooling load estimation enabled consistent prediction across climate zones.
Beyond average load reduction, peak-load analysis confirmed that VCWs preferentially reduce cooling demand during 3–7 PM, aligning with utility stress periods and Time-of-Use (TOU) pricing. This establishes VCWs not only as passive cooling devices but also as effective peak-shaving technologies.
Normalization by incident solar irradiance further provided a climate-independent metric for cross-regional benchmarking, supporting architectural and engineering design decisions.
5.3. Practical Implementation Guidelines
Based on the results, several practical recommendations for VCW retrofits can be made:
- Climatic and Orientation Suitability. VCWs performed effectively across all tested climate types. East and west façades consistently delivered the largest reductions (≈30–40%), whereas south façades showed moderate but meaningful reductions. In hot-humid climates, smaller temperature gradients reduced buoyancy-driven ventilation, but valuable peak-period savings remained.
- Architectural Integration and Relevance of Design. VCWs can be added to both new and existing masonry structures with minimal material use, making them compatible with rainscreens, perforated façades, and terracotta systems. Their low visual impact supports modern architectural objectives for combined thermal and esthetic performance.
- Energy and Policy Implications. VCWs’ peak-load reduction potential supports their application in demand-side management, alongside measures such as cool roofs and high-performance glazing. Given increasing emphasis on envelope-level efficiency in codes such as ASHRAE 90.1 and IECC, VCWs represent a viable compliance pathway.
These insights provide a practical foundation for applying VCWs in climate-specific retrofits.
5.4. Limitations and Future Research
Several simplifying assumptions were made to ensure computational tractability. The model assumed dry air, steady ambient conditions, and parameterized wind effects using convective film coefficients, rather than fully resolving wind-driven flow. Future work should integrate coupled wind–buoyancy simulations or wind tunnel experiments to represent the combined effects of natural and forced convection more accurately.
Material configurations were limited to a standard brick–cavity–insulation assembly. Exploring alternative façade materials and construction systems may broaden applicability across architectural typologies. Expanded regional analysis, including humid-subtropical and marine climates, is also warranted.
While this study focused on summer performance, seasonal operation strategies—such as closing vents during winter—require further investigation, as do smart or adaptive venting controls based on IoT systems. Dynamic, sensor-based VCW systems may enable real-time optimization and improved demand-response integration.
Future research should also quantify indoor environmental impacts (e.g., MRT, PMV/PPD) and integrate VCWs into whole-building simulation platforms such as EnergyPlus [70] to evaluate both comfort and annual energy performance.
Overall, advancing dynamic, comfort integrated, and smart control VCW models will accelerate their adoption as a sustainable façade strategy in emerging energy-efficient and climate-resilient building design.
Author Contributions
Conceptualization, R.N.; methodology, R.N.; software, R.N.; validation, R.N., A.B. and B.A.; formal analysis, R.N.; investigation, R.N.; resources, A.B. and B.A; data curation, R.N.; writing—original draft preparation, R.N.; writing—review and editing, A.B. and B.A; visualization, R.N.; supervision, R.N.; project administration, R.N. All authors have read and agreed to the published version of the manuscript.
Funding
This research received no external funding.
Institutional Review Board Statement
Not applicable.
Informed Consent Statement
Not applicable.
Data Availability Statement
The data presented in this study are contained within the article. Additional data supporting the findings of this study are available from the corresponding author upon reasonable request.
Conflicts of Interest
The authors declare no conflict of interest.
Appendix A. Governing Equations for the Solar Heating Model
The transient exterior wall surface temperatures were computed using Autodesk CFD by solving the energy equation with coupled solar-radiation, convection, and surface-to-surface radiation boundary conditions.
Appendix A.1. Transient Energy Equation
- = the density;
- = the specific heat;
- = the thermal conductivity, T is temperature;
- = the absorbed solar flux;
- = convective exchange with ambient air;
- = surface-to-surface radiation, respectively.
Appendix A.2. Solar Heat Flux
- α = surface absorptivity;
- I = incident solar irradiance;
- θ = solar incidence angle.
Appendix A.3. Surface-to-Surface Radiation
- ε = emissivity;
- σ = Stefan–Boltzmann constant;
- Ts = exterior wall surface temperature at the computational boundary;
- Tsur = temperature of surrounding radiative surfaces participating in surface-to-surface heat exchange.
Appendix A.4. Convective Heat Exchange
- Tair = ambient air temperature used in defining convective heat exchange at the exterior wall boundary.
Appendix B. Supplementary Tables
Table A1.
Estimated façade irradiance conversion factors (vertical façade/horizontal plane) for summer months (June–August) [59]. An average number was used for calculating.
Table A1.
Estimated façade irradiance conversion factors (vertical façade/horizontal plane) for summer months (June–August) [59]. An average number was used for calculating.
| City | East | South | West |
|---|---|---|---|
| Lincoln, NE | 0.38–0.45 | 0.55–0.65 | 0.36–0.44 |
| Las Vegas, NV | 0.42–0.48 | 0.65–0.72 | 0.40–0.47 |
| Tucson, AZ | 0.43–0.50 | 0.68–0.75 | 0.42–0.49 |
| Austin, TX | 0.45–0.52 | 0.70–0.78 | 0.44–0.50 |
Table A2.
Average monthly global horizontal irradiance and façade solar irradiance (kWh/m2·per month) for summer months (June–August).
Table A2.
Average monthly global horizontal irradiance and façade solar irradiance (kWh/m2·per month) for summer months (June–August).
| City | East | South | West | |
|---|---|---|---|---|
| Lincoln, NE | 196.15 | 81.40 | 117.69 | 78.46 |
| Las Vegas, NV | 243.35 | 88.27 | 134.36 | 85.32 |
| Tucson, AZ | 222.44 | 91.21 | 140.25 | 89.25 |
| Austin, TX | 207.89 | 95.13 | 145.15 | 92.19 |
Appendix C. Supplementary Figures

Figure A1.
Peak wall -surface temperatures for summer (June, July, August) in four U.S. cities.

Figure A2.
Monthly distribution of wall surface temperature durations (June–August 2016) for east, south, and west orientations across four U.S. cities. Each stacked bar represents the cumulative number of hours within 10 °C intervals.

Figure A3.
Diurnal energy load PNVCW and PVCW for typical summer days in four U.S. cities: (a) Lincoln, 12 July 2016, (b) Las Vegas, 4 July 2016, (c) Tucson, 6 July 2016, and (d) Austin, 7 July 2016. Each plot compares the VCW vs. NVCW’s cooling load for east-, south-, and west-facing façades.

Figure A4.
Diurnal energy saving PS for typical summer days in four U.S. cities: (a) Lincoln, 12 July 2016, (b) Las Vegas, 4 July 2016, (c) Tucson, 6 July 2016, and (d) Austin, 7 July 2016. Each plot compares the VCW vs. NVCW’s saving potential for east-, south-, and west-facing façades Diurnal energy saving.

Figure A5.
Diurnal Monthly peak time (3 PM to 7 PM) (a) energy consumption, and (b) energy saving in Lincoln, Las Vegas, Tucson, Austin in summer.

Figure A6.
The Ratio of On-peak to Off-peak time hourly average energy saving for the buildings with different orientations.
References
- U.S. Energy Information Administration. Annual Energy Outlook 2025 (AEO2025); EIA: Washington, DC, USA, 2025. Available online: https://www.eia.gov/outlooks/aeo/ (accessed on 27 October 2025).
- Na, R.; Shen, Z. Assessing Cooling Energy Reduction Potentials by Retrofitting Traditional Cavity Walls into Passively Ventilated Cavity Walls. Build. Simul. 2021, 14, 1295–1309. [Google Scholar] [CrossRef]
- Ciampi, M.; Leccese, F.; Tuoni, G. Ventilated Façades Energy Performance in Summer Cooling of Buildings. Sol. Energy 2003, 75, 491–502. [Google Scholar] [CrossRef]
- Cuce, P.M.; Cuce, E. Ventilated Facades for Low-Carbon Buildings: A Review. Processes 2025, 13, 2275. [Google Scholar] [CrossRef]
- Abou Ibrahim, R.; Belouaggadia, N.; Zalewski, L. Application of Ventilated Solar Façades to Enhance the Energy Efficiency of Buildings: A Comprehensive Review. Energy Rep. 2025, 13, 1266–1292. [Google Scholar] [CrossRef]
- Lin, Z.; Song, Y.; Chu, Y. Summer performance of a naturally ventilated double-skin facade with adjustable glazed louvers for building energy retrofitting. Energy Build. 2022, 267, 112163. [Google Scholar] [CrossRef]
- Fantucci, S.; Serra, V.; Carbonaro, C. An experimental sensitivity analysis on the summer thermal performance of an Opaque Ventilated Façade. Energy Build. 2020, 225, 110354. [Google Scholar] [CrossRef]
- Mehta, M.; Scarborough, W.; Armpriest, D. Building Construction: Principles, Materials, and Systems; Pearson Education: Upper Saddle River, NJ, USA, 2008. [Google Scholar]
- ASHRAE. ANSI/ASHRAE/IES Standard 90.1-2022; Energy Standard for Buildings Except Low-Rise Residential Buildings. American Society of Heating, Refrigerating and Air-Conditioning Engineers: Atlanta, GA, USA, 2022.
- International Code Council (ICC). 2021 International Energy Conservation Code (IECC); International Code Council: Washington, DC, USA, 2021. [Google Scholar]
- Hens, H.; Janssens, A.; Depraetere, W.; Carmeliet, J.; Lecompte, J. Brick Cavity Walls: A Performance Analysis Based on Measurements and Simulations. J. Build. Phys. 2007, 31, 95–124. [Google Scholar] [CrossRef]
- Rodrigues, A.M.; Aelenei, L. Thermal Performance of a Naturally Self-Ventilated Cavity Wall. Int. J. Energy Res. 2010, 34, 357–372. [Google Scholar] [CrossRef]
- Conway, P. Ventilated Masonry Cavity Walls. In RCI Building Envelope Technology Symposium; RCI, Inc.: Houston, TX, USA, 2016. [Google Scholar]
- The Masonry Society (TMS). TMS 402/602-16; Building Code Requirements and Specifications for Masonry Structures. The Masonry Society: Longmont, CO, USA, 2016.
- Zalewski, L.; Lassue, S.; Duthoit, B.; Butez, M. Study of Solar Walls—Validating a Simulation Model. Build. Environ. 2002, 37, 109–121. [Google Scholar] [CrossRef]
- Bouchair, A. Solar Chimney for Promoting Cooling Ventilation in Southern Algeria. Build. Serv. Eng. Res. Technol. 1994, 15, 81–93. [Google Scholar] [CrossRef]
- Bansal, N.; Mathur, R.; Bhandari, M. Solar Chimney for Enhanced Stack Ventilation. Build. Environ. 1993, 28, 373–377. [Google Scholar] [CrossRef]
- Faggembauu, D.; Costa, M.; Soria, M.; Oliva, A. Numerical Analysis of the Thermal Behaviour of Glazed Ventilated Facades in Mediterranean Climates—Part II: Applications and Analysis of Results. Sol. Energy 2003, 75, 229–239. [Google Scholar] [CrossRef]
- Gratia, E.; De Herde, A. The Most Efficient Position of Shading Devices in a Double-Skin Façade. Energy Build. 2007, 39, 364–373. [Google Scholar] [CrossRef]
- Saelens, D.; Roels, S.; Hens, H. Strategies to Improve the Energy Performance of Multiple-Skin Façades. Build. Environ. 2008, 43, 638–650. [Google Scholar] [CrossRef]
- Sanjuan, C.; Suárez, M.J.; González, M.; Pistono, J.; Blanco, E. Energy Performance of an Open-Joint Ventilated Façade Compared with a Conventional Sealed Cavity Façade. Sol. Energy 2011, 85, 1851–1863. [Google Scholar] [CrossRef]
- Iribar-Solaberrieta, E.; Escudero-Revilla, C.; Odriozola-Maritorena, M.; Campos-Celador, A.; García-Gáfaro, C. Energy Performance of the Opaque Ventilated Façade. Energy Procedia 2015, 78, 55–60. [Google Scholar] [CrossRef]
- Stazi, F.; Tomassoni, F.; Vegliò, A.; Di Perna, C. Experimental Evaluation of Ventilated Walls with an External Clay Cladding. Renew. Energy 2011, 36, 3373–3385. [Google Scholar] [CrossRef]
- Wang, S.; Shen, Z. Effects of Roof Pitch on Air Flow and Heating Load of Sealed and Vented Attics for Gable-Roof Residential Buildings. Sustainability 2012, 4, 1999–2021. [Google Scholar] [CrossRef]
- Wang, S.; Shen, Z. Impacts of Ventilation Ratio and Vent Balance on Cooling Load and Air Flow of Naturally Ventilated Attics. Energies 2012, 5, 3218–3232. [Google Scholar] [CrossRef]
- Wang, S.; Shen, Z.; Gu, L. Numerical Simulation of Buoyancy-Driven Turbulent Ventilation in Attic Space under Winter Conditions. Energy Build. 2012, 47, 360–368. [Google Scholar] [CrossRef]
- Buratti, C.; Palladino, D.; Moretti, E.; Di Palma, R. Development and optimization of a new ventilated brick wall: CFD analysis and experimental validation. Energy Build. 2018, 168, 284–297. [Google Scholar] [CrossRef]
- Gan, G. Simulation of Buoyancy-Induced Flow in Open Cavities for Natural Ventilation. Energy Build. 2006, 38, 410–420. [Google Scholar] [CrossRef]
- Melgaard, S.P.; Nikolaisson, I.T.; Zhang, C.; Johra, H.; Larsen, O.K. Double-skin façade simulation with computational fluid dynamics: A review of simulation trends, validation methods and research gaps. Build. Simul. 2023, 16, 2307–2331. [Google Scholar] [CrossRef]
- Pastori, S.; Salehi, M.-S.; Radl, S.; Mazzucchelli, E.S. A Fast-Calibrated Computational Fluid Dynamic Model for Timber–Concrete Composite Ventilated Façades. Buildings 2024, 14, 3567. [Google Scholar] [CrossRef]
- Usry, C. Cut Costs, Reduce Carbon, and Improve Health with Demand Flexibility; Rocky Mountain Institute (RMI). 2020. Available online: https://rmi.org/cut-costs-reduce-carbon-and-improve-health-with-demand-flexibility/ (accessed on 29 October 2025).
- U.S. Energy Information Administration (EIA). Demand-Side Management Programs Save Energy and Reduce Peak Demand; U.S. Energy Information Administration (EIA). 2019. Available online: https://www.eia.gov/todayinenergy/detail.php?id=38872 (accessed on 29 October 2025).
- U.S. Energy Information Administration (EIA). Wholesale Electricity Prices Spike in Texas; U.S. Energy Information Administration (EIA). 2012. Available online: https://www.eia.gov/todayinenergy/detail.php?id=6070 (accessed on 29 October 2025).
- Sun, Y.; Wang, S.; Xiao, F.; Gao, D. Peak Load Shifting Control Using Different Cold Thermal Energy Storage Facilities in Commercial Buildings: A Review. Energy Convers. Manag. 2013, 71, 101–114. [Google Scholar] [CrossRef]
- Dewangan, C.L.; Singh, S.N.; Chakrabarti, S.; Singh, K. Peak-to-average ratio incentive scheme to tackle the peak-rebound challenge in TOU pricing. Electr. Power Syst. Res. 2022, 210, 108048. [Google Scholar] [CrossRef]
- Fan, Z.; Zhao, Y.; Shi, Y.; Liu, X.; Jiang, D. Thermal performance evaluation of a novel building wall for lightweight building containing phase change materials and interlayer ventilation: An experimental study. Energy Build. 2023, 278, 112677. [Google Scholar] [CrossRef]
- Jarvinen, J.; Goldsworthy, M.; Pudney, P.; White, S.; Cirocco, L.; Bruno, F. Aggressive pre-cooling of an office building to reduce peak power during extreme heat days through passive thermal storage. Sustain. Energy Grids Netw. 2024, 38, 101313. [Google Scholar] [CrossRef]
- Integrated Energy Management and Conservation (IEMC). Energy Efficiency Lighting. Available online: https://iemc-lighting.weebly.com/energy-efficiency-lighting.html (accessed on 29 October 2025).
- Stopps, H.; Touchie, M.F. Load shifting and energy conservation using smart thermostats in contemporary high-rise residential buildings: Estimation of runtime changes using field data. Energy Build. 2022, 255, 111644. [Google Scholar] [CrossRef]
- Shi, Y.; Xu, B.; Wang, D.; Zhang, B. Using battery storage for peak shaving and frequency regulation: Joint optimization for superlinear gains. IEEE Trans. Power Syst. 2017, 33, 2882–2894. [Google Scholar] [CrossRef]
- Avordeh, T.K.; Gyamfi, S.; Opoku, A.A. The role of demand response in residential electricity load reduction using appliance shifting techniques. Int. J. Energy Sect. Manag. 2022, 16, 605–635. [Google Scholar] [CrossRef]
- Bamdad, K. Cool roofs: A climate change mitigation and adaptation strategy for residential buildings. Build. Environ. 2023, 236, 110271. [Google Scholar] [CrossRef]
- Li, X.; Wu, Y. A review of complex window-glazing systems for building energy saving and daylight comfort: Glazing technologies and their building performance prediction. J. Build. Phys. 2025, 48, 496–540. [Google Scholar] [CrossRef]
- Fantucci, S.; Marinosci, C.; Serra, V.; Carbonaro, C. Thermal Performance Assessment of an Opaque Ventilated Façade in the Summer Period: Calibration of a Simulation Model through In-Field Measurements. Energy Procedia 2017, 111, 619–628. [Google Scholar] [CrossRef]
- Lin, Y.H.; Tsai, K.T.; Lin, M.D.; Yang, M.D. Design Optimization of Office Building Envelope Configurations. Appl. Energy 2016, 171, 336–346. [Google Scholar] [CrossRef]
- Autodesk. Autodesk CFD 2024 [Computer Software]; Autodesk Inc.: Mill Valley, CA, USA, 2024. [Google Scholar]
- Colorado Energy. R-Value Table; R. L. Martin & Associates, Inc.: Denver, CO, USA, 2016. Available online: http://www.coloradoenergy.org/procorner/stuff/r-values.htm (accessed on 27 October 2025).
- National Oceanic and Atmospheric Administration (NOAA). Quality Controlled Datasets; National Climatic Data Center: Asheville, NC, USA, 2016. Available online: https://www.ncdc.noaa.gov/crn/qcdatasets.html (accessed on 27 October 2025).
- FLIR Systems Inc. A8300sc User’s Manual; FLIR Systems Inc.: Wilsonville, OR, USA, 2015. [Google Scholar]
- Gueymard, C.A.; Sett, P.; Neldner, J. Evaluation of Clear-Sky Incoming Radiation Estimating Equations Typically Used in Remote Sensing Evapotranspiration Algorithms. Remote Sens. 2013, 5, 4735–4773. [Google Scholar] [CrossRef]
- Al-Waeli, A.H.A.; Othman, M.Y.; Hawlader, M.N.A.; Al-Waeli, H.H.; Majeed, H.M. Solar Photovoltaic Energy as a Promising Enhanced Share of Clean Energy Sources in the Future—A Comprehensive Review. Energies 2023, 16, 7919. [Google Scholar] [CrossRef]
- García-Ballesteros, J.J.; García, F.L.; Cuerda, E.; Zanon, V.J.; Sánchez-Ramos, J. Experimental Validation of a Numerical Model of a Ventilated Façade with Horizontal and Vertical Open Joints. Energies 2020, 13, 146. [Google Scholar] [CrossRef]
- He, B.; Tian, B.; Zheng, H. Numerical Simulation Analysis and Full-Scale Experimental Validation of a Lower Wall-Mounted Solar Chimney with Different Radiation Models. Sustainability 2023, 15, 11974. [Google Scholar] [CrossRef]
- ASHRAE Standard 169-2013; Climatic Data for Building Design Standards. American Society of Heating, Refrigerating and Air-Conditioning Engineers: Atlanta, GA, USA, 2013.
- Zhu, L.; Hurt, R.; Correia, D.; Boehm, R. Detailed Energy Saving Performance Analyses on Thermal Mass Walls Demonstrated in a Zero Energy House. Energy Build. 2009, 41, 303–310. [Google Scholar] [CrossRef]
- Na, R.; Shang, Z.; Shen, Z. Time-Lapse of Cavity Brick Wall Temperature Profiles Using Infrared Thermography. In Associated Schools of Construction Annual International Conference Proceedings; Associated Schools of Construction: Salt Lake City, UT, USA, 2016. [Google Scholar]
- MATLAB R2024a [Computer Software]; The MathWorks Inc.: Natick, MA, USA, 2024.
- National Renewable Energy Laboratory (NREL). National Solar Radiation Database (NSRDB): 1998–2023 Data via NSRDB Data Viewer; U.S. Department of Energy: Golden, CO, USA, 2024. Available online: https://nsrdb.nrel.gov/ (accessed on 26 October 2025).
- Duffie, J.A.; Beckman, W.A. Solar Engineering of Thermal Processes, 4th ed.; Wiley: Hoboken, NJ, USA, 2013. [Google Scholar] [CrossRef]
- ASHRAE Standard 55-2020; Thermal Environmental Conditions for Human Occupancy. American Society of Heating, Refrigerating and Air-Conditioning Engineers: Atlanta, GA, USA, 2020.
- Fanger, P.O. Thermal Comfort: Analysis and Applications in Environmental Engineering; McGraw-Hill: New York, NY, USA, 1970. [Google Scholar]
- Zhou, X.; Liu, Y.; Zhang, J.; Ye, L.; Luo, M. Radiant Asymmetric Thermal Comfort Evaluation for Floor Cooling System—A Field Study in Office Building. Energy Build. 2022, 260, 111917. [Google Scholar] [CrossRef]
- Crawley, D.B.; Lawrie, L.K.; Winkelmann, F.C.; Pedersen, C.O. EnergyPlus: Creating a New-Generation Building Energy Simulation Program. Energy Build. 2001, 33, 353–361. [Google Scholar] [CrossRef]
- Pomponi, F.; Moncaster, A.M. Embodied Carbon Mitigation and Reduction in the Built Environment—What Does the Evidence Say? J. Build. Eng. 2017, 14, 337–349. [Google Scholar] [CrossRef] [PubMed]
- Dixit, M.K. Life Cycle Embodied Energy Analysis of Residential Buildings: A Review. Renew. Sustain. Energy Rev. 2019, 119, 109506. [Google Scholar] [CrossRef]
- Finamore, M.; Oltean-Dumbrava, C. Circular Economy in Construction—Findings from a Literature Review. Heliyon 2024, 10, e34647. [Google Scholar] [CrossRef]
- EPA. eGRID2022: Emissions & Generation Resource Integrated Database; U.S. Environmental Protection Agency: Washington, DC, USA, 2024. Available online: https://www.epa.gov/egrid (accessed on 27 October 2025).
- EIA. Electric Power Monthly; U.S. Energy Information Administration: Washington, DC, USA. Available online: https://www.eia.gov/electricity/monthly/ (accessed on 30 October 2025).
- U.S. Department of Energy (DOE). Design Products and Services for Energy-Efficient Homes. Energy Saver. Available online: https://www.energy.gov/energysaver/design-products-and-services-energy-efficient-homes (accessed on 29 October 2025).
- U.S. Department of Energy. EnergyPlus™ Energy Simulation Software; U.S. Department of Energy: Washington, DC, USA, 2025. Available online: https://energyplus.net/ (accessed on 2 November 2025).
Disclaimer/Publisher’s Note: The statements, opinions and data contained in all publications are solely those of the individual author(s) and contributor(s) and not of MDPI and/or the editor(s). MDPI and/or the editor(s) disclaim responsibility for any injury to people or property resulting from any ideas, methods, instructions or products referred to in the content. |
© 2025 by the authors. Licensee MDPI, Basel, Switzerland. This article is an open access article distributed under the terms and conditions of the Creative Commons Attribution (CC BY) license.