Abstract
This study investigated how metal concentrations and microplastic abundance co-vary temporally and spatially in sediments in Durban Harbour, South Africa. The effects of sediment contamination on the amphipod Grandidierella lignorum was additionally investigated. Sediments from five sites in the harbour, namely Little Lagoon (LL), Yacht Bank (YB), Marina Bank (MB), Western Bank (WB), and Central Bank (CB), were analysed for metals using ICP-OES, and microplastic particles were counted. Sediment metal concentrations varied across sites and seasons, with Al and Fe dominating. Elevated levels of Cu, Zn, and Pb were observed, particularly in areas with high industrial activity, suggesting point-source contamination. Trace concentrations of As, Cd, and Ni were found and these metals were excluded from further analysis. Abundance ranged from 0.2 to 2.5 particles per gram dry weight, and differed significantly among sites (p < 0.01) with the highest concentrations in LL and YB. Amphipod survival rates following exposure to sediment did not significantly differ among sites but correlated moderately with microplastic abundance (p > 0.05, R2 = 0.57). Tissue analysis revealed selective metal accumulation, following the trend Al > Fe > Zn > Cu > Cr, with Mn, As, and Pb undetected. These results highlight the spatial heterogeneity of sediment contamination in Durban Harbour and demonstrate the bioaccumulation potential and ability to regulate metals in G. lignorum, particularly for essential metals like Fe and Zn. Despite no clear evidence linking microplastics to metal concentrations, the findings highlight the complex interactions between contaminants and their potential ecological impact.
1. Introduction
Estuarine ecosystems serve as critical nurseries for marine biodiversity and provide essential linkages between terrestrial and marine habitats []. In South Africa, >80 fish species including commercially important taxa like Rhabdosargus holubi rely on estuaries during key life stages [,]. These ecosystems are also hubs for human activity, receiving contaminants from urban runoff, industrial effluent, and maritime operations [,]. Of increasing concern is the co-occurrence of microplastics and metals in estuaries, where hydrodynamic processes concentrate both pollutants in sediments []. Microplastics may act as vectors for metals (e.g., through surface adsorption or additive leaching), potentially causing synergistic effects in benthic organisms including amphipods, skey prey for estuary-dependent species []. This synergy is critical in harbours where both pollutants co-occur at high concentrations []. Given their ecological and economic importance, contamination of estuarine environments, including with heavy metals, should be well investigated as knowledge of the partitioning and distribution of metals in estuarine sediments provides insight into their impact on the ecosystem. In most developing countries, however, toxicity levels are still not frequently reported, and relevant information on estuarine ecosystems and harbours is limited [,].
Microplastics have emerged as important marine pollutants [] and have received increasing scientific attention in recent years [,]. Microplastic pollution has been recorded in almost all marine habitats, including in estuaries [,,,]. In recent years, South African research on microplastic pollution has been increasingly reported. Ref. [] first drew attention to the abundance of microplastics along the South African coastline. Ref. [] reported that Durbanharbour contains the highest microplastic concentrations of five urban estuaries, with a rapid decline with increasing distance from the city centre. A large proportion of flathead mullet (Mugil cephalus) from the harbour contained plastic particles in their guts []. Ref. [] also found microplastics to be abundant in Richards Bay and Durban Harbour, which are two of the busiest harbours in Sub-Saharan Africa. Ref. [] also reported that microplastics are abundant close to heavily industrialised city centres. However, microplastic abundance along the east coast of South Africa did not differ among numerous locations, suggesting that water circulation rather than land use determined its distribution [].
Harbour environments are typically exposed to high levels of contamination as they are often affected by intensive industrial development []. Shipping often leads to spillage and thus accumulation of contaminants such as heavy metals in sediments, more so during loading and offloading of material [], which may negatively affect the fauna naturally occurring in the harbour. Heavy metal contamination in estuarine systems and their impact on biota are widely reported in the literature [,]. In recent years, microplastics have also been of concern as they have been associated with spillage in harbours during transportation []. While chemical concentrations and microplastics have been documented separately over the years [,], they occur simultaneously in the environment. It is therefore, important to understand their interaction and combined toxicity and potential synergistic impact. As laboratory exposures are important, in situ studies are especially informative as they reflect relevant background concentrations, particularly with regards to ecological risks [].
This study highlights microplastics as a potential vector for toxic metals in the marine environment, posing a significant threat to the proper functioning of marine ecosystems and underscoring the urgent need for continuous monitoring, control, and abatement of plastic waste in marine environments. Our study tests whether microplastic–metal complexes (1) increase metal bioavailability to G. lignorum or (2) alter distribution patterns due to differential settling. This interaction remains poorly quantified in industrialised estuaries, despite its implications for trophic transfer and ecosystem health. Given their ecological and economic importance, contamination of estuarine environments, including with heavy metals, should be well investigated as knowledge of the partitioning and distribution of metals in estuarine sediments provides insight into their impact on the ecosystem.
This paper aims to determine the association of metal accumulation with the quantity of microplastics in Durban Harbour sediments, the accumulation of heavy metals in the tissue of the amphipod Grandidierella lignorum in the harbour sediment, and the effects on amphipod survival of such accumulation. Recent work by [] demonstrated significant metal accumulation (Cu, Pb, Zn) on beach-collected plastics in South African coastal waters, confirming plastics as vectors for metal transport. Our study builds on these findings by examining these interactions in industrialized harbour sediments where pollution pressures are more concentrated.
We hypothesise that the presence of microplastics increases metal concentration in Durban Harbour sediment and that spatial and temporal variation of metal concentration in Durban Harbour is associated with local activities.
The objectives are as follows:
- (1)
- To determine the spatial variation and association of metal and microplastic accumulation in Durban Harbour;
- (2)
- To determine the temporal differences in metal accumulation in sediments and G. lignorum in Durban Harbour;
- (3)
- To determine the survival and metal tissue concentration of G. lignorum in sediment from different parts of the harbour in relation to land use in Durban Harbour.
Site description:
The city of eThekwini, also known as Durban, is the second most populous city in South Africa, with a population of 3.7 million people in 2017 []. Durban Bay is situated in KwaZulu-Natal on the east coast of South Africa and spans 673 ha. It is a subtropical estuarine bay, in which Durban Harbour is situated. North-easterly winds dominate during summer, often associated with sea breezes developed by Coriolis deflection. South-westerly winds are also common during the dry season and are often associated with cold fronts and coastal lows []. The intertidal habitat of the harbour covers 165 ha []. The catchment area is 264 km2, predominantly comprising urbanised areas [,,,].
It is generally wet, receiving an average annual rainfall of 1010 mm, mostly in summer between November and March (Durban-Wikipedia). Three tributaries, uMbilo, uMhlatuzana, and aManzamnyama, are connected to the harbour via canals []. These canals serve as freshwater conduits. Although the fresh water input is not substantial and the harbour is predominantly marine with salinity averaging 35‰, mesohaline conditions are still prevalent []. Durban harbour is the most economically active shipping harbour in Sub-Saharan Africa and it also supports ecosystem diversity and biota of ecological importance. The harbour is, therefore, of both economic and ecological value as it is also a habitat for juvenile fish, acting as a nursery []. Three major shallow sandbanks exist in Durban Bay constituting a large proportion of the intertidal habitat. Durban Harbour’s contamination hotspots reflect distinct anthropogenic pressures (Table A1): Yacht Bank and Marina Bank experience intensive vessel maintenance, including antifouling paint applications (historically TBT-rich; now Cu/Zn-dominated) and fibre shedding from ropes/nets []. Western Bank’s dry docks contribute metal-rich paint particles (up to 12% Cr by weight; []), while Central Bank’s shipping lanes accumulate combustion-derived nanoparticles. Little Lagoon, though less industrialized, potentially receives urban runoff with tire wear particles and legacy metals from stormwater drains. Stormwater runoff is also known to transport legacy metals such as lead, zinc, and copper from urban infrastructure into receiving water bodies. These metals often originate from antifouling, building materials, and industrial residues, and they accumulate in sediments over time, posing long-term ecological risks [].
For the purpose of this project, these sandbanks were sub-divided and named according to []: Little Lagoon (LL), Yacht Bank (YB), Marina Bank (MB), Western Bank (WB), and Central Sandbank (CB) (Figure 1).
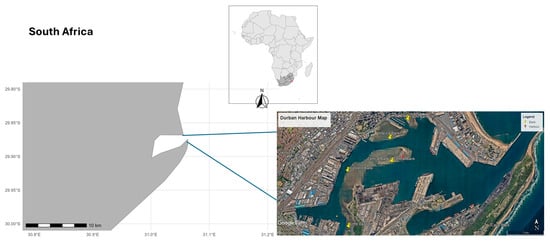
Figure 1.
Spatial distribution of sampling sites in Durban Harbour, South Africa: Yacht Bank (YB), Marina Bank (MB), Little Lagoon (LL), Western Bank (WB), and Central Bank (CB).
2. Materials and Methods
Unless otherwise stated, analytical-grade acids used for equipment cleaning and digestion were purchased from Sigma-Aldrich, St Louis, MO, USA or the Analytical Chemistry lab in South Africa (University of KwaZulu-Natal, Westville campus, South Africa). Spex CertiPrep (Stanmore, UK) plasma emission standards were used as a source of metal tracers in the experiments and to calibrate the analytical instrumentation. For sampling, storage containers were prewashed using deionised soap and distilled water (Millipore prepared at the University of KwaZulu-Natal).
2.1. Sediment Sampling
Sediment for toxicity testing was collected subtidally from each sandbank (LL, YB, MB, WB, and CB; Figure 1). Sediment samples were taken using a corer with a 50 mm internal diameter to a depth of 10 cm. Three replicate samples were collected every three months over a one-year period to determine the temporal variability of metal concentrations in the sediment. After collection, the sediment was stored in glass containers which were acid-washed prior to use at 4 °C. In the laboratory, samples were sieved using a 500 µm mesh to remove extraneous particulate matter and left for a minimum of 24 h to return to room temperature prior to use in toxicity tests.
2.2. Microplastic Extraction
Microplastics were extracted from the sediment using the Sediment Microplastics Isolation (SMI) Unit (sourced from the University of Birmingham) according to []. For microplastic analysis, the Central Bank sediment sample was omitted due to contamination during handling and transportation.
All sediment samples were dried at 60 °C to a constant weight (48 h) and homogenized prior to analysis to eliminate moisture variability. Microplastic abundances are reported as particles per gram dry weight sediment (particles/g dw), and metal concentrations as micrograms per gram dry weight (μg/g dw). Dry weight normalization ensures comparability with published data, as sediment moisture content can vary spatially and seasonally []. For QA/QC, blank corrections were applied to account for potential airborne contamination during drying and handling. MPs (20–100 µm) were isolated via density separation (NaCl, 1.2 g/cm3), filtered onto 20 µm membranes, and counted under stereomicroscopy. Counting errors were corrected using blank subtraction (mean recovery: 92 ± 5%). FTIR analysis confirmed polymer types (PE, PP, PET; Figure A2).
2.3. Amphipod Sampling
Amphipods were collected from uMlalazi Estuary, a more pristine estuary with minimal anthropogenic impact, to enable efficient acclimation to laboratory conditions. uMlalazi Estuary is located 137 km north of eThekwini. Down to a depth of 10 cm, we used a single metal corer with an internal diameter of 50 mm. Additionally, rocks and detritus were examined for amphipods and individuals were subsequently removed. All equipment used to collect amphipods were rinsed in situ with water prior to use. Amphipods were transported to the laboratory in 5 L buckets filled with estuarine water and a layer of sediment, allowing them to burrow.
Once in the laboratory, amphipods were immediately aerated. Grandidierella lignorum were separated from other amphipods using a dissecting microscope (Lesia ES2, China) (magnification 40) and identification key []. Grandidierella lignorum were acclimated for 24 h at a temperature of 25 °C, salinity of 25, and pH of 7 ± 0.2 []. Amphipods were cultured for three months in aerated glass culture trays in climate chambers with a 12 h daylight length. Water was changed once a week, using artificial seawater (deionised water with Seachem brand salt) at a salinity of 25‰ to mimic the mesohaline conditions in the harbour. Amphipods were fed twice a week with 0.5 mg of Sera Micron (Sera, Heinsberg, Germany) per amphipod. The culture success of G. lignorum (i.e., high survival, reproduction, and growth) confirmed that the physico-chemical parameters were acceptable to conduct toxicity tests.
2.4. Microplastic Staining
Nile red was prepared as per stipulations by []. The wet peroxide oxidation method was followed to digest organic matter using an aqueous 0.05 M Fe solution and 35% H2O2 []. After digestion, the samples were left in the oven to dry at 60 °C and then viewed under a florescence microscope. To isolate microplastics from organic/sediment residues during density separation, increasing false positive risks, 20 µm was the lower limit of detection and 100 µm was the upper limit of detection. Care was taken not to include animal structures, which may also fluoresce with Nile Red, when counting microplastics.
2.5. Extraction and Emission Wavelengths
Stained microplastics were detected and counted using the green excitation and emission wavelengths (ex.: 450–490; em: 515–565 nm) under a fluorescent microscope (Axio Scope A1, Zeiss, Jena, Germany).
2.6. Sediment and Metal Tissue Experimentation
Toxicity tests were conducted in thirty 600 mL glass beakers (six replicates per site LL, YB, MB, WB, CB; and control) containing 50 g of harbour sediment. Beakers were filled to 500 mL with artificial seawater at a salinity of 25‰ (care was taken not to disturb the sediment) and eight amphipods were introduced to each beaker. The bioassay ran for ten days and water was changed halfway through the experiment. Salinity and temperature were checked at the start and termination of the toxicity test. Amphipods were fed at the beginning of the exposure and after the water change during the 10-day bioassay. All amphipods surviving after ten days were counted, and sediment and tissue samples were collected from all replicates and analysed for metal content.
2.7. Metal Analysis in Sediments
Sediments were weighed and oven-dried at 60 °C to a constant weight for at least 48 h. Three 1 g samples of homogenized sediment from each replicate were digested with concentrated nitric acid []. Heavy metal concentrations in sediments were determined using Inductively Coupled Plasma Optical Emission Spectrometry (ICP-OES). A 15 mL sample was pumped at 2.5 mL−1 through the mini column where the analyte was retained. When the injection valve was switched, a stream of 1 mol L−1 hydrochloric acid flowing at 1.5 mL min−1 eluted the metal retained. The eluate was taken directly into the nebulizer system of the ICP-OES and the analytical response was recorded as the peak height. Blanks were run after every 10 samples. Amphipod tissues and sediment samples were analysed for Al, Pb, Cd, Cr, Co, Fe, Cu, Li, Mn, Ni, and Zn. Crab paste (LGC 7164) and Toronto Harbour Sediment (TH-2)-certified reference materials were used to test the analytical efficiency of the method. While [] also applied employed acid digestion and ICP-MS for metal analysis on plastic particles, our study extended this to examine bioavailability through amphipod exposure experiments.
2.8. Metals in Amphipod Tissue
One gram of amphipod tissue from each site was digested in concentrated sulphuric/nitric acid (H2SO4/HNO3) at a ratio of 1:3. A total of 3 mL of 60% sulphuric acid was added to a glass beaker containing tissue and then placed on a hotplate until it volatilised and reduced to 0.5 mL (approximately 10 min). A watch glass was placed on top of the beaker to avoid foaming during heating. Thereafter, 10 mL of 55% nitric acid was added. Heating continued until a clear solution appeared. This was repeated three times for each concentration.
Metal toxicity studies are well documented worldwide [,,], and two values of importance are often reported, namely the Effects Range Low (ERL) and Effects Range Medium (ERM). The ERL is the 10th percentile of the effects data of contaminants, where adverse effects rarely occur, and the ERM is the 50th percentile, where adverse effects frequently occur []). In South Africa, the Australian sediment quality guidelines for toxicity testing are often adopted. The department of environment forestry and fisheries (DEFF) is responsible for regulating the deposition of waste material in the marine environment and often follows the National Action List (Action Value S.A.).
2.9. Statistical Analysis
Following the test for normality, the Kruskal–Wallis nonparametric test was conducted to determine significant effects on the survival of amphipods. Pairwise post hoc comparisons were performed using Tukey’s HSD test to find which means were significantly different from one another. Pearson correlation was conducted to detect any relation between metal accumulation and microplastic abundance in the Durban Harbour sediment. Repeated-measures ANOVA was conducted to test for seasonal variation in metal concentration.
Pearson’s correlation coefficient (R) was determined to evaluate the correlation between Grandidierella lignorum tissue and sediment metal concentrations as well as tissue accumulation and microplastic abundance.
3. Results
Table 1 shows sediment and tissue reference material for Cu and Zn concentrations, with standard deviations. Toronto Harbour Sediment (TH-2) and crab paste (LGC 7164) were used for sediment and tissue concentration verification. Reference material analysis showed measured concentrations to be within 10% of the certified values for Cu and Zn.

Table 1.
Measured and certified values of heavy metal concentrations from harbour sediment (TH-2) in μg/g with standard deviations.
A significant difference in microplastic abundance was detected among sites within the harbour. Abundance ranged from 2.5 particles per gram at LL to 0.2 particles per gram at MB, with the Little Lagoon and Yacht Bank having the highest concentration of plastic (Figure 2). Figure 3 highlights the uneven distribution of microplastics in Durban Harbour sediment.
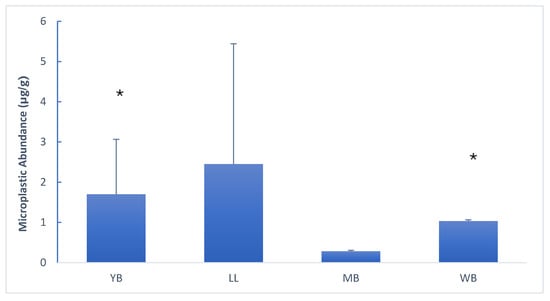
Figure 2.
Spatial distribution of microplastics (particles/g dw) across sampling sites, presented in west-to-east order: Yacht Bank (YB), Little Lagoon (LL), Marina Bank (MB), and Western Bank (WB). Significant differences (p < 0.05) are marked with asterisks (*).
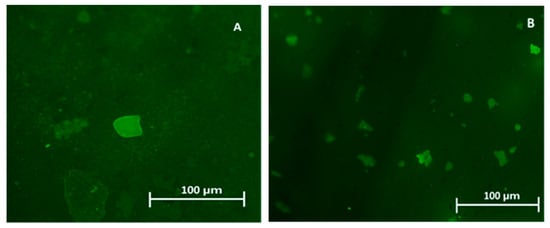
Figure 3.
Green florescence of plastic from the Durban Harbour sediment as seen under a fluorescent microscope. Samples (A) from the Western Bank and (B) from Little Lagoon.
Concentrations of metal in the sediment differed among sites (Table 2). Of the 10 metals tested in this study, As, Cd, and Ni were present in trace concentrations and were thus excluded from further reporting of results. Aluminium and Fe were high at all sites for all seasons, which was expected as these metals generally occur at high background concentrations []. Chromium was highest in autumn, with concentrations ranging from 51 to 140 µg/g. Cu was highest in summer in YB (73–683 µg/g). Manganese was highest in autumn in WB (0.3–2300 µg/g), Zn was highest in autumn in MB (96–900 µg/g), and Pb was prominent in autumn in MB (110 µg/g). Overall, LL showed the lowest metal concentration. Marina Bank and CB generally showed a high metal concentration in all seasons, and high concentrations were found in autumn for most metals.
Table 2.
ANOVA results for seasonal variation in total metal concentrations (μg/g dw) across sites (* significant at p < 0.05). Yacht Bank → Little Lagoon → Marina Bank → Western Bank → Central Bank.
There was no significant difference (Table 3) in the survival of amphipods following exposure to the sediment collected from five sites in the harbour: Little Lagoon (LL), Yacht Bank (YB), Marina Bank (MB), Western Bank (WB), and Central Bank (CB). A 10-day field validation test for Grandidierella lignorum was conducted using sediment collected during autumn (Figure 4). High amphipod survival was found in YB and CB at 80%, followed by LL (77.5%), while MB and WB showed 67.5% and 57.5% survival, respectively (Figure 4). The low survival (57.5%) in Marina Bank sediment was surprising as this area was previously regarded as a relatively uncontaminated region of the harbour. There was, however, no significant difference in amphipod survival between the five exposure sites in Durban Harbour (Table 3). Pearson correlation showed moderate correlation between microplastic abundance and amphipod survival (R2 = 0.57) (Figure 5).
Table 3.
One-way ANOVA (Tukey’s HSD test) of amphipod survival and microplastic abundance in Durban Harbour sediment; p < 0.05 denotes significant difference.
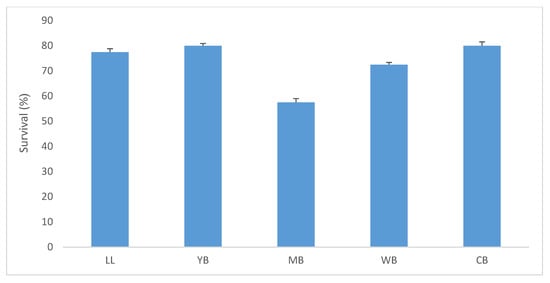
Figure 4.
Mean % survival (+1 SD) of G. lignorum during a 10-day sediment toxicity test on Durban Harbour sediment in Little Lagoon (LL), Yacht Bank (YB), Marina Bank (MB), Western Bank (WB), and Central Bank (CB).
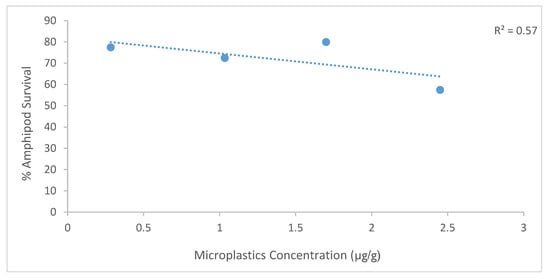
Figure 5.
Pearson correlation between microplastic concentration (µg/g dry weight sediment) and amphipod survival (%) across sampling sites in Durban Harbour. Data points are labelled by site: YB (Yacht Bank), LL (Little Lagoon), MB (Marina Bank), and WB (Western Bank). The dashed line represents the Pearson correlation fit (R2 = 0.47).
Sediment metal concentration generally presented in the order Al > Fe > Cu > Zn > Cr > As > Mn > Pb, following the 10-day bioassay (Figure 6A). Al was high in LL, Fe, As, Zn, and Pb were high in WB, and Cu was high in YB. Copper and Zn are two of the most commonly reported metals in sediment toxicity testing as they are essential in the metabolism of organisms. Spatially, Cu was highest in YB followed by CB and WB, while Zn was highest in MB followed by YB. Lead is also one of the most frequently reported trace metals, particularly in industrial areas; in this study, Pb was recorded in relatively high concentrations in MB. High Pb concentrations may be indicative of sediment contamination from spillages associated with petroleum oil spillage. Arsenic was low at all sample sites while Mn was highest in YB and CB. Chromium was recorded in relatively high concentrations in MB and CB.
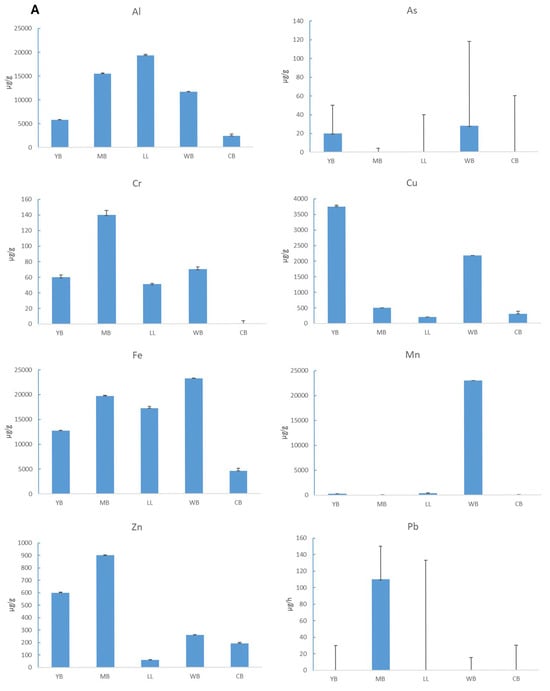
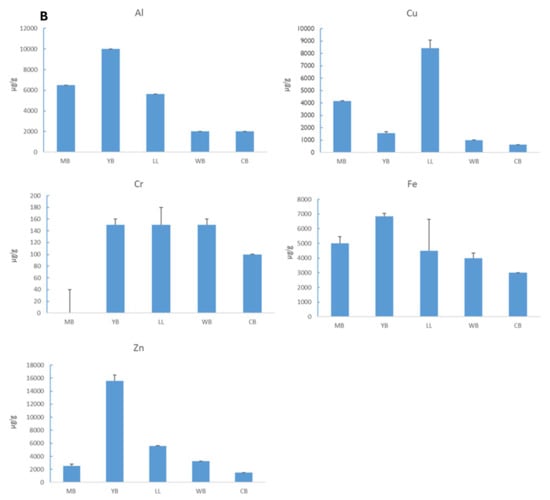
Figure 6.
(A) Mean (+1 STD) concentrations of aluminium (Al), arsenic (As), chromium (Cr), copper (Cu), iron (Fe), manganese (Mn), zinc (Zn), and lead in sediment at Yacht Bank (YB), Marina Bank (MB), Little Lagoon (LL), Western Bank (CB), and Central Bank (CB). (B) Mean (+1 STD) concentrations of aluminium (Al), copper (Cu), chromium (Cr), iron (Fe), and zinc (Zn) in G. lignorum tissue following 10-day exposure to sediment from five sites in Durban Harbour: Marina Bank (MB), Yacht Bank (YB), Little Lagoon (LL), Western Bank (CB), and Central Bank (CB).
Repeated-measures ANOVA showed seasonal significant difference for Cr (p = 0.00286) and Zn (p = 0.00435), and the post hoc Tukey’s HSD tests for Yacht Bank and Western Bank both showed significant differences between spring and summer, winter and summer, and winter and spring (Table 2).
As with sediment, metal concentration in tissues followed the trend Al > Fe > Zn > Cu > Cr. Mn, As, and Pb were not detected in tissues of G. lignorum (Figure 6B). The Pearson correlation test showed a positive correlation between sediment and tissue metal accumulation for most essential metals, with a stronger correlation for Al, Fe, and Zn (Figure 7).
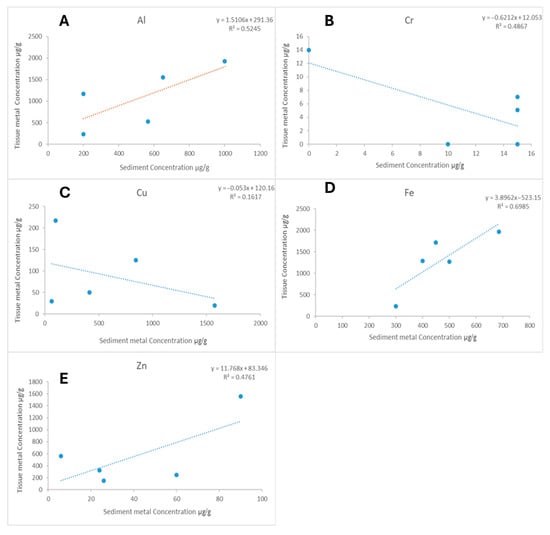
Figure 7.
Correlations between metal concentrations in Grandidierella lignorum tissue (μg/g dry weight) and sediments (μg/g dry weight) after 10-day exposure to sediments from five Durban Harbour sites (Marina Bank, Yacht Bank, Little Lagoon, Western Bank, Central Bank). Linear regressions shown for (A) aluminium (Al) y = 1.5106x + 291.36, R2 = 0.5245; (B) chromium (Cr): y = −0.6212x + 12.053, R2 = 0.4867; (C) copper (Cu): y = −0.053x + 120.16, R2 = 0.1617; (D) iron (Fe): y = 3.8962x − 523.15, R2 = 0.6985; (E) zinc (Zn): y = 11.768x + 83.346, R2 = 0.4761.
All sediment and tissue concentrations are reported on a dry weight basis (60 °C for 48 h).
4. Discussion
This study provides insights into the spatial and temporal variability of heavy metal concentrations and microplastic abundance in Durban Harbour sediments, as well as their biological impact on the amphipod Grandidierella lignorum. The findings emphasize the complexity of environmental contamination in highly industrialized harbours and its implications for both sediment quality assessment and ecological health.
Negative correlations between Cr and Cu in sediment and amphipod tissue indicate that G. lignorum was able to maintain these metals at low concentrations i.e., Cr and Cu were within the regulatory range for G. lignorum. In a related laboratory study, Cu and Zn did accumulate in high concentrations in G. lignorum, although experimental concentrations of metals were much higher than background concentrations in Durban Harbour. Zinc and Cu concentrations were found to be higher in sediments than both ERM guidelines and the “Action value for South Africa” (Table 4). Manganese concentration was generally low in all samples except in the CB sample, where concentrations in excess of 2000 µg/g were recorded. The anomalously high Mn concentrations in the CB sample suggest a recent spill from vessel movement, and the limited spread could be because of semi-enclosed estuarine hydrodynamics [], highlighting the dynamic nature of contamination in harbours and the need for continuous monitoring. While Mn is generally not highly toxic, the potential for adverse effects such as “manganism” in high concentrations indicates its relevance in toxicity assessments. The results reveal distinct spatial and seasonal patterns (Appendix A, Figure A2 and Table A2) in sediment metal concentrations, with sites such as Yacht Bank (YB), Western Bank (WB), and Central Bank (CB) displaying consistently high levels of Cu, Zn, and Pb. These hotspots of contamination are strongly linked to anthropogenic activities, such as boat maintenance, antifouling paints, and cargo handling. The elevated levels of Cu and Zn, which exceeded both local and international sediment quality guidelines, highlight the urgent need for localized sediment quality thresholds. However, their findings of Zn/Cu dominance align with our tissue accumulation patterns in G. lignorum (Figure 6B). These results highlight the direct relation between sediment metal concentration and amphipod toxicity as well as the importance of developing local toxicity guidelines as international standards may be much higher than local background concentrations, leading to the acceptance of concentrations higher than those tolerable by local organisms. Interestingly, Cr and Pb concentrations were found to be within ERM sediment quality guidelines but exceeded South African “Action values” (Table 4), further supporting the necessity of region-specific standards.
Both metal concentrations in YB and WB were found to be high, further indicating the importance of land use. The YB, WB, and CB sampling sites are also reported to be the most anthropogenically affected in the harbour []. The YB, for instance, houses a considerable number of boats where oil spills and antifouling from paint can contribute to contamination [] (Table A2). Subtidal banks were identified as significant sinks for metals, aligning with previous studies that emphasize their role in accumulating contaminants over time (19). Metal concentrations were higher in the subtidal sandbank than the intertidal sandbanks [], with winter showing consistently higher concentrations of trace metals. In this study, autumn showed the highest concentrations out of all seasons. The high metal concentration in CB has also been previously reported []. Future research should explore the sub-lethal and chronic effects of sediment contamination on amphipods to better understand their broader ecological implications.
Table 4.
The range of concentrations of metals (ug/g) recorded in amphipods from harbours during this and previous studies with the Effects Range Low and Effects Range Medium sediment standards.
Table 4.
The range of concentrations of metals (ug/g) recorded in amphipods from harbours during this and previous studies with the Effects Range Low and Effects Range Medium sediment standards.
| Mn | As | Cd | Cr | Cu | Ni | Pb | Zn | Reference | |
|---|---|---|---|---|---|---|---|---|---|
| Action Value S A | ** | 30 | 1.5 | 50 | 50 | 50 | 100 | 150 | [] |
| Effects Range Low (ERL) Australia | ** | 1.2 | 81 | 43 | 21 | 46.7 | 150 | ||
| Effects Range Medium (ERM) Australia | ** | 9.6 | 370 | 270 | 51.6 | 218 | 410 | ||
| Current study | 2.6 | * | * | 0.14 | 48.65 | * | 110 | 60.900 | |
| 1998 | 21–339.8 | 10.0–258 | 14–193.0 | [] | |||||
| 1996–1997 | 38.4–221.9 | 1.82–53.5 | 153–181 | [] | |||||
| 1985 | 114 | 25.0 | 53 | [] | |||||
| 1972–1981 | 74.80 | 1.1–40.0 | 14–179 | [] |
* Negligible concentration. ** Standard guideline value is not provided.
Microplastic abundances ranged from 0.2 to 2.7 particles per gram dry weight sediment (particles/g dw), with the highest concentrations at Western Bank (Figure 2). This aligns with global urban harbour baselines (e.g., 0.5–3.2 particles/g dw in Rotterdam Harbour) []. The highest microplastic abundance was recorded in LL, a site with relatively low metal concentrations, highlighting the independent distribution mechanisms of microplastics and metals.
These values are in similar ranges to previous studies in Durban Harbour [] and elsewhere []. The transport and sedimentation of microplastics are governed by their polymer densities relative to seawater (~1.02 g/cm3). While buoyant polymers like polyethylene (PE; 0.91–0.97 g/cm3) and polypropylene (PP; 0.85–0.94 g/cm3) dominate surface waters, denser plastics (e.g., PET [1.38–1.45 g/cm3], PVC [1.16–1.58 g/cm3], and composites with metal coatings) readily sink and accumulate in sediments [,]. In Durban Harbour, the prevalence of sinking MPs (e.g., PVC fragments comprising 42% of sediments; Figure A2) suggests bedload transport and/or biofilm-mediated settling []. Factors such as biofouling, chemical adsorption, and the physical properties of microplastics contribute to their uneven distribution. The lack of correlation between microplastic abundance and sediment metal concentrations further emphasizes their distinct pathways and interactions within the environment [], which further makes their distribution difficult to predict or model, particularly in highly industrialized environments such as Durban Harbour with various point sources of pollution. While microplastics were not found to influence metal bioavailability in this study, their potential role as vectors for other contaminants or in facilitating chronic toxicity warrants further investigation.
High microplastic abundance was found in LL, where metal concentrations were lowest. Of most relevance in toxicity assessments is the proportion of metal in the sediment that is bioavailable in the exchangeable environment and water-soluble fraction [,]. It is notable that the total sediment concentration of metals does not necessarily reflect their bioavailability and that metal accumulation in animals reflects a better representation of metal availability [,]. Following the 10-day exposure of G. lignorum to Durban Harbour sediment, amphipod survival was generally high for all sample stations. The metal tissue concentration pattern in amphipods was similar to that of sediment metal concentrations within Durban Bay Harbour, i.e., Al > Fe > Cu > Zn > Cr. Grandidierella lignorum, therefore, showed net accumulation for metals. These results suggest that G. lignorum are a net accumulator of metal; however, they are able to regulate non-essential metals. The concentration of Cr in tissue was high in LL, WB, and CB samples. Fe, Cu, and Zn were highest in the tissue of amphipods exposed to sediment from LL. ANOVA showed no significant difference in amphipod survival between sample sites, suggesting that Durban Harbour metal concentrations are within the tolerable range for amphipods. There was no noticeable tissue sediment correlation for Cu and there was a negative correlation for Cr. These results suggest that Cu and Cr are partially regulated by G. lignorum as they are both essential in the metabolism of amphipods, and that Cr concentration is low in Durban Harbour. This suggests that G. lignorum is capable of regulating these essential metals within a physiological range, maintaining them at low tissue concentrations despite high sediment levels. Such regulatory mechanisms make G. lignorum a valuable indicator species for sediment toxicity studies. However, the absence of acute toxicity does not preclude the possibility of chronic impacts, particularly in industrialized harbours where long-term exposure to contaminants may affect reproductive success and population dynamics. This study demonstrated that G. lignorum exhibit a high degree of resilience to sediment metal contamination, with no significant differences in amphipod survival across sampling sites.
During sampling, it was noted that numerous items of debris, including plastic material, tends to accumulate at the WB sampling station. Because of the high plastic abundance, high microplastic degradation may be prevalent at this sampling site and it is also susceptible to anthropogenic activity. Lastly, WB is associated with the loading and offloading of goods from ships including the Mediterranean Shipping Company (MSC); this part of the harbour is the most susceptible to accidental spills [], with spillage reported in the literature [], and therefore, high metal concentrations would be expected. This finding is in agreement with that of [], which emphasized that direct and indirect litter from ships as well as chemical spillages lead to increased toxicity in harbours. Although Little Lagoon (LL) showed the highest concentration of microplastics, it showed the lowest metal concentration. The low metal concentration was not expected as Amanzimnyama canal flows into the lagoon, which contributes to debris contamination in the harbour. This site has also previously been found to contain high metal concentrations []. Higher species abundance in LL than in other sites [], further suggesting that LL suffers the limited anthropogenic impact compared to other sites. This result suggests that microplastic abundance and metal concentration in Durban Harbour are not correlated.
The seasonal variability observed in metal concentrations at YB and WB suggests a strong influence of land use and human activity. Sites with higher anthropogenic impact, such as YB and WB, were consistently associated with elevated metal levels, reinforcing the importance of targeted management interventions. This study also confirms that subtidal sandbanks act as significant sinks for metals, with concentrations peaking during autumn. These findings align with previous research [,] and provide a foundation for better understanding the temporal dynamics of sediment contamination in Durban Harbour.
Despite the resilience shown by G. lignorum, the findings highlight the importance of regular environmental monitoring and the development of localized sediment toxicity guidelines tailored to the specific conditions of Durban Harbour. The results also highlight the need for a holistic approach to contamination assessment, considering both heavy metals and microplastics as interacting stressors. While this study did not find evidence of acute toxicity, the potential for cumulative or chronic impacts remains a concern, emphasizing the need for further research into the long-term effects on amphipod populations and the broader ecosystem.
5. Conclusions
Prior to this study, the complex interplay between heavy metal contamination, microplastic pollution, and ecological health in Durban Harbour had not been systematically investigated. This underscores an urgent need for research that elucidates the synergistic interactions between microplastics and co-occurring contaminants such as metals and organic compounds in urbanized estuarine systems. The observed spatial and temporal variability in both metal concentration and microplastic abundance (Figure 2; Table 2) reflects the influence of anthropogenic activities and land use patterns within the harbour catchment. These patterns suggest that point-source inputs including stormwater drains, industrial discharges, and urban runoff play a significant role in shaping contaminant distributions. Although amphipod survival rates indicated resilience to current sediment contamination levels, tissue metal accumulation revealed selective uptake and regulation, suggesting potential physiological adaptation or avoidance mechanisms. These findings highlight the need for localized toxicity thresholds to better protect native benthic species such as Grandidierella lignorum.
Interestingly, the lack of correlation between microplastic abundance and metal concentrations suggests distinct transport and deposition mechanisms, complicating their ecological interactions. Moreover, element-specific relationships between sediment and tissue metal concentrations reinforce the complexity of bioaccumulation dynamics, which may be influenced by particle size, polymer type, and metal speciation. While acute toxicity was not evident, the potential for chronic sub-lethal effects on G. lignorum and other sediment-dwelling organisms warrants long-term monitoring and ecotoxicological investigation. These effects may include impaired reproduction, altered behaviour, or immune responses, which are not captured by short-term survival assays.
This study demonstrates the value of integrating chemical, biological, and physical analyses to assess environmental contamination comprehensively. It also emphasizes the need for, targeted management strategies, stricter pollution controls, and the development of regional sediment quality guidelines. Such measures are essential to mitigate the ongoing impacts of industrialization and urbanization in Durban Harbour and similar estuarine ecosystems.
Author Contributions
Conceptualization, R.P.M. and D.G.; methodology, R.P.M.; software, R.P.M.; validation, R.P.M. and D.G.; formal analysis, R.P.M.; investigation, R.P.M.; resources, D.G.; data curation, R.P.M.; writing—original draft preparation, R.P.M.; writing—review and editing, R.P.M. and D.G.; visualization, R.P.M.; supervision, D.G.; project administration, D.G.; funding acquisition, D.G. All authors have read and agreed to the published version of the manuscript.
Funding
This research was funded by The University of KwaZulu-Natal.
Data Availability Statement
The original contributions presented in this study are included in the article. Further inquiries can be directed to the corresponding author.
Conflicts of Interest
The authors declare no conflict of interest.
Appendix A

Figure A1.
Seasonal biplots of variation in metal concentrations in Durban Harbour.
Table A1.
Anthropogenic activities at Durban Harbour sites.
Table A1.
Anthropogenic activities at Durban Harbour sites.
| Site | Key Anthropogenic Activities | Potential Contaminant Sources |
|---|---|---|
| Marina Bank | Recreational boating, small vessel maintenance | Antifouling paints (Cu, Zn), fuel spills (PAHs) |
| Yacht Bank | Luxury yacht berthing, hull cleaning | Tributyltin (TBT) residues, microplastic fibres |
| Little Lagoon | Stormwater runoff, urban effluent discharge | Street runoff (tire wear particles, Pb, Cd) |
| Western Bank | Industrial cargo handling, dry dock operations | Paint chips (Cr, As), ballast water metals (Ni, Hg) |
| Central Bank | Commercial shipping, port infrastructure maintenance | Diesel particulates, welding debris (Fe, Mn) |
Table A2.
Metal concentration (µg/g) with standard deviation in Durban Harbour collected from different areas in Durban Harbour according to land use: Little Lagoon (LL), Yacht Bank (YB), Marina Bank (MB), Western Bank (WB), and Central Bank (CB).
Table A2.
Metal concentration (µg/g) with standard deviation in Durban Harbour collected from different areas in Durban Harbour according to land use: Little Lagoon (LL), Yacht Bank (YB), Marina Bank (MB), Western Bank (WB), and Central Bank (CB).
| Al | Cr | Cu | Fe | Mn | Zn | Pb | ||
|---|---|---|---|---|---|---|---|---|
| Autumn | LL | 193 ± 0.133 | 0.5± 0.001 | 20 ± 0.4 | 1720 ± 0.18 | 40 ± 0.01 | 6 ± 0.133 | __ |
| YB | 581 ± 0.1 | 6 ± 0.003 | 375 ± 0.05 | 127 ± 0.1 | 30 ± 0.004 | 60 ± 0.006 | __ | |
| MB | 155 ± 0.1 | 1.4 ± 0.0056 | 5± 0.05 | 197 ± 0.18 | 0.9 ± 0.0004 | 9 ± 0.004 | 1.1 ± 0.04 | |
| WB | 1169 ± 0.4 | 7 ± 0.004 | 217 ± 0.08 | 2319 ± 0.002 | 2300 ± 0.002 | 26 ± 0.008 | __ | |
| CB | 235 ± 0.005 | __ | 30 ± 0.009 | 460 ± 0.05 | 7 ± 0.004 | 19 ± 0.003 | __ | |
| Winter | LL | 440.6 ± 0.52 | __ | 7.3 ± 0.05 | 907.3 ± 0.3 | 24.3 ± 0.05 | __ | __ |
| YB | 308 ± 3.6 | __ | 21 ± 4.5 | 315 ± 6.4 | __ | __ | __ | |
| MB | 460 ± 0 | __ | 7.23 ± 0.4 | 978.2 ± 34 | 65.7 ± 1.5 | __ | __ | |
| WB | 553 ± 3 | __ | 13 ± 5.2 | 1136 ± 5.7 | __ | __ | __ | |
| CB | 413 ± 119 | __ | 650 ± 16.7 | 20.3 ± 0.5 | __ | __ | __ | |
| Summer | LL | 515.6 ± 1.0 | __ | 4.8 ± 0.07 | 467.3 ± 0.9 | 2.63 ± 0.031 | __ | __ |
| YB | 706.6 ± 12.2 | __ | 687.3 ± 12.3 | 2700 ± 156 | __ | 166.7 ± 156.2 | __ | |
| MB | 487 ± 12 | __ | 44.3 ± 1.1 | 1262.6 ± 19.6 | 6.0 ± 0.3 | __ | __ | |
| WB | 460 ± 10 | __ | 27.6 ± 1.1 | 919.1 ± 10.7 | 31.3 ± 0.5 | __ | __ | |
| CB | 205.6 ± 2.8 | __ | 5.7 ± 0.7 | 545 ± 4.3 | 11 ± 0 | __ | __ | |
| Spring | LL | 423.3 ± 5.7 | __ | 211 ± 6.2 | 657 ± 13.1 | 31.6 ± 1.5 | __ | __ |
| YB | 415 ± 1.7 | __ | 315.6 ± 0.5 | 1438 ± 12.58 | 0.7 ± 0.05 | __ | __ | |
| MB | 688.6 ± 24.1 | __ | 210.6 ± 5.1 | 865.6 ± 12.4 | __ | __ | __ | |
| WB | 836.6 ± 5.7 | __ | 139 | 66.3 ± 0.57 | __ | __ | __ | |
| CB | 807 ± 24.7 | __ | 368.3 ± 2.0 | 1134 ± 6.9 | __ | __ | __ |


Figure A2.
FTIR analysis confirmed the presence of polyethylene (PE), polypropylene (PP), and polyethylene terephthalate (PET) in microplastics collected from Durban Harbour: (a) The spectral features in the 2800–3000 cm−1 range, corresponding to aliphatic C–H stretching vibrations, are characteristic of organic polymers like PE and PET, (b) Polypropylene (PP) was identified by its distinctive C–H bending and methyl group vibrations near 1375 cm−1 and 1450 cm−1, (c) An additional feature observed around 1725 cm−1 is not intrinsic to PP but is often attributed to additives or oxidation products. Furthermore, the presence of polythiophene derivatives was indicated by vibrations of the π-conjugated backbone, specifically C=C stretching modes between 1400 and 1600 cm−1, which are typical of conductive organic polymers.
References
- Mayer-Pinto, M.; Johnston, E.; Hutchings, P.; Marzinelli, E.; Ahyong, S.; Birch, G.; Booth, D.; Creese, R.; Doblin, M.; Figueira, W. Sydney Harbour: A Review of Anthropogenic Impacts on the Biodiversity and Ecosystem Function of One of the World’s Largest Natural Harbours. Mar. Freshw. Res. 2015, 66, 1088–1105. [Google Scholar] [CrossRef]
- Lamberth, S.; Turpie, J. The Role of Estuaries in South African Fisheries: Economic Importance and Management Implications. Afr. J. Mar. Sci. 2003, 25, 131–157. [Google Scholar] [CrossRef]
- Schlacher, T.A.; Wooldridge, T.H. How Sieve Mesh Size Affects Sample Estimates of Estuarine Benthic Macrofauna. J. Exp. Mar. Biol. Ecol. 1996, 201, 159–171. [Google Scholar] [CrossRef]
- Jickells, T.; Andrews, J.; Parkes, D.; Suratman, S.; Aziz, A.; Hee, Y. Nutrient Transport through Estuaries: The Importance of the Estuarine Geography. Estuar. Coast. Shelf Sci. 2014, 150, 215–229. [Google Scholar] [CrossRef]
- Mulvaney, K.K.; Atkinson, S.F.; Merrill, N.H.; Twichell, J.H.; Mazzotta, M.J. Quantifying Recreational Use of an Estuary: A Case Study of Three Bays, Cape Cod, USA. Estuaries Coasts 2020, 43, 7–22. [Google Scholar] [CrossRef]
- Chiaia-Hernández, A.C.; Casado-Martinez, C.; Lara-Martin, P.; Bucheli, T.D. Sediments: Sink, Archive, and Source of Contaminants. Environ. Sci. Pollut. Res. 2022, 29, 85761–85765. [Google Scholar] [CrossRef]
- Brennecke, D.; Duarte, B.; Paiva, F.; Caçador, I.; Canning-Clode, J. Microplastics as Vector for Heavy Metal Contamination from the Marine Environment. Estuar. Coast. Shelf Sci. 2016, 178, 189–195. [Google Scholar] [CrossRef]
- Koelmans, A.A.; Bakir, A.; Burton, G.A.; Janssen, C.R. Microplastic as a Vector for Chemicals in the Aquatic Environment: Critical Review and Model-Supported Reinterpretation of Empirical Studies. Environ. Sci. Technol. 2016, 50, 3315–3326. [Google Scholar] [CrossRef]
- Vivier, L. Macrobenthic Community and Ecotoxicological Status of the Nhlabane Estuary. Ph.D. Thesis, University of Zululand, Richards Bay, South Africa, 2010. [Google Scholar]
- Sousa, J.C.; Ribeiro, A.R.; Barbosa, M.O.; Pereira, M.F.R.; Silva, A.M. A Review on Environmental Monitoring of Water Organic Pollutants Identified by EU Guidelines. J. Hazard. Mater. 2018, 344, 146–162. [Google Scholar] [CrossRef]
- Gesamp, G. Sources, Fate and Effects of Microplastics in the Marine Environment: Part Two of a Global Assessment. IMO Lond. 2016, 220, 93. [Google Scholar]
- Jiang, J.-Q. Occurrence of Microplastics and Its Pollution in the Environment: A Review. Sustain. Prod. Consum. 2018, 13, 16–23. [Google Scholar] [CrossRef]
- Sun, J.; Dai, X.; Wang, Q.; Van Loosdrecht, M.C.; Ni, B.-J. Microplastics in Wastewater Treatment Plants: Detection, Occurrence and Removal. Water Res. 2019, 152, 21–37. [Google Scholar] [CrossRef] [PubMed]
- Browne, M.A.; Galloway, T.S.; Thompson, R.C. Spatial Patterns of Plastic Debris along Estuarine Shorelines. Environ. Sci. Technol. 2010, 44, 3404–3409. [Google Scholar] [CrossRef] [PubMed]
- Costa, M.F.; Silva-Cavalcanti, J.S.; Barbosa, C.C.; Portugal, J.L.; Barletta, M. Plastics Buried in the Inter-Tidal Plain of a Tropical Estuarine Ecosystem. J. Coast. Res. 2011, 339–343. [Google Scholar]
- Ivar do Sul, J.A.; Costa, M.F. Plastic Pollution Risks in an Estuarine Conservation Unit. J. Coast. Res. 2013, 65, 48–53. [Google Scholar] [CrossRef]
- Morritt, D.; Stefanoudis, P.V.; Pearce, D.; Crimmen, O.A.; Clark, P.F. Plastic in the Thames: A River Runs through It. Mar. Pollut. Bull. 2014, 78, 196–200. [Google Scholar] [CrossRef]
- Ryan, P.; Moloney, C. Plastic and Other Artefacts on South African Beaches: Temporal Trends in Abundance and Composition. S. Afr. J. Sci./S. Afr. Tydskr. Wet. 1990, 86, 450–452. [Google Scholar]
- Naidoo, T.; Glassom, D.; Smit, A.J. Plastic Pollution in Five Urban Estuaries of KwaZulu-Natal, South Africa. Mar. Pollut. Bull. 2015, 101, 473–480. [Google Scholar] [CrossRef]
- Naidoo, T.; Smit, A.; Glassom, D. Plastic Ingestion by Estuarine Mullet Mugil Cephalus (Mugilidae) in an Urban Harbour, KwaZulu-Natal, South Africa. Afr. J. Mar. Sci. 2016, 38, 145–149. [Google Scholar] [CrossRef]
- Nel, H.A.; Hean, J.W.; Noundou, X.S.; Froneman, P.W. Do Microplastic Loads Reflect the Population Demographics along the Southern African Coastline? Mar. Pollut. Bull. 2017, 115, 115–119. [Google Scholar] [CrossRef]
- Claessens, M.; Meester, S.D.; Landuyt, L.V.; Clerck, K.D.; Janssen, C.R. Occurrence and Distribution of Microplastics in Marine Sediments along the Belgian Coast. Mar. Pollut. Bull. 2011, 62, 2199–2204. [Google Scholar] [CrossRef]
- Nel, H.A.; Froneman, P.W. A Quantitative Analysis of Microplastic Pollution along the South-Eastern Coastline of South Africa. Mar. Pollut. Bull. 2015, 101, 274–279. [Google Scholar] [CrossRef] [PubMed]
- Pan, K.; Wang, W.-X. Trace Metal Contamination in Estuarine and Coastal Environments in China. Sci. Total Environ. 2012, 421, 3–16. [Google Scholar] [CrossRef] [PubMed]
- Casazza, G.; Zappa, E.; Mariotti, M.G.; Médail, F.; Minuto, L. Ecological and Historical Factors Affecting Distribution Pattern and Richness of Endemic Plant Species: The Case of the Maritime and Ligurian Alps Hotspot. Divers. Distrib. 2008, 14, 47–58. [Google Scholar] [CrossRef]
- Chapman, P.M. Ecotoxicology and Pollution—Key Issues. Mar. Pollut. Bull. 1995, 31, 167–177. [Google Scholar] [CrossRef]
- Rainbow, P.S. Trace Metal Bioaccumulation: Models, Metabolic Availability and Toxicity. Environ. Int. 2007, 33, 576–582. [Google Scholar] [CrossRef]
- Naidu, S. Preliminary Study and First Evidence of Presence of Microplastics and Colorants in Green Mussel, Perna Viridis (Linnaeus, 1758), from Southeast Coast of India. Mar. Pollut. Bull. 2019, 140, 416–422. [Google Scholar] [CrossRef]
- Rainieri, S.; Conlledo, N.; Larsen, B.K.; Granby, K.; Barranco, A. Combined Effects of Microplastics and Chemical Contaminants on the Organ Toxicity of Zebrafish (Danio Rerio). Environ. Res. 2018, 162, 135–143. [Google Scholar] [CrossRef]
- Syberg, K.; Khan, F.R.; Selck, H.; Palmqvist, A.; Banta, G.T.; Daley, J.; Sano, L.; Duhaime, M.B. Microplastics: Addressing Ecological Risk through Lessons Learned. Environ. Toxicol. Chem. 2015, 34, 945–953. [Google Scholar] [CrossRef]
- Awe, A.; Oputu, O.; Aigbe, U.O.; Sparks, C. Metals Associated with Beach Plastic Litter at Woodbridge Island and Derdesteen in Table Bay, South Africa. Microplast. Nanoplast. 2025, 5, 13. [Google Scholar] [CrossRef]
- Fuchsig, H.; Neuberger, M. World Medical Association’s Concern Regarding Effects of Ultrafine Particles and Vehicular Emissions: Report from 65th General Assembly in Durban, South Africa. Emiss. Control Sci. Technol. 2017, 3, 243–244. [Google Scholar] [CrossRef]
- Lutjeharms, J.R. The Coastal Oceans of South-Eastern. In The Sea, Volume 14B: The Global Coastal Ocean: Interdisciplinary Regional Studies and Syntheses; Harvard University Press: Cambridge, MA, USA, 2006; Volume 14, p. 783. [Google Scholar]
- Allan, D.; Sinclair, J.C.; Rossouw, J. The Waterbirds (Aves) of Durban Bay: Current Status and Historical Trends. Durb. Mus. Novit. 1999, 24, 1–21. [Google Scholar]
- Day, J.; Morgans, J. The Ecology of South African Estuaries. Part 7. The Biology of Durban Bay. Ann. Natal Mus. 1956, 13, 259–312. [Google Scholar]
- Hay, D.; Breen, C.; FORBES, T.; DP, C. The Development of a Conceptual Basis for the Environmental Management of the Port of Durban. Investl. Rep. Inst. Nat. Resour. Afr. 1993, 78, 39. [Google Scholar]
- Graham, M. Association of Juveniles of Four Fish Species with Sandbanks in Durban Bay, KwaZulu Natal. Ph.D. Thesis, University of KwaZulu-Natal, Durban, South Africa, 1994. [Google Scholar]
- Pillay, D.; Branch, G.; Forbes, A. Habitat Change in an Estuarine Embayment: Anthropogenic Influences and a Regime Shift in Biotic Interactions. Mar. Ecol. Prog. Ser. 2008, 370, 19–31. [Google Scholar] [CrossRef]
- Obeng, A.M.D. The Impact of Harbour and Associated Activities on the Water Quality of the Durban Bay and Their Effects on Indwelling Ecosystems. Ph.D. Thesis, University of KwaZulu-Natal, Durban, South Africa, 2010. [Google Scholar]
- Bakir, A.; Rowland, S.J.; Thompson, R.C. Transport of Persistent Organic Pollutants by Microplastics in Estuarine Conditions. Estuar. Coast. Shelf Sci. 2014, 140, 14–21. [Google Scholar] [CrossRef]
- Turner, A. Paint Particles in the Marine Environment: An Overlooked Component of Microplastics. Water Res. X 2021, 12, 100110. [Google Scholar] [CrossRef]
- Ziajahromi, S.; Lu, H.-C.; Drapper, D.; Hornbuckle, A.; Leusch, F.D. Microplastics and Tire Wear Particles in Urban Stormwater: Abundance, Characteristics, and Potential Mitigation Strategies. Environ. Sci. Technol. 2023, 57, 12829–12837. [Google Scholar] [CrossRef]
- Tshingana, B. Spatial and Temporal Distribution of Macro-Benthic Fauna of Durban Harbour Sandbank. Master’s Thesis, University of KwaZulu Natal, Durban, South Africa, 2018. [Google Scholar]
- Coppock, R.L.; Cole, M.; Lindeque, P.K.; Queirós, A.M.; Galloway, T.S. A Small-Scale, Portable Method for Extracting Microplastics from Marine Sediments. Environ. Pollut. 2017, 230, 829–837. [Google Scholar] [CrossRef]
- Tanner, P.; Leong, L. The Effects of Different Drying Methods for Marine Sediment upon Moisture Content and Metal Determination. Mar. Pollut. Bull. 1995, 31, 325–329. [Google Scholar] [CrossRef]
- Griffiths, C.L. The Amphipoda of Southern Africa; South African Museum: Cape Town, South Africa, 1973. [Google Scholar]
- Masikane, N.; Newman, B.; Scharler, U. Salinity Tolerance of the South African Endemic Amphipod Grandidierella lignorum (Amphipoda: Aoridae). Afr. J. Aquat. Sci. 2014, 39, 151–156. [Google Scholar] [CrossRef]
- Maes, T.; Jessop, R.; Wellner, N.; Haupt, K.; Mayes, A.G. A Rapid-Screening Approach to Detect and Quantify Microplastics Based on Fluorescent Tagging with Nile Red. Sci. Rep. 2017, 7, 44501. [Google Scholar] [CrossRef] [PubMed]
- Masura, J.; Baker, J.E.; Foster, G.D.; Arthur, C.; Herring, C. Laboratory Methods for the Analysis of Microplastics in the Marine Environment: Recommendations for Quantifying Synthetic Particles in Waters and Sediments; NOAA Marine Debris Division: Silver Spring, MD, USA, 2015. [Google Scholar]
- Lakshmanasenthil, S.; Vinothkumar, T.; AjithKumar, T.T.; Marudhupandi, T.; Veettil, D.K.; Ganeshamurthy, R.; Ghosh, S.; Balasubramanian, T. Harmful Metals Concentration in Sediments and Fishes of Biologically Important Estuary, Bay of Bengal. J. Environ. Health Sci. Eng. 2013, 11, 33. [Google Scholar] [CrossRef] [PubMed]
- Weber, P.; Behr, E.R.; Knorr, C.D.L.; Vendruscolo, D.S.; Flores, E.M.; Dressler, V.L.; Baldisserotto, B. Metals in the Water, Sediment, and Tissues of Two Fish Species from Different Trophic Levels in a Subtropical Brazilian River. Microchem. J. 2013, 106, 61–66. [Google Scholar] [CrossRef]
- Khan, F.; Khan, M.J.; Samad, A.; Noor, Y.; Rashid, M.; Jan, B. In-Situ Stabilization of Heavy Metals in Agriculture Soils Irrigated with Untreated Wastewater. J. Geochem. Explor. 2015, 159, 1–7. [Google Scholar] [CrossRef]
- Goher, M.E.; Farhat, H.I.; Abdo, M.H.; Salem, S.G. Metal Pollution Assessment in the Surface Sediment of Lake Nasser, Egypt. Egypt. J. Aquat. Res. 2014, 40, 213–224. [Google Scholar] [CrossRef]
- Anzecc, A. Australian and New Zealand Guidelines for Fresh and Marine Water Quality; Primary Industries—Rationale and Background Information (Irrigation and General Water Uses, Stock Drinking Water, Aquaculture and Human Consumers of Aquatic Foods); Australian and New Zealand Environment and Conservation Council and Agriculture and Resource Management Council of Australia and New Zealand: Canberra, Australia, 2000; Volume 3, Chapter 9. [Google Scholar]
- Callow, S. Aspects of Heavy Metal Concentrations in Natal Estuarine Sediments. Ph.D. Thesis, University of KwaZulu-Natal, Durban, South Africa, 1994. [Google Scholar]
- Department of Environmental Affairs. DEA Report. Available online: https://www.dffe.gov.za/sites/default/files/reports/research/oceans/marinedisposal_actionlist_technicalreport.pdf (accessed on 8 August 2025).
- Archibald, C.; Parsons, G. Sediment Assessment Programme for the Port of Richards Bay. In Heavy Metal Survey (1998): Final Report; CSIR: Durban, South Africa, 1998. [Google Scholar]
- Wepener, V.; Vermeulen, L. A Note on the Concentrations and Bioavailability of Selected Metals in Sediments of Richards Bay Harbour, South Africa. Water SA 2005, 31, 589–596. [Google Scholar] [CrossRef]
- Hennig, H. Review of Metal Concentrations in Southern African Coastal Waters, Sediments and Organisms; National Scientific Programmes Unit, CSIR: Durban, South Africa, 1985. [Google Scholar]
- Leslie, H.A.; van Velzen, M.J.M.; Brandsma, S.H.; Vethaak, A.D.; Garcia-Vallejo, J.J.; Lamoree, M.H. Discovery and Quantification of Plastic Particle Pollution in Human Blood. Environ. Int. 2022, 163, 107199. [Google Scholar] [CrossRef]
- Yu, X.; Peng, J.; Wang, J.; Wang, K.; Bao, S. Occurrence of Microplastics in the Beach Sand of the Chinese Inner Sea: The Bohai Sea. Environ. Pollut. 2016, 214, 722–730. [Google Scholar] [CrossRef]
- Andrady, A.L. The Plastic in Microplastics: A Review. Mar. Pollut. Bull. 2017, 119, 12–22. [Google Scholar] [CrossRef]
- Kooi, M.; Reisser, J.; Slat, B.; Ferrari, F.F.; Schmid, M.S.; Cunsolo, S.; Brambini, R.; Noble, K.; Sirks, L.-A.; Linders, T.E. The Effect of Particle Properties on the Depth Profile of Buoyant Plastics in the Ocean. Sci. Rep. 2016, 6, 33882. [Google Scholar] [CrossRef] [PubMed]
- Michels, J.; Stippkugel, A.; Lenz, M.; Wirtz, K.; Engel, A. Rapid Aggregation of Biofilm-Covered Microplastics with Marine Biogenic Particles. Proc. R. Soc. B 2018, 285, 20181203. [Google Scholar] [CrossRef] [PubMed]
- Wright, S.L.; Thompson, R.C.; Galloway, T.S. The Physical Impacts of Microplastics on Marine Organisms: A Review. Environ. Pollut. 2013, 178, 483–492. [Google Scholar] [CrossRef] [PubMed]
- Ré, A.; Freitas, R.; Sampaio, L.; Rodrigues, A.M.; Quintino, V. Estuarine Sediment Acute Toxicity Testing with the European Amphipod Corophium Multisetosum Stock, 1952. Chemosphere 2009, 76, 1323–1333. [Google Scholar] [CrossRef]
- Coetzee, P. Determination and Speciation of Heavy Metals in Sediments of the Hartbeespoort Dam by Sequential Chemical Extraction. Water SA 1993, 19, 291–300. [Google Scholar]
- Thompson, G.W.; Medve, R.J. Effects of Aluminum and Manganese on the Growth of Ectomycorrhizal Fungi. Appl. Environ. Microbiol. 1984, 48, 556–560. [Google Scholar] [CrossRef]
- Paul, V. An Assessment of Selected Metal Pollutants in Durban Harbour. Ph.D. Thesis, M.L. Sultan Technikon, Durban, South Africa, 2001. [Google Scholar]
- Laird, M.; Clark, B. Marine Impact Assessment for Maintenance of the SAPREF; Report no. 1748/1 prepared by Anchor Environmental Consultants for WSP Parsons Brinckerhoff; Offshore Pipeline: Durban, South African, 2017. [Google Scholar]
- Moodley, K.; Pillay, S.; Pather, K. Spatiotemporal Characterization of Water Chemistry and Pollution Sources of the Umhlatuzana, Umbilo and Amanzimnyama River Catchments of Durban, KwaZulu-Natal, South Africa. Environ. Earth Sci. 2015, 74, 1273–1289. [Google Scholar] [CrossRef]
Disclaimer/Publisher’s Note: The statements, opinions and data contained in all publications are solely those of the individual author(s) and contributor(s) and not of MDPI and/or the editor(s). MDPI and/or the editor(s) disclaim responsibility for any injury to people or property resulting from any ideas, methods, instructions or products referred to in the content. |
© 2025 by the authors. Licensee MDPI, Basel, Switzerland. This article is an open access article distributed under the terms and conditions of the Creative Commons Attribution (CC BY) license (https://creativecommons.org/licenses/by/4.0/).