Abstract
The study of microplastics (MPs) in soils is impeded by similarities between plastic and non-plastic particles and the misidentification of MP by current analytical methods such as visual microscopic examination. Soil MPs pose serious ecological and public health risks because of their abundance, persistence, and ubiquity. Thus, reliable identification methods are badly needed for scientific study. One possible solution is UV–Vis–NIR spectroscopy, which has the ability to rapidly identify and quantify concentrations of soil microplastics. In this study, a full-range, field portable spectrometer (350–2500 nm) with ultra-high spectral resolution (1.5 nm, 3.0 nm, and 3.8 nm) identified three types of common plastics: low-density polyethylene (LDPE), polyvinyl chloride (PVC), and polypropylene (PP). Three sets of artificially MP-treated vermiculite soil samples were prepared for model prediction testing and validation: 150 samples for model calibration and 50 samples for model validation. A partial least square regression model using the spectral signatures for quantification of soil and MP mixtures was built with all three plastic polymers. Prediction R2 values of all three polymers showed promising results: polypropylene R2 = 0.943, polyvinyl chloride R2 = 0.983, and polyethylene R2 = 0.957. Our study supports previous work showing that combining ultra-high-resolution UV–Vis–NIR spectrometry with quantitative modeling can improve the accuracy and speed of MP identification and quantification in soil.
1. Introduction
Plastic pollution is a rapidly growing global problem, receiving significant attention in all environmental sciences. Indeed, some researchers now refer to the “Plasticene” as our current geological epoch [1]. Microplastics (MPs) are plastics with particle sizes < 5 mm. They form when larger plastic pieces are exposed to erosion, degradation, photo-thermal oxidation, UV degradation, or friction [2,3]. Primary MPs come directly from the production of tiny plastic particles, and secondary MPs come from the fragmentation of larger particles. Both are transported via several media [4]. Freshwater systems carry a significant number of MPs providing nearly 80% of the total input of plastic into the oceans [5]. This poses significant concerns about mechanisms of transport and the toxic effects of MPs, including the adsorption of many other chemicals or toxic substances [5].
To fully understand the impacts of MPs on the environment, better quantification of their abundance and composition is necessary. Many studies use vibrational spectroscopy methods such as Raman spectroscopy and Fourier-transform infrared (FTIR) spectroscopy for these goals [6,7]. However, both techniques have limitations when used for MP analysis. Raman spectroscopy requires extensive data processing and sample pre-treatment [8]. FTIR, on the other hand, can be used without any pre-treatment of the samples [9]. However, the application of FTIR is limited to dry samples with sizes above 10 μm for Mid-Wavelength Infrared-FTIR [10] and is limited to transparent or white samples for Near-Infrared-FTIR. The limitations of both techniques make it clear that additional spectroscopic techniques are required to cover the large diversity of microplastics in the environment. Other mass spectrometry methods such as Pyrolysis–Gas Chromatography–Mass Spectrometry (Pyr-GC-MS) and Thermal Desorption–GC-MS (TED-GC-MS) have been used as an analytical method for the identification of microplastics in the environment [11]. However, both of these mass spectrometry methods also present significant drawbacks, including the most important deficiency of their inability to be used in the field. Pyr-GC-MS presents drawbacks since it needs adequate concentration and separation steps, which could limit the analysis of large quantities of MPs. TED-GC-MS requires extensive sample preparation steps, not limited to model building itself, with a density separation approach.
In the last five years, there has been increasing interest in the various types of Vis–NIR lab spectrometers as reflected light can be used to identify and even quantify MP polymers [12,13,14,15]. The increasing popularity of these spectrometers is due to their great potential for rapid, low-cost, non-destructive, and accurate use for MP analysis compared to traditional methods. Most of these benefits occur because they allow real-time assessment of minimal-to-no sample pre-treatment such as time-consuming MP extraction from soils by filtration, gravitation, or other means (Junhao et al., 2021) [16]. However, nearly all previous soil MP spectral studies have been completed with standard spectral resolution spectrometers (e.g., [13,14,15,17,18,19,20]). An exception to this use of standard resolution was carried out by Corradini et al., 2019 [12], by testing a device that has a higher spectral resolution. Corradini’s approach was to use spectral resolutions of 3.0 nm (UV–Vis), 8 nm (SWIR1), and 6 nm (SWIR2). Our study takes this approach further by using ultra-high spectral resolutions of 1.5 nm (UV–Vis), 3.0 nm (SWIR1), and 3.8 nm (SWIR2) to measure the reflectance spectra. This is important to the microplastic community because ultra-high spectral resolution allows us to better identify microplastics at a smaller concentration by identifying key absorption features that are not visible with standard spectral resolution. This also allows us to experiment whether the additional absorption features may increase the accuracy of quantitative modeling.
Our study also uses a portable instrument so it can be used in the field. Several types of portable and handheld devices for MP analysis were recently reviewed [21]. Of these devices, the use of portable equipment in the near-infrared region is commonly used in quality control [22] and for polymer-type identification of macroplastics [23,24]. However, there has been very little spectral analysis of soil MPs using the broader spectrum of UV–Vis–NIR reflectance, with almost all studies relying on NIR or Vis–NIR or only part of that spectrum (e.g., [17,18,20]). The benefits of a higher spectral resolution seem theoretically obvious (e.g., more ways to characterize and thus identify polymers), but its utility has yet to be demonstrated, which is our goal here.
In addition to these advances in the spectroscopic equipment, this paper also advances MP analysis by using MP soil contamination as the focus of our study. As reviewed by Junhao et al. [16], MP studies of soils have lagged far behind studies of MPs in other media. For example, the first study of MPs in ocean waters was published in 1974 [25], but it was 2012 [26] before an MP soil study was published. This lack of MP studies in soils is highly significant because, by one estimate at least, terrestrial soils may contain 4–23 times more plastic contamination than the ocean basics [27]. The main reason for this neglect of soil in MP studies is that soils are heterogeneous, complex media that require much preparation. Soils also contain many particles besides MPs, which makes it difficult to identify and quantify MP particles [16]. Thus, the use of accurate and low-cost methods of MP identification using spectroscopy, especially in the field, could be a very effective way to make soil MP analysis much more available and common.
Here, we examine MP spectral data from artificial vermiculite soil mixed with plastic polymers. The polymers examined were low-density polyethylene (LDPE), polyvinyl chloride (PVC), and polypropylene (PP). These three polymers were selected because they are commonly found in sedimentary environments (e.g., [19,28,29]). We also analyze which plastic polymer model performed best for individual and mixture samples. This study aims to show that increased (ultra-high) spectral resolution can have an impact on more accurate identification of MPs in soils and increase the confidence of quantification via chemometric modeling. This proof-of-concept study will be used as a basis and application for future field studies.
2. Materials and Methods
2.1. Experimental Methods
Pure vermiculite soil, Grade 4, mesh size 7.9 mm, was purchased from Uline (Pleasant Prairie, WI, USA. Pure polypropylene (PP) and low-density polyethylene (LDPE) pellets were purchased from Scientific Polymer Products Inc. along with pure polyvinyl chloride (PVC). A portable UV–Vis–NIR spectrometer from Spectral Evolution, Inc (Haverhill, MA, USA) with an ultra-high spectral resolution of 1.5 nm, 3.0 nm, and 3.8 nm was used to measure the reflectance spectra of artificial vermiculite soil polluted with known concentrations plastic polymers. Three sets of samples were treated with individual polymers of PP, PE, and PVC in a range of MP concentration of 0.5–10%.
2.2. Sample Preparation
A total of 150 calibration samples and 50 test samples (3:1) were prepared in this study. The pure vermiculite soil was milled to an 840–250-micron particle size. The three polymers were also milled to coincide with the same particle size of 840–250 microns and sieved. The mixture of vermiculite and each individual polymer was created at a 0–10% concentration with 0.5% increments. Once the mixtures were made, a mortar and pestle were used to grind the mixture samples in order to separate the MP particles from adhering to the individual vermiculite soil particles. After grinding a 5 g mixture of vermiculite soil, MPs were created and divided into 10 samples at 0.5 g increments for data acquisition. Figure 1 shows examples of the final soil and MP mixtures divided into sample cups that were used in the study.
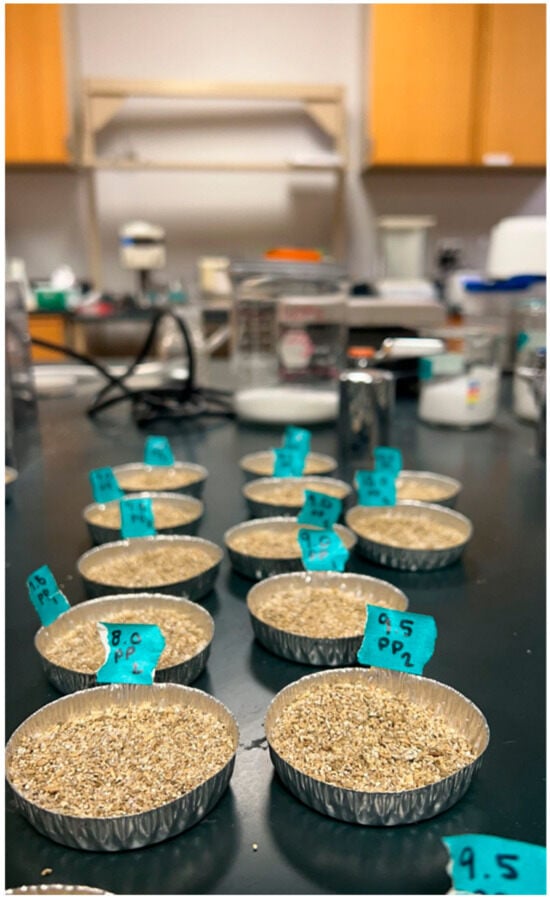
Figure 1.
Soil and polypropylene (PVC) mixtures shown at 0.5% increments.
2.3. Spectral Signatures of Treated Samples
Spectral Evolution’s oreXpert™ spectrometer was used to take the spectral measurements of both pure vermiculite soil and pure polymers along with all mixture samples. A benchtop probe with a sample compactor and sample trays was the appropriate accessory for this study due to the thin layer of soil and MP mixture. This allows for more precise and steady measurements to ensure the MP particles were captured within the spectral data. For each sample, 5 measurements were taken by rotating the sample puck between each measurement. Spectral Evolution’s DARWin acquisition software v.1.5.8852 allowed for spectral measurements to be obtained and combined with the EZ-ID™ identification tool to ensure the MP particles were being identified at each concentration range.
3. Results
3.1. Standard vs. Ultra-High Resolution
In order to prove the importance of ultra-high spectral resolution of 1.5 nm (UV–Vis), 3.0 nm (SWIR1), and 3.8 nm (SWIR2) for microplastic polymer identification, Figure 2, Figure 3 and Figure 4 show the spectral resolution difference compared to the standard resolution that Corridini et al., 2019 [12], used for their initial research of 3.0 (UV–Vis), 8 nm (SWIR1), and 6 nm (SWIR2). Corridini’s findings show great improvement in the technology standards for using UV–Vis–NIR technology for this application. However, as technology has improved, there is a need to visit the theory that ultra-high spectral resolution can improve identification and provide more accurate quantitative models. To show distinct improvement between the two different resolution spectrometers, data were taken on the same sample using both instruments. The findings from this increase in spectral resolution of microplastic spectral data indicate that identification will be more accurate when presented with mixture samples, where a problem of mis-identification could occur with standard spectral resolution.
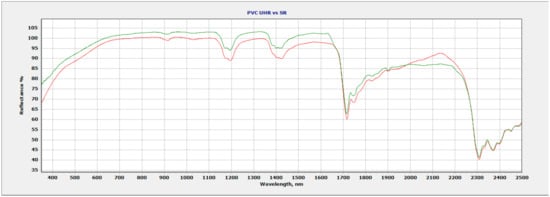
Figure 2.
Ultra-high-resolution data (green) vs. standard resolution spectral data (red) of PVC.
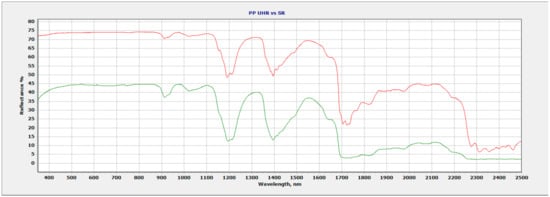
Figure 3.
Ultra-high-resolution data (red) vs. standard spectral resolution data (green) of PP.
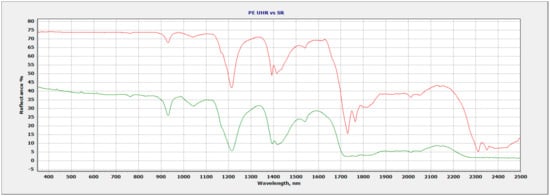
Figure 4.
Ultra-high-resolution data (red) vs. standard spectral resolution data (green) of PE.
The increase in spectral resolution of PVC is shown in Figure 2 where two regions of interest show improvement compared to spectral data taken with a standard resolution instrument (3.0 nm, 8.0 nm, 6 nm). The 1400 nm spectral region improves using ultra-high resolution (1.5 nm, 3.0 nm, 3.8 nm) with the addition of an additional absorption feature at 1386 nm, not seen with the standard spectral resolution. A doublet now appears at 1750 nm, as well as a more defined 1900 nm feature using ultra-high spectral resolution, which is an improvement compared to the standard resolution data.
Figure 3 shows improvement in four different regions throughout the spectrum of PP. The 1200 nm ultra-high-resolution data show a sharper, more well-defined doublet compared to that of the standard resolution data. Additonal absorption features have now developed at the 1400 nm region where a triplet forms using ultra-high resolution, previously shown as a doublet with standard resolution. The 1700 nm region shows great improvement in spectral resolution where the traditional singlet feature using standard resolution has improved with multiple new spectral features at 1715 nm, 1750 nm, and 1760 nm in the ultra-high-resolution data. The final region of interest is the 2300 nm–2500 nm region where the ultra-high resolution shows significant improvement compared to that of the standard resolution where new absorption features are evident.
The spectral data of PE are shown in Figure 4 with two regions of improvement with ultra-high spectral resolution. The 1400 nm absorption feature has an additional absorption feature not seen with standard spectral resolution. Throughout the 1700 nm–2100 nm region, ultra-high resolution offers increased detail in the absorption features and also an additional feature at 1750 nm where a doublet forms. The 1750 nm feature with standard spectral resolution appears only as a single feature.
The increase in spectral resolution compared to the standard resolution of relevant MPs documents how enhanced identification is possible. Figure 5 shows a plot with ultra-high-resolution spectral data of all pure materials used in the study. All pure materials have outlined sections below to describe the specific absorption features seen with using an ultra-high spectral resolution spectrometer.
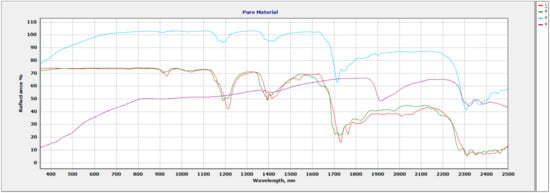
Figure 5.
Plot showing pure vermiculite soil (Purple), polypropylene (PP, Green), low-density polyethylene (LDPE, Red), and polyvinyl chloride (PVC, Blue).
3.2. Vermiculite Soil
The main absorption features of note are seen at 1371 nm, 1394 nm, and 1418 nm due to OH. Water is observed at 1911 nm and can be used as a means for expansion capabilities in the vermiculite. The main Mg-OH features seen at 2320 nm indicate that this vermiculite is Mg-dominant.
3.3. Polypropylene (PP)
Spectral features occur in the 350–2500 nm wavelength range. The main absorption features are seen in the 914 nm–934 nm region, 1020 nm–1052 nm region, 1158 nm–1214 nm region, 1707 nm–1763 nm region, 1824 nm–1983 nm region, and the 2067 nm–2466 nm region.
3.4. Low-Density Polyethylene (LDPE)
Spectral features occur in the 350–2500 nm wavelength range. The main absorption features are seen at 932 nm, 1039 nm, 1166–1217 nm region, 1389 nm–1438 nm region, 1535 nm, 1615 nm, 1726 nm–1835 nm region, 2009 nm–2139 nm region, and the 2308 nm–2343 nm region.
3.5. Polyvinyl Chloride (PVC)
Spectral features occur in the 350–2500 nm wavelength range. The main absorption features occur at 930 nm, 1040 nm, 1210 nm, 1420 nm, and 1730 nm.
3.6. Treated Mixture Samples
Due to the overlapping regions of the vermiculite soil and the plastic polymers, the region of focus for plastic identification and quantification was selected at 1682 nm–1760 nm. This region allowed for discrimination between different polymers based on the wavelength position and shape of the plastic absorption feature. The wavelength and shape of the 1700 nm feature varied between polymers. Figure 6 shows all three mixtures within the full range (350 nm–2500 nm). The vermiculite and PP mixture show two sets of doublet features: 1693 nm–1703 nm and 1722 nm–1734 nm (Figure 7). The LDPE and soil mixture showed a sharp doublet feature at 1729 nm–1764 nm (Figure 8). Finally, the PVC and soil mixture had a higher spectral reflectance than the PP and LDPE mixtures and showed a sharp feature at 1713 nm accompanied by a smaller feature at 1747 nm (Figure 9).
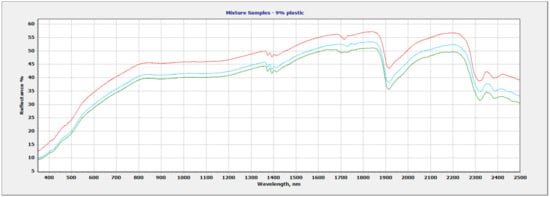
Figure 6.
All three plastic polymer and vermiculite soil mixtures—(red) PVC, (blue) PE, (green) PP.
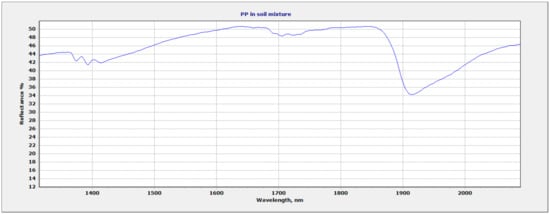
Figure 7.
PP and soil mixture showing 1700 nm region of interest.
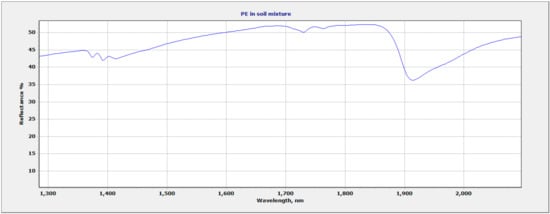
Figure 8.
LDPE and soil mixture showing 1700 nm region of interest.
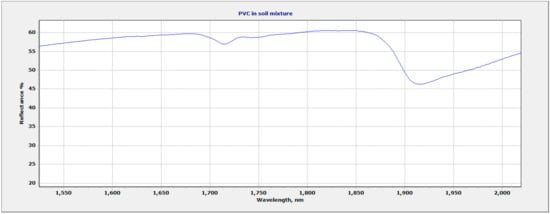
Figure 9.
PVC and soil mixture showing 1700 nm region of interest.
4. Discussion
The main focus of this study is to show how spectral data can be used for quantitative purposes. In order to do so, a chemometric model needed to be built from known calibration samples and then tested to ensure the model was performing accurately. Multivariate statistical approaches [30] and filter selection play a significant role in the calibration method used to analyze spectral data. Eigenvector SOLO+Model Exporter software (Manson, WA, USA) was used to calibrate spectral data using UV–Vis–NIR spectra and their matching laboratory data. Approximately 70% of the data in the data set were used for training and 30% were used for validation. The training set was then analyzed to choose the best pre-treatment options for the prediction spectral wavelength with the PLSR (Partial Least Square Regression) modeling technique. UV–Vis–NIR data quality can be affected by sampling, instrumentation, environment, and other variables. To minimize these effects, preprocessing is needed before modeling. Common preprocessing methods include outlier removal, smoothing techniques to remove noise, derivative techniques to reduce baseline drifting and highlight peak position, and normalization techniques to remove the sampling and laser power fluctuations as well as mean centering. Using SOLO+Model Exporter software), the mixed soil and MP spectral data were preprocessed and a partial least square regression model was built.
4.1. Partial Least Square Regression (PLSR)
Partial Least Square Regression (PLSR) modeling was used to quantify the polymer concentration in the soil. A PLSR model is a statistical modeling technique that projects the targeted variables and observable variables into a new space. It is a bilinear factor model that works by defining covariance pair by pair and is a commonly applied multivariate technique in soil spectroscopy analysis [31]. A PLSR is commonly applied when variables are highly correlated. The PLSR model seeks to maximize the covariance between the predictor (X-block, NIR spectra) and response variables (Y-block, concentration). The application of PLSR has been proven to be useful in studies where many predictor variables outnumber the observations. PLSR in this paper is implemented with the SOLO software from Eigenvector Inc. using the SIMPLS algorithm to calculate the PLSR factors [32].
Several performance matrices were used to evaluate the model quality including the root mean square error (RMSE) and the coefficient of determination (R2). The equations are as follows:
where yi hat indicates the values estimated by the model, yi indicates the observed values, and N is the number of observations of the variable to be modeled.
4.2. Modeling
An individual model was built with calibration samples per polymer to test the detection limit of the oreXpert. After model optimization was complete with validation samples, the oreXpert provided an increased detection limit down to a 0.5% concentration range. Figure 10 shows the prediction model built for PP with an R2 prediction value of 0.943. The calculated and measured data points are separated by two different variables. Figure 11 shows the prediction model built for PVC producing an increased R2 prediction value of 0.983. Finally, the LDPE prediction model showed similar results as the LDPE with an R2 prediction value of 0.957 (Figure 12).
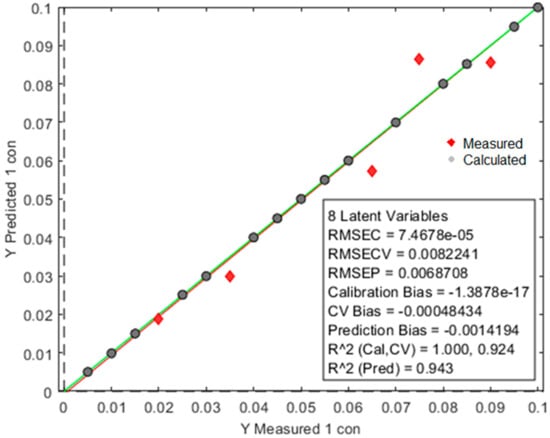
Figure 10.
The prediction model built for PP has an R2 prediction value of 0.943.
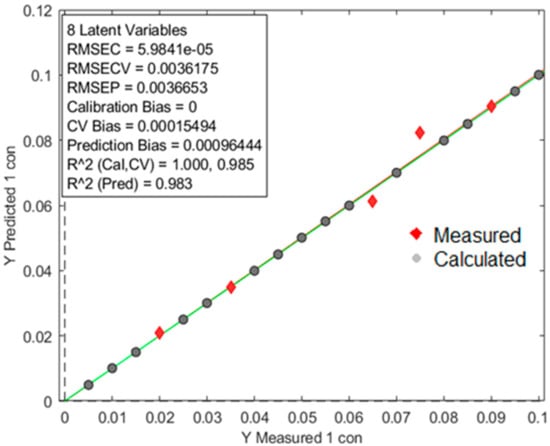
Figure 11.
The prediction model built for PVC showing an R2 prediction value of 0.983. The image above is a visual representation of the two distinct data sets; the red diamonds represent measurements originating from test samples and the gray circles are data points obtained from the model. The characteristics of the model can be observed in the square box above.
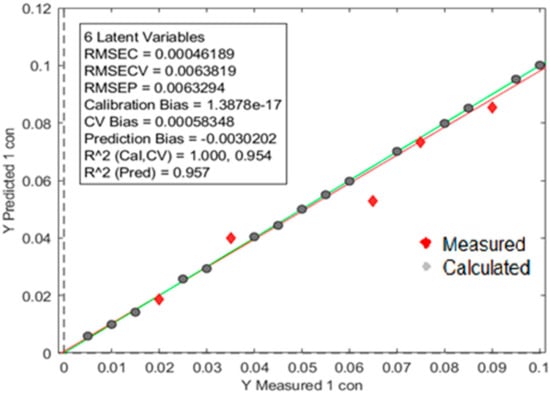
Figure 12.
The prediction model built for LDPE showing an R2 prediction value of 0.957. The image above is a visual representation of the two distinct data sets; the red diamonds represent measurements originating from test samples and the gray circles are data points obtained from the model. The characteristics of the model can be observed in the square box above.
The image above is a visual representation of the two distinct data sets; the red diamonds represent measurements originating from test samples and the gray circles are data points obtained from the model. The characteristics of the model can be observed in the square box above.
4.3. Real-Time Quantification
Our results and analyses produced a spectral library that consists of all the spectral data measured in the experiment. Utilizing Spectral Evolution’s DARWin software and EZ-ID identification software, the oreXpert was able to simultaneously identify and quantify microplastic contamination within three seconds of the measurement being taken. The oreXpert used the spectral data that were cataloged as a reference point and compared all the catalog spectra to the one being measured, providing an output that most closely resembled the spectra that were generated. The generation of a spectral library in tandem with other software can allow for the identification and quantification of microplastic contaminants. This approach provides a nondestructive method for MP identification and quantification. The preservation of MP samples means that temporal analysis and studies can be conducted using the same samples. This is not the case with other current methods of MP analysis, e.g., gas chromatography and similar methods that destroy the samples.
Within the DARWin acquisition software is an option to import prediction models in .xml format. After the individual polymer models were built using SOLO+Model Exporter, they were exported to DARWin to use in real time as spectral data were being collected from test samples. The test samples were important to this research to test the accuracy of the models built and for the initial findings of the detection limits of the oreXpert™, which can be further researched.
Results were promising using the real-time quantification tool. Figure 13 shows the actual vs. predicted concentration of the polypropylene/soil mixture samples. The prediction model for polypropylene performed well within +/−1.5% error. The real-time quantification PVC results are shown in Figure 14 where the prediction model performed exceedingly well with less than a 1% error. Figure 15 shows the performance of the polyethylene model with a +/−1.7% error within the actual vs. predicted samples.
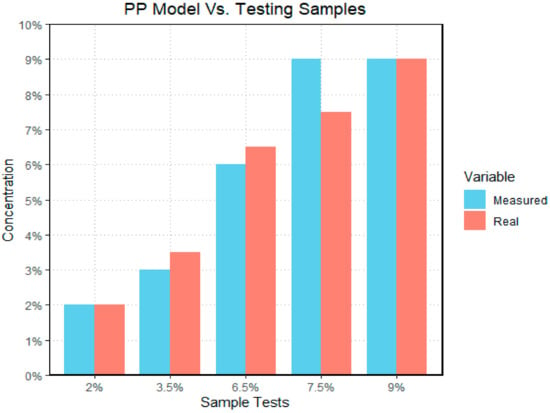
Figure 13.
The bar graph illustrates the difference between measured and real PP data sets; with the y-axis representing the concentration of microplastics by mass in each sample, and the x-axis representing the different sample tests. The “real” data set represents the actual concentration of the test sample, and the measured data set represents the outcome generated by the model. In the case of polypropylene, the model had its largest difference when examining the 7.5% sample.
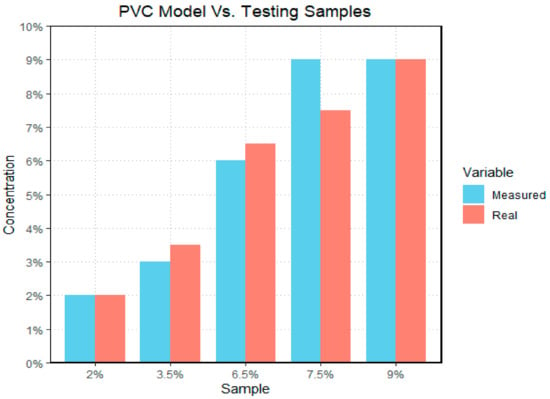
Figure 14.
The bar graph illustrates the difference between measured and real PVC data sets; with the y-axis representing the concentration of microplastics by mass in each sample, and the x-axis representing the different sample tests. The “real” data set represents the actual concentration of the test sample, and the measured data set represents the outcome generated by the model. In the case of polyvinyl chloride, the model had its largest difference when examining the 7.5% sample.
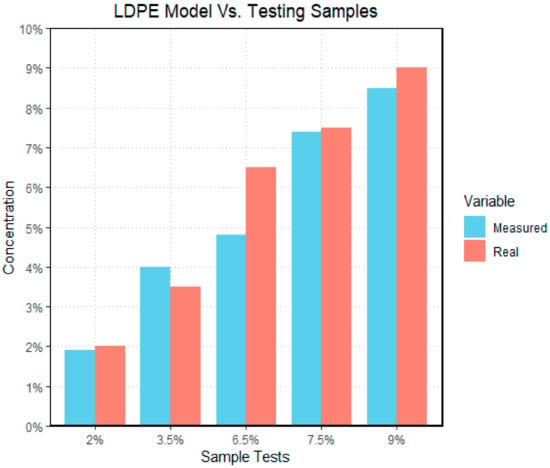
Figure 15.
The bar graph above illustrates the difference between measured and real LDPE data sets; with the y-axis representing the concentration of microplastics by mass in each sample, and the x-axis representing the different sample tests. The “real” data set represents the actual concentration of the test sample, and the measured data set represents the outcome generated by the model. In the case of low-density polyethylene, the model had its largest difference when examining the 6.5% sample.
The ability for real-time MP quantification will allow for MP identification and quantification in situations where sample collection is not possible or difficult. For example, this method could be used with portable spectrometers in several different media including MP particulate movement in various liquids.
4.4. Applicability of UV–Vis–NIR Spectroscopy for Microplastic Identification
UV–Vis–NIR spectroscopy was successfully applied in tandem with model generation for MP quantification and identification. A field portable spectrometer and associated software allowed the quantification and identification to be performed quickly when compared to more traditional methods. The main time requirement for the methods used in this study is the generation and training of the model. However, this is still much faster, and often more accurate, than most other current MP identification methods such as MP visual identification using microscopic analysis. Microplastics can be observed in several different types of environmental media ranging from abiotic to biotic matrices, resulting in many different extraction or purification techniques to examine microplastics [33]. Overall, the addition of full-range spectrographic measurements to existing microplastic methodologies can improve the accuracy of studies and allow for quicker identification of microplastic particles. The application of full-range spectroscopy in studies focusing on the purification of organic matter could allow for quicker identification of microplastics post-purification than traditional means, such as gas chromatography.
Karami et al. [34] used acids or bases to digest organic matrices. The microplastics recovered from acid or alkaline digestion can then be examined by a mass spectrometer to allow for the identification of microplastic polymers quickly using full-range spectroscopy. The microplastic soil study conducted by Liu et al. [35] focused on the identification of microplastics and meso plastics in farmland soils; their study involved taking soil samples and identifying the plastics using µ-FT-IR spectroscopy, but with the application of a portable full-range spectrometer, measurements could have been taken in the field in addition to sample collection. Tian et al. [36] discuss the various pathways of microplastic contamination in agricultural soils, but the application of full-range spectroscopy in agricultural fields could help determine the origin of selected microplastic particles. The application of machine learning (e.g., [13]) and full-range spectroscopy will allow for even faster identification and quantification of MPs.
Our study also demonstrates that full-range ultra-high-resolution spectroscopy can serve as an additional tool for MP researchers performing light microscopy, other spectroscopic methods, or even gas chromatography for increased accuracy of MP identification. However, the results of the model can only be as accurate as the data entered. Inaccurate data may thus cause the model to misidentify plastic polymer types or misquantify the MP concentration present in a sample. Therefore, it is crucial to thoroughly test the model with a known, accurately measured sample in addition to the calibration sample set.
Our testing of the individual linear regression models showed promising results. We successfully generated three different linear regression models, one for each of the following polymers: polypropylene, polyvinyl chloride, and polyethylene. All of these are common plastics found in sedimentary environments (e.g., [19,28,29]). Each of the models has a coefficient of determination (R2) above 0.9, indicating that the variance of the dependent variable is negligible. Also, each of the models was able to correctly identify the MP particulates in the treatment samples for each of the three polymers. The models were also able to identify the relative percentage of MPs present in each sample, although the accuracy of the models varied with the relative value of the coefficient of determination. The most accurate model was for polyvinyl chloride, which has the highest R2 value of 0.983. However, given that all three models were able to quantify the MPs to within a standard deviation of 0.1 percent indicates that this method has great potential as a research tool for rapid and non-destructive MP identification and quantification.
5. Conclusions and Future Directions
Our study supports several previous studies that have shown that spectroscopy can be used to identify and even quantify MP polymers in various kinds of soil media [12,13,14,15]. Specifically, our findings closely align with a recent study by Huda et al. [17] that used experiments on treated beach sediment to successfully generate predictive models to quantify LDPE and PET microplastics. Similarly, another recent study, by Marchesi et al. (2023), also applied chemometric and predictive models to successfully quantify PP, PET, and PS in experimental mixtures. However, none of the studies cited above utilized the full-spectrum (UV–Vis–NIR) or ultra-high-resolution instrumentation that was used for our research. In our study, we were able to identify and quantify MPs even at quite low concentrations of less than 1%. Similarly, Corradini et al. [12] found a detection limit of 15 g/kg using Vis–NIR to analyze PET, PVC, and LDPE. Zhao et al. [20] also found detection limits in the 1–3% range.
This approach has great potential for rapid, low-cost, non-destructive, and accurate use for MP analysis compared to the traditional methods described in Junhao et al. [16]. Our findings, in conjunction with other studies cited above, indicate that technological improvements such as increased portability, higher resolution, and increased spectral breadth will lead to improved accuracy and reliability of MP identification and quantification.
The application of full-range spectroscopy for MP identification and quantification is a relatively new concept, and future work needs to be conducted on the spectral characteristics of polymers, and how the spectral signals of MP are changed with exposure to chemical and physical weathering. Furthermore, plastics can be semi-crystalline to amorphous so the ability to detect MP contamination could be strongly related to the physical characteristics of the polymers. As the soil used here was pure vermiculite, future work needs to be conducted on other soil types, with different characteristics (e.g., kaolinite, quartz, even natural soils) to ensure that the application of full-range spectroscopy can be used in multiple media for MP detection and quantification. The use of PSLR modeling for spectral data is a widely used technique, but the use of newer modeling techniques may yield better results for MP detection.
Author Contributions
Conceptualization, all authors; methodology, L.S.P.; software, L.S.; data analysis L.S., L.S.P., and J.A.C.; resources, L.S.P.; data curation, L.S.P. and J.A.C.; writing—original draft preparation, L.S.P., M.L.M., and J.A.C.; writing—review and editing, L.S.P., M.L.M., and J.A.C.; visualization. All authors have read and agreed to the published version of the manuscript.
Funding
This research was self-funded.
Institutional Review Board Statement
Not applicable.
Informed Consent Statement
Not applicable.
Data Availability Statement
Data are available from L.S.P. and J.A.C.
Acknowledgments
We would like to thank our colleagues Douglas Hayes, Anton Astner, and Abimbola Ajibola for their very valuable assistance and use of their lab and equipment. We also thank the following UT students for their valuable help with the lab work: Laura Mae Ferguson and Madison Turner. We thank Spectral Evolution for permission to use their instrumentation and expertise.
Conflicts of Interest
The authors declare no conflicts of interest.
References
- Rillig, M.; Kim, S.; Zhu, Y. The soil plastisphere. Nat. Rev. Microbiol. 2023, 22, 64–74. [Google Scholar] [CrossRef] [PubMed]
- Li, J.; Liu, H.; Paul Chen, J. MPs in freshwater systems: A review on occurrence, environmental effects, and methods for MPs detection. Water Res. 2018, 137, 362–374. [Google Scholar] [CrossRef] [PubMed]
- Cole, M.; Lindeque, P.; Halsband, C.; Galloway, T.S. MPs as contaminants in the marine environment: A review. Mar. Poll. Bull. 2011, 62, 2588–2597. [Google Scholar] [CrossRef] [PubMed]
- Gola, D.; Kumar Tyagi, P.; Arya, A.; Chauhan, N.; Agarwal, M.; Singh, S.K.; Gola, S. The impact of microplastics on marine environment: A review. In Environmental Nanotechnology, Monitoring and Management; Elsevier B.V.: Amsterdam, The Netherlands, 2021; Volume 16. [Google Scholar] [CrossRef]
- Andrady, A.L. MPs in the marine environment. Mar. Pollut. Bull. 2011, 62, 1596–1605. [Google Scholar] [CrossRef] [PubMed]
- Bellasi, A.; Binda, G.; Pozzi, A.; Galafassi, S.; Volta, P.; Bettinetti, R. Microplastic contamination in freshwater environments: A review, focusing on interactions with sediments and benthic organisms. Environments 2020, 7, 30. [Google Scholar] [CrossRef]
- Kappler, A.; Fischer, D.; Oberbeckmann, S.; Schernewski, G.; Labrenz, M.; Eichhorn, K.J.; Voit, B. Analysis of environmental microplastics by vibrational microspectroscopy: FTIR, Raman or both? Anal. Bioanal. Chem. 2016, 408, 8377–8391. [Google Scholar] [CrossRef] [PubMed]
- Bläsing, M.; Amelung, W. Plastics in soil: Analytical methods and possible sources. Sci. Total Environ. 2018, 612, 422–435. [Google Scholar] [CrossRef] [PubMed]
- Cincinelli, A.; Scopetani, C.; Chelazzi, D.; Martellini, T.; Pogojeva, M.; Slobodnik, J. Microplastics in the Black Sea sediments. Sci. Total Environ. 2021, 760, 143898. [Google Scholar] [CrossRef] [PubMed]
- Primpke, S.; Lorenz, C.; Rascher-Friesenhausen, R.; Gerdts, G. An automated approach for microplastics analysis using focal plane array (FPA) FTIR microscopy and image analysis. Anal. Methods 2017, 9, 1499–1511. [Google Scholar] [CrossRef]
- Cho, M.-H.; Song, Y.-J.; Rhu, C.-J.; Go, B.-R. Pyrolysis Process of Mixed Microplastics Using TG-FTIR and TED-GC-MS. Polymers 2023, 15, 241. [Google Scholar] [CrossRef]
- Corradini, F.; Bartholomeus, H.; Huerta Lwanga, E.; Gertsen, H.; Geissen, V. Predicting soil microplastic concentration using vis-NIR spectroscopy. Sci. Total Environ. 2019, 650, 922–932. [Google Scholar] [CrossRef] [PubMed]
- Ng, W.; Minasny, B.; McBratney, A. Convolutional neural network for soil microplastic contamination screening using infrared spectroscopy. Sci. Total Environ. 2020, 702, 134723. [Google Scholar] [CrossRef] [PubMed]
- Paul, A.; Wander, L.; Becker, R.; Goedecke, C.; Braun, U. High-throughput NIR spectroscopic (NIRS) detection of microplastics in soil. Environ. Sci. Pollut. Res. 2019, 26, 7364–7374. [Google Scholar] [CrossRef] [PubMed]
- Wander, L.; Lommel, L.; Paul, A. Development of a low-cost method for quantifying microplastics in soils and compost using near-infrared spectroscopy. Meas. Sci. Technol. 2022, 33, 075801. [Google Scholar] [CrossRef]
- Junhao, C.; Xining, Z.; Xiaodong, G.; Li, Z.; Qi, H.; Siddique, K.H. Extraction and identification methods of microplastics and nanoplastics in agricultural soil: A review. J. Environ. Manag. 2021, 294, 112997. [Google Scholar] [CrossRef] [PubMed]
- Huda, F.; Richard, F.; Rahman, I.; Moradi, S.; Hua, C.; Muller, M. Comparison of learning models to predict LDPE, PET, and ABS concentrations in beach sediment based on spectral reflectance. Sci. Rep. 2023, 13, 6258. [Google Scholar] [CrossRef] [PubMed]
- Marchesi, C.; Rani, M.; Federici, S.; Alessandri, I.; Vassalini, I.; Deperoa, L. Quantification of ternary microplastic mixtures through an ultra-compact near-infrared spectrometer coupled with chemometric tools. Environ. Res. 2023, 216, 114632. [Google Scholar] [CrossRef] [PubMed]
- Okoffo, E.D.; Tan, E.; Grinham, A.; Gaddam, S.M.R.; Yip, J.Y.H.; Twomey, A.J.; Thomas, K.V.; Bostock, H. Plastic pollution in Moreton Bay sediments, Southeast Queensland, Australia. Sci. Total Environ. 2024, 920, 170987. [Google Scholar] [CrossRef] [PubMed]
- Zhao, S.; Zhang, Y.; Qiu, Z.; He, Q.; Zhang, Y. Towards a fast and generalized microplastic quantification method in soil using terahertz spectroscopy. Sci. Total Environ. 2022, 841, 156624. [Google Scholar] [CrossRef] [PubMed]
- Asamoah, B.O.; Uurasjärvi, E.; Räty, J.; Koistinen, A.; Roussey, M.; Peiponen, K.-E. Towards the development of portable and in situ optical devices for detection of micro and nanoplastics in water: A review on the current status. Polymers 2021, 13, 730. [Google Scholar] [CrossRef]
- Correia, R.M.; Tosato, F.; Domingos, E.; Rodrigues, R.R.T.; Aquino, L.F.M.; Filgueiras, P.R.; Lacerda, V.; Romao, W. Portable near infrared spectroscopy applied to quality control of Brazilian coffee. Talanta 2018, 176, 59–68. [Google Scholar] [CrossRef]
- Rani, M.; Marchesi, C.; Federici, S.; Rovelli, G.; Alessandri, I.; Vassalini, I.; Ducoli, S.; Borgese, L.; Zacco, A.; Bilo, F.; et al. Miniaturized near-infrared (MicroNIR) spectrometer in plastic waste sorting. Materials 2019, 12, 2740. [Google Scholar] [CrossRef] [PubMed]
- Yang, Y.; Zhang, X.; Yin, J.; Yu, X. Rapid nondestructive on-site classification method for consumer-grade plastics based on portable NIR spectrometer machine learning. J. Spectrosc. 2020, 2020, 6631234. [Google Scholar] [CrossRef]
- Colton, J.B.; Knapp, F.D.; Burns, B.R. Plastic particles in surface waters of the northwestern Atlantic. Science 1974, 185, 491–497. [Google Scholar] [CrossRef] [PubMed]
- Rillig, M.C. Microplastic in terrestrial ecosystems and the soil? Environ. Sci. Technol. 2012, 46, 453–6454. [Google Scholar] [CrossRef] [PubMed]
- Machado, A.A.; Kloas, W.; Rillig, M.C. Microplastics as an emerging threat to terrestrial ecosystems. Glob. Change Biol. 2018, 24, 1405–1416. [Google Scholar] [CrossRef] [PubMed]
- Neelavannan, K.; Achyuthan, H.; Sen, I.S.; Krishnakumar, S.; Gopinath, K.; Dhanalakshmi, R.; Rajalakshmi, P.; Sajeev, R. Distribution and characterization of plastic debris pollution along the Poompuhar Beach, Tamil Nadu, South India. Mar. Poll. Bull. 2022, 175, 113337. [Google Scholar] [CrossRef] [PubMed]
- Pakhomova, S.; Zhdanov, I.; van Bavel, B. Polymer Type Identification of Marine Plastic Litter Using a Miniature Near-Infrared Spectrometer (MicroNIR). Appl. Sci. 2020, 10, 8707. [Google Scholar] [CrossRef]
- Geladi, P. Chemometrics in spectroscopy. Part 1. Classical chemometrics. Spectrochim. Acta Part B At. Spectrosc. 2003, 58, 767–782. [Google Scholar] [CrossRef]
- Singha, C.; Swain, K.C.; Sahoo, S.; Govind, A. Prediction of Soil Nutrients through PLSR and SVMR Models by VIs-NIR Reflectance Spectroscopy. Egypt. J. Remote. Sens. Space Sci. 2023, 26, 901–918. [Google Scholar] [CrossRef]
- De Jong, S. SIMPLS: An alternative approach to partial least squares regression. Chemom. Intell. Lab. Syst. 1993, 18, 251–263. [Google Scholar] [CrossRef]
- Zarfl, C. Promising techniques and open challenges for microplastic identification and quantification in environmental matrices. Anal. Bioanal. Chem. 2019, 411, 3743–3756. [Google Scholar] [CrossRef] [PubMed]
- Karami, A.; Golieskardi, A.; Choo, C.K.; Romano, N.; Bin, H.Y.; Salamatinia, B. A high-performance protocol for extraction of microplastics in fish. Sci Total Environ. 2017, 578, 485–494. [Google Scholar] [CrossRef] [PubMed]
- Liu, M.; Lu, S.; Song, Y.; Lei, L.; Hu, J.; Lv, W.; Zhou, W.; Cao, C.; Shi, H.; Yang, X.; et al. Microplastic and mesoplastic pollution in farmland soils in suburbs of Shanghai, China. Environ. Pollut. 2018, 242, 855–862. [Google Scholar] [CrossRef] [PubMed]
- Tian, L. Microplastics in agricultural soils: Sources, effects, and their fate. Curr. Opin. Environ. Sci. Health 2022, 25, 100311. [Google Scholar] [CrossRef]
Disclaimer/Publisher’s Note: The statements, opinions and data contained in all publications are solely those of the individual author(s) and contributor(s) and not of MDPI and/or the editor(s). MDPI and/or the editor(s) disclaim responsibility for any injury to people or property resulting from any ideas, methods, instructions or products referred to in the content. |
© 2024 by the authors. Licensee MDPI, Basel, Switzerland. This article is an open access article distributed under the terms and conditions of the Creative Commons Attribution (CC BY) license (https://creativecommons.org/licenses/by/4.0/).