Abstract
Efficient clustering is essential for reducing energy consumption and extending the operational lifetime of Wireless Sensor Networks. Classical protocols such as LEACH, PEGASIS, HEED, and EEHC frequently exhibit unbalanced energy usage, resulting in early node failures and reduced communication reliability. This study introduces an Enhanced Grey Wolf Optimization-based Neural Network (EGWO-NN) designed to adaptively select cluster heads by continuously optimizing decision parameters according to real-time network conditions. The proposed method is evaluated against four benchmark protocols using statistical comparisons of node survivability, transmission energy, and communication performance. Results show that EGWO-NN sustains significantly more alive nodes per round, with strong statistical differences compared with LEACH, PEGASIS, HEED, and EEHC (t = 18.27, 9.94, 18.91, 18.93; p < ). Transmission energy analysis similarly indicates significant improvements across all pairwise tests (|t| = 4.12–46.34; p < ), supported by an overall ANOVA result (F = 14.74, p = ). EGWO-NN also enhances data delivery, outperforming baseline protocols in both packets sent and Packet Delivery Ratio, with highly significant differences (t = 17.62–19.75 and 11.25–22.89). These findings demonstrate that EGWO-NN provides a robust and scalable approach for improving energy efficiency and communication reliability in WSNs.
1. Introduction
Wireless Sensor Networks (WSNs) have emerged as an essential enabling technology for numerous applications, including environmental monitoring, healthcare, industrial automation, smart agriculture, and military surveillance. Despite their broad applicability, WSNs encounter significant limitations, primarily energy constraints, limited network lifetime, and inefficient routing, due to the limited battery capacities of sensor nodes [1,2]. Consequently, researchers have extensively explored various techniques to improve energy efficiency, prolong network lifetime, and ensure reliable data transmission [3].
Among these techniques, hierarchical clustering algorithms have received considerable attention due to their inherent capability to manage energy consumption effectively. Prominent examples include LEACH (Low-Energy Adaptive Clustering Hierarchy) [4], PEGASIS (Power-Efficient Gathering in Sensor Information Systems) [5], HEED (Hybrid Energy-Efficient Distributed clustering) [6], and EEHC (Energy-Efficient Hierarchical Clustering) [7]. Although these clustering algorithms provide improvements over traditional flat-based routing, they generally employ static probabilistic models or simplified heuristics [8], which do not dynamically adapt to changing network conditions. Consequently, these methods often fail to optimize cluster-head (CH) selection dynamically, leading to rapid energy depletion, unbalanced load distribution, and ultimately limited network lifetime [9].
Recent advancements have indicated that integrating optimization algorithms inspired by biological or swarm intelligence, such as Genetic Algorithms (GAs) [10], Particle Swarm Optimization (PSO) [11,12], and Grey Wolf Optimization (GWO) [13,14], with adaptive machine learning techniques like neural networks (NNs), offers promising results to overcome the above-mentioned limitations [15]. However, most existing studies either employ static heuristics or implement probabilistic models with limited adaptivity, resulting in suboptimal energy management over long-term network operation [16]. Additionally, the existing literature has not adequately explored the implications of dynamically optimizing neural network parameters in real-time CH selection scenarios.
To further clarify the research gap, existing approaches can be broadly classified into optimization-only methods and learning-based methods. Optimization-only approaches, such as GA-, PSO-, and GWO-based clustering, primarily focus on directly optimizing CH selection decisions using handcrafted fitness functions and iterative search mechanisms [3]. While effective in specific scenarios, these methods optimize decisions themselves rather than the decision-making model, and therefore require repeated re-optimization without retaining transferable knowledge across rounds.
In contrast, learning-based approaches, including neural networks and reinforcement learning, aim to learn mappings between network states and actions; however, most existing studies rely on offline-trained or statically parameterized models whose parameters remain fixed during network operation [16]. Consequently, both categories lack continuous co-adaptation, where the decision-making model itself is dynamically optimized in response to evolving network conditions. This limitation motivates the proposed EGWO-NN framework, which explicitly targets the online optimization of neural network parameters, enabling sustained adaptivity across WSN operational rounds.
Motivated by these gaps, this study addresses the following research questions:
- RQ1: How effectively can Enhanced Grey Wolf Optimization (EGWO) dynamically optimize neural network parameters across operational rounds in WSNs to improve energy efficiency and network lifetime?
- RQ2: To what extent does the adaptive EGWO-NN approach outperform conventional hierarchical clustering methods (LEACH, PEGASIS, HEED, and EEHC) in terms of network lifetime and Packet Delivery Ratio (PDR)?
- RQ3: How does the convergence characteristic of EGWO influence stability and efficiency in neural network parameter optimization within WSN scenarios?
To address the limitations inherent in conventional clustering protocols such as LEACH and PEGASIS, this study proposes a novel adaptive approach by integrating Enhanced Grey Wolf Optimization into neural network-based cluster-head selection. Unlike traditional heuristic-based methods relying on static probabilities, the EGWO-NN approach dynamically optimizes neural network parameters across WSN operational rounds, explicitly aiming to enhance critical network performance metrics.
The novelty of our proposed method lies primarily in the two following aspects.
Integration of EGWO for real-time neural network parameter optimization: The proposed EGWO-NN algorithm provides a dynamic optimization strategy rather than relying on static probabilities or simple heuristic formulas commonly found in the existing literature. This design choice is further motivated by prior empirical evidence demonstrating that static probabilistic clustering, such as the p-value-based cluster-head selection in LEACH, may lead to unstable CH distribution and suboptimal energy use under varying network conditions [17]. Furthermore, our earlier work on EGWO for transmission power optimization in WSNs has shown that transmission operations consume significantly more energy compared to reception or computation, underscoring the importance of adaptive optimization mechanisms in reducing unnecessary transmission overhead [18]. Building on these findings, the EGWO-NN framework introduced in this paper dynamically adjusts neural network parameters across operational rounds to improve energy efficiency and prolong network lifetime.
Comprehensive reflection of the network lifetime objective: The proposed approach explicitly considers network overhead, cluster-head overhead, and energy efficiency through extensive simulation scenarios. This emphasis aligns with earlier evidence that transmission power dominates total energy consumption in WSN operations, and that even small reductions in per-round transmit energy can yield significant lifetime improvements [18]. By incorporating EGWO-driven adaptive neural parameter updates, the proposed method better captures the dynamic interplay between transmission cost, CH role assignment, and overall network stability, resulting in a more accurate and holistic optimization of network lifetime.
This study contributes by providing an adaptive machine-learning-driven framework that leverages EGWO for neural network parameter optimization. Empirical simulation results and mathematical analyses demonstrate that EGWO-NN significantly outperforms traditional clustering algorithms (LEACH, PEGASIS, HEED, and EEHC) in terms of critical performance metrics, including network lifetime and Packet Delivery Ratio (PDR). Furthermore, rigorous mathematical convergence analysis and clearly defined objectives, along with an energy-based reward/punishment mechanism, validate the effectiveness and robustness of our proposed method.
The remainder of this paper is structured as follows: the next section presents the detailed methodology, including benchmark protocols and the proposed EGWO-NN method. Subsequent sections provide experimental results, discussion, and finally conclusions with future research directions.
2. Materials and Methods
This section describes the methodological framework of this study. It begins with an overview of the benchmark clustering protocols used for comparison, followed by a detailed description of the proposed EGWO-NN architecture. The section then explains the EGWO-based parameter optimization process, neural decision-making rules, and the simulation and statistical evaluation procedures adopted to ensure reproducibility.
2.1. Benchmark Protocols
To evaluate the effectiveness of the proposed EGWO-NN approach, we compare it against several well-established hierarchical clustering algorithms in Wireless Sensor Networks: LEACH, PEGASIS, HEED, and EEHC. The following subsections provide a brief overview of each method, including relevant mathematical formulations and illustrative diagrams.
Table 1 provides a comparative summary of the benchmark WSN clustering protocols considered in this study, highlighting their main design characteristics and the rationale for their selection. This summary is intended to give readers a concise overview before the detailed descriptions presented in the following subsections.

Table 1.
Comparative summary of benchmark WSN clustering protocols. Abbreviations: LEACH (Low-Energy Adaptive Clustering Hierarchy), PEGASIS (Power-Efficient Gathering in Sensor Information Systems), HEED (Hybrid Energy-Efficient Distributed clustering), and EEHC (Energy-Efficient Hierarchical Clustering).
2.1.1. LEACH
LEACH is a pioneering hierarchical clustering algorithm introduced by Heinzelman [4]. It randomly rotates CHs based on probabilistic thresholding to distribute energy consumption evenly among sensor nodes. The threshold function used by LEACH for CH selection is defined as
In Equation (1), p denotes the desired percentage of CH nodes, r represents the current round number, and G is the set of nodes that have not been selected as CHs in the previous rounds. This threshold mechanism ensures a randomized and fair rotation of the CH role among sensor nodes.
Figure 1 illustrates the LEACH clustering mechanism, showing the formation of clusters, CH selection, and data transmission to the base station.
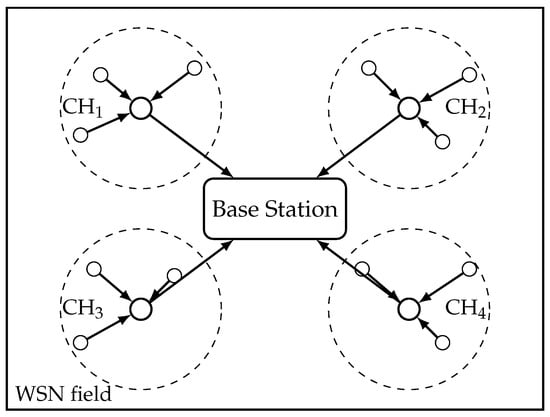
Figure 1.
LEACH clustering mechanism with the base station positioned at the center of the WSN field. All clusters, member nodes, and routing paths remain within the field boundaries.
2.1.2. PEGASIS
PEGASIS, proposed by Lindsey and Raghavendra [5], constructs a chain among sensor nodes to minimize communication overhead and improve energy efficiency. Nodes only communicate with their nearest neighbor, and only one node (leader) transmits data to the sink in each round.
The chain formation follows the minimum distance criterion, computed as
In Equation (2), and denote the spatial coordinates of nodes i and j, respectively. This distance metric is used to construct the communication chain by iteratively connecting each node to its nearest neighbor.
Figure 2 provides a conceptual representation of PEGASIS:
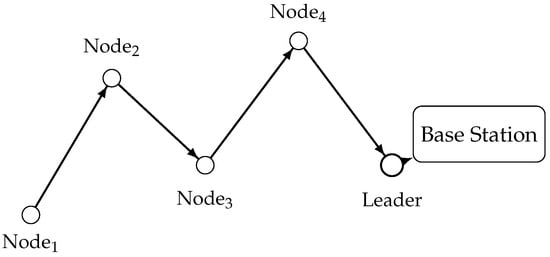
Figure 2.
PEGASIS chain formation diagram with labeled nodes showing sequential transmission toward the leader node.
2.1.3. HEED
HEED, introduced by Younis and Fahmy [6], employs residual energy as the primary parameter and node proximity as a secondary parameter for CH selection. The probability of a node becoming a CH is computed as defined in Equation (3):
In Equation (3), denotes the initial cluster-head probability, represents the residual energy of a node, and is the maximum node energy in the network. This formulation biases CH selection toward nodes with higher remaining energy, thereby promoting a more balanced energy consumption across the WSN.
Figure 3 illustrates HEED clustering.
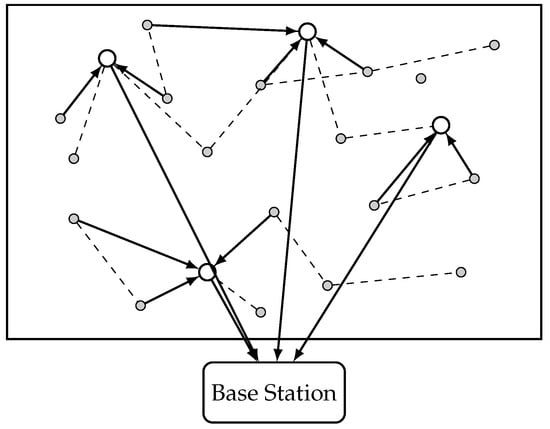
Figure 3.
Conceptual illustration of the HEED clustering approach. Solid arrows indicate data transmission paths (sensor nodes to cluster-heads and cluster-heads to the base station), whereas dashed lines represent neighborhood connectivity used during HEED clustering and coordination.
2.1.4. EEHC
EEHC is a distributed clustering algorithm designed by Bandyopadhyay and Coyle [7]. EEHC constructs multi-level hierarchical clustering, where clusters are recursively formed to balance energy consumption effectively. EEHC calculates the probability of a node becoming a CH using the following relation:
In Equation (4), k is a constant related to the desired number of clusters, d denotes the number of hierarchical levels, and n represents the total number of sensor nodes in the network. This formulation enables EEHC to regulate CH density across different hierarchy levels, contributing to improved energy balance in large-scale WSNs.
Figure 4 presents the EEHC hierarchy formation.
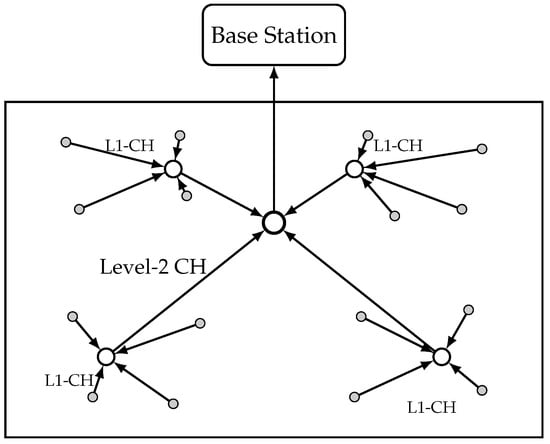
Figure 4.
EEHC hierarchical clustering diagram. Ordinary sensor nodes transmit to Level-1 cluster-heads (L1-CHs), which forward aggregated data to a Level-2 cluster-head (L2-CH) before transmission to the base station.
2.2. Proposed EGWO-NN Method
This section presents the proposed adaptive cluster-head selection framework, which integrates neural networks (NN) optimized by Enhanced Grey Wolf Optimization (EGWO) to dynamically adjust CH selection decisions in WSNs. The adaptivity of the proposed approach arises from continuous neural network parameter optimization across operational rounds, rather than from changes in the underlying single-hop communication topology.
2.2.1. Overview of Proposed Framework
The EGWO-NN framework consists of two primary components:
1. Enhanced Grey Wolf Optimization (EGWO) algorithm that dynamically optimizes neural network parameters; 2. Feedforward neural network to determine cluster-heads and data routing paths.
Figure 5 illustrates the overall framework of EGWO-NN:
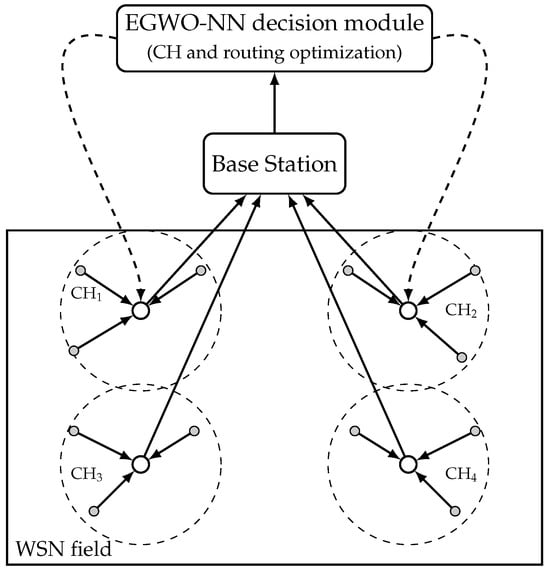
Figure 5.
Overall EGWO-NN framework: single-hop clustering as in LEACH, where the base station runs an EGWO-NN decision module to optimize cluster-head selection and routing.
The EGWO algorithm iteratively optimizes the NN parameters based on a fitness function that reflects network lifetime and energy efficiency. The optimized NN then makes decisions regarding CH selection and routing paths for data transmission.
2.2.2. Enhanced Grey Wolf Optimization (EGWO)
EGWO [18] is an advanced variant of the traditional Grey Wolf Optimization (GWO) algorithm proposed by Mirjalili [19], designed for improved convergence and adaptability to dynamic environments.
EGWO is a swarm intelligence algorithm inspired by the hierarchical leadership and group hunting behavior of grey wolves. The population is divided into four roles:
- : best solution (leader);
- : second-best solution;
- : third-best solution;
- : remaining wolves (followers).
In the proposed EGWO-NN framework, each wolf encodes a candidate neural network parameter vector of size :
In Equation (5), represents the position of the i-th wolf in the search space, where each element corresponds to a neural network parameter. All parameters are initialized within the normalized range to ensure a bounded and uniform search space during EGWO optimization.
Notation
Table 2 summarizes the mathematical symbols used in the EGWO formulation.
Table 2.
Summary of notation used in GWO/EGWO equations.
Distance Computation
Each wolf computes its distance to the three leader wolves using the distance formulation defined in Equations (6)–(8):
Position Update Mechanism
Coefficient Vectors
Exploration and exploitation in EGWO are controlled by cosine-adaptive coefficients rather than the linear decay used in the standard GWO. The adaptive control parameter is defined as shown in Equation (13):
where t is the current iteration and T is the maximum number of iterations.
Using the adaptive parameter in Equation (13), the coefficient vectors are computed as follows:
with . A large encourages exploration, whereas promotes exploitation. The vectors introduce random oscillation around leader solutions, enhancing search diversity.
Enhanced GWO (EGWO)
In EGWO, the standard GWO update rules given in Equations (6)–(15) are adaptively modified to the following:
- Strengthen early exploration while avoiding premature convergence;
- Enhance late-stage exploitation for finer convergence;
- Weight the influence of based on their improvement rates.
Accordingly, each agent’s 12-dimensional neural network parameter vector is iteratively optimized under EGWO dynamics to produce more energy-efficient cluster-head selection and routing decisions.
2.2.3. Neural Network Model for CH Selection and Routing
Figure 6 illustrates the architecture of the feedforward neural network employed in this study. The network consists of two input neurons, a single hidden layer with two neurons, and two output neurons, forming a compact structure suitable for energy-aware decision making in WSNs. Based on this architecture, the forward propagation process computes the hidden and output activations as described below:
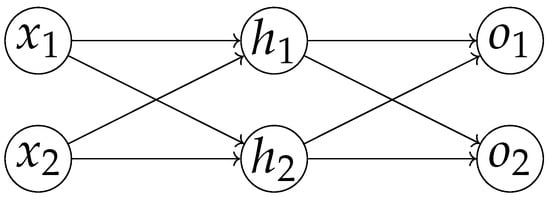
Figure 6.
Feedforward neural network structure.
Table 3 summarizes the neural network configuration, including input semantics, output interpretation, and parameter initialization, to facilitate reproducibility.
Table 3.
Neural network architecture and decision interpretation used in the EGWO-NN framework.
In Equation (16), denotes the input features (e.g., normalized residual energy and distance to the sink), and are the trainable weights of the hidden and output layers, respectively, and and are the corresponding bias terms. The output activations represent the neural network’s decisions for CH selection and next-hop routing.
In this study, the neural network outputs are treated as continuous-valued decision scores rather than binary classifications. To translate these scores into executable network actions, a fixed activation threshold is applied for CH selection. Specifically, a node is designated as a CH when its CH score exceeds a threshold of . This threshold value was determined empirically through preliminary stability analysis, where higher thresholds tended to produce insufficient CH formation, while lower thresholds resulted in excessive CH density and accelerated energy depletion. Fixing the threshold ensures consistent activation criteria across rounds and network scenarios, while adaptivity is achieved through continuous optimization of the neural network parameters by EGWO rather than through dynamic threshold tuning.
2.2.4. Decision Making and Routing Actions
The decision function (decide_action) interprets the neural network outputs and determines both cluster-head (CH) selection and routing behavior. The decision rules are based on the normalized input features and the NN output activations defined in Equation (16).
Input Normalization
To ensure scale consistency across different network scenarios, the input features are normalized as defined in Equation (17):
Cluster-Head Decision
A node is selected as a CH if the CH score produced by the neural network exceeds a predefined threshold as expressed in Equation (18):
Routing Decision
For non-CH nodes, the next-hop node is selected based on the routing score generated by the neural network. The routing decision maps the continuous routing score to one of the available neighboring nodes using the rule defined in Equation (19):
In Equations (18) and (19), threshold denotes a fixed CH activation threshold, while neighbors represents the list of reachable nodes within the communication range of the current node. This decision mechanism enables the EGWO-NN framework to jointly control CH selection and routing behavior in a unified manner.
2.2.5. Fitness Function and Objective
The fitness function aims to maximize the average node survival over simulation rounds, which directly reflects the network lifetime. The fitness value is defined as shown in Equation (20):
Algorithm 1 summarizes the procedure used to evaluate the fitness of a candidate neural network parameter set.
| Algorithm 1 Fitness Function |
|
Energy consumption acts as an implicit reward–penalty mechanism during fitness evaluation. Nodes selected as CHs incur higher energy expenditure due to data aggregation and CH-specific overhead, while non-CH nodes mainly consume energy for packet transmission and reception. The energy consumption models for CH and non-CH nodes are defined in Equations (21) and (22), respectively.
- CH node energy consumption:
- Non-CH node energy consumption:
In Equations (21) and (22), , , and denote the energy required for data transmission, reception, and aggregation, respectively. Consequently, solutions that maintain lower cumulative energy consumption across rounds preserve more active nodes and implicitly achieve higher fitness values as defined in Equation (20).
2.2.6. Flowchart
Figure 7 illustrates the overall optimization workflow of the proposed EGWO-NN framework. The process begins with the initialization of the wolf population, where each wolf encodes a candidate neural network parameter set. A partial fitness evaluation is then performed through short simulations to estimate solution quality, followed by the update of the , , and wolves. Based on these leaders, the EGWO position update mechanism iteratively refines the neural network parameters until the maximum number of iterations is reached, after which the best parameter set is selected for the decision-making phase.
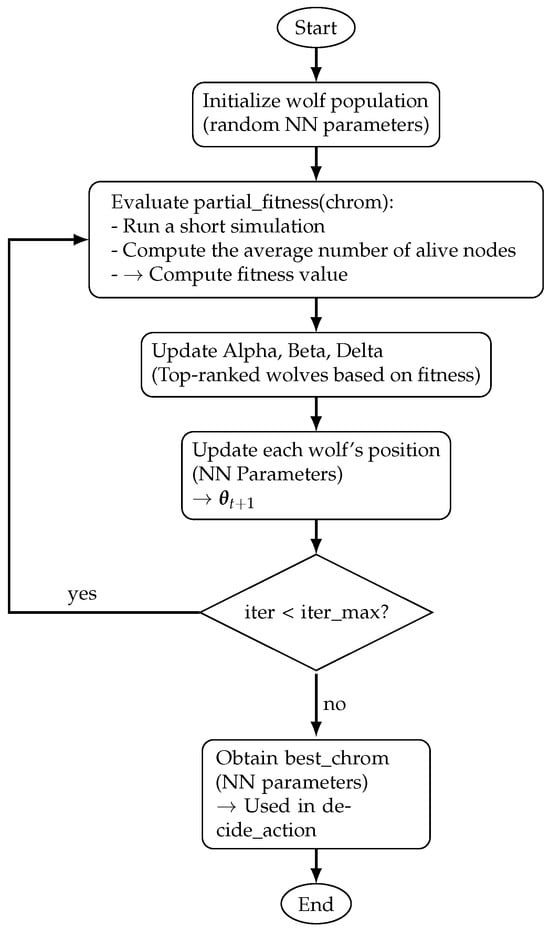
Figure 7.
Flowchart of the process.
2.2.7. Parameter Optimization and Simulation Procedure
The overall parameter optimization process follows an iterative EGWO-based search strategy and consists of the following steps:
- Initialization of EGWO agents, where each agent encodes a candidate set of neural network parameters.
- Iterative optimization using EGWO to maximize the network lifetime, where fitness evaluation is performed based on the survival metric defined in Equation (20).
- During the optimization phase, fitness is estimated through partial simulations of limited duration (500 rounds) to reduce computational cost. The objective function used by EGWO is defined in Equation (23):
- The best-performing neural network parameters obtained from EGWO are subsequently validated using extended simulations over the full simulation horizon via the simulate_nn function to assess overall performance and robustness.
2.2.8. Simulation and Statistical Analysis
All experiments were conducted using a custom round-based WSN simulator developed for this study. The simulator executes network operations in discrete rounds, where each round includes CH selection, data transmission, energy consumption update, and node survivability evaluation. A deterministic setting with a fixed random seed was applied to ensure identical initial conditions and fair comparison across all evaluated protocols.
The simulator incorporates the same radio energy consumption model, packet transmission mechanism, and CH/leader overhead definitions reported in the simulation setup. In addition, it supports dynamic node addition during runtime, enabling the controlled analysis of network adaptivity under evolving WSN conditions.
For rigorous evaluation, a statistical analysis framework based on one-way ANOVA and post hoc pairwise tests was employed. ANOVA evaluates whether the observed variance in performance metrics across multiple protocols is statistically significant by comparing inter-protocol variance to intra-protocol variance. The primary outputs of ANOVA are the F-statistic, which quantifies the ratio of between-group variance to within-group variance, and the associated p-value, which indicates the probability that the observed differences could arise by chance.
A large F-statistic combined with a very small p-value () provides strong evidence that at least one protocol exhibits statistically significant performance differences. Once such global significance is established, post hoc pairwise t-tests are conducted to identify the direction and magnitude of these differences between the proposed EGWO-NN and each benchmark protocol. The resulting t-statistics indicate how strongly EGWO-NN outperforms each baseline, while the corresponding p-values confirm the robustness of these improvements across simulation runs.
To complement the statistical evaluation described above, the following performance metrics and robustness assessment procedures were employed to ensure a comprehensive and reproducible comparison across protocols:
- Metrics such as alive nodes per round, total transmission energy, and CH count per round provide objective comparison.
- Cross-scenario robustness evaluation: We generated 1000 WSN scenarios by randomly sampling the number of sensor nodes from , the sink position from , and the initial energy range from , with a fixed communication range of 40 m. For each scenario, node positions and initial energies were drawn at random and stored as a structured description (positions, , sink position, energy range, and communication radius). The same set of 1000 scenarios was then used to evaluate all compared algorithms (EGWO-NN, LEACH, PEGASIS, HEED, and EEHC), providing an assessment of robustness across heterogeneous WSN configurations.
3. Results
This section reports the experimental results evaluating the proposed EGWO-NN approach in comparison with the established hierarchical clustering protocols. The results are presented in an objective manner, focusing on observable performance outcomes.
All simulations were conducted under a deterministic setting using a fixed random seed, ensuring identical initial conditions across all evaluated protocols, including node deployment, initial energy distribution, and sink position. Consequently, repeated executions produce identical outcomes. Statistical analyses are therefore computed over per-round performance samples within a single simulation run, rather than across multiple independent runs. This design enables a consistent and fair protocol comparison while eliminating variability due to random initialization.
The evaluated performance metrics include network lifetime, average number of alive nodes per round, total transmission energy consumption, packet delivery behavior, and cluster-head count distribution.
3.1. Simulation Setup
Simulations were carried out using the following parameters:
The energy model adopted in this study is intentionally more aggressive than those commonly used in WSN literature. This design choice is not primarily aimed at achieving a highly realistic physical-layer model but rather to accelerate the manifestation of behavioral differences among the compared algorithms within a limited number of simulation rounds.
The CH and leader overhead values reported in Table 4 were derived from the energy consumed by control-plane message exchanges during each operational round. Specifically, the overhead was estimated based on the number of control messages exchanged, the assumed control packet length, and the electronic energy consumption parameter used consistently throughout the simulation.
Table 4.
Simulation parameters used in all experiments.
For LEACH, the CH overhead of corresponds to the energy required for probabilistic CH advertisement and TDMA schedule dissemination, modeled as a small number of short control packets per round. PEGASIS incurs a higher leader overhead of due to the additional chain construction and maintenance messages exchanged among nodes. HEED and EEHC require iterative coordination and neighbor information exchange, leading to moderate overhead values of per round.
For the proposed EGWO-NN, the CH overhead was intentionally set to , matching that of HEED and EEHC. This choice ensures that the computational cost of neural network-driven decision-making does not introduce a favorable bias, and that performance gains can be attributed to adaptive CH selection rather than reduced control overhead.
Furthermore, by employing a larger packet size (6000 bits), explicit CH/leader overhead, and full transmission-distance accounting, the simulation amplifies transmission costs so that energy depletion patterns, instability in cluster-head formation, and lifetime divergence become more observable. This approach is consistent with the well-established principle that transmission energy dominates both reception and computation energy in WSN nodes [4], and thus magnifying the transmission component effectively highlights protocol efficiency differences without altering their relative behavior.
3.2. Performance Metrics
To objectively evaluate performance, the following metrics are employed:
- Network Lifetime: Measured by counting the round in which the first node dies (first-dead-round) and the average number of alive nodes per round.
- Energy Efficiency: Evaluated by total transmission energy used during the simulation.
- Packet Delivery Ratio (PDR): Ratio of successfully received packets at the sink node to total transmitted packets.
Network Lifetime Analysis
Figure 8 illustrates the representative WSN deployment used in the simulation experiments, including node distribution and sink placement.
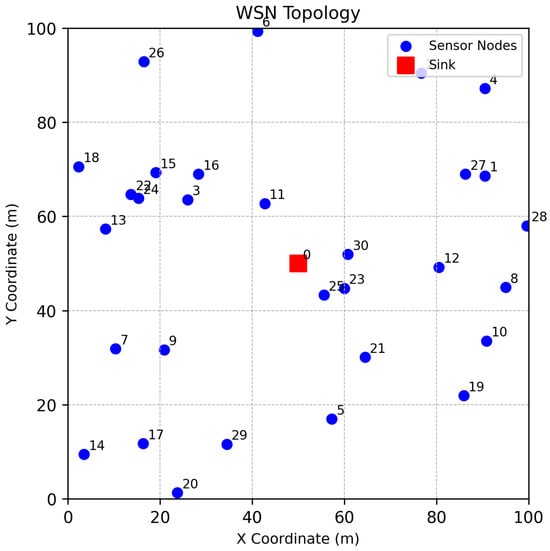
Figure 8.
Representative WSN topology used in the simulation experiments.
The evolution of network lifetime and CH formation dynamics across different protocols is presented in Figure 9. Specifically, Figure 9a shows the average number of alive nodes per round, while Figure 9b illustrates the number of selected CHs per round.
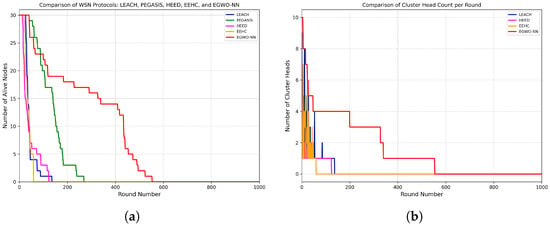
Figure 9.
Comparison of network lifetime and cluster-head dynamics under all evaluated protocols: (a) average number of alive nodes per round and (b) number of selected cluster-heads per round.
As observed in Figure 9a, the proposed EGWO-NN method consistently maintains a higher number of active nodes over a longer period compared to LEACH, PEGASIS, HEED, and EEHC. This behavior indicates improved energy balancing and delayed node death, which directly contributes to prolonged network lifetime. In addition, Figure 9b shows that EGWO-NN achieves a more stable cluster-head selection pattern across rounds, avoiding excessive CH formation that could accelerate energy depletion.
3.3. Statistical Evaluation
To statistically validate the differences observed, we performed ANOVA followed by post hoc pairwise comparison tests. The statistical results for the network lifetime metric (average alive nodes) are shown in Table 5.
Table 5.
The t-test results for alive nodes (NN vs. other protocols).
All p-values are extremely small (ranging from to ), which is well below the typical threshold of 0.05. The large and positive t-statistics indicate that the average number of alive nodes for the NN protocol is consistently higher compared to the other protocols. Statistically, we can conclude that the NN protocol (EGWO-NN) is significantly superior to LEACH, PEGASIS, HEED, and EEHC in terms of the number of alive nodes per round.
These statistical analyses clearly confirm the superiority of EGWO-NN in significantly extending network lifetime compared to conventional clustering methods.
3.4. Energy Efficiency
Figure 10 illustrates the comparative energy consumption (total transmission energy per round) for EGWO-NN and benchmark protocols:
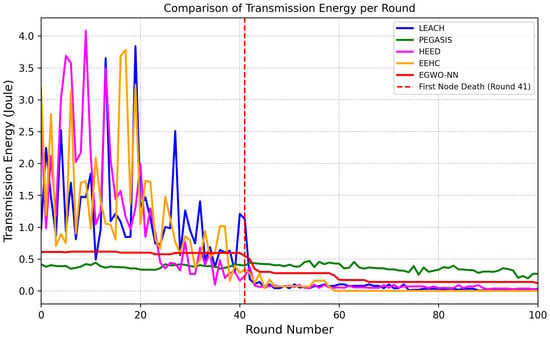
Figure 10.
Transmission energy consumption comparison between EGWO-NN and benchmark protocols.
Pairwise t-tests (Table 6) show that the differences between NN and each of LEACH, PEGASIS, HEED, and EEHC in transmission energy are all statistically significant (p-values far below 0.05). For instance, the NN transmission energy is significantly lower than that of LEACH, HEED, and EEHC but significantly higher than PEGASIS up to round 41.
Table 6.
Statistical comparison of transmission energy (up to round 41).
The ANOVA confirms that, when considering all protocols together, there is a significant difference in the mean transmission energy, with an F-statistic of 14.7432 and a p-value of approximately . This provides strong evidence that at least one protocol’s performance differs from the others. Thus, the ANOVA supports the conclusion that the transmission energy among the compared protocols is significantly different, which is a critical factor when evaluating the overall energy efficiency and network lifetime in WSN protocols.
We can observe an example of energy consumption per node in a single round, for example at round 60 (Figure 11), where the transmission energy consumption among nodes in the EGWO-NN protocol shows a clear variation in energy usage, reflecting the impact of distance from CHs and network topology. The CHs are Nodes 11, 23, 25, and 30. Nodes such as Node 13, Node 19, and Node 29 exhibit high transmission energy consumption, as they are located far from their assigned CHs, requiring more power to successfully transmit data. In contrast, nodes with lower energy consumption, such as Node 15 and Node 16, are positioned closer to their CHs, minimizing their transmission costs.
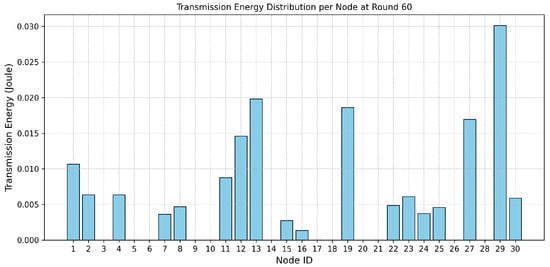
Figure 11.
Transmission energy consumption in round 60th.
Figure 12 illustrates the temporal evolution of the remaining network energy as a function of simulation rounds for all evaluated protocols. In this study, one simulation round represents a logical time unit consisting of cluster formation, data transmission, and energy update phases. Therefore, the horizontal axis (round) reflects the progression of network operational time rather than physical clock time.
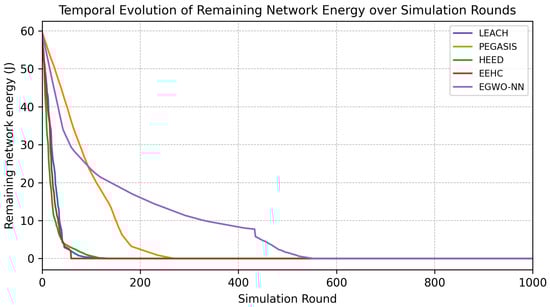
Figure 12.
Temporal evolution of remaining network energy over simulation rounds for LEACH, PEGASIS, HEED, EEHC, and EGWO-NN. Each simulation round represents one logical time unit comprising cluster formation, data transmission, and energy update. Higher curves indicate improved energy preservation and longer network lifetime.
The vertical axis represents the total remaining energy of the network, computed as the sum of residual energies of all sensor nodes at each round. The initial energy level of approximately 60 J corresponds to the aggregate initial energy of the deployed sensor nodes, obtained by multiplying the number of nodes by the initial energy assigned to each node as specified in the simulation setup. As the simulation progresses, the decreasing curves indicate cumulative energy depletion due to communication and clustering operations.
As shown in Figure 12, the proposed EGWO-NN exhibits a slower energy decay over time, maintaining higher residual network energy compared to the benchmark protocols. This behavior indicates more balanced energy consumption and improved energy efficiency, ultimately resulting in a longer network operational duration.
Figure 13 shows the packet transmission per round for different WSN protocols, where throughput is measured as the number of packets successfully sent in each round. The EGWO-NN protocol exhibits the longest sustained packet transmission, gradually decreasing, indicating better energy efficiency and prolonged network activity. In contrast, LEACH, HEED, EEHC, and PEGASIS experience rapid declines, with most of their packet transmissions significantly dropping before 100 rounds. This suggests that while these traditional protocols achieve high initial throughput, they suffer from faster energy depletion, leading to a shorter network lifespan. Notably, PEGASIS maintains lower but intermittent packet transmission, reflecting its chain-based communication approach, which reduces redundancy. However, when a single node dies, the entire chain structure must be reformed, introducing high overhead, which negatively impacts the number of alive nodes and network stability. The results highlight that EGWO-NN balances throughput and network longevity, ensuring more stable and efficient operation compared to the other protocols.
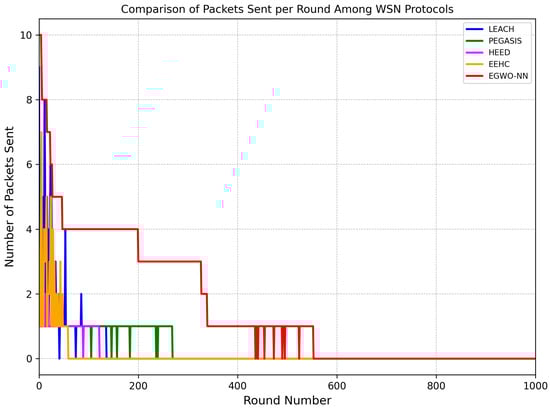
Figure 13.
Comparison packet sent.
Table 7 shows that NN consistently outperforms all other protocols, as indicated by large t-statistic values and extremely low p-values (p < 0.001). This suggests that NN is significantly better in terms of the analyzed metric.
Table 7.
Pairwise t-test for packets sent.
The Packet Delivery Ratio (PDR) is defined as the ratio between the number of packets successfully delivered to the Base Station (BS) and the total number of packets expected to be transmitted. A higher PDR indicates more efficient and reliable data transmission, reflecting the network’s ability to successfully route packets despite potential losses due to energy depletion, interference, or network congestion.
NN significantly improves PDR (Table 8), making it the most efficient protocol in terms of packet delivery.
Table 8.
Pairwise t-test for Packet Delivery Ratio (PDR).
When we add five new nodes in the 250th round (Figure 14), a noticeable spike in the number of alive nodes can be observed. This confirms that the new nodes were successfully added, and the model continued to perform as expected by making predictions and taking appropriate actions. Additionally, the black line follows a similar trend to the red line in Figure 14a, demonstrating that the model adapts well to the introduction of new nodes without significant deviation. Similarly, in terms of CH selection, the black line exhibits the same behavior as the red line in Figure 14b, further validating that the node addition did not disrupt the clustering mechanism and that the model maintained consistency in CH selection.
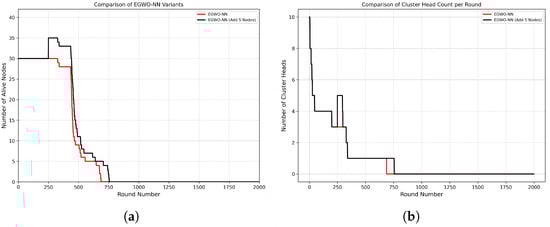
Figure 14.
Performance impact of adding five new nodes at round 250: (a) number of alive nodes per round, and (b) total number of cluster-heads per round.
In Figure 15a (Round 50), the WSN topology demonstrates a well-distributed clustering structure with multiple CHs coordinating communication between sensor nodes and the BS. Each CH is responsible for a subset of nodes, which are color-coded based on their assigned cluster. The solid magenta lines indicate direct transmissions from CHs to the BS, while the dashed black lines represent intra-cluster communication between sensor nodes and their respective CHs. At this stage, network connectivity remains strong, with active nodes efficiently transmitting data through their designated CHs.
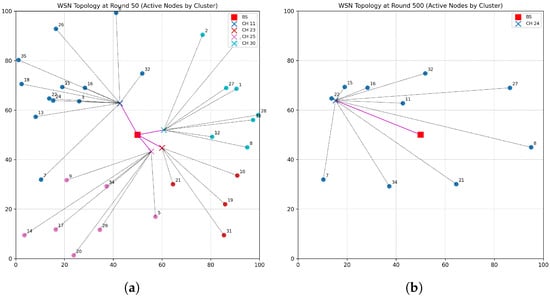
Figure 15.
The WSN topology snapshots at different simulation rounds: (a) topology at round 50 and (b) topology at round 500.
By round 500, Figure 15b reveals a significant reduction in the number of active nodes, with only one CH (Node 24) and a small number of surviving sensor nodes. The decline in network coverage is indicative of node failures due to energy depletion, a common challenge in WSNs. The surviving nodes continue to communicate with CH 24, which directly transmits data to the BS. The decrease in the number of CHs and sensor nodes suggests that prolonged network operation has led to energy exhaustion in several nodes, thereby affecting network lifespan and data transmission efficiency.
These observations highlight the impact of energy constraints on network longevity. While the clustering mechanism effectively organizes data transmission, the eventual depletion of node energy results in reduced coverage and overall network performance. This emphasizes the importance of energy-efficient CH selection and adaptive clustering strategies to prolong network lifetime.
To further evaluate robustness and cross–scenario generalization, we performed an extensive stress test consisting of 1000 heterogeneous WSN scenarios. Each scenario was generated by independently varying four key environmental factors: (i) the number of sensor nodes (30, 50, or 100), (ii) the sink position chosen from , , or , (iii) the initial energy range assigned to all nodes J or J, and (iv) randomized spatial placement of all sensor nodes within the field. These variations collectively emulate a wide spectrum of practical deployment conditions, including different network densities, sink placements, and heterogeneous battery profiles. The same 1000 scenarios were executed for all five protocols (LEACH, PEGASIS, HEED, EEHC, and the proposed EGWO-NN) to ensure a fair and fully matched comparison.
Figure 16 presents the distribution of the first-dead-round (FDR) metric across all scenarios. The classical protocols exhibit comparable performance, with median lifetimes between 6 and 8 rounds and IQRs of 6–9 rounds, reflecting consistently limited robustness under scenario variability. In contrast, EGWO-NN demonstrates a substantially broader and right-shifted distribution (minimum 3, , median , , maximum 47), corresponding to an average lifetime improvement of approximately 2.5× over all baselines. These results confirm that EGWO-NN maintains high performance across diverse layouts and energy conditions, showing strong resilience and generalization under unseen WSN configurations.
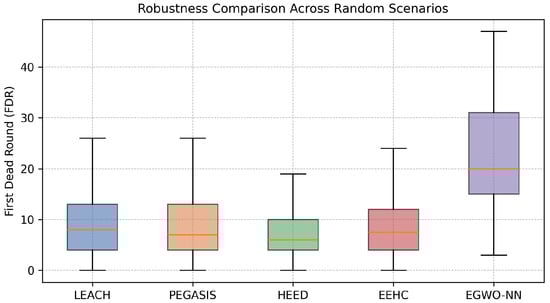
Figure 16.
Robustness comparison across 1000 randomized WSN scenarios with varying node count, sink position, initial energy range, and spatial layout. The proposed EGWO-NN achieves substantially higher lifetime compared to classical protocols.
3.5. Packet Size Sensitivity Analysis
Figure 17 illustrates the effect of transmitted packet size on network lifetime, measured as the first round in which any node depletes its energy. As expected, increasing packet size accelerates energy consumption and results in earlier node failures for all protocols.
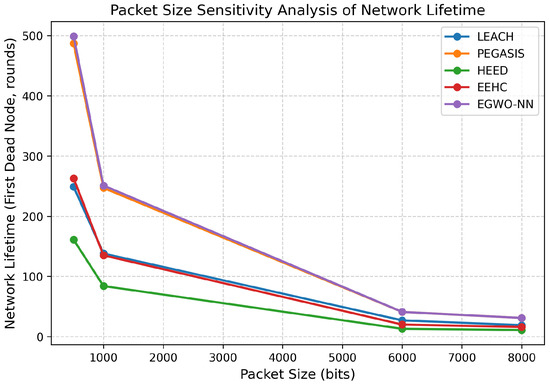
Figure 17.
Packet size sensitivity analysis of network lifetime measured as the first node death (FND). Increasing packet size reduces network lifetime for all protocols; however, EGWO-NN consistently maintains lifetime comparable to PEGASIS and significantly outperforms heuristic clustered protocols under both low- and high-load conditions.
At low traffic loads (500–1000 bits), EGWO-NN achieves the longest lifetime, reaching 499 and 251 rounds, respectively, outperforming LEACH, HEED, and EEHC, and closely matching the performance of PEGASIS. As packet size increases to 6000 and 8000 bits, lifetime decreases substantially for all protocols; however, EGWO-NN consistently maintains lifetime values comparable to PEGASIS (41 and 31 rounds), while clustered heuristic protocols degrade more rapidly.
These results indicate that the proposed EGWO-NN preserves its relative advantage under increasing transmission load, demonstrating robustness to packet size variations through adaptive cluster-head decision-making.
4. Discussion
The results demonstrate that EGWO-NN provides substantial improvements in network lifetime and energy efficiency compared to conventional clustering protocols. Across all experiments, EGWO-NN consistently maintains a higher number of active nodes per round and delays the first-node death significantly longer than LEACH, PEGASIS, HEED, and EEHC. This advantage arises from the ability of EGWO to continuously optimize the neural network parameters responsible for CH selection and next-hop routing [20], thereby avoiding the limitations of static or topology-dependent schemes. Whereas LEACH relies on probabilistic CH election and PEGASIS constrains nodes into a fixed chain, EGWO-NN dynamically adapts to network conditions and balances energy expenditure more effectively.
Energy consumption analysis further confirms that EGWO-NN reduces both CH overhead and unnecessary long-distance transmissions. Classical algorithms such as HEED and PEGASIS often generate suboptimal CH placements or elongated routing paths under heterogeneous deployments, leading to accelerated battery depletion [21]. In contrast, the learned decision boundaries of EGWO-NN yield consistently shorter and more energy-efficient communication patterns. The statistical tests, including ANOVA and comprehensive pairwise comparisons over the 1000 scenarios, show that the performance gaps between EGWO-NN and all baselines are highly significant (), reinforcing the robustness and reliability of the proposed approach.
A notable strength of this study is the large-scale robustness evaluation. Instead of assessing the model only on a fixed topology or a small validation set, we generated 1000 heterogeneous WSN scenarios covering random variations in node count, spatial layout, sink placement, and initial energy distribution. The resulting performance distributions reveal that all classical protocols exhibit narrow interquartile ranges and short network lifetimes that degrade rapidly under scenario variability. EGWO-NN, however, maintains a markedly more resilient lifetime profile, with median first-dead-round [22] values approximately 2.5 times greater than the baselines and upper whiskers extending to 40–47 rounds. This indicates that the optimized neural network generalizes well to diverse and previously unseen operating conditions, capturing the underlying structural principles that govern effective CH selection without over-fitting to any particular configuration.
These findings are consistent with prior studies showing the potential of bio-inspired optimization for enhancing clustering decisions in WSNs. However, unlike GA or PSO, which may suffer from premature convergence in high-dimensional decision spaces [23,24], EGWO demonstrates a more balanced exploration–exploitation dynamic. This leads to more stable convergence of the neural network parameters and improved energy distribution among nodes, making EGWO-NN particularly suitable for rapidly changing WSN environments.
A practical consideration is that the computational overhead of EGWO-NN is higher than that of very lightweight heuristic protocols such as LEACH. Nevertheless, modern embedded platforms increasingly support low-power parallel computation [25], making the trade-off between computational cost and prolonged operational lifetime justifiable for most real-world WSN applications. Future work may explore hybrid approaches combining EGWO with lightweight reinforcement learning [26] or surrogate modeling [27] to further reduce computation while retaining adaptivity.
Overall, the robustness analysis across 1000 heterogeneous scenarios strongly supports the practical applicability of EGWO-NN as a dynamic, energy-efficient, and generalizable clustering and routing solution for real-world WSN deployments, especially those requiring long-term autonomy under uncertain and time-varying environmental conditions.
Despite the strong performance gains observed in the simulation results, several limitations of the present study should be acknowledged. First, the evaluation is conducted using synthetic simulation scenarios with an energy-stressed radio model to enable controlled, repeatable, and large-scale comparisons across protocols. While this approach is common in WSN research, real-world testbed or hardware-in-the-loop validation remains an important direction for future work.
Second, the EGWO-NN decision-making process is executed in a centralized manner at the base station, which is assumed to possess sufficient computational and memory resources. This design choice intentionally avoids imposing additional overhead on energy-constrained sensor nodes and aligns with many centralized clustering and optimization frameworks in the literature. However, scalability to fully decentralized or large-scale WSN deployments is an important consideration, and distributed or hierarchical extensions of EGWO-NN will be explored in future studies.
Finally, although the convergence behavior of EGWO is discussed qualitatively, this work does not explicitly analyze runtime complexity, memory footprint, or convergence time, as the optimization process is performed offline and does not directly affect sensor node operation. In addition, the comparative evaluation focuses on classical hierarchical clustering protocols; extending the comparison to recent reinforcement learning-, deep reinforcement learning-, or federated learning-based WSN approaches represents a promising avenue for future research.
5. Conclusions
This study demonstrates that integrating adaptive optimization with learning-based decision models can substantially improve the operational lifetime and reliability of WSNs. By continuously optimizing the parameters of a neural decision-making model, the proposed EGWO-NN framework enables sustained adaptivity to changing network conditions, leading to more balanced energy consumption and prolonged network operation compared to conventional hierarchical clustering protocols.
The experimental results indicate that EGWO-NN consistently outperforms established protocols such as LEACH, PEGASIS, HEED, and EEHC across key performance indicators, including network lifetime, energy efficiency, and packet delivery behavior. These improvements are observed not only under fixed network configurations but also across a wide range of heterogeneous deployment scenarios, highlighting the robustness and generalization capability of the proposed approach.
More broadly, the findings suggest that shifting the optimization focus from individual clustering decisions toward the adaptive optimization of decision-making models represents a promising direction for future WSN research. Such model-level adaptivity offers a flexible foundation for designing energy-aware and resilient sensor networks, particularly in long-term and dynamic deployment environments.
Future research may further explore lightweight implementations of adaptive learning and optimization to reduce computational overhead, as well as extensions to multi-hop and heterogeneous WSN architectures. These directions can support the practical deployment of adaptive clustering frameworks in real-world, resource-constrained sensor network applications.
Author Contributions
Conceptualization, M.N.F.; Methodology, M.N.F. and H.H.N.; Software, M.N.F.; Validation, M.N.F., H.H.N. and R.M.; Formal analysis, M.N.F.; Investigation, M.N.F., H.H.N. and R.M.; Resources, R.M.; Data curation, M.N.F.; Writing—original draft preparation, M.N.F.; Writing—review and editing, R.M., S.S. and H.H.N.; Visualization, M.N.F.; Supervision, R.M.; Project administration, R.M.; Funding acquisition, R.M. All authors have read and agreed to the published version of the manuscript.
Funding
This research was funded by Telkom University through the internal research grant entitled “PERLINDUNGAN TERHADAP VIRTUAL JAMMING MENGGUNAKAN MACHINE LEARNING”, Grant No: 199/LIT06/PPM-LIT/2024.
Institutional Review Board Statement
Not applicable.
Informed Consent Statement
Not applicable.
Data Availability Statement
The source code and simulation data supporting the findings of this study are publicly available at: https://github.com/kamal-F/WSN-EGWO-NN (accessed on 9 March 2025).
Acknowledgments
The authors would like to thank the Research and Community Service Institute (PPM), Telkom University, for administrative and technical support during the course of this research. Language editing assistance was supported by artificial intelligence (AI) tools to improve clarity and readability, without affecting the scientific content.
Conflicts of Interest
The authors declare that there are no conflicts of interest in this paper.
References
- Gupta, A.; Gulati, T.; Bindal, A.K. WSN based IoT applications: A Review. In Proceedings of the 2022 10th International Conference on Emerging Trends in Engineering and Technology—Signal and Information Processing (ICETET-SIP-22), Nagpur, India, 29–30 April 2022; pp. 1–6. [Google Scholar] [CrossRef]
- Jamshed, M.A.; Ali, K.; Abbasi, Q.H.; Imran, M.A.; Ur-Rehman, M. Challenges, Applications, and Future of Wireless Sensors in Internet of Things: A Review. IEEE Sens. J. 2022, 22, 5482–5494. [Google Scholar] [CrossRef]
- Houssein, E.H.; Saad, M.R.; Djenouri, Y.; Hu, G.; Ali, A.A.; Shaban, H. Metaheuristic algorithms and their applications in wireless sensor networks: Review, open issues, and challenges. Clust. Comput. 2024, 27, 13643–13673. [Google Scholar] [CrossRef]
- Heinzelman, W.B.; Chandrakasan, A.P.; Balakrishnan, H. An Application-Specific Protocol Architecture for Wireless Microsensor Networks. IEEE Trans. Wirel. Commun. 2002, 1, 660–670. [Google Scholar] [CrossRef]
- Lindsey, S.; Raghavendra, C. PEGASIS: Power-efficient gathering in sensor information systems. In Proceedings of the Proceedings, IEEE Aerospace Conference, Big Sky, MT, USA, 9–16 March 2002; Volume 3, p. 3. [Google Scholar] [CrossRef]
- Younis, O.; Fahmy, S. HEED: A hybrid, energy-efficient, distributed clustering approach for ad hoc sensor networks. IEEE Trans. Mob. Comput. 2004, 3, 366–379. [Google Scholar] [CrossRef]
- Bandyopadhyay, S.; Coyle, E. An energy efficient hierarchical clustering algorithm for wireless sensor networks. In Proceedings of the IEEE INFOCOM 2003, Twenty-Second Annual Joint Conference of the IEEE Computer and Communications Societies (IEEE Cat. No.03CH37428), San Francisco, CA, USA, 30 March–3 April 2003; Volume 3, pp. 1713–1723. [Google Scholar] [CrossRef]
- Neeha, S.; Charles, I.; Krishna, S.V.; Swarnakar, S. Performance Analysis of LEACH, LEACH-C, TS-LEACH, MOD-LEACH in WSN. Int. J. Comput. Intell. Commun. Technol. 2022, 11, 4–8. [Google Scholar] [CrossRef]
- Prakash, V.; Pandey, S. Metaheuristic algorithm for energy efficient clustering scheme in wireless sensor networks. Microprocess. Microsyst. 2023, 101, 104898. [Google Scholar] [CrossRef]
- Goudarzi, S.; Anisi, M.H.; Soleymani, S.A.; Ayob, M.; Zeadally, S. An IoT-Based Prediction Technique for Efficient Energy Consumption in Buildings. IEEE Trans. Green Commun. Netw. 2021, 5, 2076–2088. [Google Scholar] [CrossRef]
- Verma, D.; Gamad, R.S.; Nihalani, N. Optimizing Routing Efficiency in MANETs: Integrating PSO-Optimized Neural Network Model for Improved Data Transmission. In Proceedings of the 2024 Third International Conference on Artificial Intelligence, Computational Electronics and Communication System (AICECS), Manipal, India, 12–14 December 2024; pp. 1–6. [Google Scholar] [CrossRef]
- Nuha, H.; Liu, B.; Mohandes, M.; Balghonaim, A.; Fekri, F. Seismic data modeling and compression using particle swarm optimization. Arab. J. Geosci. 2021, 14, 2542. [Google Scholar] [CrossRef]
- Rami Reddy, M.; Ravi Chandra, M.L.; Venkatramana, P.; Dilli, R. Energy-Efficient Cluster Head Selection in Wireless Sensor Networks Using an Improved Grey Wolf Optimization Algorithm. Computers 2023, 12, 35. [Google Scholar] [CrossRef]
- Jaiswal, K.; Anand, V. A Grey-Wolf based Optimized Clustering approach to improve QoS in wireless sensor networks for IoT applications. Peer-to-Peer Netw. Appl. 2021, 14, 1943–1962. [Google Scholar] [CrossRef]
- Kaddi, M.; Omari, M.; Salameh, K.; Alnoman, A. Energy-Efficient Clustering in Wireless Sensor Networks Using Grey Wolf Optimization and Enhanced CSMA/CA. Sensors 2024, 24, 5234. [Google Scholar] [CrossRef] [PubMed]
- Ajmi, N.; Helali, A.; Lorenz, P.; Mghaieth, R. MWCSGA—Multi Weight Chicken Swarm Based Genetic Algorithm for Energy Efficient Clustered Wireless Sensor Network. Sensors 2021, 21, 791. [Google Scholar] [CrossRef] [PubMed]
- Fauzan, M.N.; Munadi, R.; Sumaryo, S.; Nuha, H.H. Effect of p-value on LEACH Protocol Performance for Wireless Sensor Networks. In Proceedings of the 2022 International Conference on Data Science and Its Applications (ICoDSA), Bandung, Indonesia, 6–7 July 2022; pp. 166–170. [Google Scholar] [CrossRef]
- Fauzan, M.N.; Munadi, R.; Sumaryo, S.; Nuha, H.H. Enhanced Grey Wolf Optimization for Efficient Transmission Power Optimization in Wireless Sensor Network. Appl. Syst. Innov. 2025, 8, 36. [Google Scholar] [CrossRef]
- Mirjalili, S.; Mirjalili, S.M.; Lewis, A. Grey Wolf Optimizer. Adv. Eng. Softw. 2014, 69, 46–61. [Google Scholar] [CrossRef]
- Miao, Z.; Yuan, X.; Zhou, F.; Qiu, X.; Song, Y.; Chen, K. Grey wolf optimizer with an enhanced hierarchy and its application to the wireless sensor network coverage optimization problem. Appl. Soft Comput. 2020, 96, 106602. [Google Scholar] [CrossRef]
- Ali, S.; Kumar, R. Hybrid energy efficient network using firefly algorithm, PR-PEGASIS and ADC-ANN in WSN. Sens. Int. 2022, 3, 100154. [Google Scholar] [CrossRef]
- Zheng, A.; Zhang, Z.; Liu, W.; Liu, J.; Xiao, Y.; Li, C. Dual Cluster Head Optimization of Wireless Sensor Networks Based on Multi-Objective Particle Swarm Optimization. Sensors 2022, 23, 231. [Google Scholar] [CrossRef]
- Pandey, H.M.; Chaudhary, A.; Mehrotra, D. A comparative review of approaches to prevent premature convergence in GA. Appl. Soft Comput. 2014, 24, 1047–1077. [Google Scholar] [CrossRef]
- Freitas, D.; Lopes, L.G.; Morgado-Dias, F. Particle Swarm Optimisation: A Historical Review Up to the Current Developments. Entropy 2020, 22, 362. [Google Scholar] [CrossRef]
- Zhang, T.; Huang, B.; Liu, X.; Fan, J.; Li, J.; Yue, Z.; Wang, Y. MCU Intelligent Upgrades: An Overview of AI-Enabled Low-Power Technologies. J. Low Power Electron. Appl. 2025, 15, 60. [Google Scholar] [CrossRef]
- Xi, M.; Dai, H.; He, J.; Li, W.; Wen, J.; Xiao, S.; Yang, J. A Lightweight Reinforcement-Learning-Based Real-Time Path-Planning Method for Unmanned Aerial Vehicles. IEEE Internet Things J. 2024, 11, 21061–21071. [Google Scholar] [CrossRef]
- Shirzadi, N.; Lau, D.; Stylianou, M. Surrogate Modeling for Building Design: Energy and Cost Prediction Compared to Simulation-Based Methods. Buildings 2025, 15, 2361. [Google Scholar] [CrossRef]


Disclaimer/Publisher’s Note: The statements, opinions and data contained in all publications are solely those of the individual author(s) and contributor(s) and not of MDPI and/or the editor(s). MDPI and/or the editor(s) disclaim responsibility for any injury to people or property resulting from any ideas, methods, instructions or products referred to in the content. |
© 2026 by the authors. Licensee MDPI, Basel, Switzerland. This article is an open access article distributed under the terms and conditions of the Creative Commons Attribution (CC BY) license.