Abstract
COVID-19, or coronavirus disease, has caused an ongoing global pandemic causing un-precedented damage in all scopes of life. An infected person with underlaying medical conditions is at greater risk than the rest of the population. Obstructive sleep apnea (OSA) is an illness associated with disturbances during sleep or an unconscious state with blockage of the airway passage. The comobordities of OSA with high blood pressure, diabetes, obesity, and age can place the life of an already infected COVID-19 patient into danger. In this paper, a prediction model for the mortality of a COVID-infected patient suffering from OSA is developed using machine learning algorithms. After an extensive methodical search, we designed an artificial neural network that can predict the mortality with an overall accuracy of 99% and a precision of 100% for forecasting the fatality chances of COVID-infected patients. We believe our model can accurately predict the mortality of the patients and can therefore assist medical health workers in predicting and making emergency clinical decisions, especially in a limited resource scenario, based on the medical history of the patients and their future potential risk of death. In this way, patients with a greater risk of mortality can receive timely treatment and benefit from proper ICU resources. Such artificial intelligent application can significantly reduce the overall mortality rate of vulnerable patients with existing medical disorders.
1. Introduction
COVID-19, or coronavirus disease, is an infectious deadly disease that has posed an unprecedented impairment to health and overall wellbeing of people since its outbreak in late December 2019 [1]. The virus SARS-CoV-2 is responsible for the rapid transmission of the disease worldwide [2]. The virus has caused an ongoing global pandemic in all sectors with substantial damage in the medical, economical, and service sectors. As of 18 February 2022, there had been 420 million cases worldwide and 5.86 million deaths, making it the most death-dealing virus in history.
Most individuals infected by the virus can suffer from undetectable, mild to severe symptoms. The common symptoms of COVID-19 are fever, dry cough, sore throat, and loss of smell and taste [3]. With proper medication and sufficient social distancing, an infected person can recover from the virus from treatment at home. However, people with underlying medical conditions remain at large risk due to the virus infection. Previous research on the severity of COVID-19 states that the risk of mortality in COVID-19 patients increases with age and comorbidities: obesity, chronic kidney disease, liver disease, diabetes, hypertension, cancer, and pulmonary diseases. From the study conducted on 12,526 patients across Hubei region and outside, hypertension, diabetes, chronic kidney disease (CKD), chronic liver diseases (CLD) and chronic obstructive pulmonary disease (COPD) have been prevalent in COVID-19 infected patients [4].
Obstructive sleep apnea (OSA) is a medical condition to cause disruption during sleep when the upper respiratory tract of the person is blocked by an object. The diaphragm and chest muscles coordinate to push air into the lungs, making the person breathe shallowly. Common symptoms, such as fatigue, restlessness during sleep, hypertension, gender, and age, increase the prevalence of OSA, affecting 3–7% of the total population [5]. People with underlying medical conditions such as diabetes, high blood pressure, smoking, obesity, asthma, or older are more likely to develop OSA [6]. Studies show that these comorbidities are firmly associated with the risk of the severity of COVID-19 [4]. Therefore, study on the association of obstructive sleep apnea and the risk of the severity of COVID-19 has been a relevant research topic globally. In the midst of the crisis caused by COVID-19, the proper distribution of ICU beds is essential to support the patients who require mechanical ventilation and support. The lack of ICU beds can cause capacity strain, which can impact the life expectancy of a critical patients. A total of 18 studies out of 30 and 9 out of 12 intensive care unit studies show that capacity strain in the hospital increases the mortality of patients [7].
OSA, which is closely associated with the comorbidities that increase the fatality of a patient, can be a biomarker to identify critical patients. Identification of patients with obstructive sleep apnea can help medical health workers to timely treat severely infected patients and support them with ICU and mechanical ventilation. A mortality analysis and prediction of patients with more life-threatening risks can assist health workers in making these crucial medical decisions and minimize the human error caused due to mental strain.
The machine learning models used in our research have outstanding performance.
Since the beginning of the pandemic, we have been actively working on developing widely accessible free telehealth care smartphone applications to potentially diagnose and predict the mortality of COVID-19 patients [8] and pregnant women infected with the virus [9]. Here, we present a machine learning model for OSA patients affected by COVID-19. This can help critically ill patients to timely receive treatment and can reduce the overall mortality rate from COVID-19.
2. Literature Review
The association and outcome linking of COVID-19 with OSA was studied in [10]. The authors discussed the potential origin, the effects of COVID-19 in caring for OSA patients, and the effects of COVID-19 on OSA. The paper concludes that OSA patients have a higher risk of mortality and the study suggests that risk factors and comorbidities of OSA, e.g., obesity, hypertension, and diabetes, are likely linked to COVID-19 outcomes. One notable conclusion is that the treatment of OSA is independently associated with the risk of COVID-19.
The probable risk factors of OSA with COVID-19 were studied by [11]. The paper finds that interleukin-6, interleukin-17, and tumor necrosis factor are induced by poor sleep quality. This promotes the inflammatory activity in the neutrophil in an infected person’s body. However, the study also suggests that diagnosis of OSA is an independent factor of the poor COVID-19 outcomes. The study also suggests that optimum sleep is essential for adequate immune development against COVID-19.
The clinical outcomes in patients hospitalized with COVID-19 have been studied by the authors in [12]. The dataset in this study was collected from the medical records of patients with a history of OSA: both COVID-19-affected and not-affected patients. The study finds that rate of mortality increased significantly in patients with history of OSA compared to that of patients without history of OSA. The history of OSA associated also increased the possibility of longer hospital staying.
The aim to find the relationship between OSA and COVID-19 was studied in [13]. In the meta-analysis from 21 studies and a total of 54,276 COVID-19-affected patients, the study found that OSA is related to poor COVID-19 outcomes. The study also found that OSA can be associated with higher mortality, more mechanical ventilation requirement, and prolonged staying in the hospital due to severity. The study notes that most of the patients with OSA have medical history of obesity, cardiovascular disease, and diabetes, which eventually supports the evidence of higher risk of mortality of patients with OSA.
Potential influences of OSA and obesity on COVID-19 severity were presented in [14]. The study found evidence that obstructive sleep apnea can worsen hypoxemia and cytokinin storm in the body of COVID-19 patients. In contrast, the study also found that OSA can also be associated with acute kidney failure injury in critically affected COVID-19 patients. Contamination fear from using nasal palp is also one of the catalyzing event that worsens OSA in patients.
OSA and the risk of COVID-19 infection, hospitalization, and respiratory failure is discussed in [15]. The study was conducted on 9405 COVID-19-affected patients. The authors found evidence that OSA was more common among critically affected patients. This also leads to further evidence than OSA is responsible for respiratory failure and other complications. The study suggests that patients with history of OSA are eight-fold more at risk of complications than other patients in terms of fatality caused by COVID-19.
The concerning issue of whether OSA is really a comorbidity of COVID-19 was studied in [16]. There are a lot of similarities of OSA comorbidity along with COVID-19. Evidence from the study suggests that hypoxia from OSA can interact with pulmonary parenchymal from the infection of COVID-19. Thus, OSA works as a factor hampering the inflammatory outcome of patients. This can be a potential reason for the severity of COVID-19-affected patients with OSA. The study does not establish OSA as a risk factor for COVID-19, but the comorbidities with OSA such as hypertension and diabetes are very strongly associated with worsening the state for COVID-19-infected patients.
The study on various other comorbidities associated with COVID-19 was conducted in [17]. Based on the study conducted on 3994 patients, the authors claim that hypertension, diabetes mellitus, cardiovascular disease, chronic obstructive pulmonary disease (COPD), and chronic kidney disease (CKD) are all noteworthy comobordities. The study heavily implies that presence of any of the aforementioned factors can greatly increase the chances of mortality in patients.
The risk factors associated with OSA has been studied in [18]. Based on evidence and history of records of OSA patients, the authors suggest that OSA can be strongly associated with hypertension. Affecting around 5 to 15 percent of the total population, patients affected with OSA are also at a risk of stroke and transient ischemic attacks. For patients with previous pulmonary disease, OSA can worsen and cause pulmonary hypertension.
3. Methods and Materials
The overall flowchart explaining the methodologies used in the research is illustrated in Figure 1.
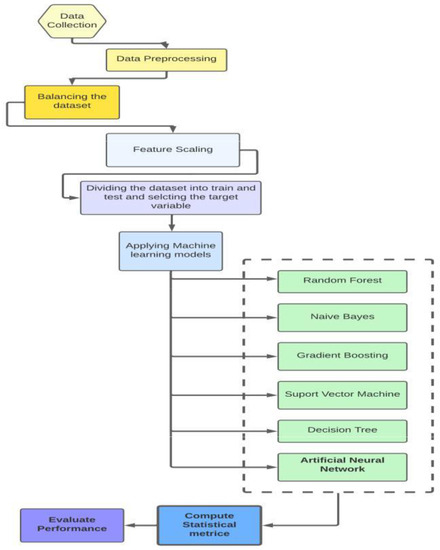
Figure 1.
The flowchart of methodology of the research.
3.1. Dataset Collection
The dataset was collected from the paper “Association between the degree of obstructive sleep apnea and the severity of COVID-19: An explorative retrospective cross-sectional study” [19]. The paper studied the relation between obstructive sleep apnea and the degrees of risk associated with it on COVID-19-infected patients. The study and the dataset associated with it were approved by Medical Ethics Committee, Isala Academy, Zwolle, the Netherlands (reference number 210221). The medical records of obstructive sleep apnea patients from Isala Hospital and the patients admitted here were collected through full consent. The dataset of the patients was collected based on the criteria of the severity of the symptoms of COVID-19 based on the general criterion by the World Health Organization and the medical records in the hospital. There are 24 parameters in the dataset: age, sex, admission to hospital, number of days of hospital admission, intubation days, WHO CAT 3,4,5, apnea hypopnea index (AHI), low oxygen saturation (LSAT), respiratory disturbance index (RDI), body mass index (BMI), treatment for obstructive sleep apnea, smoking, diabetes mellitus (DM), cardiovascular disease (CVD), asthma, chronic kidney disease, active malignancy, immune suppression, and death due to COVID-19.
3.2. Data Statistical Analysis
3.2.1. Inclusion Exclusion Criteria for the Dataset
According to Ref. [19], the dataset was constructed from patients from Isala Hospital (Zwolle, the Netherlands) from March to December 2020. Adults above the age of 18, patients with polysomnography (PSG) or home sleep apnea testing (HSAT), positive for COVID-19 disease, and containing mild to severe obstructive sleep apnea (OSA) were included for the study. The absence of AHI, LSAT, ODI, and RDI in the samples were considered the exclusion criteria for the overall dataset.
3.2.2. Pre-Processing the Dataset
The dataset collected was processed through encoding the attributes of a sample into its counter numeric parts. The gender attribute for the sample was encoded as Male: 0, Female: 1. The rest of the attributes of the samples were already encoded into the uploaded dataset by [19] with 1 as positive and 0 as not positive in answer to the attribute. For the column “smoking entire life”, 0 represents that the person has never smoked, 1 represents that the person has smoked in his life, and 2 represents that the smoking habit is still present in the person. A total of 136 rows were selected from the dataset and the missing values in the specific attributes were replaced using K-nearest neighbor [20] impute. Afterwards, the outliers of the dataset were detected using interquartile range (IQR) proximity rule [21]. For all the columns, the outlier data were removed using the proximity rule of IQR (data not in between the upper bound and lower bound of interquartile range). In order to evaluate the performance of the model, the data samples were split: 20% were used for training, while the rest of the samples were used for testing the prediction models. In Table 1, the programs and packages used in the research are included, along with their respective versions.

Table 1.
Details of the versions of the libraries and programs used in the research.
3.2.3. Developing Correlation Matrix
The correlation matrix of the dataset was plotted using the matplotlib.pyplot library. The correlation matrix is a two-dimensional figure defining the relationship among the variables of the dataset. The matrix was developed using the Pearson correlation matrix [22]. The matrix was visualized using the Seaborn library. The detailed explanation understanding the relationship of the variables is given in the results discussion.
3.2.4. Balancing the Dataset
Due to unequal class distribution, the dataset was imbalanced. In order to increase the performance of the machine learning algorithms, the dataset was balanced through the synthetic minority oversampling technique (SMOTE) [23]. In this technique, the minority class is oversampled. In this data augmentation, new records are generated from the minority existing records. In the oversampling technique of SMOTE used in the code, the examples that are close to the feature space are selected which are connected to form a line segment with all the records in between. The synthetic space is chosen as a convex combination between two chosen spaces. The target variable is the mortality of patients with two discrete values: 1, representing the death of the patient, and 0, representing that the patient is alive.
3.2.5. Distribution of Data
To verify the reliability of the updated dataset after oversampling, the distribution of attributes of the dataset was checked. For categorical values, the frequency distribution before and after balancing the dataset was analyzed. For continuous values, the KDE plot and p-value distribution was taken into consideration to understand the significance of the columns with respect to the class. The machine learning algorithms were applied after verifying the equal sample distribution and the descriptive statistics of attributes in the dataset before and after oversampling.
3.3. Machine Learning Algorithms
The machine learning algorithms used in the research study were selected based on the most popular, supervised, classification training models [24] available.
3.3.1. Random Forest Classifier
The random forest classifier [25] is one of the most popular supervised training machine learning algorithms. The algorithm can be utilized both for classification and regression model problems. In this model, the dataset is divided into multiple subsets which are known as “decision trees”. The algorithm takes the average from all the subsets to increase the model’s predictive and accuracy performance. The number of subdivisions of the problem (that is, the more decision trees in the problem) increases the efficiency of the overall model. The number of trees in the random forest can also have an effect of the overfitting issue of the dataset. The model is very well capable of handling datasets with higher dimensions.
3.3.2. Decision Tree Classifier
The decision tree classifier [26] is a supervised learning technique that is mostly used for classification-related problems. On given conditions, the model is capable of producing the accurate graphic representation of all the possible solution approaches in a predictive model. Every node in the algorithm represents a feature of the dataset. The branches are the decisions that lead to the child which are also the outcome of the features. The decisions are usually based on two conditions: yes and no.
3.3.3. Support Vector Machine
Support vector machine [27] is a widely used classification machine learning model. The model aims to create a hyperplane line or “decision boundary” that can segregate all the given dimensional classes of the dataset. The hyperplane is created by using the extreme points. This points are also called support vectors, naming the overall algorithm. The new dataset is then placed in the correct decision region. This is how the model is able to predict outcomes for a given column.
3.3.4. Gradient Descent Classifier
The gradient descent classifier [28] is one of the most popular classification learning models. It is an optimizing procedure which makes trade-off between runtime for update and accuracy. There are two types of gradient boosting algorithms: batch gradient and stochastic gradient descent. In batch gradient boosting, the update is calculated by forming and calculating derivatives from the input training data. On the other hand, in stochastic gradient boosting, the derivative of each data is calculated from the instance of each training data.
3.3.5. Logistic Regression
Logistic regression [29] is a popular supervised machine learning model. This model is applicable for classification supervised machine learning and it can be classified into binary and multinomial logistic regression algorithm based on the outcome. The curve of logistic regression is different than linear regression, in a S-form shape. The S-shaped curve predicts the maximum values of 0 and 1. The S-form curve is known as sigmoid function or logistic function.
3.3.6. K-Nearest Neighbor
K-nearest neighbor (K-NN) [30] is a simple supervised machine learning technique. It is a technique used in classification algorithms where new data are categorized based on trained available datasets. The available data are stored and new data are classified based on the similarity found with available data. It is called lazy learner algorithm, as it does not make any underlying assumptions about trained data.
3.3.7. Extreme Gradient Boosting
The eXtreme gradient boosting (XgBoost) [31] is a popular machine learning algorithm that is a developed version of gradient boosting machines. For every independent variable in the dataset, a weight is assigned, and based on the weight, decision trees are formed. If the probability of the weight of the predicted variable being wrong is increased, then the algorithm is fed into a second decision tree. The process is continued until the errors are minimized. This results in stronger machine learning models and enhances the concepts of gradient boosting.
3.3.8. AdaBoost
AdaBoost [32] is a common machine learning algorithm with decision trees of one level, which are also called decision stumps. The weak classifying algorithms are combined into a stronger classifier. The algorithm has high performance in binary classification.
3.3.9. Light Gradient Boosting Machine
Light gradient boosting machine (LGBM) [33] is a popular machine learning algorithm that uses the concept of decision trees and gradient boosting framework. The algorithm can overcome the limitations of common gradient boosting algorithms by using gradient-based one side sampling and exclusive feature bundling (EFB) techniques. The combination of the two techniques greatly increases the memory storage, processing power, and overall accuracy of the model.
3.3.10. Naive Bayes
Naive Bayes [34] is a powerful classification machine learning algorithm. It uses the most fundamental Bayes theorem of probability during calculation. The algorithm assumes that the occurrence of features and outcomes are independent of each other. In this paper, Gaussian distribution of the model was used. The model follows a normal distribution. If continuous value is taken instead of discrete, then the model assumes that these values are dataset sampled from Gaussian distribution.
3.3.11. Artificial Neural Network
Artificial neural network (ANN) [35] is a widely popular algorithm for data processing. In this algorithm, the processed data are organized in an architecture resembling the cerebral cortex of the human brain. As a result, ANN algorithms are capable of accomplishing results which could not be achieved by conventional algorithm codes. In the architecture, the nodes in the network can be considered as weighted graph organized in multi-level, while each nodes of the graph are connected with edges and nonlinear activation function. In the algorithm, in between the input and output layer, there are multiple hidden layers in which every layer contains at least one node and it is interconnected with the previous and next layer.
3.4. Parameter Optimization and Cross-Validation
In order to best fit results, parameters in the models used are optimized through hyperparameter tuning. For the confidence of the applied machine learning models to not just work on the given dataset, but also real-life data, cross-validation is used. Cross-validation is a technique used to resample the data to avoid overfitting and to estimate the true prediction errors of the models used in the research [36]. In this research, 10-fold cross-validation was applied. For parameter tuning, one of the post popular methods, grid search, was adopted. In this technique, a range of selection of parameters are taken and the combination of the best fit parameters validates the machine learning algorithm more with better accuracy [37]. The detailed statistics of the hyperparameters used for the applied machine learning algorithms is given in Table 2.
Table 2.
Classification parameters used in the research.
3.5. Evaluation Metrics
The machine learning algorithms used in the research were evaluated based on three metrics: accuracy, precision, recall, and F1 score. While evaluating the model, the accuracy of the algorithm identifies the relationship and pattern of the dataset based on the trained data. It overall accords the rate of the correct predicted data based on the input data. While evaluating the other three metrics, the confusion matrix can be helpful to understand the whole picture. In the confusion matrix, there are four evaluating criteria: true positive (TP), true negative (TN), false positive (FP), and false negative (FN). The confusion matrix to evaluate the performance of machine learning algorithms has been added in Table 3. A true positive is the number of outcomes where the model has correctly predicted the positive class. The true negative, at the same time, is the number of outcomes the model has correctly predicted in the negative class. On the other hand, the false positive and false negative are the outcomes where the model has incorrectly predicted a positive and negative class. The second factor of our evaluation metrics is the precision, which gives the ratio of the true positive by the total positive data predicted by our model. Precision is also called “positive predicted value”. The third factor, recall, is the ratio of data that are relevant to the instance. It is also called “sensitivity”. The final metric, F1 score, is the mean of the precision and recall of the dataset. It is primarily used to calculate the performance between two classifiers. The formula to calculate these performance metrics has been given below in Equations (1)–(4).
Table 3.
Confusion matrix to evaluate models.
4. Result and Discussion
According to Ref. [19], there are 24 columns in the dataset, among which the mortality of the patients is tested as the target variable while the rest of the columns are trained and tested as training variable. The columns are as follows: mortality of patients, WHO categories, hospital admission, gender, treatment for obstructive sleep apnea, smoking, diabetes mellitus (DM), cardiovascular disease (CVD), asthma, chronic kidney disease, active malignancy, and immune suppression, which are all categorical variables. The dataset was divided into two categories based on Ref. [19]: the independent variables and the dependable variables. The treatment for obstructive sleep apnea and factors associated with it are termed as independent factors. These are apnea hypopnea index (AHI), low oxyhemoglobin desaturation (LSAT), oxygen desaturation index (ODI), and respiratory disturbance index. The dependable variables for COVID-19 patients include the severity of a COVID-19 patient based on categorization of severity [38], number of days of hospitalization, number of mechanical ventilation or ICU days, and death of COVID-19 patients. The severity of the COVID-19 infected patient based on symptoms is described in Table 4. The presence of a dependable factor for any patients’ medical record was written in the dataset as 1 and the absence as 0, for ease of machine learning code. After preprocessing the dataset, to increase the performance metrics of the prediction algorithms, the dataset was balanced using SMOTE. The common symptoms of COVID-19 are fever, dry cough, dyspnea, myalgia, fatigue, hypolymphemia, and radiographic evidence of pneumonia [39].
Table 4.
Categorization of patients based on WHO progression scale [40].
The categorization of COVID-19 patients based on severity and effects of pulmonary of the infection helps to identify the patients who are at greater risk of death based on statistics. Based on the classification of majority class and minority class from the column of COVID-19 mortality, SMOTE was applied to oversample and balance the ratio of majority and minority class. Initially, the number of death for COVID-19 patients (majority class) was 96, while the number of alive patients from COVID-19 disease (minority class) was 40. After oversampling, the number of both majority and minority class were 96 each.
After balancing the dataset, the sample distribution of the attributes in the dataset before and after were checked and verified. For categorical values of parameters, the frequency distribution before and after balancing the dataset was observed to be equal and was visualized through pie charts. For continuous value attributes, kernel density estimate (KDE) was observed and the p-values for the columns were calculated. After the preprocessing, the dataset, the descriptive statistics of the attributes of the dataset before and after balancing the dataset using SMOTE was analyzed. A visualization of the KDE plot for the continuous values can be seen in Figure 2 and Figure 3. The statistical distribution of the categorical columns before and after balancing the dataset is given in Table 5. The p values for the attributes with continuous values has been added in Table 6. After verification of the descriptive data remaining intact before and after balancing the dataset, the correlation matrix was constructed for visualizing the relationship among parameters in the dataset. The correlation matrix is given in Figure 4. The interrelationship among parameters are expressed as 228, with values within a range from −1 to +1. The values closely associated with +1 are termed “strong correlation”, while the values closely associated with −1 are termed “weak correlation”. From the correlation matrix we can see that mortality of COVID-19 patients is closely associated with category 4 and category 5 of severely infected patients. Death of COVID-19 patients is also associated with comorbidity. There is weak correlation between gender (female, 1) and COVID-19. According to study, it is evident that male gender is more likely to be severely affected by COVID-19 than female [41]. The mortality is also associated with medical records of patients: the number of days spent in hospital and the number of days the patient has received mechanical ventilation. The independent factor associated with OSA is the respiratory saturation index, which has weak correlation with the mortality of COVID-19 patients. However, the treatment received by OSA patients is weakly correlated with the mortality of COVID-19 patients. This backs up our studies from the literature review that not receiving treatment for obstructive sleep apnea could possibility increase the comorbidity in COVID-19 patients, which also increases the severity and mortality [13]. The morbidity malignancy, smoking, diabetes, and respiratory distress index have a strong relation with the mortality of COVID-19 patients. These are also comorbidities of COVID-19 [42].
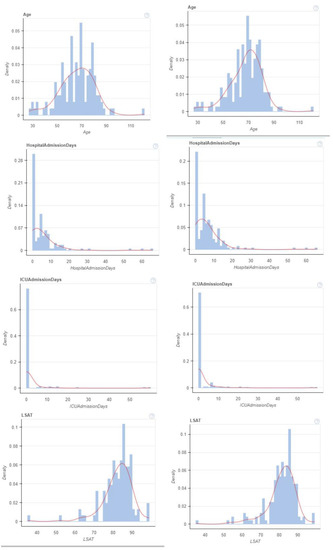
Figure 2.
KDE plot before and after balancing dataset for continuous values.
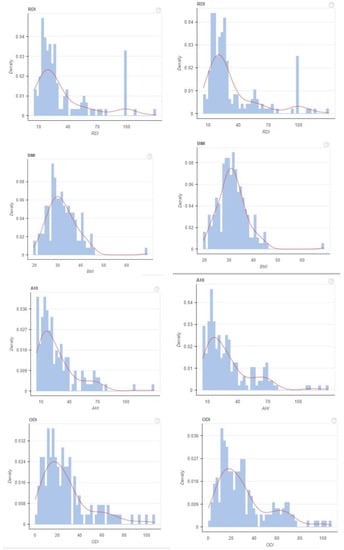
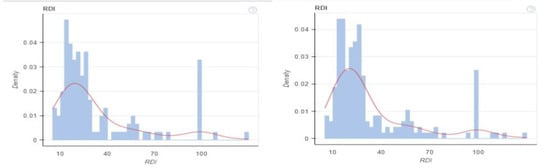
Figure 3.
KDE plot before and after balancing dataset for continuous values.
Table 5.
Frequency Distribution of categorical data before and after applying SMOTE.
Table 6.
p-values for columns in the dataset.
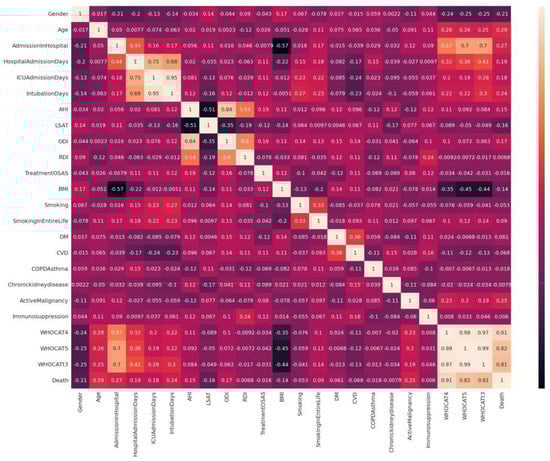
Figure 4.
Correlation matrix: understanding the relationship between variables.
After that, the dataset was fed to the machine learning algorithms based on the evaluation metrics. The six models implemented have an overall high accuracy and worked excellently. The models that were implemented are all popular classifying machine learning algorithms: decision tree, random forest, support vector machine, naive Bayes, gradient boosting, and artificial neural network. In the following research, the machine learning models implemented are random forest, support vector machine, gradient descent, naive Bayes, logistics regression, K-nearest neighbor, XgBoost, AdaBoost, LightGBM, and artificial neural network.
The machine learning algorithms gave outstanding performance as seen from Table 7. The accuracies for the models are logistic regression: 98.67%, K-NN: 99.33%, SVM: 98.67%, naive Bayes: 98.66%, decision tree: 98.67%, random forest: 99.99%, XgBoost: 98%, AdaBoost: 98.67%, LightGBM: 98%, gradient descent: 99.33%, and artificial neural network: 98.99%. The highest accuracy we achieved was from artificial neural network and random forest. All the models have accuracy over 97%. The precision scores of the machine learning models are logistic regression: 98.82%, K-NN: 99.38%, SVM: 98.75%, naive Bayes: 98.89%, decision tree: 98.26%, random forest: 99.99%, XgBoost: 97.64%, AdaBoost: 97.64%, LightGBM: 98.19%, gradient descent: 98.19%, and ANN: 100%. The highest precision score we obtained was from random forest. The recall scores of the models are logistic regression: 98.66%, K-NN: 99.38%, SVM: 98.75%, naive Bayes: 98.57%, decision tree: 97.95%, random forest: 99.99%, XgBoost: 98.04%, AdaBoost: 97.32%, LightGBM: 98.04%, gradient descent: 98.04%, and ANN: 98.99%. The highest recall score we obtained was from random forest. The F1 scores of the models are logistic regression: 98.65%, K-NN: 99.33%, SVM: 98.67%, naive Bayes: 98.64%, decision tree: 97.31%, random forest: 99.99%, XgBoost: 97.99%, AdaBoost: 97.31%, LightGBM: 97.99%, gradient descent: 97.99%, and ANN: 98.99%. The highest recall score we obtained was from the K-NN model. The trade-off between the sensitivity and specificity of the machine learning algorithms was measured through the receiver operating characteristic (ROC) curve [43]. The ROC area under curve (AUC) scores obtained through the analysis are as follows: logistic regression: 100%, K-NN: 100%, SVM: 100%, naive Bayes: 98.75%, decision tree: 98.04%, random forest: 99.99%, XGBoost: 100%, AdaBoost: 99.38%, LightGBM: 100%, and gradient boosting: 100%.
Table 7.
Overview of result statistics of the performance of machine learning algorithms.
In comparison to all the performance metrics of the applied algorithms, the accuracy, precision, recall, and F1 scores for random forest algorithm are highest, followed by ANN and K-NN. ANN model has better performance in predicting and retrieving data, giving the highest precision score of 100%. The machine learning algorithms had nearly perfect accuracy with very minimum error. Therefore, these algorithms are very reliable in comparison to the traditional method of suspecting critically affected patients.
5. Conclusions
The 11 machine learning algorithms used in the research are widely popular and are ideal classification supervised learning algorithms. The models had significant performance scores, making them reliable for decision-making. The highest performances were achieved by ANN, K-NN, and gradient boosting algorithms. The decision-making capability of these machine learning algorithms are highly reliable and they are capable of minimizing the human error caused during the stress in intensive care units. This paper recommends the application of these machine learning algorithms in order to assist medical workers to make critical emergency decisions. The efficiency and effectiveness of the algorithms in order to make decisions for large numbers of patients can also reduce the strain on medical workers who work in intensive care units. This approach can help medical workers identify critically affected patients, and with timely treatment and medical decisions, the life of the critical patient can be saved. This also allows proper distribution of ICU beds and mechanical ventilation which can overall minimize the mortality and damage caused by COVID.
Author Contributions
Conceptualization, A.B.S.; data curation, S.T.T.; formal analysis, S.T.T.; investigation, M.M.S.R.; methodology, S.T.T. and M.M.S.R.; validation M.M.S.R. and A.B.S.; visualization, M.M.S.R.; supervision, A.B.S.; software, S.T.T. and M.M.S.R.; project administration, A.B.S.; writing—original draft, S.T.T.; writing—review editing, A.B.S., S.T.T. and M.M.S.R. All authors have read and agreed to the published version of the manuscript.
Funding
The research has received no external funding.
Institutional Review Board Statement
Not applicable.
Informed Consent Statement
Not applicable.
Data Availability Statement
The dataset [19] is available in the following link for public access: obstructive sleep apnea COVID-19 and mortality (https://github.com/SidratulTanzilaTasmi/Obstruction-Sleep-Apnea-and-COVID-19) (Accessed on 27 June 2022).
Conflicts of Interest
The authors declare no conflict of interest.
References
- Wu, Y.C.; Chen, C.S.; Chan, Y.J. The outbreak of COVID-19: An overview. J. Chin. Med. Assoc. 2020, 83, 217. [Google Scholar] [CrossRef] [PubMed]
- Morens, D.M.; Breman, J.G.; Calisher, C.H.; Doherty, P.C.; Hahn, B.H.; Keusch, G.T.; Kramer, L.D.; LeDuc, J.W.; Monath, T.P.; Taubenberger, J.K. The origin of COVID-19 and why it matters. Am. J. Trop. Med. Hyg. 2020, 103, 955. [Google Scholar] [CrossRef] [PubMed]
- Struyf, T.; Deeks, J.J.; Dinnes, J.; Takwoingi, Y.; Davenport, C.; Leeflang, M.M.; Spijker, R.; Hooft, L.; Emperador, D.; Domen, J.; et al. Signs and symptoms to determine if a patient presenting in primary care or hospital outpatient settings has COVID-19. Cochrane Database Syst. Rev. 2021. [Google Scholar] [CrossRef]
- Yin, T.; Li, Y.; Ying, Y.; Luo, Z. Prevalence of comorbidity in Chinese patients with COVID-19: Systematic review and meta-analysis of risk factors. BMC Infect. Dis. 2021, 21, 200. [Google Scholar] [CrossRef] [PubMed]
- Punjabi, N.M. The epidemiology of adult obstructive sleep apnea. Proc. Am. Thorac. Soc. 2008, 5, 136–143. [Google Scholar] [CrossRef] [PubMed]
- Bonsignore, M.R.; Baiamonte, P.; Mazzuca, E.; Castrogiovanni, A.; Marrone, O. Obstructive sleep apnea and comorbidities: A dangerous liaison. Multidiscip. Respir. Med. 2019, 14, 8. [Google Scholar] [CrossRef] [Green Version]
- Eriksson, C.O.; Stoner, R.C.; Eden, K.B.; Newgard, C.D.; Guise, J.M. The association between hospital capacity strain and inpatient outcomes in highly developed countries: A systematic review. J. Gen. Intern. Med. 2017, 32, 686–696. [Google Scholar] [CrossRef] [Green Version]
- Shams, A.B.; Raihan, M.; Sarker, M.; Khan, M.; Uddin, M.; Preo, R.B.; Monjur, O. Telehealthcare and Covid-19: A Noninvasive & Low Cost Invasive, Scalable and Multimodal Real-Time Smart-phone Application for Early Diagnosis of SARS-CoV-2 Infection. arXiv 2021, arXiv:2109.07846. [Google Scholar]
- Adib, Q.A.R.; Tasmi, S.T.; Bhuiyan, M.; Islam, S.; Raihan, M.; Sarker, M.; Shams, A.B. Prediction Model for Mortality Analysis of Pregnant Women Affected With COVID-19. arXiv 2021, arXiv:2111.11477. [Google Scholar]
- Miller, M.A.; Cappuccio, F.P. A systematic review of COVID-19 and obstructive sleep apnoea. Sleep Med. Rev. 2021, 55, 101382. [Google Scholar] [CrossRef]
- McSharry, D.; Lam, M.T.; Malhotra, A. OSA as a probable risk factor for severe COVID-19. J. Clin. Sleep Med. 2020, 16, 1649. [Google Scholar] [CrossRef] [PubMed]
- Voncken, S.; Feron, T.; Karaca, U.; Beerhorst, K.; Klarenbeek, P.; Straetmans, J.; de Vries, G.; Kolfoort-Otte, A.; de Kruif, M. Impact of obstructive sleep apnea on clinical outcomes in patients hospitalized with COVID-19. Sleep Breath. 2021, 1–9. [Google Scholar] [CrossRef] [PubMed]
- Hariyanto, T.I.; Kurniawan, A. Obstructive sleep apnea (OSA) and outcomes from coronavirus disease 2019 (COVID-19) pneumonia: A systematic review and meta-analysis. Sleep Med. 2021, 82, 47–53. [Google Scholar] [CrossRef] [PubMed]
- McSharry, D.; Malhotra, A. Potential influences of obstructive sleep apnea and obesity on COVID-19 severity. J. Clin. Sleep Med. 2020, 16, 1645. [Google Scholar] [CrossRef] [PubMed]
- Maas, M.B.; Kim, M.; Malkani, R.G.; Abbott, S.M.; Zee, P.C. Obstructive sleep apnea and risk of COVID-19 infection, hospitalization and respiratory failure. Sleep Breath. 2021, 25, 1155–1157. [Google Scholar] [CrossRef]
- Tufik, S. Obstructive Sleep Apnea as a comorbidity to COVID-19. Sleep Sci. 2020, 13, 181. [Google Scholar]
- Nandy, K.; Salunke, A.; Pathak, S.K.; Pandey, A.; Doctor, C.; Puj, K.; Sharma, M.; Jain, A.; Warikoo, V. Coronavirus disease (COVID-19): A systematic review and meta-analysis to evaluate the impact of various comorbidities on serious events. Diabetes Metab. Syndr. Clin. Res. Rev. 2020, 14, 1017–1025. [Google Scholar] [CrossRef]
- Parish, J.M.; Somers, V.K. Obstructive sleep apnea and cardiovascular disease. Mayo Clin. Proc. 2004, 79, 1036–1046. [Google Scholar] [CrossRef] [Green Version]
- Ho, J.; Donders, H.; Zhou, N.; Schipper, K.; Su, N.; de Lange, J. Association between the degree of obstructive sleep apnea and the severity of COVID-19: An explorative retrospective cross-sectional study. PLoS ONE 2021, 16, e0257483. [Google Scholar] [CrossRef]
- Murti, D.M.P.; Pujianto, U.; Wibawa, A.P.; Akbar, M.I. K-Nearest Neighbor (K-NN) based Miss-ing Data Imputation. In Proceedings of the 2019 5th International Conference on Science in Information Technology (ICSITech), Yogyakarta, Indonesia, 23–24 October 2019; pp. 83–88. [Google Scholar] [CrossRef]
- Vinutha, H.; Poornima, B.; Sagar, B. Detection of outliers using interquartile range technique from intrusion dataset. In Information and Decision Sciences; Springer: Berlin/Heidelberg, Germany, 2018; pp. 511–518. [Google Scholar]
- Benesty, J.; Chen, J.; Huang, Y.; Cohen, I. Pearson correlation coefficient. In Noise Reduction in Speech Processing; Springer: Berlin/Heidelberg, Germany, 2009; pp. 1–4. [Google Scholar]
- Elreedy, D.; Atiya, A.F. A comprehensive analysis of synthetic minority oversampling technique (SMOTE) for handling class imbalance. Inf. Sci. 2019, 505, 32–64. [Google Scholar] [CrossRef]
- Singh, A.; Thakur, N.; Sharma, A. A review of supervised machine learning algorithms. In Proceedings of the 2016 3rd International Conference on Computing for Sustainable Global Development (INDIACom), New Delhi, India, 16–18 March 2016; pp. 1310–1315. [Google Scholar]
- Breiman, L. Random forests. Mach. Learn. 2001, 45, 5–32. [Google Scholar] [CrossRef] [Green Version]
- Song, Y.Y.; Ying, L. Decision tree methods: Applications for classification and prediction. Shanghai Arch. Psychiatry 2015, 27, 130. [Google Scholar] [PubMed]
- Cortes, C.; Vapnik, V. Support-vector networks. Mach. Learn. 1995, 20, 273–297. [Google Scholar] [CrossRef]
- Ruder, S. An overview of gradient descent optimization algorithms. arXiv 2016, arXiv:1609.04747. [Google Scholar]
- Peng, C.Y.J.; Lee, K.L.; Ingersoll, G.M. An introduction to logistic regression analysis and reporting. J. Educ. Res. 2002, 96, 3–14. [Google Scholar] [CrossRef]
- Zhang, M.L.; Zhou, Z.H. ML-KNN: A lazy learning approach to multi-label learning. Pattern Recognit. 2007, 40, 2038–2048. [Google Scholar] [CrossRef] [Green Version]
- Chen, T.; He, T.; Benesty, M.; Khotilovich, V.; Tang, Y.; Cho, H.; Chen, K. Xgboost: Extreme Gradient Boosting; R Package Version 0.4-2; Microsoft: New York, NY, USA, 2015; pp. 1–4. [Google Scholar]
- Schapire, R.E. A brief introduction to boosting. Ijcai 1999, 99, 1401–1406. [Google Scholar]
- Ke, G.; Meng, Q.; Finley, T.; Wang, T.; Chen, W.; Ma, W.; Ye, Q.; Liu, T.Y. Lightgbm: A highly efficient gradient boosting decision tree. Adv. Neural Inf. Process. Syst. 2017, 30. [Google Scholar]
- Rish, I. An empirical study of the naive Bayes classifier. In Proceedings of the IJCAI-01: Seventeenth International Joint Conference on Artificial Intelligence, Seattle, WA, USA, 4–10 August 2001; pp. 41–46. [Google Scholar]
- Uhrig, R.E. Introduction to artificial neural networks. In Proceedings of the IECON’95—21st Annual Conference on IEEE Industrial Electronics, Orlando, FL, USA, 6–10 November 1995; IEEE: Piscataway, NJ, USA, 1995; Volume 1, pp. 33–37. [Google Scholar]
- Berrar, D. Cross-Validation. 2019. Available online: https://www.researchgate.net/publication/324701535_Cross-Validation (accessed on 27 June 2022).
- Liashchynskyi, P.; Liashchynskyi, P. Grid search, random search, genetic algorithm: A big comparison for NAS. arXiv 2019, arXiv:1912.06059. [Google Scholar]
- Zu, Z.Y.; Jiang, M.D.; Xu, P.P.; Chen, W.; Ni, Q.Q.; Lu, G.M.; Zhang, L.J. Coronavirus disease 2019 (COVID-19): A perspective from China. Radiology 2020, 296, E15–E25. [Google Scholar] [CrossRef] [Green Version]
- Lei, S.; Jiang, F.; Su, W.; Chen, C.; Chen, J.; Mei, W.; Zhan, L.Y.; Jia, Y.; Zhang, L.; Liu, D.; et al. Clinical characteristics and outcomes of patients undergoing surgeries during the incubation period of COVID-19 infection. EClinicalMedicine 2020, 21, 100331. [Google Scholar] [CrossRef]
- Marshall, J.C.; Murthy, S.; Diaz, J.; Adhikari, N.; Angus, D.C.; Arabi, Y.M.; Baillie, K.; Bauer, M.; Berry, S.; Blackwood, B.; et al. A minimal common outcome measure set for COVID-19 clinical research. Lancet Infect. Dis. 2020, 20, e192–e197. [Google Scholar] [CrossRef]
- Kopel, J.; Perisetti, A.; Roghani, A.; Aziz, M.; Gajendran, M.; Goyal, H. Racial and gender-based differences in COVID-19. Front. Public Health 2020, 8, 418. [Google Scholar] [CrossRef] [PubMed]
- Sanyaolu, A.; Okorie, C.; Marinkovic, A.; Patidar, R.; Younis, K.; Desai, P.; Hosein, Z.; Padda, I.; Mangat, J.; Altaf, M. Comorbidity and its impact on patients with COVID-19. SN Compr. Clin. Med. 2020, 2, 1069–1076. [Google Scholar] [CrossRef] [PubMed]
- Hajian-Tilaki, K. Receiver operating characteristic (ROC) curve analysis for medical diagnostic test evaluation. Casp. J. Intern. Med. 2013, 4, 627. [Google Scholar]
Publisher’s Note: MDPI stays neutral with regard to jurisdictional claims in published maps and institutional affiliations. |
© 2022 by the authors. Licensee MDPI, Basel, Switzerland. This article is an open access article distributed under the terms and conditions of the Creative Commons Attribution (CC BY) license (https://creativecommons.org/licenses/by/4.0/).