Abstract
Minimal joint space width (mJSW) is a radiographic measurement used in the diagnosis of hip osteoarthritis. A large variance when measuring mJSW highlights the need for a supporting diagnostic tool. This study aimed to estimate the reliability of a deep learning algorithm designed to measure the mJSW in pelvic radiographs and to estimate agreement between the algorithm and orthopedic surgeons, radiologists, and a reporting radiographer. The algorithm was highly consistent when measuring mJSW with a mean difference at 0.00. Human readers, however, were subject to variance with a repeatability coefficient of up to 1.31. Statistically, although not clinically significant, differences were found between the algorithm’s and all readers’ measurements with mean measured differences ranging from −0.78 to −0.36 mm. In conclusion, the algorithm was highly reliable, and the mean measured difference between the human readers combined and the algorithm was low, i.e., −0.5 mm bilaterally. Given the consistency of the algorithm, it may be a useful tool for monitoring hip osteoarthritis.
1. Introduction
Osteoarthritis (OA) is a common global public health problem. Affecting the large joints such as the hip and the knee, OA has become a major disabling condition particularly among the elderly [1,2,3]. Hip dysplasia in the younger population may however lead to early onset of OA [4,5]. Globally, OA affects more than 230 million individuals. Hip OA makes up approximately 32 million of these cases, causing it to be a significant public health problem [6].
The initial diagnosis of hip OA is often based on the clinical presentation of the patient and supported by pelvic radiographs [2,4,7], where minimal joint space width (mJSW) is the key parameter supported by osteophyte formation and subchondral sclerosis [8,9]. The radiographic definition and classification of hip OA lacks consensus between healthcare professionals, and the final diagnosis is often based on subjective radiographic findings combined with patient history and clinical findings [8,9]. The radiographic definition and classification of hip OA lack consensus between healthcare professionals, and the mJSW defining hip OA has varied between 1.5 and 4.0 mm. An mJSW ≤ 2 mm has been found to have a strong association to self-reported hip pain in patients aged 60 years and older [8]. The final diagnosis of hip OA is often based on subjective radiographic findings combined with patient history and clinical findings [8,9].
In the realm of radiology, AI and machine learning (ML) have gained significant traction, especially evident in the fact that around 75% of FDA-approved AI/ML-Enabled Medical Devices pertain to the field’s subspecialty of radiology [10]. A study has demonstrated that when using deep learning to grade joint space narrowing on pelvic radiographs as absent, mild, moderate or severe, the performance of deep learning is similar to the performance of expert radiologists [9]. In some hospitals, hip osteoarthritis is not routinely reported by expert radiologists, but often by orthopedic surgeons or radiographers. Thus, it is necessary to test the reliability and agreement between deep learning and other healthcare professions.
The objectives of this study were to estimate the reliability of a deep learning algorithm designed to measure mJSW in anterior–posterior (AP) pelvic radiographs and to estimate agreement between the algorithm and trained healthcare personnel.
2. Materials and Methods
2.1. Ethics and Study Design
In this retrospective study, a deep learning algorithm, trained to measure the mJSW of the hip, was applied to 78 radiographs. For comparison, a senior and a junior radiologist, a senior and a junior orthopedic surgeon, and one senior reporting radiographer evaluated the radiographs regarding the mJSW. Approval of the study was given by the Danish National Committee on Health Research Ethics (Project-ID: 2103745). The study was registered with the regional health authorities (Project-ID: 21/22036). All analyses were performed in accordance with the current Guidelines for Reporting Reliability and Agreement Studies [11,12].
2.2. Study Population
Seventy-eight weight-bearing AP radiographs of the pelvis from adults (≥18 years) with nontraumatic hip pain were consecutively collected at Odense University Hospital in a retrospective manner. Radiographs with signs of congenital abnormalities, arthroplasty/surgical hardware, fractures, or surgical sequelae were excluded. Finally, radiographs without the entire pelvis and/or proximal femur were excluded from the study [13]. All data were stratified by sex and age to ensure that the sample represented about the same number of females and males both above and below the age of 50 years [13].
2.3. AI Algorithm and Processing of Study Data
The newly developed software is a proprietary product (RBhipTM, Radiobotics, Copenhagen, Denmark) to automate the measurement of mJSW of both hips in pelvic radiographs. In short, the algorithm takes standard pelvic radiographs in the DICOM format as input, and as output it provides a DICOM secondary capture with the automated measurements. First, the pelvic radiograph is vertically split in two, and subsequently, regions of interest (ROIs) containing the left and right hip joints are extracted. For both the left and right ROIs, the femoral and pelvic bones are segmented, and the contours of the femoral head and acetabular sourcil (most sclerotic line of the acetabular roof) are identified. The Euclidean point-to-point distance between the contour of the femoral head and the acetabular sourcil is estimated, and the minimum distance between the lateral and medial extents of the acetabular sourcil is reported as the mJSW. The algorithm was developed using computer vision and deep learning trained on more than 2900 manually annotated pelvic radiographs. The algorithm was containerized and deployed as a DICOM node running within the firewalls of the hospital. The radiographs were forwarded directly from the Picture Archiving and Communication System (PACS) (GE Healthcare, Chicago, IL, USA) to a secure destination within the hospital firewall, and the results were afterwards uploaded to the Research Electronic Data Capture (REDCap) database.
2.4. Anatomical Definition
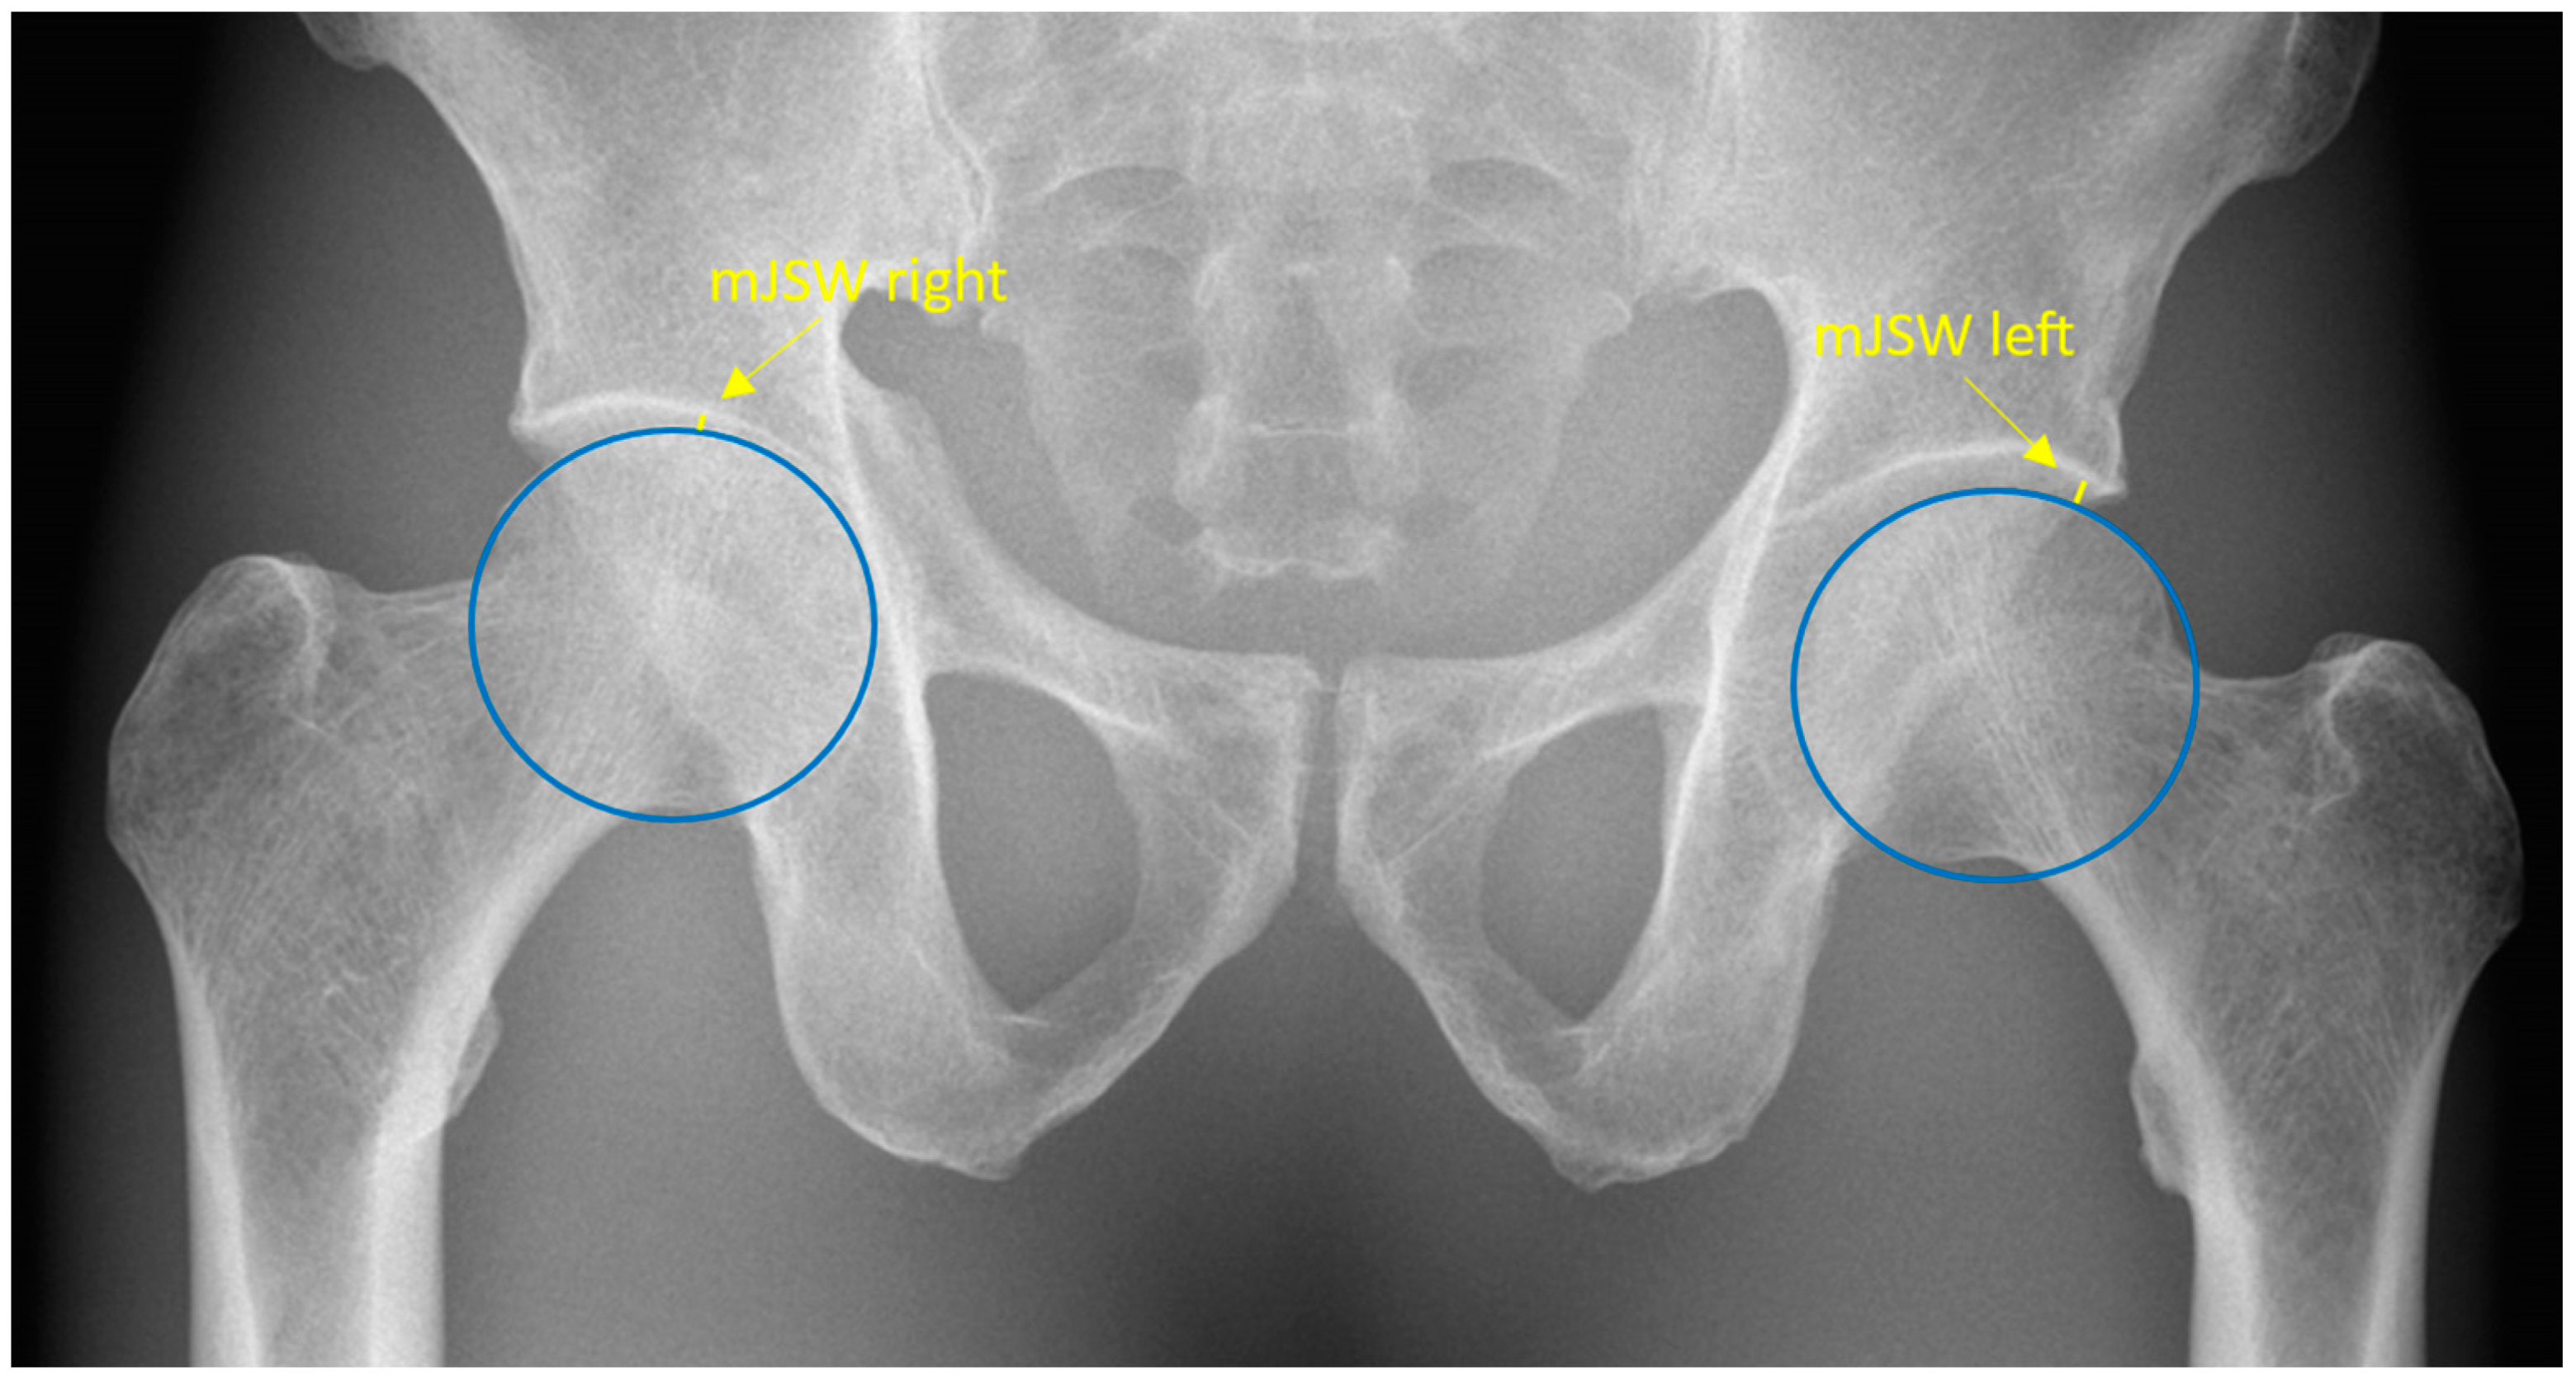
The mJSW is anatomically defined as the minimum width of the superolateral femoroacetabular joint space. Radiographically, the mJSW is defined as a line indicating the narrowest part of the superolateral aspect of the femoroacetabular joint, as shown in Figure 1. The superolateral aspect of the acetabulum is defined by the sclerotic sourcil, which refers to the weight-bearing, sclerotic surface of the acetabulum.
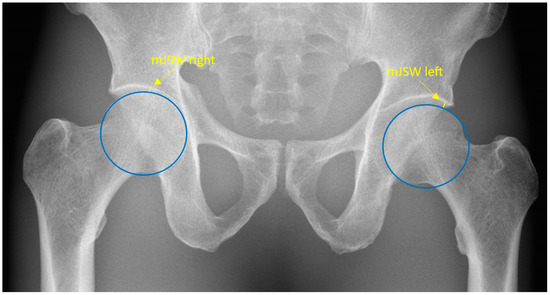
Figure 1.
Pelvic radiograph. The blue circles depict the two femoral heads. The yellow lines represent the minimal joint space width and are specified by the yellow arrows.
2.5. Data Collection
The five human readers consisted of two senior readers, a musculoskeletal (MSK) radiologist (21 years of experience) and a consultant hip surgeon (8 years of experience), two junior readers, an MSK radiologist (3 years of experience) and a hip surgeon (5 years of experience), and a reporting radiographer with 12 years of experience. Prior to evaluating the radiographs, the 5 readers received a protocol defining the mJSW to help minimize systematic bias. Blinded to each other’s results and to clinical information, the readers measured the mJSW in all 78 pelvic radiographs within a time span of three months. Five of the radiographs were reported 3 times by all readers. All measurements were made digitally in PACS and recorded in the REDCap database. The algorithm measured all radiographs twice, approximately two weeks apart, to assess its consistency.
2.6. Statistical Analyses
Sample size was estimated assuming a standard deviation of 2.1 and a clinically acceptable limit of agreement of 5 degrees (LCEA). A total of 176 samples were deemed necessary. This sample size aimed to demonstrate a comparable level of agreement between the algorithm and human readers, achieving a statistical power of 80% at a significance level of 5%. As measurements were conducted bilaterally and repeated three times for each of five patients (resulting in an additional 2 × 5 measurements), the final required patient count was determined to be 78.
The mean value, standard deviation (SD), and range for all measurements were calculated, and scatterplots were used to visualize bivariate associations. The difference between the first and second measurements by the algorithm was presented with mean, SD, range, and first and third quartiles. Bland–Altman (BA) plots with limits of agreement (LoA), bias, and 95% confidence intervals (CI) were used to illustrate the agreement between the algorithm and the readers individually. The LoA are defined as the estimated interval wherein 95% of all differences between the algorithm and the readers will fall, assuming that all the data are normally distributed while the bias is defined as the mean measured difference between algorithm and reader [14,15]. Finally, repeatability coefficients (RCs) were calculated to assess inter- and intraobserver variability. The RC represents the value below which an absolute difference between 2 repeated measurements will fall with a probability of 95%. All p-values < 0.05 were considered statistically significant. For all statistical analyses, STATA version 17.0 (StataCorp. 2021, College Station, TX, USA) was used.
3. Results
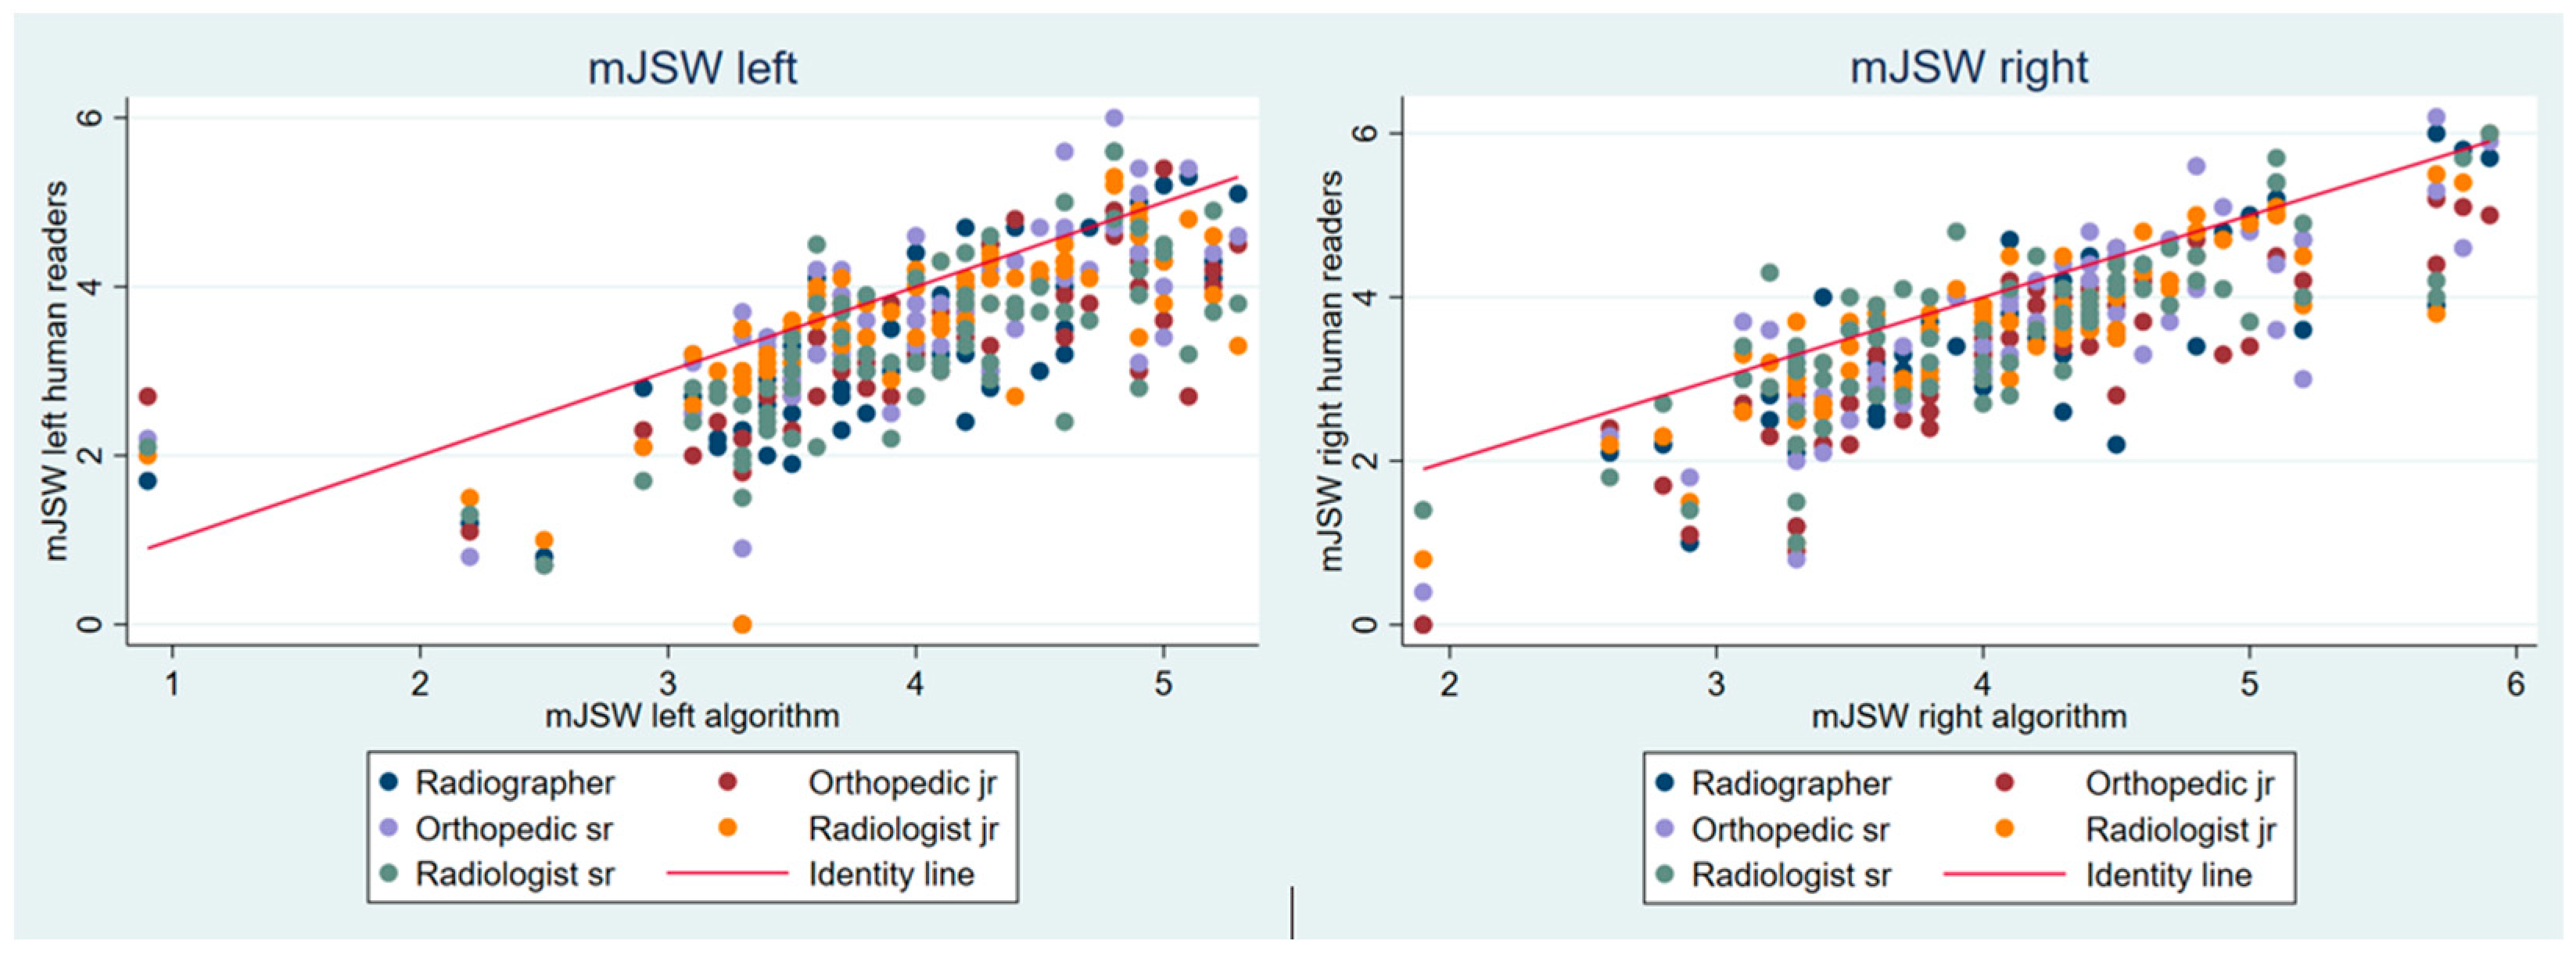
The algorithm was not able to analyze 7 of the 78 radiographs. The remaining 71 images were analyzed by both the algorithm and readers and were therefore included in the study. For the 71 radiographs, the average age was 50.1 years, and the gender distribution was 36 females and 35 males. The mJSW values tended to be lower for the readers than for the algorithm. For the five readers, the mean measured mJSW for the left hip ranged from 3.27 to 3.59 mm, whereas it was 3.96 mm for the algorithm. On the right side, the corresponding measurements ranged from 3.27 to 3.65 mm for the readers and 4.05 mm for the algorithm (Figure 2 and Table 1).
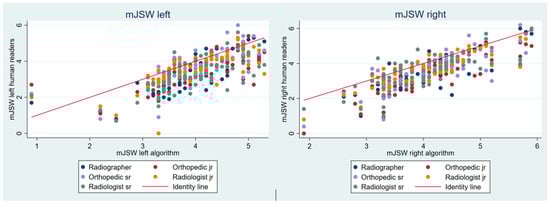
Figure 2.
Scatterplots with reader measurements of the minimal joint space width over algorithm measurements. mJSW: minimal joint space width, jr.: junior, sr.: senior.

Table 1.
Mean measurements of the minimal joint space width including standard deviation and range for the readers and the algorithm (n = 71).
When double reading, the algorithm was highly consistent, agreeing with itself either completely or close to completely, with a difference on the 14th decimal digit (Table 2).
Table 2.
First read by the algorithm (mean, range, and first and third quartiles) and differences between first and second reads (n = 71).
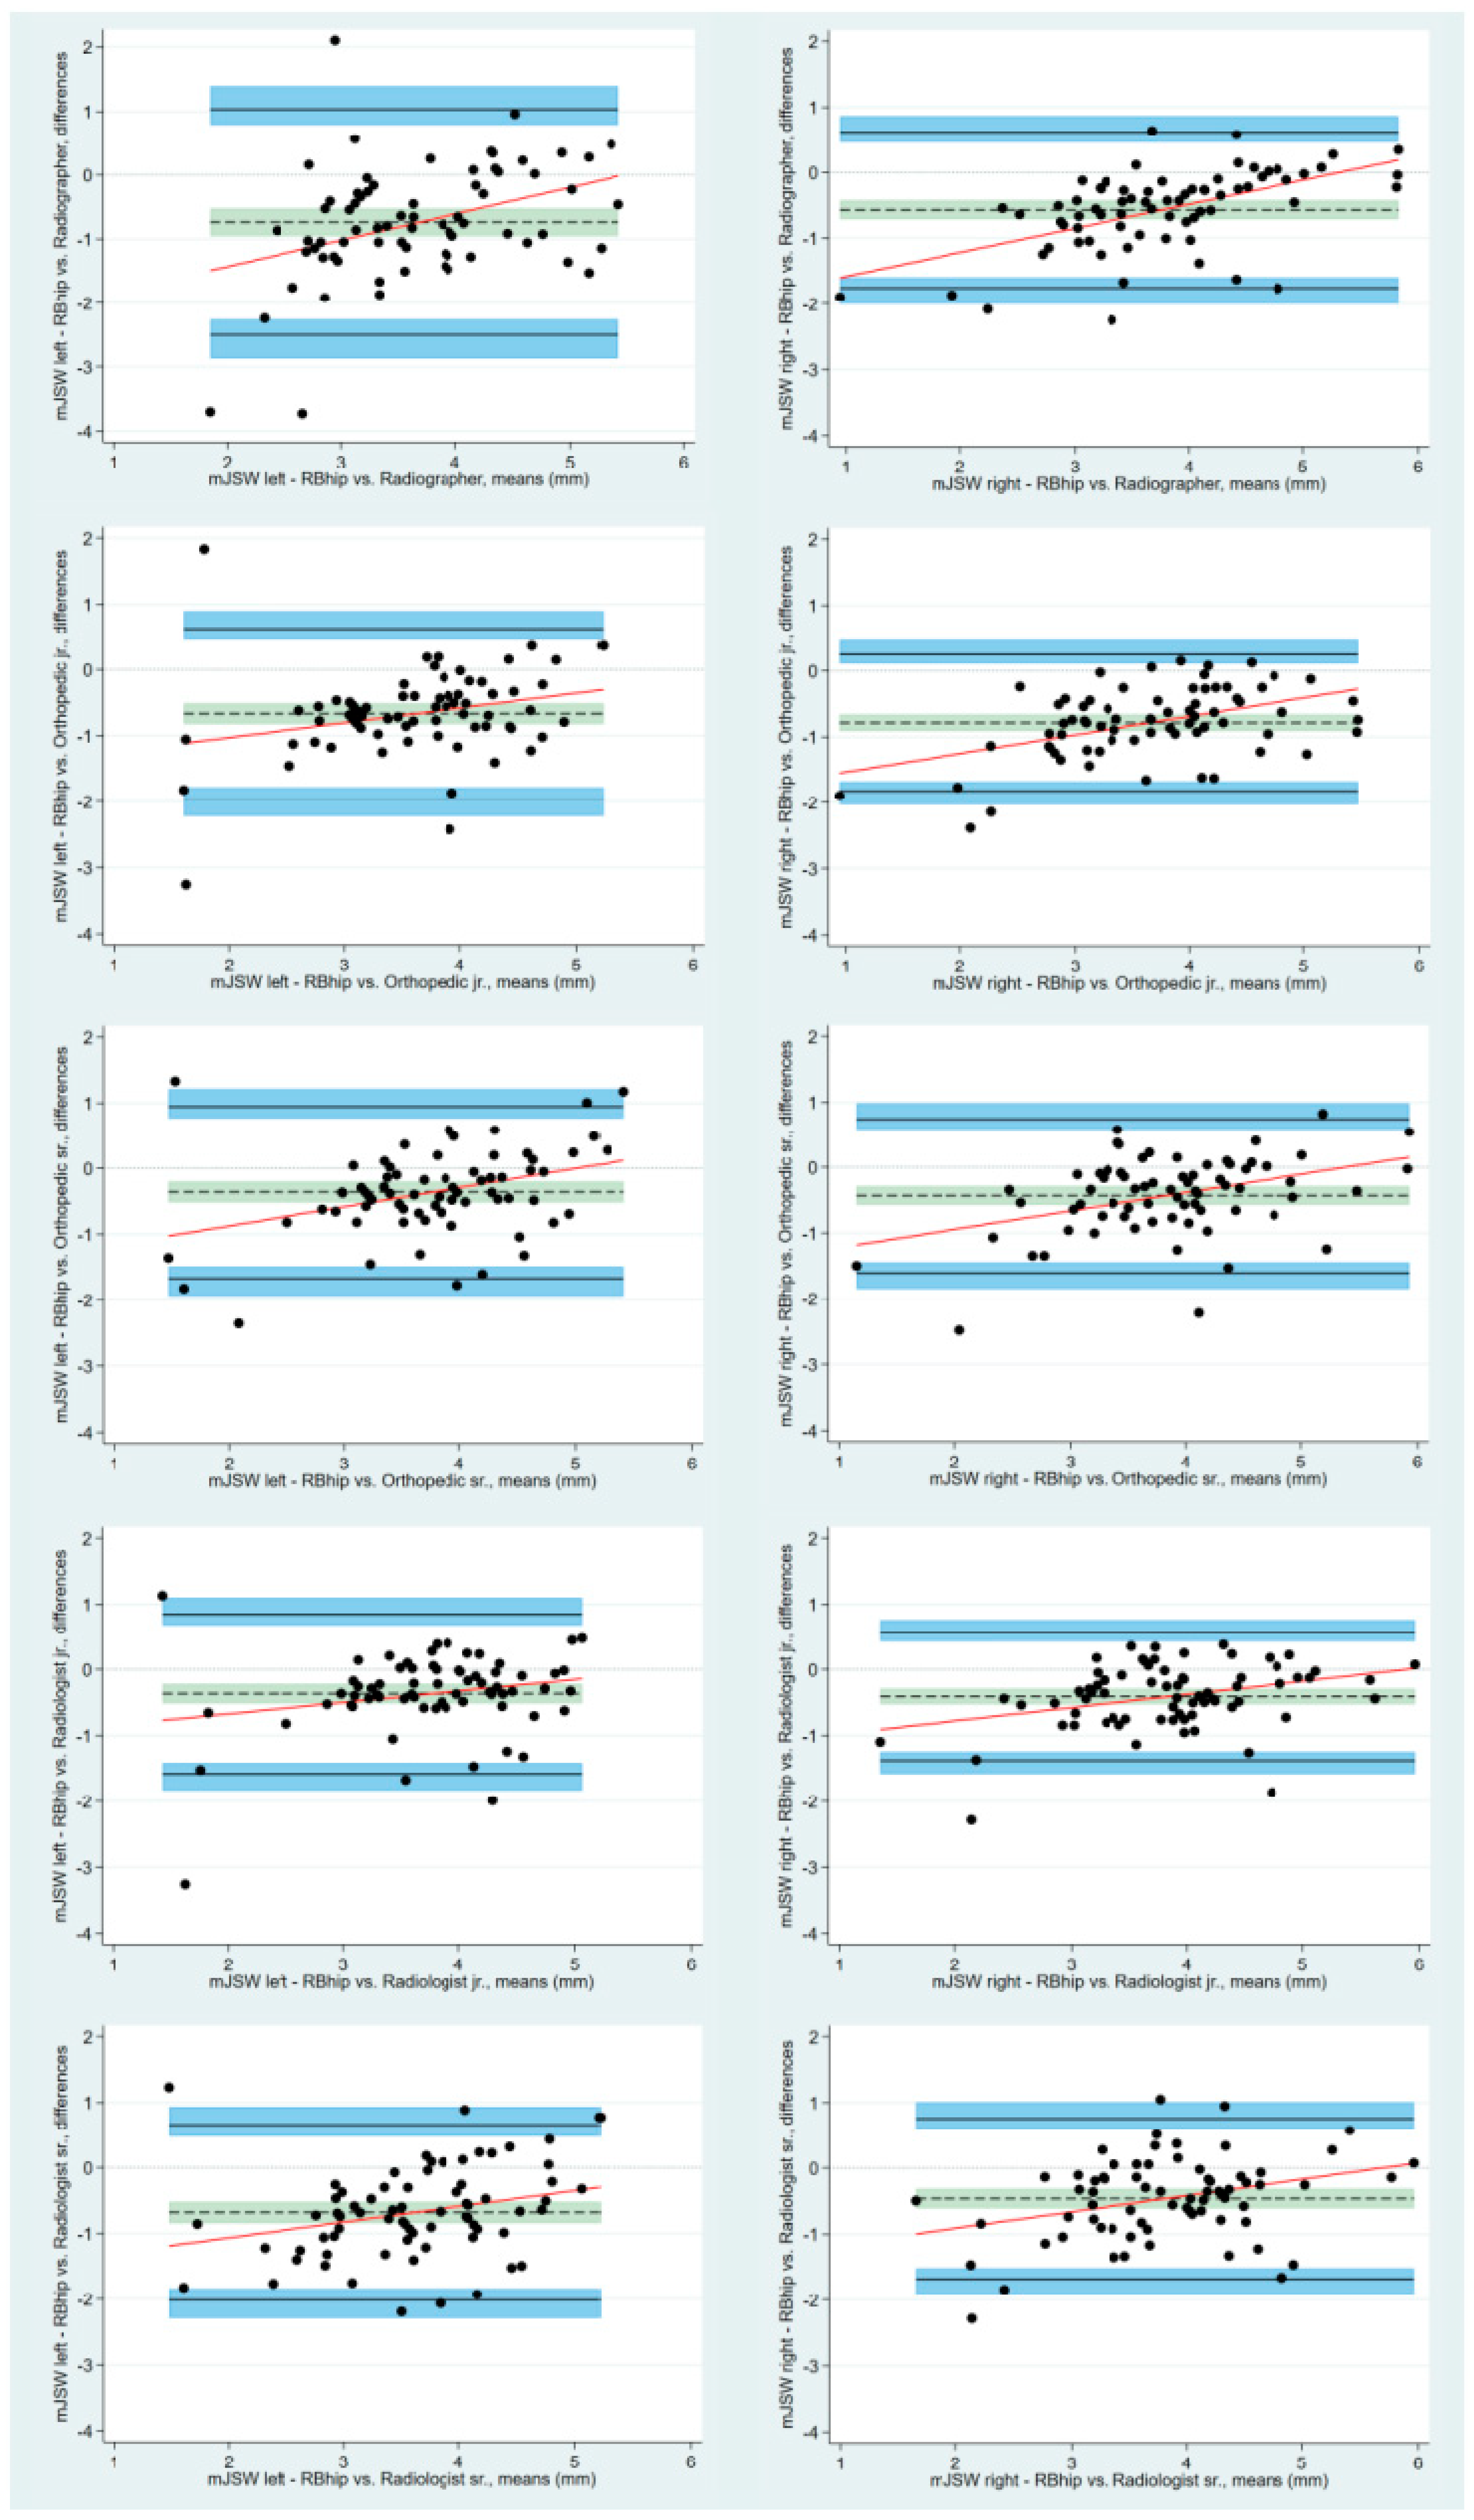
The BA plots with LoA showed that the bias estimates between all the readers and the algorithm were statistically different from 0, indicating that there is a statistically significant difference between the reader measurements and the algorithm measurements of the mJSW (Figure 3). On the left hips, the bias estimates for the mJSW ranges from −0.68 mm (95% CI: −0.85 to −0.52) to −0.36 mm (95% CI: −0.52 to −0.21) for the senior orthopedic surgeon and the senior radiologist, respectively. On the right hips, the corresponding values are −0.78 mm (95% CI: −0.91 to −0.66) to −0.40 mm (95% CI: −0.52 to −0.29) for the junior radiologist and the junior orthopedic surgeon, respectively (Table 3).
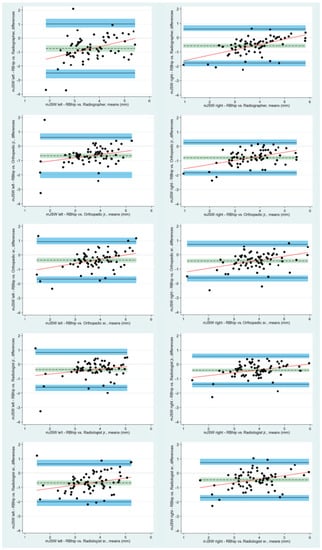
Figure 3.
Bland–Altman plots with limits of agreement and respective 95% confidence intervals visualizing the agreement between the algorithm and the five readers for the minimal joint space width. Differences between measurements are plotted against the mean of measurements. The solid black lines represent the upper and lower limits of agreement, with shaded blue areas illustrating the 95% confidence interval. The dotted black lines are the mean measured differences, and the shaded green areas depict the 95% confidence intervals. mJSW: minimal joint space width, jr.: junior, sr.: senior.
Table 3.
Bland–Altman bias (mean and standard deviation) and limits of agreement. Agreement between the algorithm and readers (n = 71).
The RCs demonstrated that the intraobserver RC is lower than the interobserver RC, meaning that the readers are more likely to agree with themselves rather than with each other. The RC for a repeated measurement of the mJSW on the left hips by the same reader was 1.25 (2.77 times 0.1888), and the same measurement by a different reader was 1.31 (2.77 times (0.1888 + 0.02755)). On the right hips, the corresponding RCs were 1.20 (2.77 times 0.2021) and 1.29 (2.77 times (0.2021 + 0.02215)).
4. Discussion
This study tested a deep learning algorithm for measuring the mJSW on pelvic radiographs. The study found that the algorithm was highly reliable, although agreement between the algorithm and human readers differed significantly.
It has previously been suggested that efforts should be made to improve reliability when measuring the mJSW in patients with hip OA and, thus, reduce the measurement error [16]. In the current study, a deep learning algorithm was tested for automatic measurements of the mJSW in pelvic AP radiographs. The algorithm was highly consistent when measuring the mJSW. Although a statistically significant difference between the algorithm and readers was seen across all readers and for both hips, the mean measured difference between readers combined and the algorithm was low, i.e., −0.5 mm bilaterally. Readers systematically measured lower values than the algorithm. A possible explanation for this finding could be that the algorithm measures the mJSW from the femoral head to the most hyperdense area of the sourcil, which is often the middle of the sourcil, as opposed to the readers who measure to the inferior delineation of the sourcil. Hence, it is clear that human readers would rather decrease the mJSW compared to the algorithm, resulting in overestimation of hip OA. However, the diagnosis of hip OA is a combination of determining the mJSW and the presence of osteophyte formation and subchondral sclerosis on radiographs, and these findings are supported by the patient history and the clinical examination. The statistically significant difference in measurement of mJSW between the algorithm and human readers is not thought to result in a clinical significance.
The human reader intra- and inter-reader variance estimated by RCs ranged from 1.20 to 1.31; therefore, a mean bias between the algorithm and readers of −0.5 mm is most probably below the minimal clinically important difference. The RCs revealed that the readers did not agree with either themselves or each other. In a healthy individual, the mJSW is above 4 mm [17]; thus, intra- and inter-reader RCs ranging from 1.20 to 1.31 mm can potentially influence the diagnosis of OA. Since the RCs are based on multiple measurements of the same radiographs, it can be concluded that the readers, unlike the algorithm, lack precision when measuring the same radiograph more than once. The same finding has previously been reported by Paul Ornetti et al. [16]. Despite RCs of up to 1.31 mm in the current study, no systematic difference between readers was noted; hence, the inter-reader variability cannot be explained by the level of experience or by differences in healthcare profession. The readers were all provided with a protocol defining the mJSW before measuring to minimize systematic measurement bias. Perhaps a consensus meeting with all the readers prior to measuring could have clarified the definition of mJSW further and potentially improved the interobserver variability.
Nehrer et al. conducted a study to examine the influence of a deep learning algorithm on accuracy and agreement rate of physicians in grading knee OA on radiographs, in comparison to unassisted grading. The results revealed that when physicians were aided by the algorithm, there was an improvement in consistency among them. The authors suggested that software systems should not substitute radiologists, but rather be utilized as supportive tools [18]. Xue et al. tested a deep learning algorithm with the ability to, by itself, diagnose hip OA based on measurements of joint space narrowing and presence of osteophytes. They found that when diagnosing hip OA, the algorithm performed at a level similar to a radiologist with 10 years of experience [1]. The algorithm in the current study is designed to measure the mJSW as opposed to distinguish between osteoarthritis/no osteoarthritis. The purposes of the two algorithms are therefore not the same, and the outcomes from the studies are not directly comparable. Ratzlaff et al. tested a computer-assisted location-specific method of hip joint space width measurement. They argue that measuring mJSW is prone to error due to the point of measurement being subjectively selected, and the joint space is susceptible to structural damage. They conclude that their method is feasible and may provide a superior method to mJSW for detecting radiographic OA progression [19]. The subjective identification of the narrowest part of the joint space applied in the current study may in part explain the inter- and intra-reader variance uncovered.
It has previously been suggested that positioning during the radiographic procedure has an influence on the mJSW. Fuchs-Winkelmann et al. found that the hip joint space was wider in the supine position [20]. Trends from a systematic review by Alzyoud et al. showed that there are statistically significant differences in joint space width between the weight-bearing and the supine position [21]. However, neither Terjesen et al. nor Bessa et al. found a significant difference in the mJSW in relation to the radiographic position [22,23]. To minimize systematic bias brought on by patient positioning, all radiographs in the current study were taken in the weight-bearing position.
The strengths of our study are the strict inclusion process minimizing selection bias by consecutive enrollment stratified by age and gender. Other strengths include the algorithm’s double reading of the mJSW and the fact that all the radiographs were taken in the same position; weight-bearing. There are limitations in this study; particularly the lack of a ground truth against which both reader and algorithm measurements can be validated for accuracy. Within radiology, establishing a ground truth can be difficult, and when measuring radiographs, observer variance might be inevitable. The concept of a ground truth and human variability when reading radiographs was also recognized by Claudio E. von Schacky et al. [9]. The fact that the algorithm was not able to analyze seven images with no evident explanation is a limitation and should be explored further prior to clinical implementation. A sample of 71 radiographs could be a limitation to results, although significant differences were shown between the algorithm and all readers.
In conclusion, the algorithm tested was highly reliable, offering a consistent quantification of mJSW of the hips when reading pelvic AP radiographs. The highest mean measured difference between readers and the algorithm was −0.78 mm, which was statistically significant, although probably not clinically relevant. Moreover, a tendency was seen where readers systematically measured a slightly lower mJSW than the algorithm.
Clinical Implications
The algorithm offered consistent measurements and may therefore be a useful support tool in the decision making of hip replacement and for quantitative monitoring of the mJSW. A highly consistent algorithm may also be particularly valuable in epidemiologic or multicenter studies correlating radiographic findings with clinical information, potentially with automated transfer of data from the algorithm to clinical databases. In future studies, correlating the algorithm measurements with clinical findings could help to validate the measurements. Furthermore, future studies on how to incorporate the algorithm as an assisting tool to readers could be beneficial.
Author Contributions
Conceptualization, J.J., O.G., S.O., M.L. and B.S.B.R.; methodology, A.M.A., J.J., O.G., S.O., M.L. and B.S.B.R.; software, M.L.; formal analysis, A.M.A. and J.J.; investigation, J.J. and B.S.B.R.; resources, J.J. and B.S.B.R.; data curation, J.J., M.H.H., C.V. and J.R.; writing—original draft preparation, A.M.A.; writing—review and editing, A.M.A., J.J., O.G., S.O., M.L., M.H.H., C.V., J.R. and B.S.B.R.; supervision, J.J.; project administration, J.J.; funding acquisition, B.S.B.R. All authors have read and agreed to the published version of the manuscript.
Funding
This research was funded by the EIT Health Digital Sandbox Programme 2020, grant number DS20-12449.
Institutional Review Board Statement
The study was approved by the Danish National Committee on Health Research Ethics (Project-ID: 2103745, 26 March 2021) and registered with the regional health authorities (Project-ID: 21/22036, 14 April 2021).
Informed Consent Statement
Patient consent was waived due to the retrospective nature of this study in accordance with the ethical approval from Danish National Committee on Health Research Ethics.
Data Availability Statement
The data used in this study are not available in any public places. The measurements of the readers and the algorithm were stored in REDCap, a secure database.
Acknowledgments
The authors acknowledge Henrik Johansen for assistance with installing the algorithm as a software as a service within the hospital firewall and setting up a secure destination for algorithm data.
Conflicts of Interest
M.L. is the Director of Clinical Operations Radiobotics, Copenhagen, Denmark. M.L. contributed to the study design and final approval of the manuscript. M.L. had no access to the study data and did not take part in data analysis. The other authors declare no conflict of interest. The funders had no role in the design of the study; in the collection, analyses, or interpretation of data; in the writing of the manuscript; or in the decision to publish the results.
References
- Xue, Y.; Zhang, R.; Deng, Y.; Chen, K.; Jiang, T. A preliminary examination of the diagnostic value of deep learning in hip osteoarthritis. PLoS ONE 2017, 12, e0178992. [Google Scholar] [CrossRef] [PubMed]
- Gebre, R.K.; Hirvasniemi, J.; van der Heijden, R.A.; Lantto, I.; Saarakkala, S.; Leppilahti, J.; Jämsä, T. Detecting hip osteoarthritis on clinical CT: A deep learning application based on 2-D summation images derived from CT. Osteoporos. Int. 2022, 33, 355–365. [Google Scholar] [CrossRef] [PubMed]
- Abdullah, S.S.; Rajasekaran, M.P. Automatic detection and classification of knee osteoarthritis using deep learning approach. Radiol. Med. 2022, 127, 398–406. [Google Scholar] [CrossRef]
- Murphy, N.J.; Eyles, J.P.; Hunter, D.J. Hip Osteoarthritis: Etiopathogenesis and Implications for Management. Adv. Ther. 2016, 33, 1921–1946. [Google Scholar] [CrossRef] [PubMed]
- Troelsen, A. Assessment of adult hip dysplasia and the outcome of surgical treatment. Dan. Med. J. 2012, 59, B4450. [Google Scholar]
- Global, regional, and national incidence, prevalence, and years lived with disability for 310 diseases and injuries, 1990-2015: A systematic analysis for the Global Burden of Disease Study 2015. Lancet 2016, 388, 1545–1602. [CrossRef] [PubMed]
- Sakellariou, G.; Conaghan, P.G.; Zhang, W.; Bijlsma, J.W.J.; Boyesen, P.; D’Agostino, M.A.; Doherty, M.; Fodor, D.; Kloppenburg, M.; Miese, F.; et al. EULAR recommendations for the use of imaging in the clinical management of peripheral joint osteoarthritis. Ann. Rheum. Dis. 2017, 76, 1484–1494. [Google Scholar] [CrossRef]
- Jacobsen, S.; Sonne-Holm, S.; Søballe, K.; Gebuhr, P.; Lund, B. Radiographic case definitions and prevalence of osteoarthrosis of the hip: A survey of 4 151 subjects in the Osteoarthritis Substudy of the Copenhagen City Heart Study. Acta Orthop. Scand. 2004, 75, 713–720. [Google Scholar] [CrossRef]
- von Schacky, C.E.; Sohn, J.H.; Liu, F.; Ozhinsky, E.; Jungmann, P.M.; Nardo, L.; Posadzy, M.; Foreman, S.C.; Nevitt, M.C.; Link, T.M.; et al. Development and Validation of a Multitask Deep Learning Model for Severity Grading of Hip Osteoarthritis Features on Radiographs. Radiology 2020, 295, 136–145. [Google Scholar] [CrossRef]
- Geeta, J.; Aditi, J.; Sabina, A.; Harshit, G.; Mukund, B. FDA approved Artificial Intelligence and Machine Learning (AI/ML)-Enabled Medical Devices: An updated 2022 landscape. medRxiv 2023. [Google Scholar] [CrossRef]
- Kottner, J.; Audigé, L.; Brorson, S.; Donner, A.; Gajewski, B.J.; Hróbjartsson, A.; Roberts, C.; Shoukri, M.; Streiner, D.L. Guidelines for Reporting Reliability and Agreement Studies (GRRAS) were proposed. J. Clin. Epidemiol. 2011, 64, 96–106. [Google Scholar] [CrossRef]
- Bossuyt, P.M.; Reitsma, J.B.; Bruns, D.E.; Gatsonis, C.A.; Glasziou, P.P.; Irwig, L.; Lijmer, J.G.; Moher, D.; Rennie, D.; de Vet, H.C.; et al. STARD 2015: An Updated List of Essential Items for Reporting Diagnostic Accuracy Studies. Clin. Chem. 2015, 61, 1446–1452. [Google Scholar] [CrossRef]
- Jensen, J.; Graumann, O.; Overgaard, S.; Gerke, O.; Lundemann, M.; Haubro, M.H.; Varnum, C.; Bak, L.; Rasmussen, J.; Olsen, L.B.; et al. A Deep Learning Algorithm for Radiographic Measurements of the Hip in Adults-A Reliability and Agreement Study. Diagnostics 2022, 12, 2597. [Google Scholar] [CrossRef]
- Bland, J.M.; Altman, D.G. Measuring agreement in method comparison studies. Stat. Methods Med. Res. 1999, 8, 135–160. [Google Scholar] [CrossRef] [PubMed]
- Carkeet, A. Exact parametric confidence intervals for Bland-Altman limits of agreement. Optom. Vis. Sci. 2015, 92, e71–e80. [Google Scholar] [CrossRef] [PubMed]
- Ornetti, P.; Maillefert, J.F.; Paternotte, S.; Dougados, M.; Gossec, L. Influence of the experience of the reader on reliability of joint space width measurement. A cross-sectional multiple reading study in hip osteoarthritis. Joint Bone Spine 2011, 78, 499–505. [Google Scholar] [CrossRef] [PubMed]
- Lequesne, M.; Malghem, J.; Dion, E. The normal hip joint space: Variations in width, shape, and architecture on 223 pelvic radiographs. Ann. Rheum. Dis. 2004, 63, 1145–1151. [Google Scholar] [CrossRef] [PubMed]
- Nehrer, S.; Ljuhar, R.; Steindl, P.; Simon, R.; Maurer, D.; Ljuhar, D.; Bertalan, Z.; Dimai, H.P.; Goetz, C.; Paixao, T. Automated Knee Osteoarthritis Assessment Increases Physicians’ Agreement Rate and Accuracy: Data from the Osteoarthritis Initiative. Cartilage 2021, 13, 957s–965s. [Google Scholar] [CrossRef]
- Ratzlaff, C.; Van Wyngaarden, C.; Duryea, J. Location-specific hip joint space width for progression of hip osteoarthritis--data from the osteoarthritis initiative. Osteoarthr. Cartil. 2014, 22, 1481–1487. [Google Scholar] [CrossRef]
- Fuchs-Winkelmann, S.; Peterlein, C.D.; Tibesku, C.O.; Weinstein, S.L. Comparison of pelvic radiographs in weightbearing and supine positions. Clin. Orthop. Relat. Res. 2008, 466, 809–812. [Google Scholar] [CrossRef]
- Alzyoud, K.; Hogg, P.; Snaith, B.; Flintham, K.; England, A. Optimum Positioning for Anteroposterior Pelvis Radiography: A Literature Review. J. Med. Imaging Radiat. Sci. 2018, 49, 316–324.e3. [Google Scholar] [CrossRef] [PubMed]
- Terjesen, T.; Gunderson, R.B. Reliability of radiographic parameters in adults with hip dysplasia. Skeletal Radiol. 2012, 41, 811–816. [Google Scholar] [CrossRef] [PubMed]
- Bessa, F.S.; Williams, B.T.; Polce, E.M.; Maheshwer, B.; Williams, J.C.; Nho, S.J.; Chahla, J. No Differences in Hip Joint Space Measurements Between Weightbearing or Supine Anteroposterior Pelvic Radiographs. Arthroscopy 2020, 36, 2843–2848. [Google Scholar] [CrossRef] [PubMed]
Disclaimer/Publisher’s Note: The statements, opinions and data contained in all publications are solely those of the individual author(s) and contributor(s) and not of MDPI and/or the editor(s). MDPI and/or the editor(s) disclaim responsibility for any injury to people or property resulting from any ideas, methods, instructions or products referred to in the content. |
© 2023 by the authors. Licensee MDPI, Basel, Switzerland. This article is an open access article distributed under the terms and conditions of the Creative Commons Attribution (CC BY) license (https://creativecommons.org/licenses/by/4.0/).