Abstract
Precise lagoon bathymetry remains scarcely available for most tropical islands despite its importance for navigation, resource assessment, spatial planning, and numerical hydrodynamic modeling. Hydrodynamic models are increasingly used for instance to understand the ecological connectivity between marine populations of interest. Island remoteness and shallow waters complicate in situ bathymetric surveys, which are substantially costly. A multisource strategy using historical point sounding, multibeam surveys and well calibrated satellite-derived bathymetry (SDB) can offer the possibility to map entirely extensive and geomorphologically complex lagoons. The process is illustrated here for the rugose complex lagoon of Gambier Islands in French Polynesia. The targeted bathymetry product was designed to be used in priority for numerical larval dispersal modeling at 100 m spatial resolution. Spatial gaps in in situ data were filed with Sentinel-2 satellite images processed with the Iterative Multi-Band Ratio method that provided an accurate bathymetric model (1.42 m Mean Absolute Error in the 0–15 m depth range). Processing was optimized here, considering the specifications and the constraints related to the targeted hydrodynamic modeling application. In the near future, a similar product, possibly at higher spatial resolution, could improve spatial planning zoning scenarios and resource-restocking programs. For tropical island countries and for French Polynesia, in particular, the needs for lagoon hydrodynamic models remain high and solutions could benefit from such multisource coverage to fill the bathymetry gaps.
1. Introduction
Precise knowledge of bathymetry is mandatory for many management applications. While some limited point data are generally easily available through historical or modern surveys, it is a much more challenging endeavor to finalize a gridded complete coverage, exhaustive for the entire focal area, at spatial resolution suitable for the applications at stake. Knowledge of bathymetry is useful for species’ niche modeling, for marine spatial planning, and for hydrodynamical and dispersal (pollutants, larvae, etc.) modeling. In particular, studying the ecological connectivity between populations of important marine species through larval dispersal is a key question for both science and management worldwide and biophysical numerical models are increasingly part of the toolbox at a variety of spatial and temporal scales [1,2,3]. We focus here on this last type of numerical modeling application that will constrain some of the processing choices when completing a bathymetric grid for a given lagoon. Regarding tropical island countries, the needs for lagoon hydrodynamic models and, thus, bathymetric maps remain high and solutions to fill gaps in single data sources could benefit from a multisource coverage. The requirement for bathymetric data can range from a few meters of resolution to couple hundred meters, especially for large lagoons. Here, we also focus on French Polynesia, a south central Pacific Ocean French overseas collectivity with 118 high islands and atolls scattered on a 4.8 million km2 Economic Exclusive Zone.
The lagoons of French Polynesia represent 12,130 km2 that can be split in two broad categories: atoll and high island lagoons [4,5]. The latter are generally geomorphologically more complex atoll lagoons for a smaller size and they are also subjected to higher human pressure. For atolls lagoons, their general saucer-like shape allows efficient multibeam surveys and complete lagoon coverage has been achieved in the past few years with small vessels [6]. Lagoons remain impractical for large ships that are suitable mostly for the oceanic sides of islands and atolls [7]. However, these multibeam lagoons surveys were time-consuming and costly operations. In 2015, several high island lagoons of the Society Archipelago have been entirely mapped with bathymetric LIDAR data. This airborne operation was sponsored by French authorities and provided high quality data for islands such as Tahiti, Moorea or Bora-Bora. However, most of the Tuamotu, Gambier and Austral archipelagoes lagoons were not included. Previously, in addition to many small scales, traditional shipborne surveys for coastal infrastructure development and navigation safety, French Polynesia has seen a fair amount of initiatives to develop satellite-derived bathymetry (SDB) for entire atoll and high island lagoons. Early on, using SPOT images, SHOM and IFREMER included SDB-derived data in ‘spacemaps’ [8] to fill gaps albeit with the warning that data may not be accurate and safe for navigation. Later, other initiatives included private party development with the 4SM framework [9]. The KSLOF has also released SDB products using very high resolution multispectral images [10]. However, due to the inherent limitations of optical remote sensing, even with blue–green spectral band-algorithms, all these SDB initiatives were limited in scope to the 0–30 m depth range and, in practice, much less, depending on water clarity, solar angles and viewing geometry. Lagoons, especially in atolls, can be much deeper than 30 m [6], resulting in very large data gaps. Nevertheless, methodological SDB developments are still in progress in many parts of the world, often relying on a calibration step that depends on the availability of ground-truthing data [11,12]. Examples of multisource approaches are growing, including fusion approaches [13]. Multisource data fusion is about combining observations from a number of different sources to provide a single output, for instance using Bayes’ rule, but many other geostatistical methods are developing. However, using multisource data is possible even without fusion if the goal is for instance to benefit from spatially disjoint but complementary data sets to create an integrated map.
In French Polynesia, full lagoon coverage of bathymetric data is tremendously useful in particular in the context of black pearl farming management and science. Black pearl farming is the second source of income for this country and a vital priority. Recent specific needs to manage this activity are related to the steady decrease in pearl oyster availability [14]. Decreasing spat collecting success and oyster natural stocks have called for numerical simulations of oyster larval dispersal and for a better understanding of the potential of different locations for adult oyster restocking [3,15,16]. New remote sensing developments to map chlorophyll and temperature in lagoons are also better optimized when bathymetry is known beforehand to interpret the results and for sensor deployment [17,18]. All these applications are possible only with accurate bathymetric data. The products derived from these scientific applications are useful themselves for marine spatial planning (MSP) aimed at optimizing how the typically limited lagoonal space can be shared between various conflicting activities and management goals [19,20].
The Gambier Island lagoon in the southeast of French Polynesia is one of the most productive pearl farming site, and therefore one of the top-priority site for management and research, with requirements for hydrodynamic and connectivity modeling, and lagoon spatial planning. An accurate bathymetry grid suitable for hydrodynamic modeling for the entire lagoon was a necessity. Without archived historical data able to provide a full coverage of the lagoon, a hybrid multisource approach was implemented and is described in this study. The multisource representation of an entire island lagoon is a logical way to fill gaps, possibly even including the land topography to achieve a ridge-to-reef representation, but published examples remain surprisingly limited to our knowledge. Lizard Island in Australia [21] and Aitutaki in Cook Islands [22] are two examples using different bathymetric data sources. Beyond the Gambier case, our objectives are also to promote such multisource mapping approaches for enhanced island spatial planning applications.
2. Materials and Methods
2.1. Study Site
Gambier Islands is a single large lagoon encompassing a dozen of small islands (Figure 1). The largest of them is Mangareva Island where the main town, Rikitea, is found. Gambier Islands is the only high island of the Gambier Archipelago, which is an administrative entity in the southeast of French Polynesia mostly made of small atolls (Figure 1). The Gambier coral reef system presents the highest number of geomorphological classes among the 118 French Polynesia islands [5,23] due to the presence of different lagoonal basins, patch, fringing and barrier reefs and all their respective sub-units. The north part of the lagoon is fairly shallow and very rugose, with numerous pinnacles, coral patches and ridges. It is a difficult area to navigate even with a small boat. Historically, this area in the north was a specific traditional management zone where oysters were abundant [19], but decades of harvesting for handicrafts, marquetry, and the button industry has depleted the pearl oyster natural stock, which has not bounced back in this lagoon sector according to stock surveys performed in 2019–2020 [23].
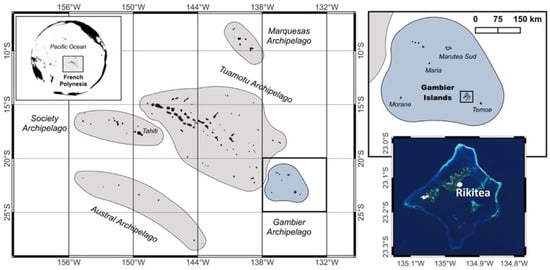
Figure 1.
Location map of Gambier Islands.
Gambier human activities are centered on black pearl farming, agriculture and non-commercial reef fishery. Designated spat-collecting areas exist in the lagoon to supply oysters to the black pearl farms. Tourism is promoted but remains limited.
2.2. The Different Scales of Lagoon Rugosity: Implications in Bathymetric Product Designs and Their Accuracy Assessments
We present hereafter the different levels of bottom rugosity when working in a coral reef lagoon environment because of their implications on depth variability and, thus, on the accuracy estimates of bathymetric grids when using sounding point data as reference. It can be convenient to consider rugosity according to three different spatial scales, as follows:
- (1)
- 10 cm to 1 m scale resolution rugosity (Figure 2A), due to small abiotic and biotic construction features such as coral and algal canopy, growth sizes and forms. This is often the scale used by biologists when studying in the field biological communities, but it is not relevant here. None of our geospatial data sets used afterwards are able to capture this very fine level of rugosity, but single depth sounding data points are affected at that scale. Therefore, for a bathymetry grid at 1 m spatial resolution, a range of uncertainty of the order of 1 m when comparing with a sounding data point can be expected.
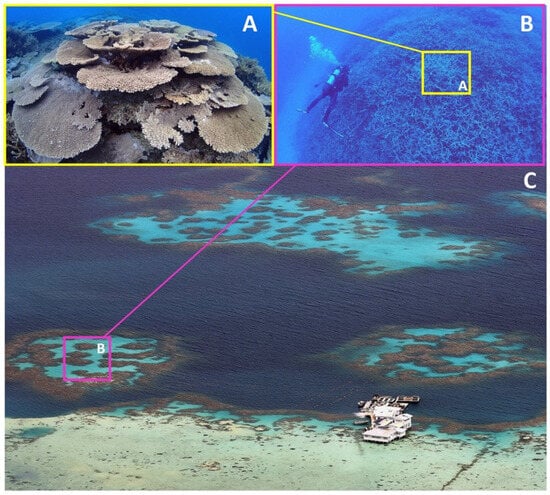 Figure 2. The different scales of bottom rugosity and their imbrications in space. (A) Rugosity at the 10 cm–1 m scale, here due to coral growth. (B) Rugosity at 1–10 m scale, here due to sand plain adjacent to large coral structures. The typical footprint of the previous 10 cm–1 m rugosity scale is overlaid. (C) Rugosity at ~100 m scale, due here to large patch reefs separated by deeper channels with steep slopes. The typical footprint of the previous 1 m–10 m rugosity scale is overlaid. All photographs (© Serge Andréfouët) were taken in Gambier lagoon. The building visible on panel (C) is a pearl farm.
 - (2)
- 1–10 m scale resolution rugosity (Figure 2B). This scale of rugosity can be captured by various types of observation means, including multibeam data, very high spatial resolution satellite imagery, or very dense sounding points. Rugosity is created by various sedimentological and construction/erosion soft and hard-bottom features such as large coral colonies, coral growth reticulations, sand and rubble deposits, and narrow geomorphological features such drop-offs, crests, channels, etc. At that spatial scale, depth variation and uncertainty can be of the same order (1 to 10 m); therefore, for a grid at 10 m spatial resolution, a maximum uncertainty of up to 10 m when comparing with sounding data points can be expected.
- (3)
- Finally, a 100 m scale rugosity (Figure 2C) is due to variation in the depth of large geomorphological features, such as enclosed sub-basins and lagoons within reef flats, large patch reefs systems, submerged reef flats, slopes, etc. At that spatial scale, depth variations within a bathymetric grid can be of the order of 10 to 50 m, with extremes found along walls, drop-offs, edges of deep channels, etc.
These three scales of rugosity co-exist and are juxtaposed in any reef lagoon system, but they have different effects and implications on the design and validation of a bathymetry data set, depending on its desired final spatial resolution and application. For instance, estimating the accuracy of a bathymetric product created with a 10 m spatial resolution satellite imagery will be necessarily affected by the ‘10 cm–1 m scale’ rugosity that affects the validation sounding data through the inherent scale-mismatch between data sets. The consequence is that a perfect match between an average bathymetry value for a 100 m2 pixel is not expected when compared to a single sounding data point in that pixel. Uncertainties can decrease if multiple sounding points are available in that pixel as, together, they will represent better the average depth within that pixel, but biases are likely to remain. Similar caveat is obviously required for a 100 m resolution bathymetry product. A single depth sounding measurement should not be used to assess the accuracy of a 100 m resolution grid. Multiple sounding are necessary, although they may not perfectly capture an average depth at 100 m resolution.
These issues are far less critical, or are simply ignored, when dealing with flat, sedimentary, gently sloping bottoms that are also frequent features worldwide. Conversely, similar issues may exist for terrestrial digital elevation models and their validation, considering the inherent bias due to different scales of land surface roughness, which is equivalent to bottom rugosity here [24].
2.3. SHOM Bathymetry Data
Gambier used to serve in the 1965–1985 years as a backbone logistical site for the nuclear tests performed in Moruroa and Fangataufa atolls. Ship traffic in Gambier lagoon was significant during this time. Hence, the lagoon navigation corridors and around have been surveyed very extensively in the 1960s by the French navy (Figure 3A,D,E) although no sounding data were collected in the north of the lagoon, in most of the east lagoon, and above the shallow submerged barrier reef in the south-west (Figure 3A). Some areas around most of the islands also had data gaps. The density of soundings was nevertheless extremely high (Figure 3D,E), although some areas away from Rikitea and the navigation channels had lower density coverage.
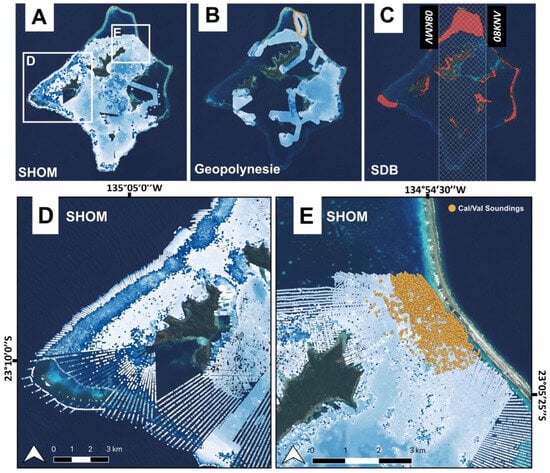
Figure 3.
(A) Spatial coverage of SHOM historical point bathymetry data. Location of inserts D and E are shown. (B). Spatial coverage of multibeam data collected in 2020 by Geopolynesie to fill as much as possible the largest gaps left by SHOM. The orange polygon shows location of cal/val data used to compare with the 100 m final gridded bathymetric product. (C) Red polygons show the coverage required for SDB data using Sentinel-2 images to cover the spatial gaps left by the two first data sources mostly on shallow hard-to-navigate areas. The white grid shows the overlapping area between the two Sentinel-2 tiles (08KMV et 08KNV) required to cover entirely Gambier islands. (D,E) are enlargements highlighting the density of SHOM point sounding data.
These historical depth soundings are now digitally archived by SHOM and available in an online catalog (https://data.shom.fr, accessed on 14 November 2025). They are provided with an EPSG: 4326 (or WGS84) geographic coordinate system. Vertical referencing of all SHOM data are based on the French Plus Basse Mer Astronomique (PBMA) level, which is the local lowest sea level predictable for any combination of astronomical conditions and in average weather conditions (see https://services.data.shom.fr/static/specifications/DescriptifDeContenuDeProduitExterne_RAM.pdf for reference, accessed on 14 November 2025). In practice, for a locality where long term measurement are available (few years to decades), this is the lowest sea level reached during the measurement period. Because Gambier Islands have a long-term tide gauge maintained by SHOM (https://refmar.shom.fr/donnees/43, accessed on 14 November 2025), the lagoon is well characterized.
2.4. Multibeam Bathymetry Data
The French Polynesia DRM which is in charge of pearl farming management for the French Polynesia administration agreed to contract a private hydrography company, Geopolynesie, to collect multibeam data to fill all the SHOM data gaps as much as possible. However, a survey of the shallow and rugose north lagoon and several sections of the submerged barrier reef was still not possible. Nevertheless, all remaining gaps in areas that could be navigated safely could be included in the contract (Figure 3B). The Geopolynesie multibeam data acquisition occurred during several surveys taking place in 2020 and 2021, using a Norbitt IWBMS portable system. Data were corrected from tide using a pressure sensor (Geopolynésie company, Papeete, French Polynesia) recording at 1 Hz frequency and vertically adjusted to SHOM PBMA. Data were also provided in EPSG: 4326 (WGS84) geographic coordinate system. We used here a subset of the initial data collected by Geopolynesie at 5 m spatial resolution, meaning that the initial full-resolution data set was averaged to provide a 5 m spatial resolution grid.
2.5. SDB Data
KSLOF had previously derived an SDB product using a clear Worldwiew-2 image at 2 m resolution and some ground-truthing collected in February 2013 following the methodology described by Purkis et al. [10]. Once we could compare this product with SHOM survey points and Geopolynesie multibeam data in the north lagoon, it appeared that the KSLOF SDB product overestimated depth in the shallow north areas, while it also significantly underestimated depth in deeper lagoon areas throughout the lagoon. The KSLOF product was accurate in the ~5–10 m depth range but distorted actual depth otherwise. We decided to recreate a new product from scratch by taking advantage of the SHOM and Geopolynesie in situ data, which were not available to KSLOF.
For this, we followed the band-optimization iterative method recently applied to New Caledonia lagoons by Amrari et al. [12], using freely available high-quality 10 m spatial resolution multispectral images from the Sentinel-2 archive (https://apps.sentinel-hub.com/eo-browser, accessed on 14 November 2025). Gambier Islands is covered by 2 Sentinel-2 tiles (08KNV and 08KMV), the overlapping area is shown in Figure 3C. Two cloud-free Sentinel-2B Level 1C pre-processed images both acquired on 16th January 2022 were selected. None of the images were affected by wind, waves breaking on the reef edges or glint. The rationale and details of the processing steps are described in [12] but we repeat them briefly here for clarity.
The principle of the so-called Iterative Multiple-Band Ratio (IMBR) algorithm described by Amrari et al. [12] is to generalize the empirical single-band ratio and multiple-band ratio methods widely used since Stumpf et al. [25], by using the best set of spectral band combination and ratios for different depth ranges. Other refinements include a procedure to filter out the Sentinel-2 pixels without enough ground-truth data coverage before using them for training or accuracy assessment. The method is recommended for rugose lagoons for which good ground-truth data at a variety of depth range is available, as is the case for our Gambier study. The scale of rugosity that Amrari et al. [12] is handling when developing their methods is mostly the 1–10 m scale presented above (Figure 2).
Sentinel-2 data are suitable for IMBR thanks to its 5 most water-penetrating spectral bands (Table 1).

Table 1.
Sentinel-2 spectral band used in this study.
Practically, besides the atmospheric correction (using here the ACOLITE package v20220222 (https://github.com/acolite/acolite, accessed on 14 November 2025) and its dark spectrum procedure) and land masking, the method follows a three-step process. First, all the possible single-band ratios are computed. Then, single- and multi-regression between band ratios and calibration depth data are compared to assess the general behavior and accuracies when using different band ratios. A harmonic reconstruction of tides was realized using the global tide model FES2012 (Finite Element Solution 2012) and was applied considering the time and date of satellite overpass, resulting in a −0.12 m correction. It is expected that the multi-linear regression will perform best, but this may be case-dependent considering the actual depth range, the types of bottom reflectance variation and, of course, the type of imagery and its spectral resolution. Finally, and the outcome may also be case-dependent, the examination of the previous multi-regression results can allow defining areas of depth ranges for which a second refined optimized multiple-band ratio regression is applied, but this time using ground-truth data specific to each depth range as well as the set of spectral bands that yielded optimal depth accuracies within each depth range.
2.6. Bathymetric Map and Statistics at 100 M Spatial Resolution
For our application needs, (MARS3D numerical hydrodynamical model to simulate larval dispersal, see Discussion) we intended to merge the different data set into one single bathymetric file at 100 m spatial resolution. The choice of a 100 m spatial resolution grid for the hydrodynamic model is driven by computing time limitations, which are very costly even when using supercomputer facilities (such as DATARMOR at IFREMER in Brest, France). Theoretically, a much better resolution could be targeted with our data set in hand, down to 10 m, due to the use of a Sentinel-2 image, could as well be achieved but without practical value for our modeling application.
Another constraint imposed by hydrodynamic model is that it is necessary to smooth out the large depth gradient—or high rugosity—(100 m scale) features that create internal pressure gradient errors that models cannot handle [26,27,28]. This is a typical problem for oceanographers who have to trade-off bathymetric realism against model stability. This is often empirically solved by applying several filters that smooth the bathymetry values in high-rugosity (100 m scale) areas until the model is stable while performing with acceptable accuracy [26,27,28].
Therefore, we first generated an empty computational grid using the IFREMER’s BMGtools toolkit [29], in agreement with the MARS3D configuration requirements. The final bathymetric grid was produced using the empty grid and the compiled sounding data sets described above from Geopolynesie, SHOM and SDB data sources in that priority order. Then, to avoid running into future internal pressure gradient problems, the interpolation process involved a Hanning low-pass filter, applied five consecutive times with a cutoff frequency below 50 m depth, followed by an additional low-pass filter (ROMS), ensuring that the slope between adjacent cells does not exceed a specified threshold which is set here at 0.25 (25%). We point out that different users may merge their various individual data sets as they wish; using a variety of free or licensed geographical information systems and image processing software tools.
2.7. Accuracy Assessment of the SDB Product
Here, we used for calibration and validation a selection of SHOM soundings located near the main bathymetric gap in the northern part of Gambier Lagoon and in its shallowest area (Figure 3E). This subset included depths within the 1 to 20 m range and provided an adequate reference to test the SDB model parameters where it was most critically needed (Figure 3E). The resulting calibration coefficients derived from tile 08KNV were then applied on tile 08KMV.
When using the Amrari et al. [12] procedure, accuracy is computed with a leave-one-out and K-folds cross validation procedure [30]. The accuracy of the SDB model is measured with the Mean Absolute Error (MAE) and the Root Mean Square Error (RMSE) metrics, and the coefficient of determination R2 of the regression between estimated and field depth data. Discrepancies are expected between soundings and depth estimated using the 10 m Sentinel-2 imagery (with SDB) due to rugosity effect at the 1–10 m scale, as sounding are point data and SDB represent an average depth across 100 m2. Discrepancies of few meters are possible. This is why Amrari et al. [12] uses, for calibration and validation, Sentinel-2 pixels with enough coverage of sounding data to minimize the possible biases.
2.8. Accuracy Assessment of the 100 M Bathymetric Grid
Extra accuracy assessment included the comparison of final SBD 100 m resolution product with a subset of the multibeam Geopolynesie data set, also taken from the north lagoon, independently from the SHOM calibration data set. Given the higher spatial resolution of the Geopolynesie data set relative to our final bathymetry grid at 100 m resolution, individual soundings located within a single 100 m cell were averaged prior to compare with the derived bathymetry to limit the effects due to rugosity (scale 1–10 m).
2.9. Flow Chart
The data flow and the different processing are shown in Figure 4.
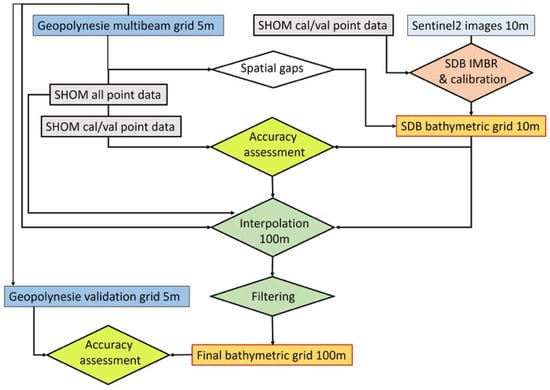
Figure 4.
Flow chart summarizing the different data sets (rectangular box) and their processing (diamond) and the various flows connecting them. Input data sets are in gray-blue colors; output data sets appear orange with red contour. Spatial resolutions of data and products are indicated in meters (m).
3. Results
3.1. Comparison of SHOM and Multibeam Bathymetry Data
Comparison results between SHOM and Geopolynesie multibeam data are provided in Figure 5. For multibeam pixels less than 30 m away from any SHOM soundings data, we found out that 91% of them were within 5 m of a SHOM point. Agreement between depth values was very good on average when distances between SHOM and Geopolynesie sources were smaller than 10 m, but it deteriorates afterwards, which was expected due to rugosity issue (Figure 5). In these cases, Geopolynesie depth values tend to be larger than SHOM values. Overall, statistics between those two data sets shows good agreement, with MAE = 0.983 m, RMSE = 1.994 m; R2 = 0.974, but there are differences. These figures actually clarify the minimum uncertainty that can be expected for the SDB bathymetric product or the final product after merging all the data sources, regardless of the quality of the tested bathymetric product.
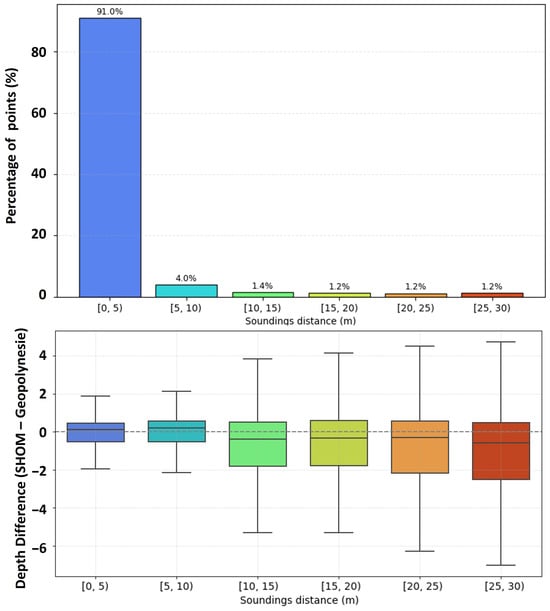
Figure 5.
Comparisons between depth values provide by SHOM and Geopolynesie data. Top panel: 91% of the comparison could be performed with data less than 5 m away, 95% less than 10 m away. The box plot on the bottom panel shows the decreasing agreement with increasing distance.
3.2. SDB Results
A total of 65% of the Sentinel-2 pixels intersecting the SHOM cal/val ground-truth data set could be used when estimating the accuracy of the SDB model, after using 3% as the minimum threshold of ground-truth soundings coverage of Sentinel-2 pixels, assuming that a single SHOM sounding data point covers one square meter. The distribution of depth values in the retained cal/val data set is shown in Figure 6. The retained pixels and their depth value should be less affected by rugosity than the discarded pixels.
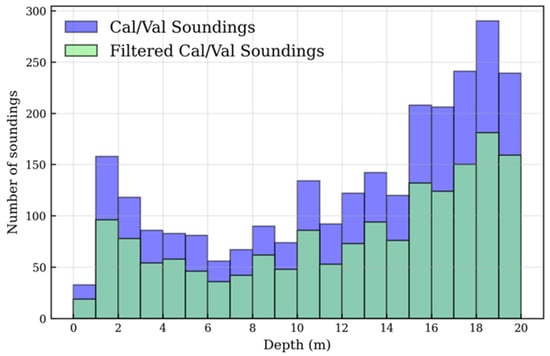
Figure 6.
Distribution of depth from SHOM calibration/validation soundings before and after applying the Cover-Threshold.
The band-to-band ratio results for all possible combinations of Sentinel-2 bands for the 08KNV tile are shown Figure 7. The figure shows the behavior of the ratio data in relation to depth and the correlation coefficient. It was expected that the Blue–Green ratio could be a good candidate throughout the 0–20 m depth range and this is confirmed, although it seems to perform better between 0 and 15 m, as the cloud of points is shifting away from the x = y line above 15 m. The Blue/Red and Green/Red ratios are also of interest but only in the 0–5 m depth range.
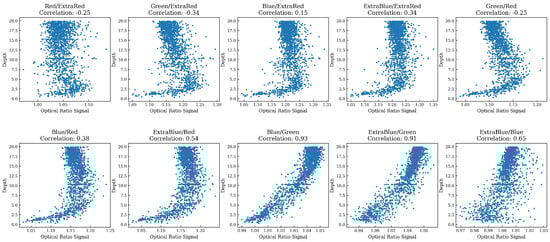
Figure 7.
Depth correlation with band combinations calculated from the Sentinel 2B image, tile 08KNV.
The multiple band-to-band ratio regression against depth is shown Figure 8. Accuracy achieved are MAE = 1.42 m, RMSE = 1.9 m, and R2 = 0.897 across the 0–20 m depth range. The coefficient of determination R2 is only slightly better than the simple Blue/Green band ratio which was the best single band ratio results. Results are also better in the 0–15 m depth range. Considering that most of the gaps in SHOM and Geopolynesie coverage are in shallow areas certainly in that 0–15 m depth range (Figure 3C), this result was used to generate the missing bathymetry data. Therefore, unlike previous uses of the Amrari et al. [12] method, only one depth range was considered here.
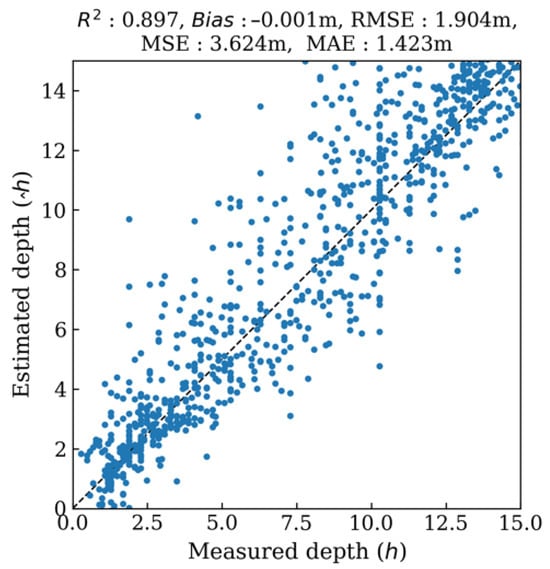
Figure 8.
Regression between validation soundings and depth estimated from the multi-linear regression between 0 and 15 m. The dashed line represents the regression line.
3.3. Comparison of SDB Outputs for the Overlapping Area of the Two Sentinel Images
We compared our two SDB outputs for the overlapping area of the two Sentinel-2 images (Figure 9), specifically focusing on the coverage of interest shown in Figure 3C, which represented here 43,306 bathymetry data points. Statistics show very close agreement, justifying to use for depth in the overlapping area; the SDB output calculated from the 08KNV image.
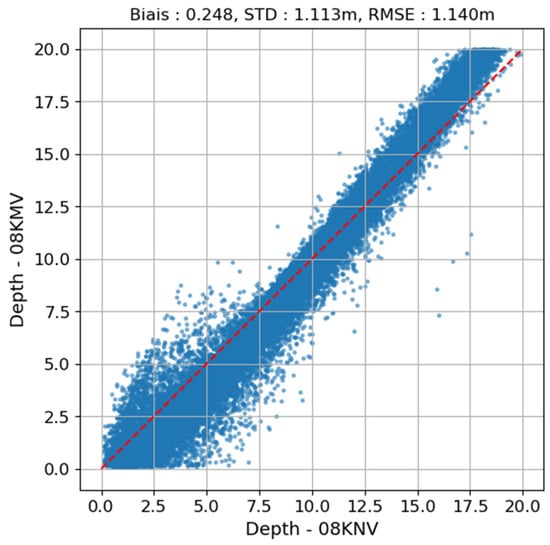
Figure 9.
Comparison of depth values on the same pixels estimated on tile 08KMV and 08KNV. The red dashed-line represents the y=x line.
3.4. Accuracy Computed Using Geopolynesie Data Subset
The comparison of the final bathymetry product against a subset of Geopolynesie soundings acquired in the northern Gambier lagoon in the 10–20 m depth range is shown Figure 10. Due to the differences in spatial resolution between the data sets, the rugosity that influences the average depth they can capture, and the filtering applied to smooth out strong bathymetric gradients for numerical models, a perfect match was not expected. Furthermore, a comparison in the 0–15 m depth range would have been better considering SDB was optimized for that depth range, but Geopolynesie could not collect much mulltibeam data shallower than 5m. Hence this is a conservative assessment, more than likely at the lowest side of the accuracy range. Here, the SDB 100 m bathymetry model overestimated depths compared to the 100 m averaged Geopolynesie subset with an overall bias of 1.4 m. Despite a low R correlation value of 0.54 (Figure 10), this result was deemed satisfactory for our purpose, which was confirmed by the good fit reported elsewhere between in situ current meter data and modeled data [15]. Without filtering and smoothing, the bias decreased to 0.6 m, highlighting the effects of these treatments.
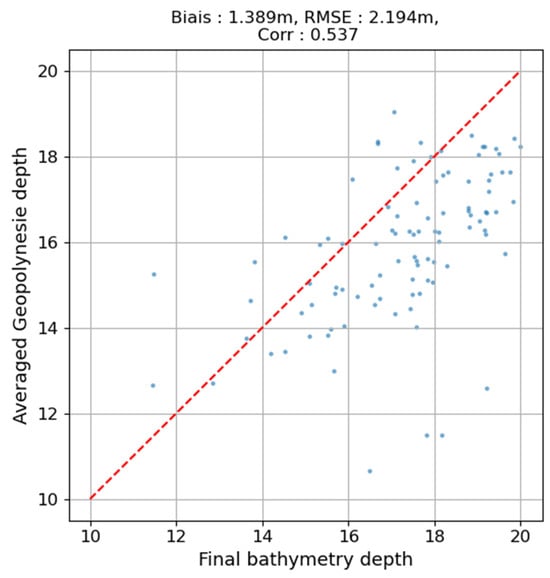
Figure 10.
Statistics of the regression between final bathymetry depth and pixel averaged depth from Geopolynesie subset, at 100 m spatial resolution. The red dashed-line represents the y=x line.
3.5. Final Product at 100 M Spatial Resolution
The final bathymetric product at 100 m spatial resolution and the histograms of depth of the Gambier lagoon according to this product are shown in Figure 11. Maximum lagoon depth reached 70 m. Average depth is 24.56 m. The deepest basin is located just southeast of Mangareva Island.
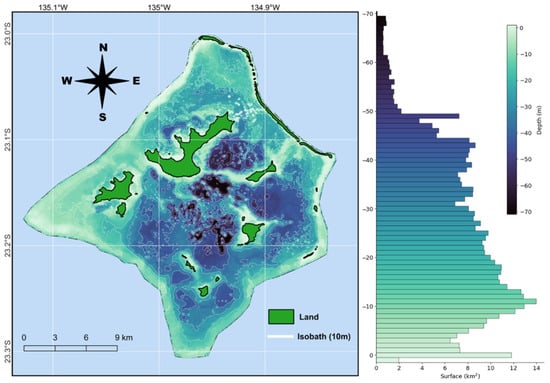
Figure 11.
(Left): Gambier lagoon bathymetric grid at 100 m spatial resolution used for hydrodynamic model experiments. (Right): histogram of depth.
4. Discussion
The Gambier Islands bathymetric map realized here (Figure 11) is the first multisource bathymetry product available for an entire French Polynesia high island lagoon. This case was a very data-rich situation which is not the norm, but Gambier paves the way for other similar multisource realizations in French Polynesia and elsewhere. The process was multisource at the scale of the entire Gambier lagoon, but not at the scale of each individual location within the Gambier lagoon. For most locations, depth could be estimated using only one single data source, each data set rather completing the coverage of the others.
Some other French Polynesia islands (Moorea, Bora-Bora and part of Tahiti) have been covered by bathymetric LIDAR in 2015. This represents the ideal configuration to achieve excellent prevision at a very fine spatial scale. The LIDAR products are complex and costly to achieve, but once available, they can be considered as definitive, and do not call for more data or processing for end-users. LIDAR coverage opportunities are rare for Pacific Ocean Islands countries and territories. Conversely, other islands have been entirely mapped mostly with an SDB approach and using limited ground-truthing, which is a low cost approach. However, the downside is a much lower accuracy even in non-rugose environments that may prevent further applications such as hydrodynamic models. Less demanding application, for ecological niche models for instance, can certainly also benefit from these SDB products.
A non-exhaustive compilation of the accuracies reported from recent SDB results in various coral reef and lagoon environments using multispectral satellite imagery suggests a range of RMSE = 0.89 m to 2.62 m for depths up to 15 m [31], 1.78 to 3.04 for 0–20 m depth range [32], RSME = 0.83 to 1.17 for 0–20 m depth range [33] and RSME = 1.22 to 1.60 m for 0–20 m depth range [12]. Readers should refer to the details of each study for the precise conditions of each experiment. Note that other different studies not mentioned here provide different accuracy metrics, some just providing a R2 correlation. Nevertheless, the accuracy trends, even with the latest methodological approaches [32], are close and a RMSE of 10% or more of the actual depth value is common in the 0–20 m depth range of these fairly clear water environments.
The spatial resolution that we achieved for the Gambier bathymetric product is not the finest that could have been produced considering the spatial resolution of each of the initial data sets. Nevertheless, the 100 m spatial resolution was a specification for the numerical hydrodynamic model that was implemented shortly after the present work. The bathymetry required for the numerical hydrodynamic model demanded more work than just for the lagoon, as shown here, as it was necessary to add the bathymetry of the outer oceanic slopes. This was another multisource data compilation process for the 0–3500 m meter range, albeit outside the scope of the present paper focusing on lagoons with a maximum depth limit around the 100 m depth figure. When set and validated using current meter data [15,34], the hydrodynamic numerical model of the lagoon based on our multisource bathymetry grid at 100 m spatial resolution was used to address pearl farming management questions. It was used in Bruyère et al. [15] to simulate, with different wind conditions, the dispersal of larvae that could be released after restocking oysters in the lagoon. Indeed, restocking of pearl oysters in the lagoon is seen as a solution to counter the trends of decreasing spat collection and decreasing natural stocks [23]. This application provided guidance to DRM and pearl farmers to identify the best restocking sites in the optics of improving spat collection. Future similar scenarios are planned in the future for different restocking configurations in Ahe, Takaroa and Raroia for which hydrodynamic models exist.
Another possible application where the bathymetric grid could have been directly useful is the systematic MSP multi-objective scenarios that André et al. [19] developed for the Gambier lagoon. André et al. [19] used a habitat map to identify remarkable areas to include in no-activity or no-access conservation areas, but this could have been refined or extended by integrating the bathymetry as in [20]. For instance, should the spatial plan aim to reserve areas dedicated for oyster restocking, bathymetry would be an optimal data layer to identify and weight accordingly the planning units suitable for restocking due to their depth range. Other management actions for which a bathymetric map is useful are fishery and aquaculture stock assessments. Fishery and mariculture stocks, either finfish or invertebrate resources, benefit from precise bathymetric to scale up local density observation to entire lagoons, as it was performed for pearl oysters in different pearl farming lagoons [23,35]. The last application for which precise bathymetry is required is pearl farming lagoon cleaning. These lagoons are indeed littered with benthic derelict gears [36,37] and DRM and farmers are supposed to coordinate the cleaning of some lagoons. The estimation of the logistical efforts needed and the operation planning is greatly optimized when lagoon bathymetry is precisely known.
Finally, the bathymetric grids could be part of a multi-thematic digital library and portal for Gambier Islands, which could be a very useful initiative, as it was compiled for instance for Tonga [38]. Gambier Islands already benefit from numerous data layers [19] that include bathymetry (this study), habitat maps, natural oyster stock distribution, marine concessions, fishery survey maps, ciguatera perceived risks, biodiversity inventory, multibeam data on the oceanic slopes, etc. Not all of these data layers are easily accessible.
We suggest that the next step that could be beneficial to a wide range of stakeholders should be the creation of such portal preferentially set under the responsibility of a French Polynesia governmental agency.
5. Conclusions
With the goal of providing a bathymetric grid for a black pearl farming lagoon investigated with a hydrodynamic 3D numerical model, we applied here a simple and pragmatic multisource approach by compiling various existing bathymetry data sets and filling gaps with a satellite-derived bathymetry achieved using Sentinel-2 images at 10 m spatial resolution. Caveats to keep in mind are (i) the inherent imprecision of the exercise when calibrating and validating SDB depth using ground-truth data at different spatial resolutions, and affected differently by bottom rugosity at different spatial scales; (ii) the various processing steps suggested here were constrained by our requirements for numerical modeling, thus other choices could be possible in a different context. Nevertheless, the achieved accuracy was within the trends drawn by recent studies elsewhere and were satisfactory for our modeling needs. In lagoon areas in need of spatial management decisions and not entirely covered by LIDAR data, a multisource approach may be the only solution to move forward. Unfortunately, many islands and lagoons still have no data coverage at all, but the Gambier example should pave the way for planning, cost-effectively, the next data acquisitions and developments for the highest priority islands and lagoons.
Author Contributions
Conceptualization, S.A.; methodology, S.A. and O.B.; formal analysis, O.B.; data curation, S.A. and O.B.; writing—original draft preparation, S.A.; writing—review and editing, T.T.; project administration, S.A.; funding acquisition, S.A. and T.T. All authors have read and agreed to the published version of the manuscript.
Funding
This study was funded by the Agence Nationale de la Recherche MANA (Management of Atolls) project (grant ANR-16-CE32-0004), and by the Direction des Marines Ressources Marines de Polynésie française through a contract to Géopolynésie (Christian Friot) (grant MARCHE_5667_01.09.2020) who performed the multibeam survey.
Data Availability Statement
The final bathymetric product presented in this study is available at: https://doi.org/10.17882/109411.
Acknowledgments
Romain Le Gendre helped retrieving the SHOM data and supervised the development of the IMBR method published by Sélim Amrari and co-authors [12].
Conflicts of Interest
The authors declare no conflicts of interest.
Abbreviations
The following abbreviations are used in this manuscript:
| DRM | Direction des Resources Marines |
| IMBR | Iterative Multiple Band Ratio |
| IFREMER | Institut Français de Recherche pour l’Exploitation de la Mer |
| KSLOF | Khaled Bin Sultan Living Oceans Foundation |
| LIDAR | Laser Imaging Detection and Ranging |
| MSP | Marine Spatial Planning |
| SDB | Satellite-Derived Bathymetry |
| SHOM | Service Hydrographique et Océanographique de la Marine |
| SPOT | Satellite Pour l’Observation de la Terre |
References
- Abe, H.; Yamano, H. Simulated Connectivity of Crown-of-Thorns Starfish around Ashizuri-Uwakai National Park (Western Japan) Based on a High-Resolution Hydrodynamic Modeling. Coral Reefs 2024, 43, 371–390. [Google Scholar] [CrossRef]
- Raapoto, H.; Monaco, C.J.; Van Wynsberge, S.; Le Gendre, R.; Le Luyer, J. Assessing Regional Connectivity Patterns of Bivalvia in Fragmented Archipelagos: Insights from Biophysical Modeling in French Polynesia. Ecol. Model. 2024, 489, 110626. [Google Scholar] [CrossRef]
- Andréfouët, S.; Le Gendre, R.; Thomas, Y.; Lo-Yat, A.; Reisser, C.M.O. Understanding Connectivity of Pearl Oyster Populations within Tuamotu Atoll Semi-Closed Lagoons: Cumulative Insight from Genetics and Bio-physical Modelling Approaches. Mar. Pollut. Bull. 2021, 167, 112324. [Google Scholar] [CrossRef] [PubMed]
- Andréfouët, S.; Adjeroud, M. French Polynesia. In World Seas: An Environmental Evaluation; Elsevier: Amsterdam, The Netherlands, 2019; pp. 827–854. ISBN 978-0-08-100853-9. [Google Scholar]
- Andréfouët, S.; Chagnaud, N.; Chauvin, C.; Kranenburg, C. Atlas des Récifs Coralliens de France Outre-Mer; Centre IRD de Nouméa: Nouméa, New Caledonia, 2008; 153p.
- Andréfouët, S.; Genthon, P.; Pelletier, B.; Le Gendre, R.; Friot, C.; Smith, R.; Liao, V. The Lagoon Geomorphology of Pearl Farming Atolls in the Central Pacific Ocean Revisited Using Detailed Bathymetry Data. Mar. Pollut. Bull. 2020, 160, 111580. [Google Scholar] [CrossRef]
- Andréfouët, S.; Bruyère, O.; Paul, M.; Loubrieu, B.; Le Gendre, R.; Barazer, J.-F. Characterizing the Extent of the Oceanic 60–150 m Deep Mesophotic Zone in Tuamotu-Gambier Archipelago Atolls Using Multibeam Bathymetry and Geomorphology Data. Coral Reefs 2025, 44, 835–850. [Google Scholar] [CrossRef]
- Fourgassié, A. La Spatiocarte Marine, Une Solution pour la Cartographie des Atolls Polynésiens. In Proceedings of the Pix’Iles 90: International Workshop on Remote Sensing and Insular Environments in the Pacific: Integrated Approaches, Nouméa, New Caledonia, 19–24 November 1990; ORSTOM: Nouméa, New Caledonia, 1990; pp. 329–341. [Google Scholar]
- Morel, Y.; Favoretto, F. 4SM: A Novel Self-Calibrated Algebraic Ratio Method for Satellite-Derived Bathymetry and Water Column Correction. Sensors 2017, 17, 1682. [Google Scholar] [CrossRef]
- Purkis, S.J.; Gleason, A.C.R.; Purkis, C.R.; Dempsey, A.C.; Renaud, P.G.; Faisal, M.; Saul, S.; Kerr, J.M. High-Resolution Habitat and Bathymetry Maps for 65,000 Sq. Km of Earth’s Remotest Coral Reefs. Coral Reefs 2019, 38, 467–488. [Google Scholar] [CrossRef]
- Kutser, T.; Hedley, J.; Giardino, C.; Roelfsema, C.; Brando, V.E. Remote Sensing of Shallow Waters—A 50 Year Retrospective and Future Directions. Remote Sens. Environ. 2020, 240, 111619. [Google Scholar] [CrossRef]
- Amrari, S.; Bourassin, E.; Andréfouët, S.; Soulard, B.; Lemonnier, H.; Le Gendre, R. Shallow Water Bathymetry Retrieval Using a Band-Optimization Iterative Approach: Application to New Caledonia Coral Reef Lagoons Using Sentinel-2 Data. Remote Sens. 2021, 13, 4108. [Google Scholar] [CrossRef]
- Specht, O.; Stateczny, A. A novel method for coastal zone bathymetry based on multisensor data fusion and unmanned Systems. Sci. Rep. 2025, 15, 35637. [Google Scholar] [CrossRef]
- Andréfouët, S.; Lo-Yat, A.; Lefebvre, S.; Bionaz, O.; Liao, V. The MANA (MANagement of Atolls, 2017–2022) Project for Pearl Oyster Aquaculture Management in the Central Pacific Ocean Using Modelling Approaches: Overview of First Results. Mar. Pollut. Bull. 2022, 178, 113649. [Google Scholar] [CrossRef] [PubMed]
- Bruyère, O.; Chauveau, M.; Le Gendre, R.; Liao, V.; Andréfouët, S. Larval Dispersal of Pearl Oysters Pinctada margaritifera in the Gambier Islands (French Polynesia) and Exploring Options for Adult Restocking Using in Situ Data and Numerical Modelling. Mar. Pollut. Bull. 2023, 192, 115059. [Google Scholar] [CrossRef] [PubMed]
- Violette, C.; Le Gendre, R.; Chauveau, M.; Andréfouët, S. A Multivariate Approach to Synthetize Large Amount of Connectivity Matrices for Management Decisions: Application to Oyster Population Restocking in the Pearl Farming Context of Tuamotu Archipelago Semi-Closed Atolls. Mar. Pollut. Bull. 2023, 189, 114748. [Google Scholar] [CrossRef] [PubMed]
- Lefebvre, S.; Verpoorter, C.; Rodier, M.; Sangare, N.; Andréfouët, S. Remote Sensing Provides New Insights on Phytoplankton Biomass Dynamics and Black Pearl Oyster Life-History Traits in a Pacific Ocean Deep Atoll. Mar. Pollut. Bull. 2022, 181, 113863. [Google Scholar] [CrossRef]
- Van Wynsberge, S.; Quéré, R.; Andréfouët, S.; Autret, E.; Le Gendre, R. Spatial Variability of Temperature inside Atoll Lagoons Assessed with Landsat-8 Satellite Imagery. Remote Sens. Appl. Soc. Environ. 2024, 36, 101340. [Google Scholar] [CrossRef]
- André, L.V.; Van Wynsberge, S.; Chinain, M.; Gatti, C.M.I.; Liao, V.; Andréfouët, S. Spatial Solutions and Their Impacts When Reshuffling Coastal Management Priorities in Small Islands with Limited Diversification Opportunities. Sustainability 2022, 14, 3871. [Google Scholar] [CrossRef]
- André, L.V.; Chinain, M.; Gatti, C.M.i.; Liao, V.; Van Wynsberge, S.; Tedesco, P.; Andréfouët, S. A Systematic Prioritization Approach for Identifying Suitable Pearl Oyster Restocking Zones Following a Mass Mortality Event in Takaroa Atoll, French Polynesia. Mar. Pollut. Bull. 2022, 176, 113472. [Google Scholar] [CrossRef]
- Leon, J.X.; Phinn, S.R.; Hamylton, S.; Saunders, M.I. Filling the ‘White Ribbon’—A Multisource Seamless Digital Elevation Model for Lizard Island, Northern Great Barrier Reef. Int. J. Remote Sens. 2013, 34, 6337–6354. [Google Scholar] [CrossRef]
- Andréfouët, S.; Chenon, F.; Loubersac, L.; Varet, H.; Wibaux, B. Bathymetric modelling of an atoll lagoon, application to the three dimensionnal representation of an island and its lagoon. In Proceedings of the Pix’Iles 90: International Workshop on Remote Sensing and Insular Environments in the Pacific: Integrated Approaches, Nouméa, New Caledonia, 19–24 November 1990; ORSTOM: Nouméa, New Caledonia, 1990; pp. 329–341. [Google Scholar]
- Bionaz, O.; Le Gendre, R.; Liao, V.; Andréfouët, S. Natural Stocks of Pinctada margaritifera Pearl Oysters in Tuamotu and Gambier Lagoons: New Assessments, Temporal Evolutions, and Consequences for the French Polynesia Pearl Farming Industry. Mar. Pollut. Bull. 2022, 183, 114055. [Google Scholar] [CrossRef]
- Mesa-Mingorance, J.L.; Ariza-López, F.J. Accuracy Assessment of Digital Elevation Models (DEMs): A Critical Review of Practices of the Past Three Decades. Remote Sens. 2020, 12, 2630. [Google Scholar] [CrossRef]
- Stumpf, R.P.; Holderied, K.; Sinclair, M. Determination of Water Depth with High-Resolution Satellite Imagery over Variable Bottom Types. Limnol. Oceanogr. 2003, 48, 547–556. [Google Scholar] [CrossRef]
- Sikirić, M.D.; Janeković, I.; Kuzmić, M. A New Approach to Bathymetry Smoothing in Sigma-Coordinate Ocean Models. Ocean Model. 2009, 29, 128–136. [Google Scholar] [CrossRef]
- Berntsen, J.; Thiem, Ø.; Avlesen, H. Internal Pressure Gradient Errors in σ-Coordinate Ocean Models in High Resolution Fjord Studies. Ocean Model. 2015, 92, 42–55. [Google Scholar] [CrossRef]
- Kliem, N.; Pietrzak, J.D. On the Pressure Gradient Error in Sigma Coordinate Ocean Models: A Comparison with a Laboratory Experiment. J. Geophys. Res. 1999, 104, 29781–29799. [Google Scholar] [CrossRef]
- Theetten Thiebault, B.; Dumas, F.; Paul, J. BMGTools: A community tool to handle model grid and bathymetry. Mercat. Ocean-Q. Newsl. 2014, 49, 94–98. [Google Scholar]
- Rencher, A.C. Methods of Multivariate Analysis; Wiley: New York, NY, USA, 1995; 627p. [Google Scholar]
- Kerr, J.M.; Purkis, S. An Algorithm for Optically-Deriving Water Depth from Multispectral Imagery in Coral Reef Landscapes in the Absence of Ground-Truth Data. Remote Sens. Environ. 2018, 210, 307–324. [Google Scholar] [CrossRef]
- Zhang, X.; Al Shehhi, M.R. Bathymetry Estimation for Coastal Regions Using Self-Attention. Sci. Rep. 2025, 15, 970. [Google Scholar] [CrossRef]
- Collin, A.; Hench, J.L.; Pastol, Y.; Planes, S.; Thiault, L.; Schmitt, R.J.; Holbrook, S.J.; Davies, N.; Troyer, M. High Resolution Topobathymetry Using a Pleiades-1 Triplet: Moorea Island in 3D. Remote Sens. Environ. 2018, 208, 109–119. [Google Scholar] [CrossRef]
- Bruyère, O.; Le Gendre, R.; Liao, V.; Andréfouët, S. Lagoon Hydrodynamics of Pearl Farming Islands: The Case of Gambier (French Polynesia). Earth Syst. Sci. Data 2024, 16, 667–679. [Google Scholar] [CrossRef]
- Andréfouët, S.; Thomas, Y.; Dumas, F.; Lo, C. Revisiting Wild Stocks of Black Lip Oyster Pinctada margaritifera in the Tuamotu Archipelago: The Case of Ahe and Takaroa Atolls and Implications for the Cultured Pearl Industry. Estuar. Coast. Shelf Sci. 2016, 182, 243–253. [Google Scholar] [CrossRef]
- Andréfouët, S.; Thomas, Y.; Lo, C. Amount and Type of Derelict Gear from the Declining Black Pearl Oyster Aquaculture in Ahe Atoll Lagoon, French Polynesia. Mar. Pollut. Bull. 2014, 83, 224–230. [Google Scholar] [CrossRef]
- Crusot, M.; Gaertner, J.-C.; Rodriguez, T.; Lo, C.; Gaertner-Mazouni, N. Assessment of Plastic Waste Generated by the Aquaculture Industry: The Case Study of Pearl Farming in French Polynesia. J. Clean. Prod. 2023, 425, 138902. [Google Scholar] [CrossRef]
- Smallhorn-West, P.F.; Gordon, S.E.; Dempsey, A.C.; Purkis, S.J.; Malimali, S.; Halafihi, T.; Southgate, P.C.; Bridge, T.C.L.; Pressey, R.L.; Jones, G.P. Tongan Socio-Environmental Spatial Layers for Marine Ecosystem Management. Pac. Conserv. Biol. 2021, 27, 86–92. [Google Scholar] [CrossRef]
Disclaimer/Publisher’s Note: The statements, opinions and data contained in all publications are solely those of the individual author(s) and contributor(s) and not of MDPI and/or the editor(s). MDPI and/or the editor(s) disclaim responsibility for any injury to people or property resulting from any ideas, methods, instructions or products referred to in the content. |
© 2025 by the authors. Licensee MDPI, Basel, Switzerland. This article is an open access article distributed under the terms and conditions of the Creative Commons Attribution (CC BY) license (https://creativecommons.org/licenses/by/4.0/).