Abstract
Cumulenes are linear molecules consisting of consecutive double bonds linking chains of sp-hybridized carbon atoms. They have primarily been of interest for potential use as molecular wires or in other nanoscale electronic devices, but more recently, other applications such as catalysis or even light harvesting through singlet fission have been speculated. Despite the recent theoretical and experimental interest, the photoexcitation of cumulenes typically results in quenching on the picosecond timescale, and the exact quenching mechanism for even the simplest of [3]-cumulenes lacks a clear explanation. In this report, we perform transient absorption spectroscopy on a set of model [3]-cumulene derivatives in a wide range of environmental conditions to demonstrate that the planarization of phenyl groups ultimately quenches the excited state. By restricting this intramolecular motion, we increase the excited state lifetime by a few nanoseconds, strongly enhancing photoluminescence and demonstrating an approach to stabilize them for photochemical applications.
1. Introduction
Cumulenes are a class of molecules that possess consecutive double bonds and have been of interest to chemists for over 100 years [1,2]. Similarly to their polyyne counterparts, they have been attractive for uses that take advantage of the rigid linear chain of sp-hybridized carbon atoms [3,4,5,6,7]. Most notably, cumulenes have been theorized to be useful as molecular wires and potentially useful in nanoscale electronic devices [8,9,10,11,12,13]. Preparing cumulenes with an even number of double bonds results in end groups that are perpendicular, leading to helical molecular orbitals, while odd cumulenes have a planar geometry and non-helical orbitals [14,15,16]. This observation has been a primary interest for theoreticians and experimental groups attempting to use cumulenes for the applications above, although understanding the electronic structure of cumulenes is still an active area of research.
Most recently, a new application of cumulenes was discovered when a cumulene derivative was employed as an electrocatalyst for the borylation of aryl chlorides [17]. The reaction bypassed the typical convention of using UV photons to excite a photocatalyst to achieve high reducing potentials. Other recent reports of cumulenes have focused on trying to explain the mechanism of efficient excited state quenching after photoexcitation [18]. Combining a more detailed understanding of this excited state deactivation in cumulenes with the newly discovered electrocatalytic application could open the door to new photo- or electro-catalytic pathways using these molecules. Moreover, the triplet energy of cumulenes is predicted to be low, and a ground state biradical character has been observed, suggesting further scopes to extend the uses of cumulenes for exciton multiplication via singlet fission or other triplet-based catalytic pathways [19,20,21,22].
Despite this interest, reports investigating the excited state dynamics and photochemistry of cumulenes are scarce [23,24,25,26]. Earlier reports investigating the optical properties of [3]-cumulenes functionalized with phenyl groups demonstrated that ground-state energy is significantly perturbed by small changes to the phenyl group's torsional angle [27,28,29]. In a completely planar geometry, the lowest transition was predicted to be dark, while a perturbation as small as 5° turns the lowest excited state bright. In a later report, the efficient excited state quenching of tetraphenyl-[3]-cumulene (TPC, Figure 1a) was attributed to rapid rotation around the central cumulene bond axis in a fashion similar to that of stilbene [30]. Other [3]-cumulene derivatives were categorized as aggregation-induced emission (AIE) molecules for their ability to emit brightly as aggregates but not as isolated molecules [31]. Interestingly, TPC specifically was not assigned to have this AIE property, and only the other derivatives that were functionalized with bulkier end groups could—presumably because the TPC aggregates underwent quenching from π-stacking as aggregates. Recent spectroscopic studies on cumulene derivatives sought to resolve the question of what causes the excited state quenching of TPC and a related derivative in which the phenyl groups are covalently bridged (TPCb, Figure 1a) [18]. Based on transient spectroscopic measurements on a single crystal of a TPCb derivative, the authors proposed a model that relies on two low-lying singlet states of different characters, which were proposed to undergo rapid equilibration prior to electronic relaxation in this scheme. Despite the detailed spectroscopic results presented, a direct explanation as to whether phenyl group rotation or central cumulene bond rotation is the cause of excited state quenching was not established.
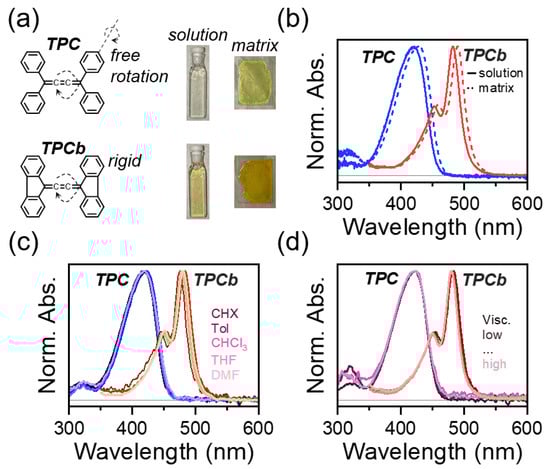
Figure 1.
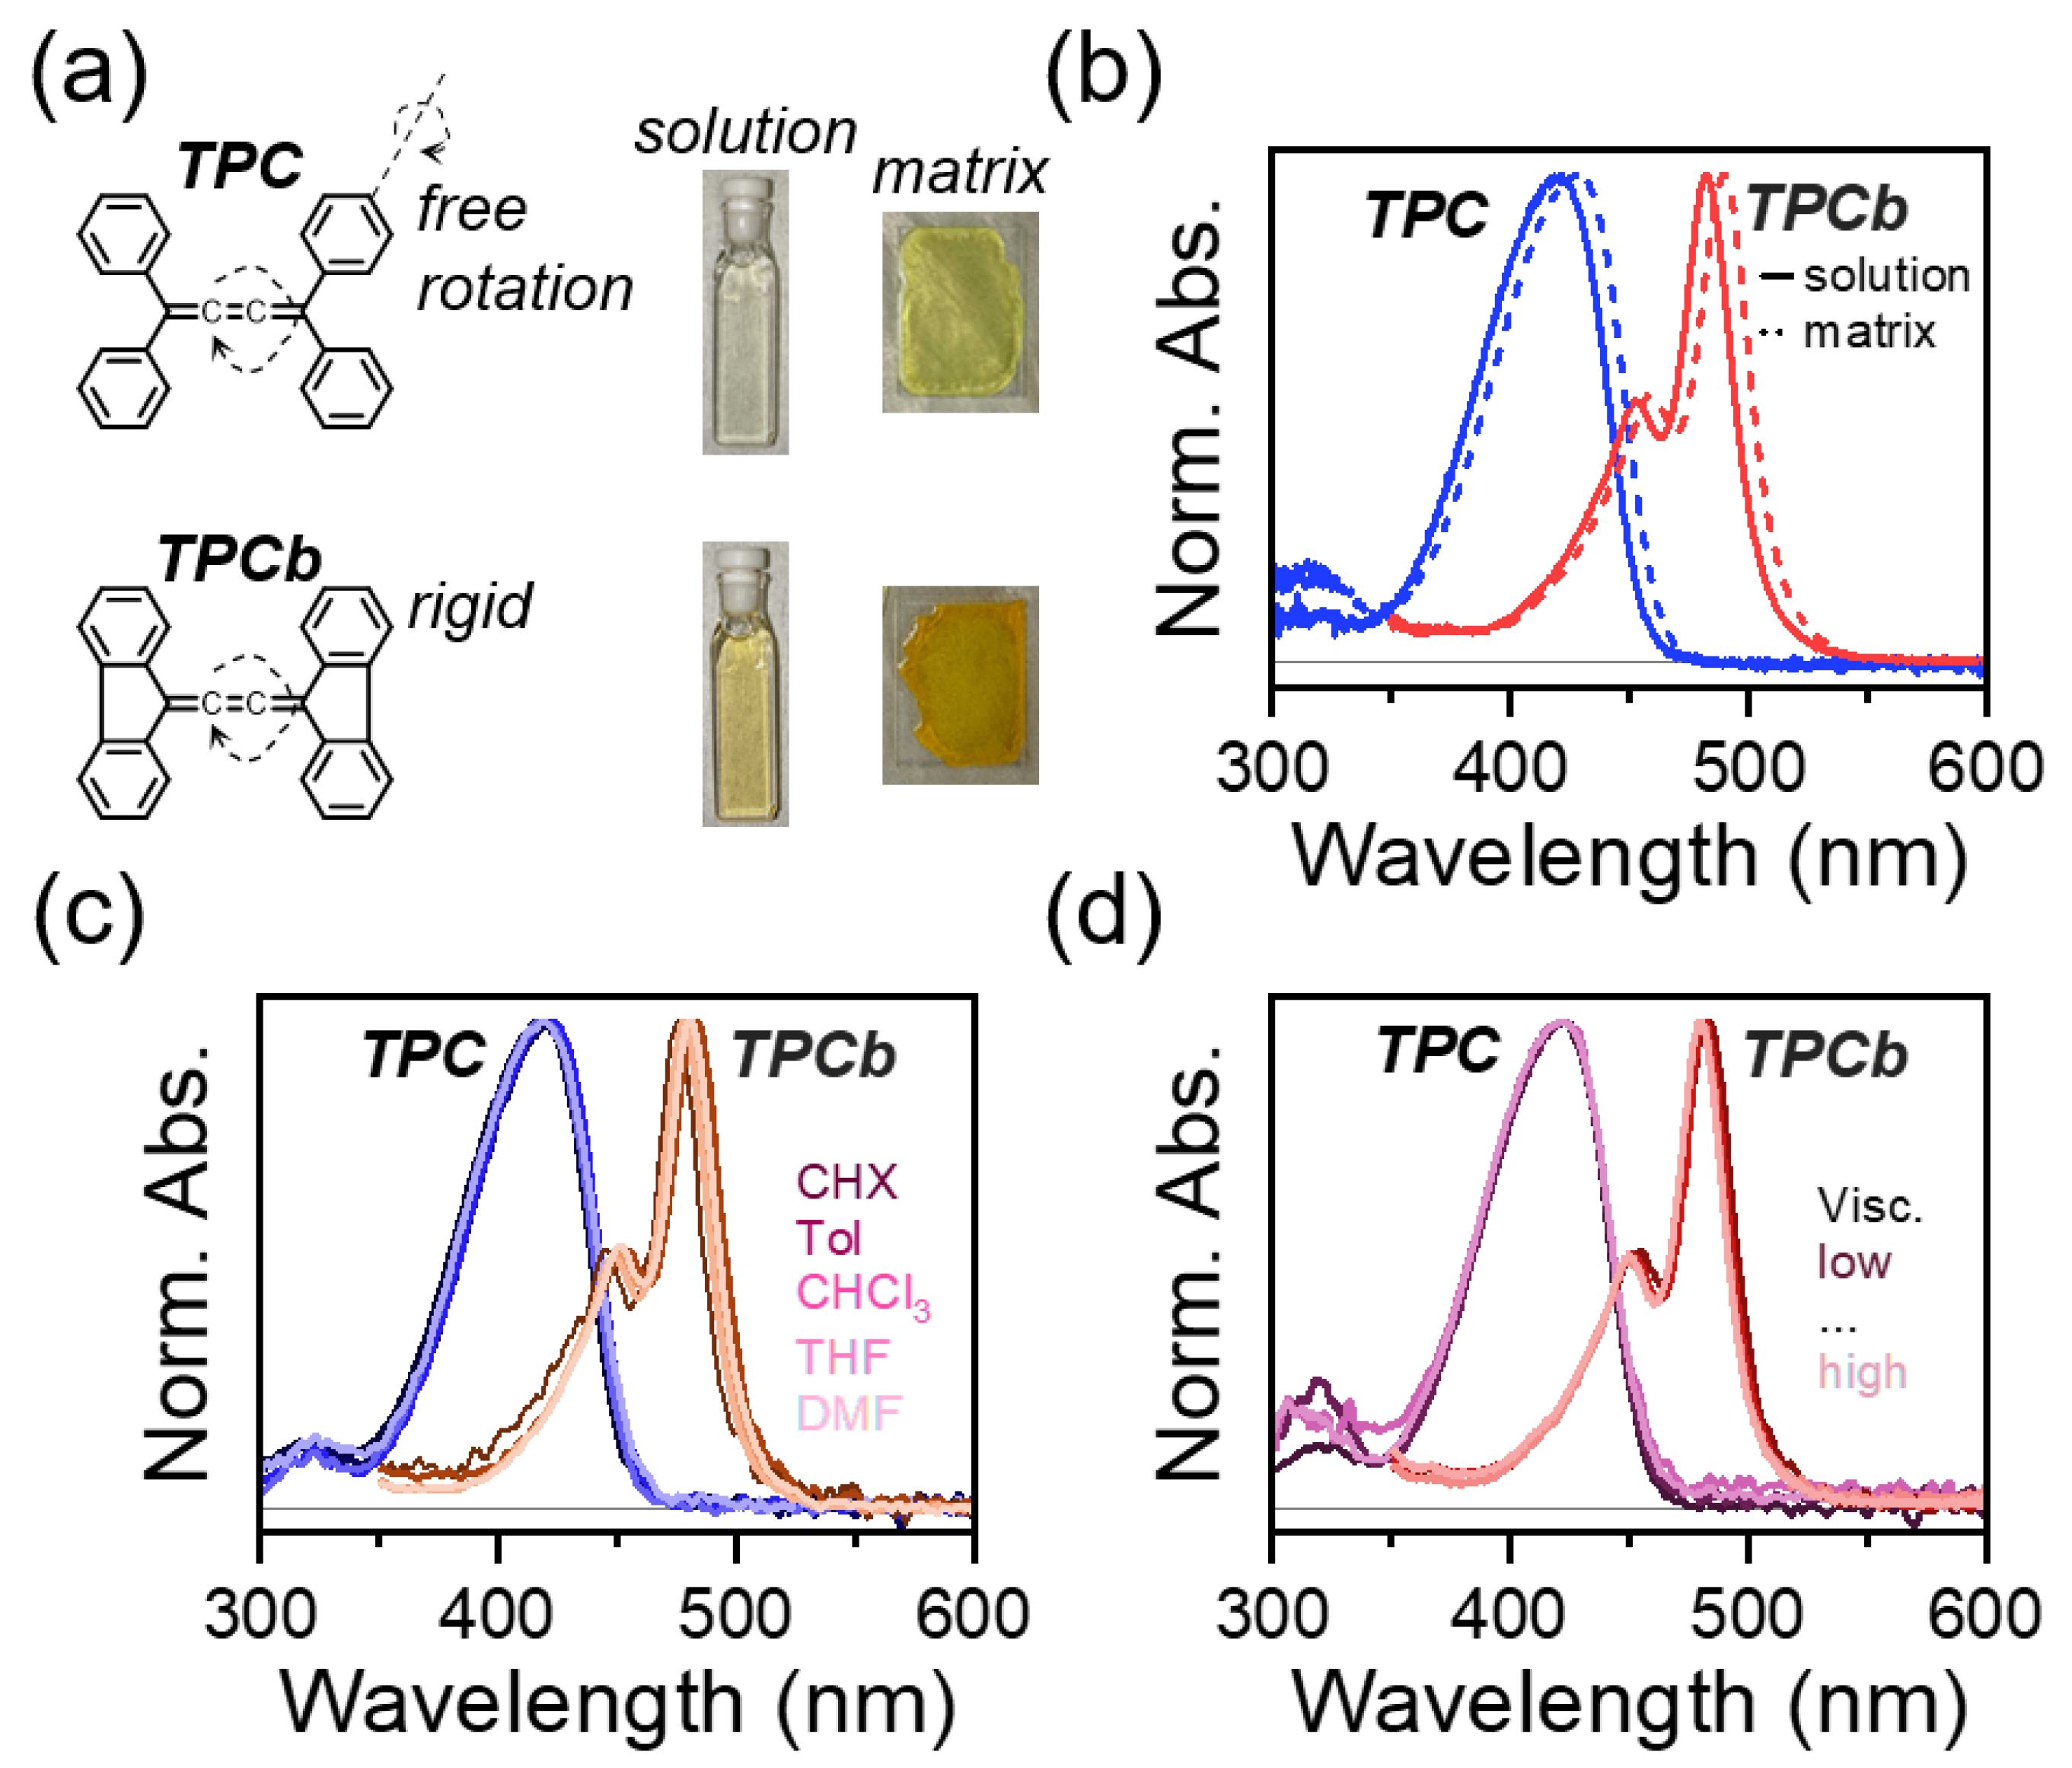
(a) Structures of tetraphenyl-[3]-cumulene (TPC) and the bridged version (TPCb). Axes of phenyl group rotation in the ground state and cumulene bond rotation in the excited state are indicated. Representative photographs of solution (0.01 mg/mL in toluene) and polystyrene matrix samples are also shown, with respective normalized absorbance spectra shown in (b). (c) Normalized absorbance of TPC and TPCb dissolved in solvents of varying polarity (cyclohexane-CHX, toluene-Tol, chloroform-CHCl3, tetrahydrofuran-THF, and dimethylformamide-DMF). (d) Normalized absorbance of TPC and TPCb prepared in the mixtures of toluene and paraffin oil to vary viscosity. See Materials and Methods section for all sample preparation details.
In this report, we performed detailed transient absorption (TA) spectroscopy on TPC and TPCb under a variety of environmental conditions to demonstrate how the interplay between phenyl group torsion and central cumulene bond rotation results in excited state quenching. We ultimately attribute the quenching of the excited state to the planarization of the phenyl groups, which proceeds through either a conical intersection or other vibronic mechanism back to the ground state. In addition, we highlight the fact that TPC exhibits inherent conformational disorder. We investigate the excited state dynamics of both TPC and TPCb prepared in the dilute solution, as well as dilute solids in a polymer matrix prepared in a range of solvents of varying polarity and prepared in solutions of varying viscosity. Lastly, we demonstrate how the knowledge of excited state quenching leads us to control photoluminescence (PL) intensity and the excited state's lifetime, which can ultimately be useful in enabling new photochemical applications of cumulenes.
2. Materials and Methods
2.1. Synthesis
Full synthetic details of TPC and TPCb are presented in the Supplementary Materials Section S1 (Figures S1–S7).
2.2. Spectroscopy
Steady-state absorbance measurements were performed using a homebuilt setup with an Energetiq LDLS EQ-99X (Hamamatsu, Bridgewater, NJ, USA) white light source and Avantes AvaSpec-Mini4096CL (Avantes, Louisville, CO, USA) for detection. TA was performed using a commercially available Helios Transient Absorption Spectrometer (Ultrafast Systems, Sarasota, FL, USA). The excitation pulses were generated using an OPA (Orpheus, Light Conversion, Bozeman, MT, USA) that was sourced via a Pharos-10W femtosecond pulsed laser (1030 nm, 180 fs, Light Conversion). Typical excitation energies were ~50 μJ with a 650 μm spot size (D4σ). Excitation pulse durations are ~200 fs, and either visible or ultraviolet broadband probes were used. In cases where both probe wavelength ranges were used, data sets were spliced together after scaling to overlap at 500 nm, which is common to both probe ranges. PL measurements were performed using the same excitation source as TA measurements and a Spectrapro HRS300 spectrometer (150 g/mm, Princeton Instruments, Trenton, NJ, USA) with PI-MAX4 ICCD camera (Princeton Instruments) was used for detection. For both PL and TA, excitation wavelengths of 425 nm and 485 nm were used for TPC and TPCb, respectively, unless otherwise noted. All solution measurements were performed at a concentration of 0.01 mg/mL TPC or TPCb within a 2 mm glass cuvette. Samples for viscosity-dependent measurements were prepared by varying the ratio of toluene to paraffin oil (CAS-No: 8012-95-1). TPC or TPCb was dissolved in toluene at a concentration of 0.2 mg/mL. This solution was diluted to 0.01 mg/mL by mixing 150 μL with varying ratios of paraffin oil and toluene for a total solution volume of 3 mL. The following toluene–paraffin oil ratios were used, with values given in μL and including the 150 μL of toluene stock solution: 3000:0, 1450:1550, 450:2550, and 150:2850. Polymer matrix samples were prepared by co-dissolving TPC or TPCb in toluene to a concentration of 0.2 mg/mL together with polystyrene (80 mg/mL). Films were then prepared via drop casting 100 uL of solution onto quartz-coated glass substrates. To obtain the relative PL spectra, an Edinburgh FLS1000 Spectrometer was used. When comparing relative PL spectra, spectra were corrected by accounting for the absorbance strength at the excitation wavelength.
2.3. Calculations
All computations were carried out using the software package ORCA 5.0.4 [32,33,34]. Single-point calculation and geometry optimizations were carried out with the density functional B3LYP [35,36]. Calculations employed the def2-TZVP(-f) basis set [37]. The density fitting and “chain of spheres” (RIJCOSX) approximations were employed in conjunction with an automatically generated auxiliary basis set using the keyword AutoAux [38,39]. Stationary points were verified via the analytic computation of vibrational frequencies. Vertical excitation energies were calculated within the time-dependent density functional theory (TDDFT) formalism employing the Tamm–Dancoff approximation (TDA) with the same combination of functional and basis sets [40]. Excited state potential energy curves were constructed with TDDFT via the addition of vertical transition energy to ground-state energy. Phenyl torsion angles deviating from the optimized structure were constructed manually using the optimized structure as a starting point. Results were visualized using Avogadro 1.2.0 [41]. Sample inputs have been included in Supplementary Materials Section S2.
3. Results
3.1. Steady-State Characterization
The chemical structures of TPC and TPCb are shown in Figure 1a. Indicated on the structures are the possible intramolecular motions that have both been implicated in the excited-state quenching discussed above [18,29,30]. To identify which motion is primarily responsible for quenching, we first consider the steady-state absorbance spectra. The spectrum of TPC is broad and featureless, in contrast to TPCb, which shows a clear vibronic structure (Figure 1b). From crystallography and in line with calculations, the most favorable geometry for TPC is when the phenyl groups are all symmetrically rotated by ~32° relative to planarity (Tables S1 and S2, Figure S8) [18,31]. However, small perturbations to this phenyl torsional angle can induce large changes to the transition energies and respective oscillator strengths (Tables S3 and S4). With a distribution of thermally accessible phenyl torsion, the absorbance spectrum of TPC has contributions from molecules in countless conformations and the observed spectrum is a weighted average of all those geometries (Figure S9). Based on our calculations, we expect a similar yet smaller effect from the twisting of the central cumulene axis (see Supplementary Materials Section S2 for more details, Tables S5 and S6, and Figures S10–S12). As a result of this conformational disorder in the TPC ground state, the absorbance spectrum is significantly broadened. When the phenyl group rotation is restricted by a covalent bond in TPCb, we observe a sharper, more structured absorbance spectrum, consistent with a reduction in conformational disorder. This effect is accompanied in TPCb by a 60 nm redshift, which is in line with predicted trends for phenyl group planarization, and similar torsion around the central cumulene was expected for TPCb following excitation (Table S7, Figures S13 and S14). In both molecules, the absorption spectrum in dilute solution is nearly identical to that of a sample prepared as a polymer matrix and is not strongly impacted by solvent polarity or viscosity (Figure 1c,d). We note that the polymer matrix samples are solid-state films where large-scale intramolecular motion is suppressed, in contrast to the solution phase and viscosity-controlled samples. The independence of the absorbance from environmental effects (solution vs. matrix, polarity, and viscosity) means that the relative amount of electronically impactful conformational order/disorder is primarily controlled by the bridging bond. As we show below, this disorder has a major impact on the excited state relaxation.
3.2. TPC Excited State Characterization
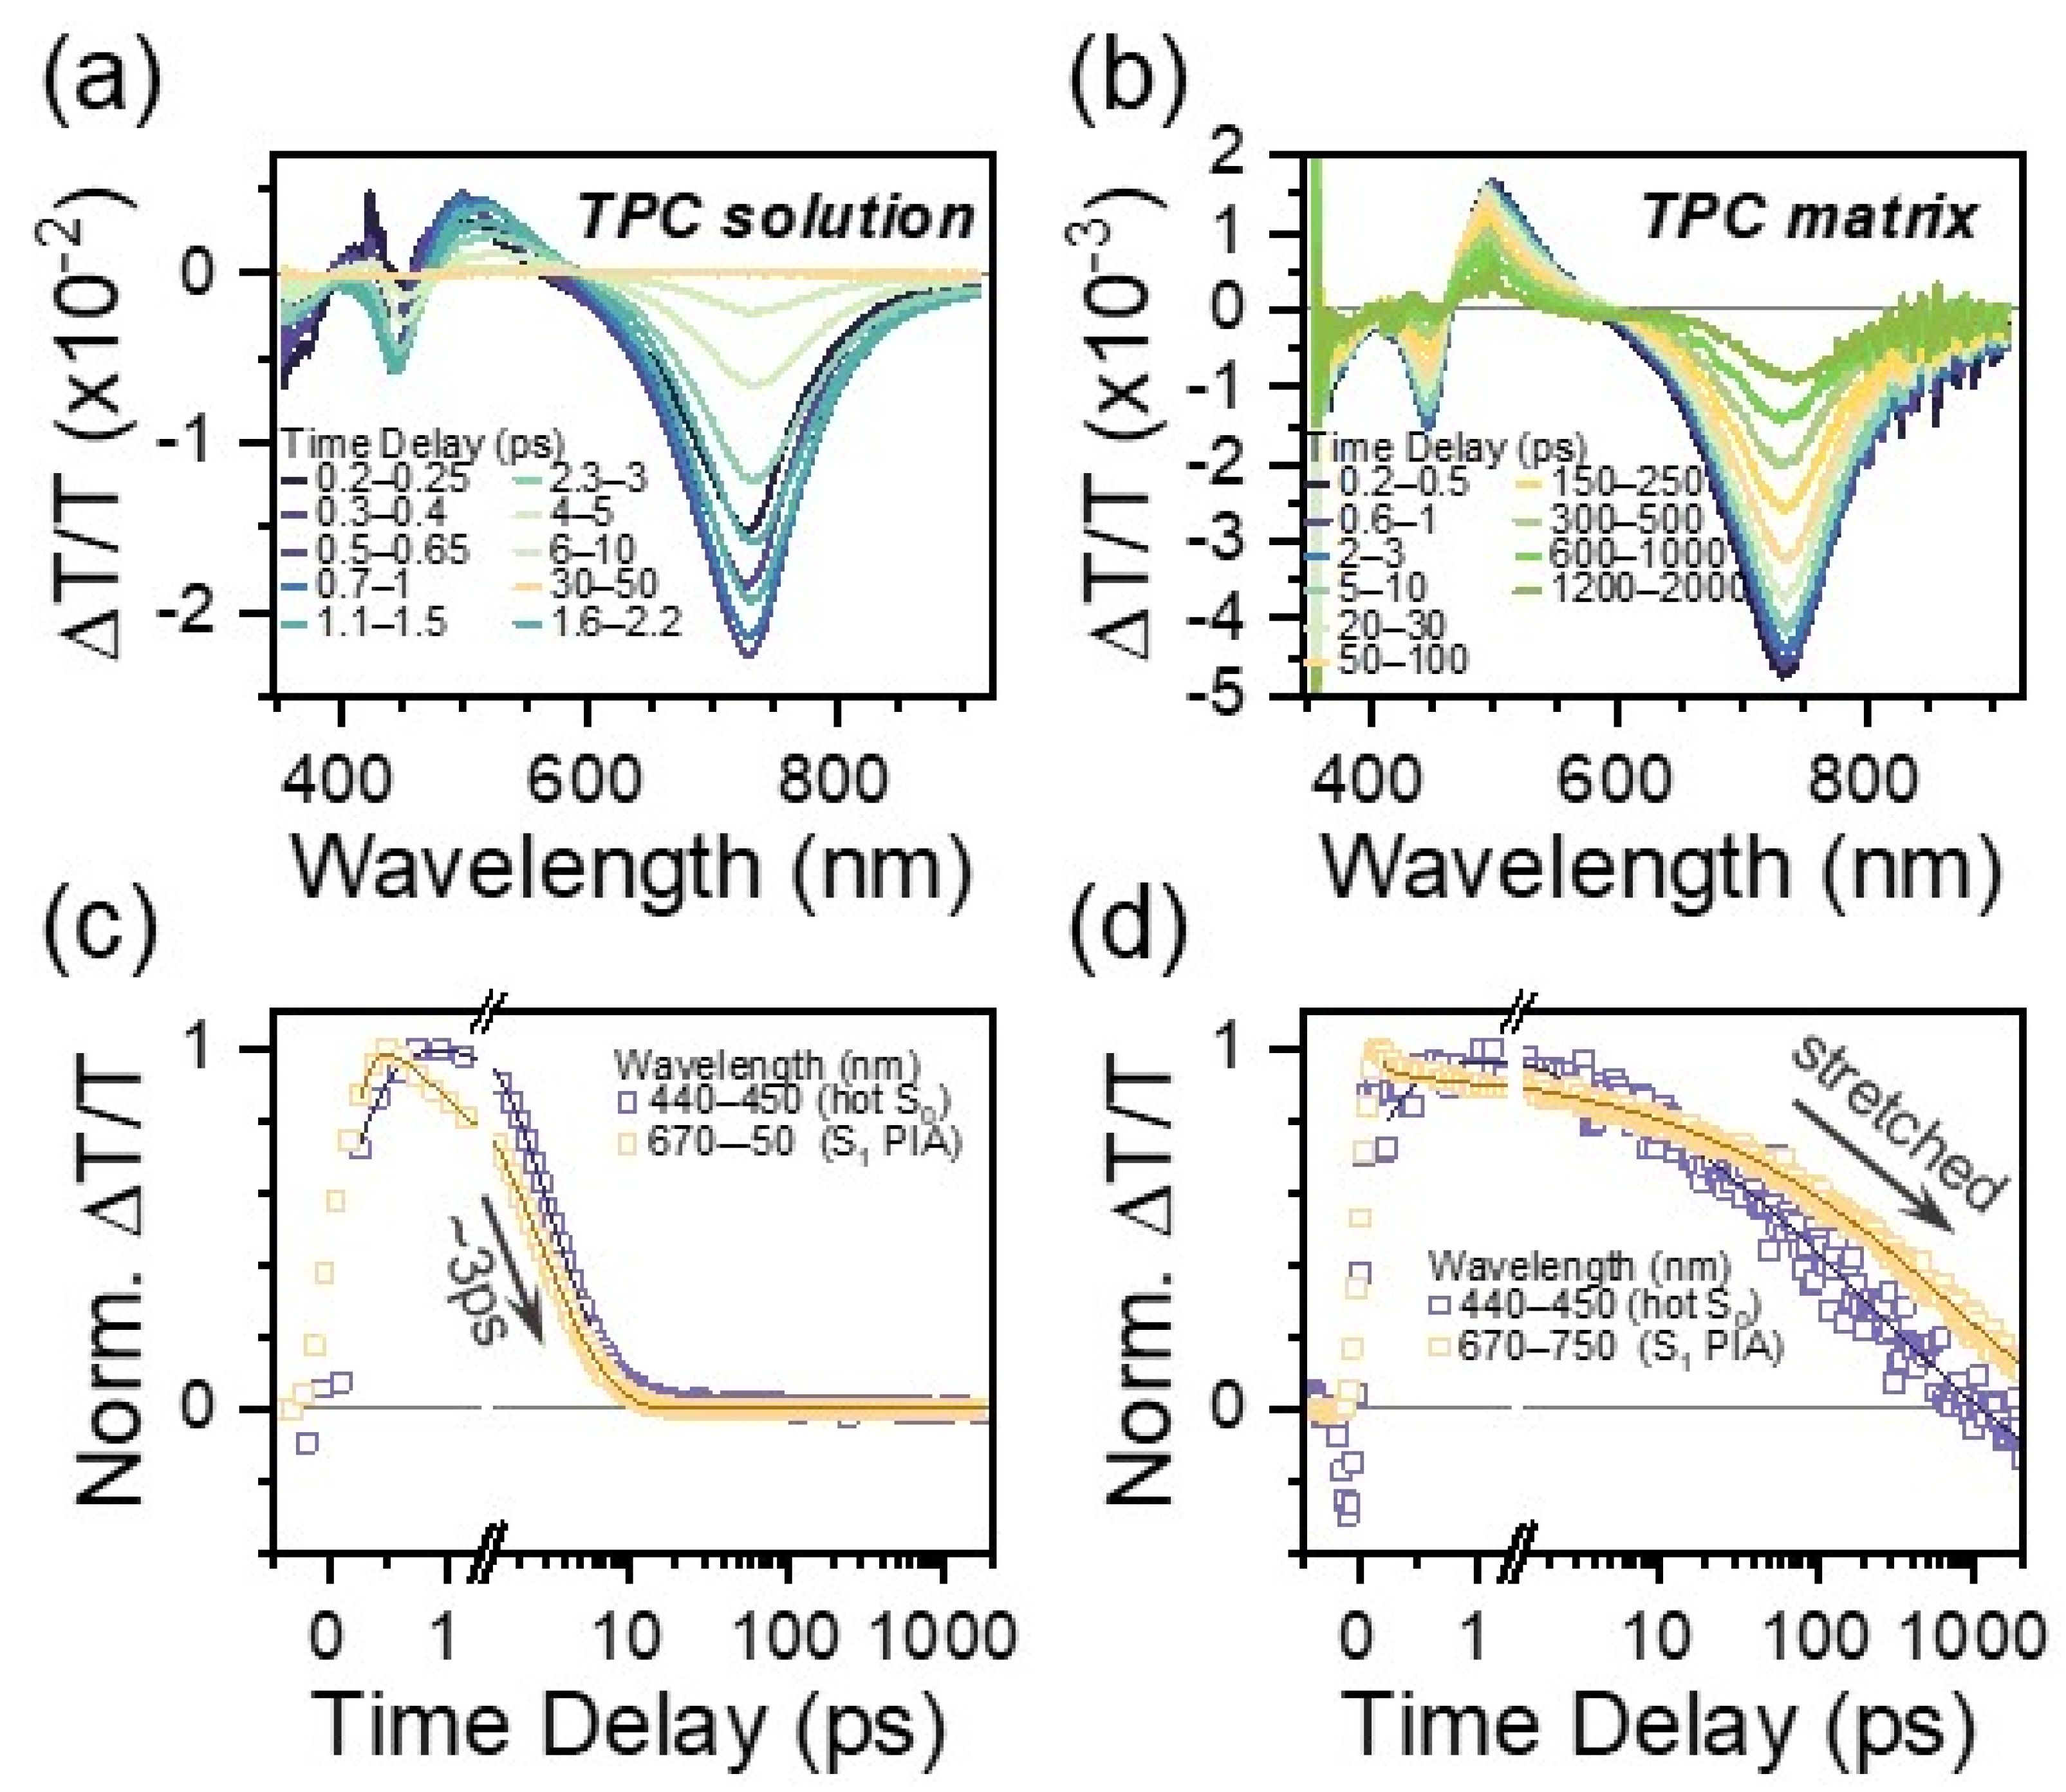
The excited state relaxation of TPC and TPCb was investigated using TA spectroscopy. In these experiments, absorption from excited states (S1, S2, T1, etc.) after photoexcitation leads to a negative signal, while positive signals stem from either the bleaching of ground state S0 or stimulated emission from S1. These signals can be used to track excited state relaxation via the unique fingerprints from each state, with the time resolution limited by the excitation pulse's duration (~200 fs here, see Materials and Methods for more details). In a dilute solution of TPC in toluene (Figure 2a), there are three primary regions of interest: a broad photoinduced absorption (PIA) at 730 nm, a stimulated emission (SE) at 490 nm, and another negative peak at 445 nm. The SE band is assigned based on comparisons with steady-state PL measurements (Figure S15). There is no clear ground state bleach (GSB) due to other overlapping features that mask it; however, the peak at 445 nm is positioned in between the expected GSB (425 nm) and SE. Its line shape aligns with the first derivative of the absorbance spectrum (Figure S15). As it decays, the spectral shape becomes distorted, and it persists for longer than all other signals. These are all hallmarks of hot ground state absorption (GSA*) due to electronic relaxation into a vibrationally excited ground state, and we accordingly assign this feature to a hot ground state [42,43]. The presence of this signal is a clear hallmark of few to sub-ps excited state deactivation. The SE and 730 nm PIA peaks additionally redshift during the decay. By extracting kinetic profiles for the GSA* and 730 nm PIA, we observe relaxation back to the ground state with a ~3 ps time constant from exponential fitting (Figure 2c, Table S8). When we prepare TPC within a polymer matrix, we observe the same general features in TA (730 nm PIA, SE, GSA*) but with far slower decay (Figure 2b). Now, all signals persist beyond 1 ns—several orders of magnitude longer than in the solution. This enhancement in lifetime is accompanied by a reduction in the degree of spectral evolution, suggesting that excited state relaxation is partially suppressed. Most notably, the long-lived decay is best fitted with a stretched exponential with a stretching parameter of ~0.4, which is indicative of disorder in the excited state (Table S8) [44]. We lastly note that there are additional sub-ps dynamics observed in the solution (and likewise for TPCb), which are discussed along with conformational disorder in more detail below.
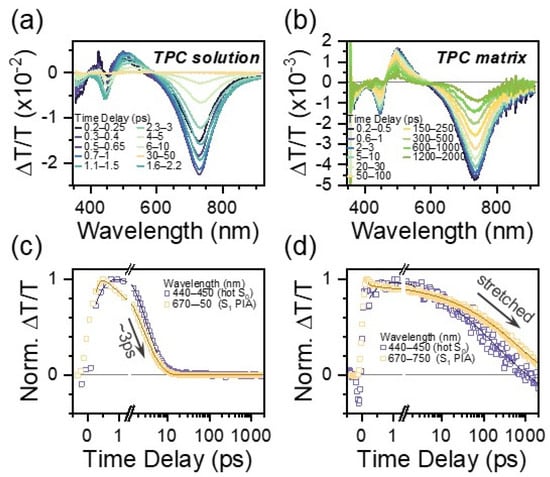
Figure 2.
TA spectral slices for TPC in a dilute solution of toluene (a) and prepared as a polymer matrix (b). Spectral slices are extracted by integrating over the indicated time ranges. Respective kinetic profiles integrated over the indicated wavelength ranges are shown in (c,d).
3.3. TPCb Excited State Characterization
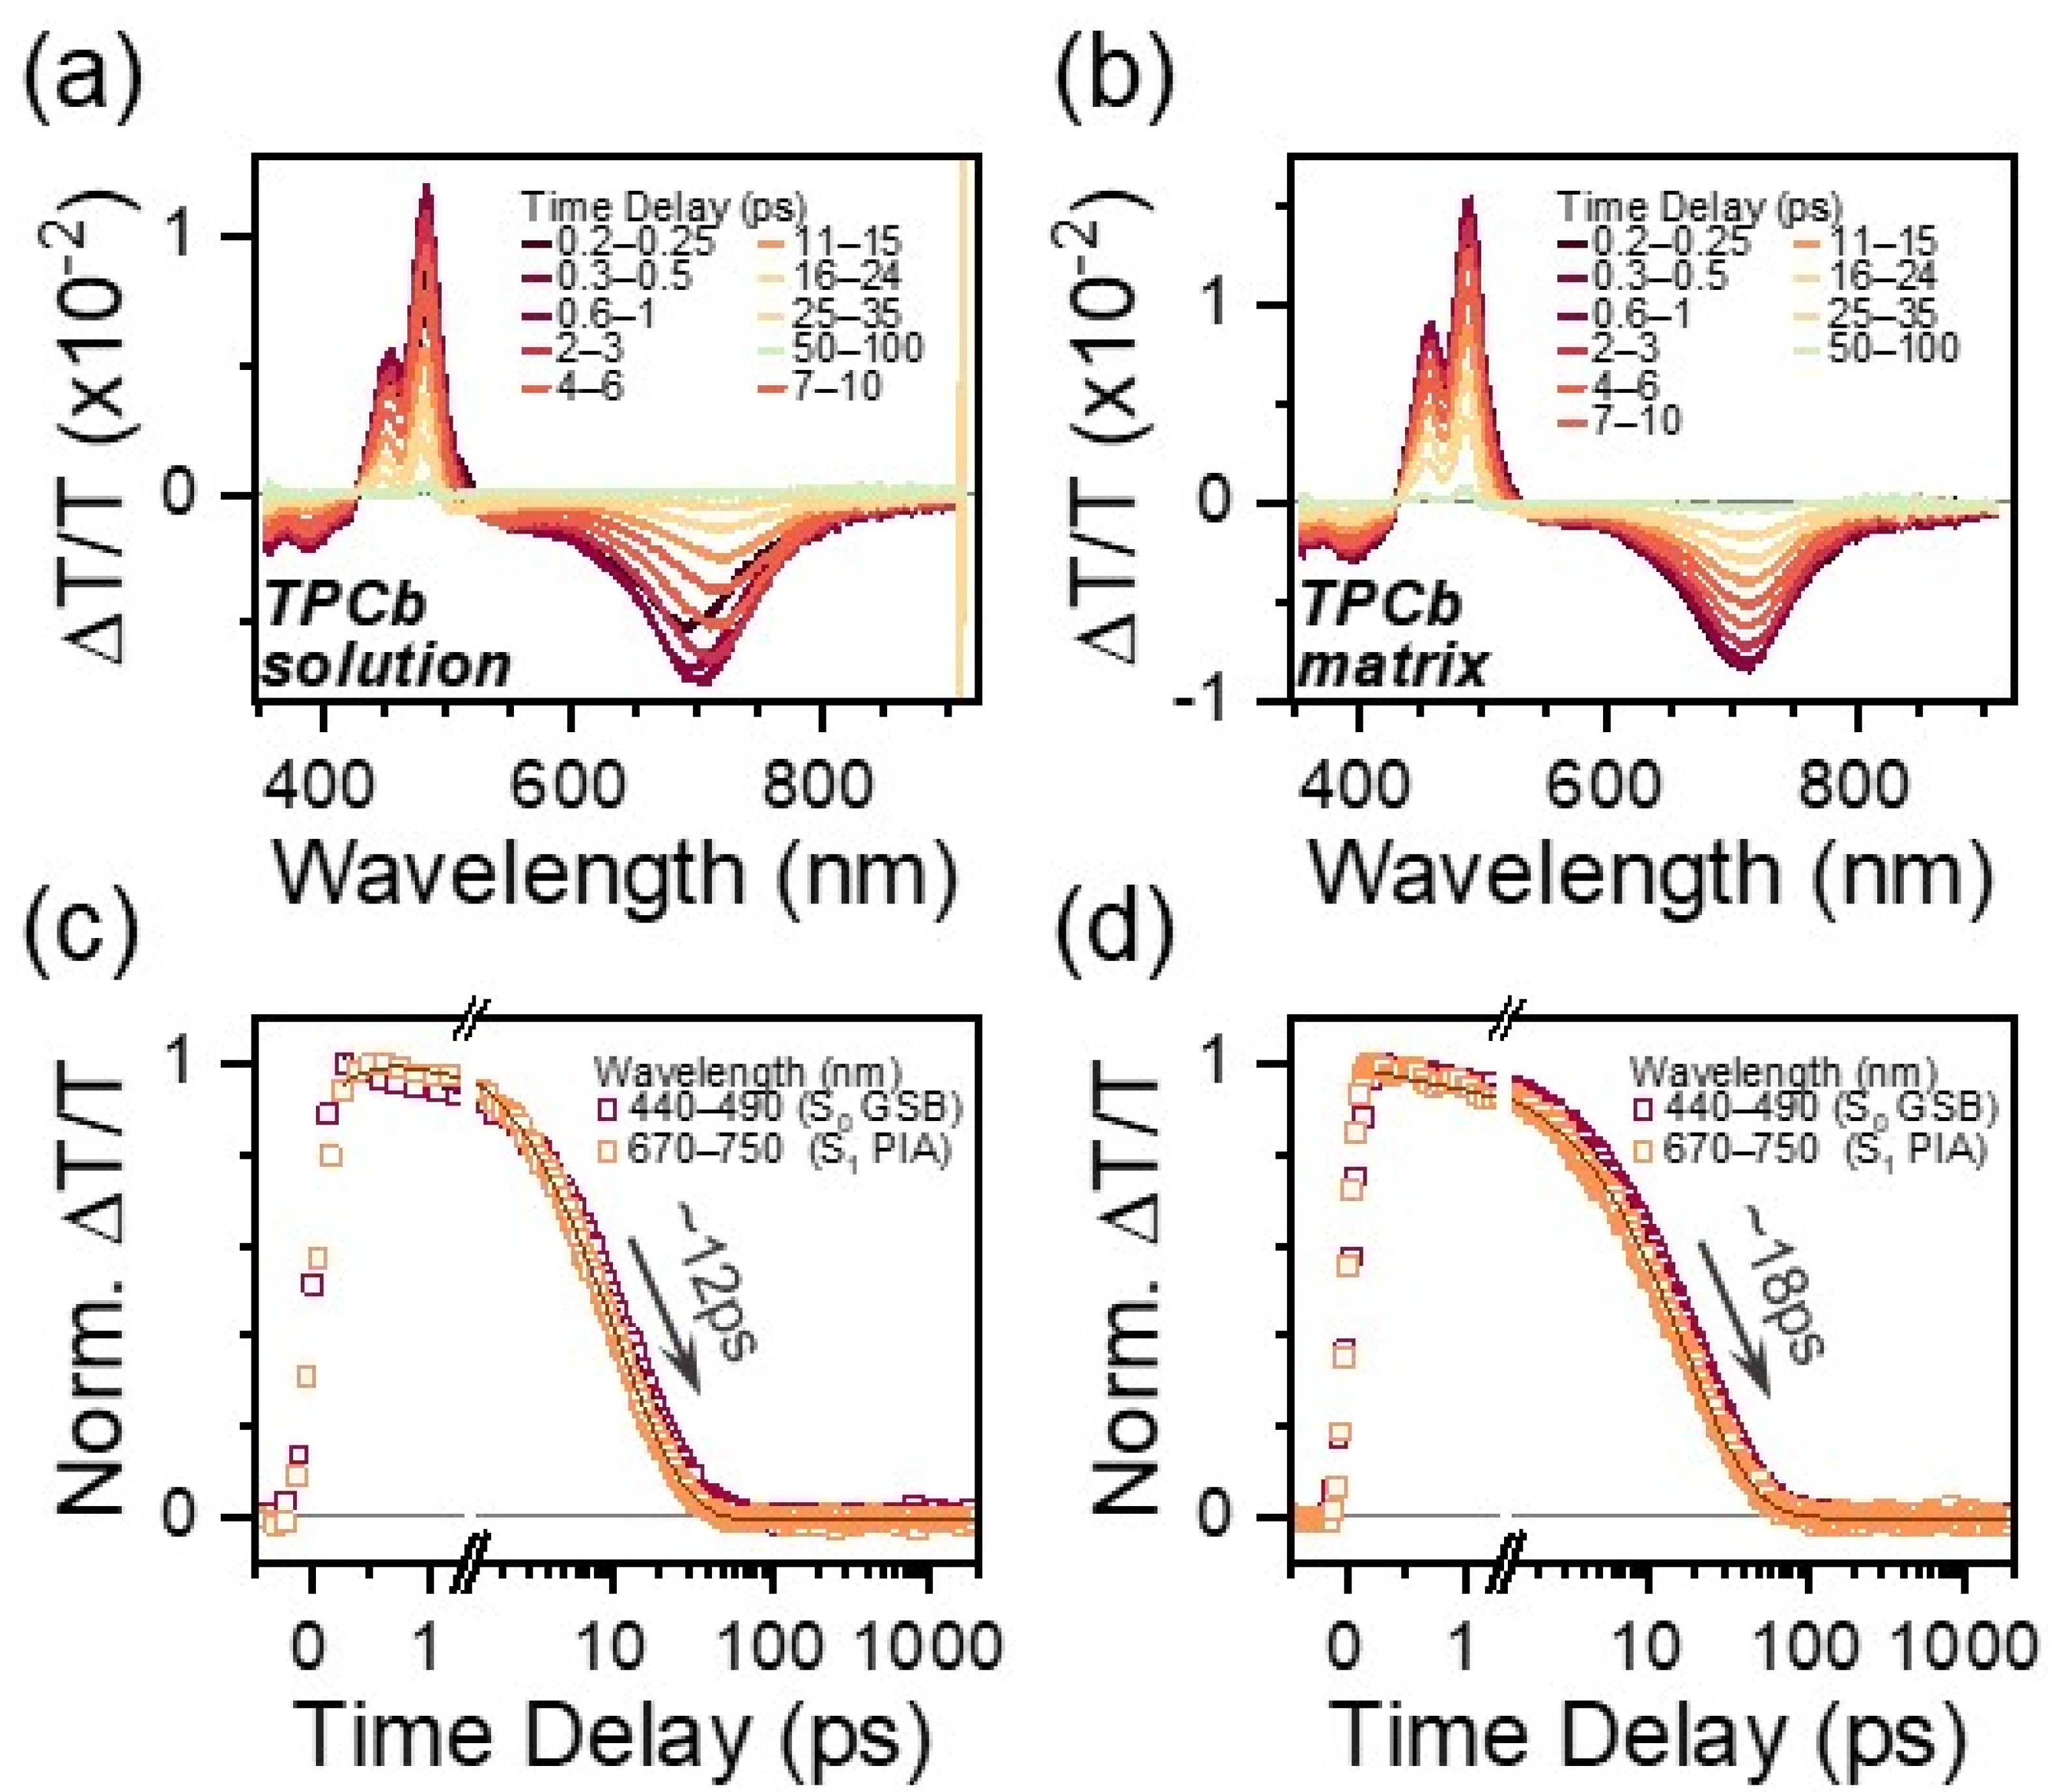
The TA spectral features of TPCb are reminiscent of those in TPC. Prepared in a dilute solution of toluene or in a polymer matrix, there is a strong PIA at 710 nm, clear GSB at 485 nm, and an intermediate region between where expected SE and GSA* should be overlapped (Figure 3a,b and Figure S15). For this reason, we utilize the more isolated 710 nm S1 → Sn PIA in TPCb as a benchmark for comparison with TPC. While the TPCb singlet lifetime is marginally enhanced in the solution relative to TPC—12 ps versus 3 ps—within a matrix, there is barely any further increase in lifetime (18 ps). Thus, within the polymer matrix, TPCb decays fully back to the ground state orders of magnitude faster than TPC (Figure 3c,d, Table S9). The spectral effects of excited state conformational relaxation appear to be similar to TPC, with a distinct redshift of the S1 → Sn PIA in the solution that is suppressed in the matrix. Notably, we observe that this conformational relaxation is not connected to the rapid excited state decay, as its absence in the TPCb matrix is not correlated with a meaningfully increased lifetime. Instead, it appears that the bridging of phenyl groups results in a markedly reduced ability to tune the relaxation pathway via environmental effects.
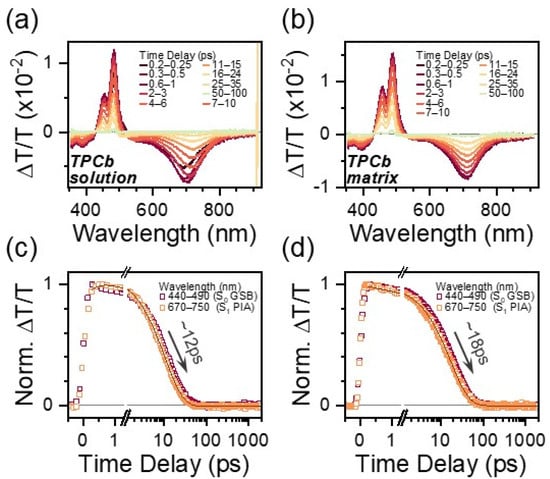
Figure 3.
TA spectral slices for TPCb in a dilute solution of toluene (a) and prepared as a polymer matrix (b). Spectral slices are extracted by integrating over the indicated time ranges. Respective kinetic profiles integrated over the indicated wavelength ranges are shown in (c,d).
3.4. Environmental Effects on Excited State Relaxation
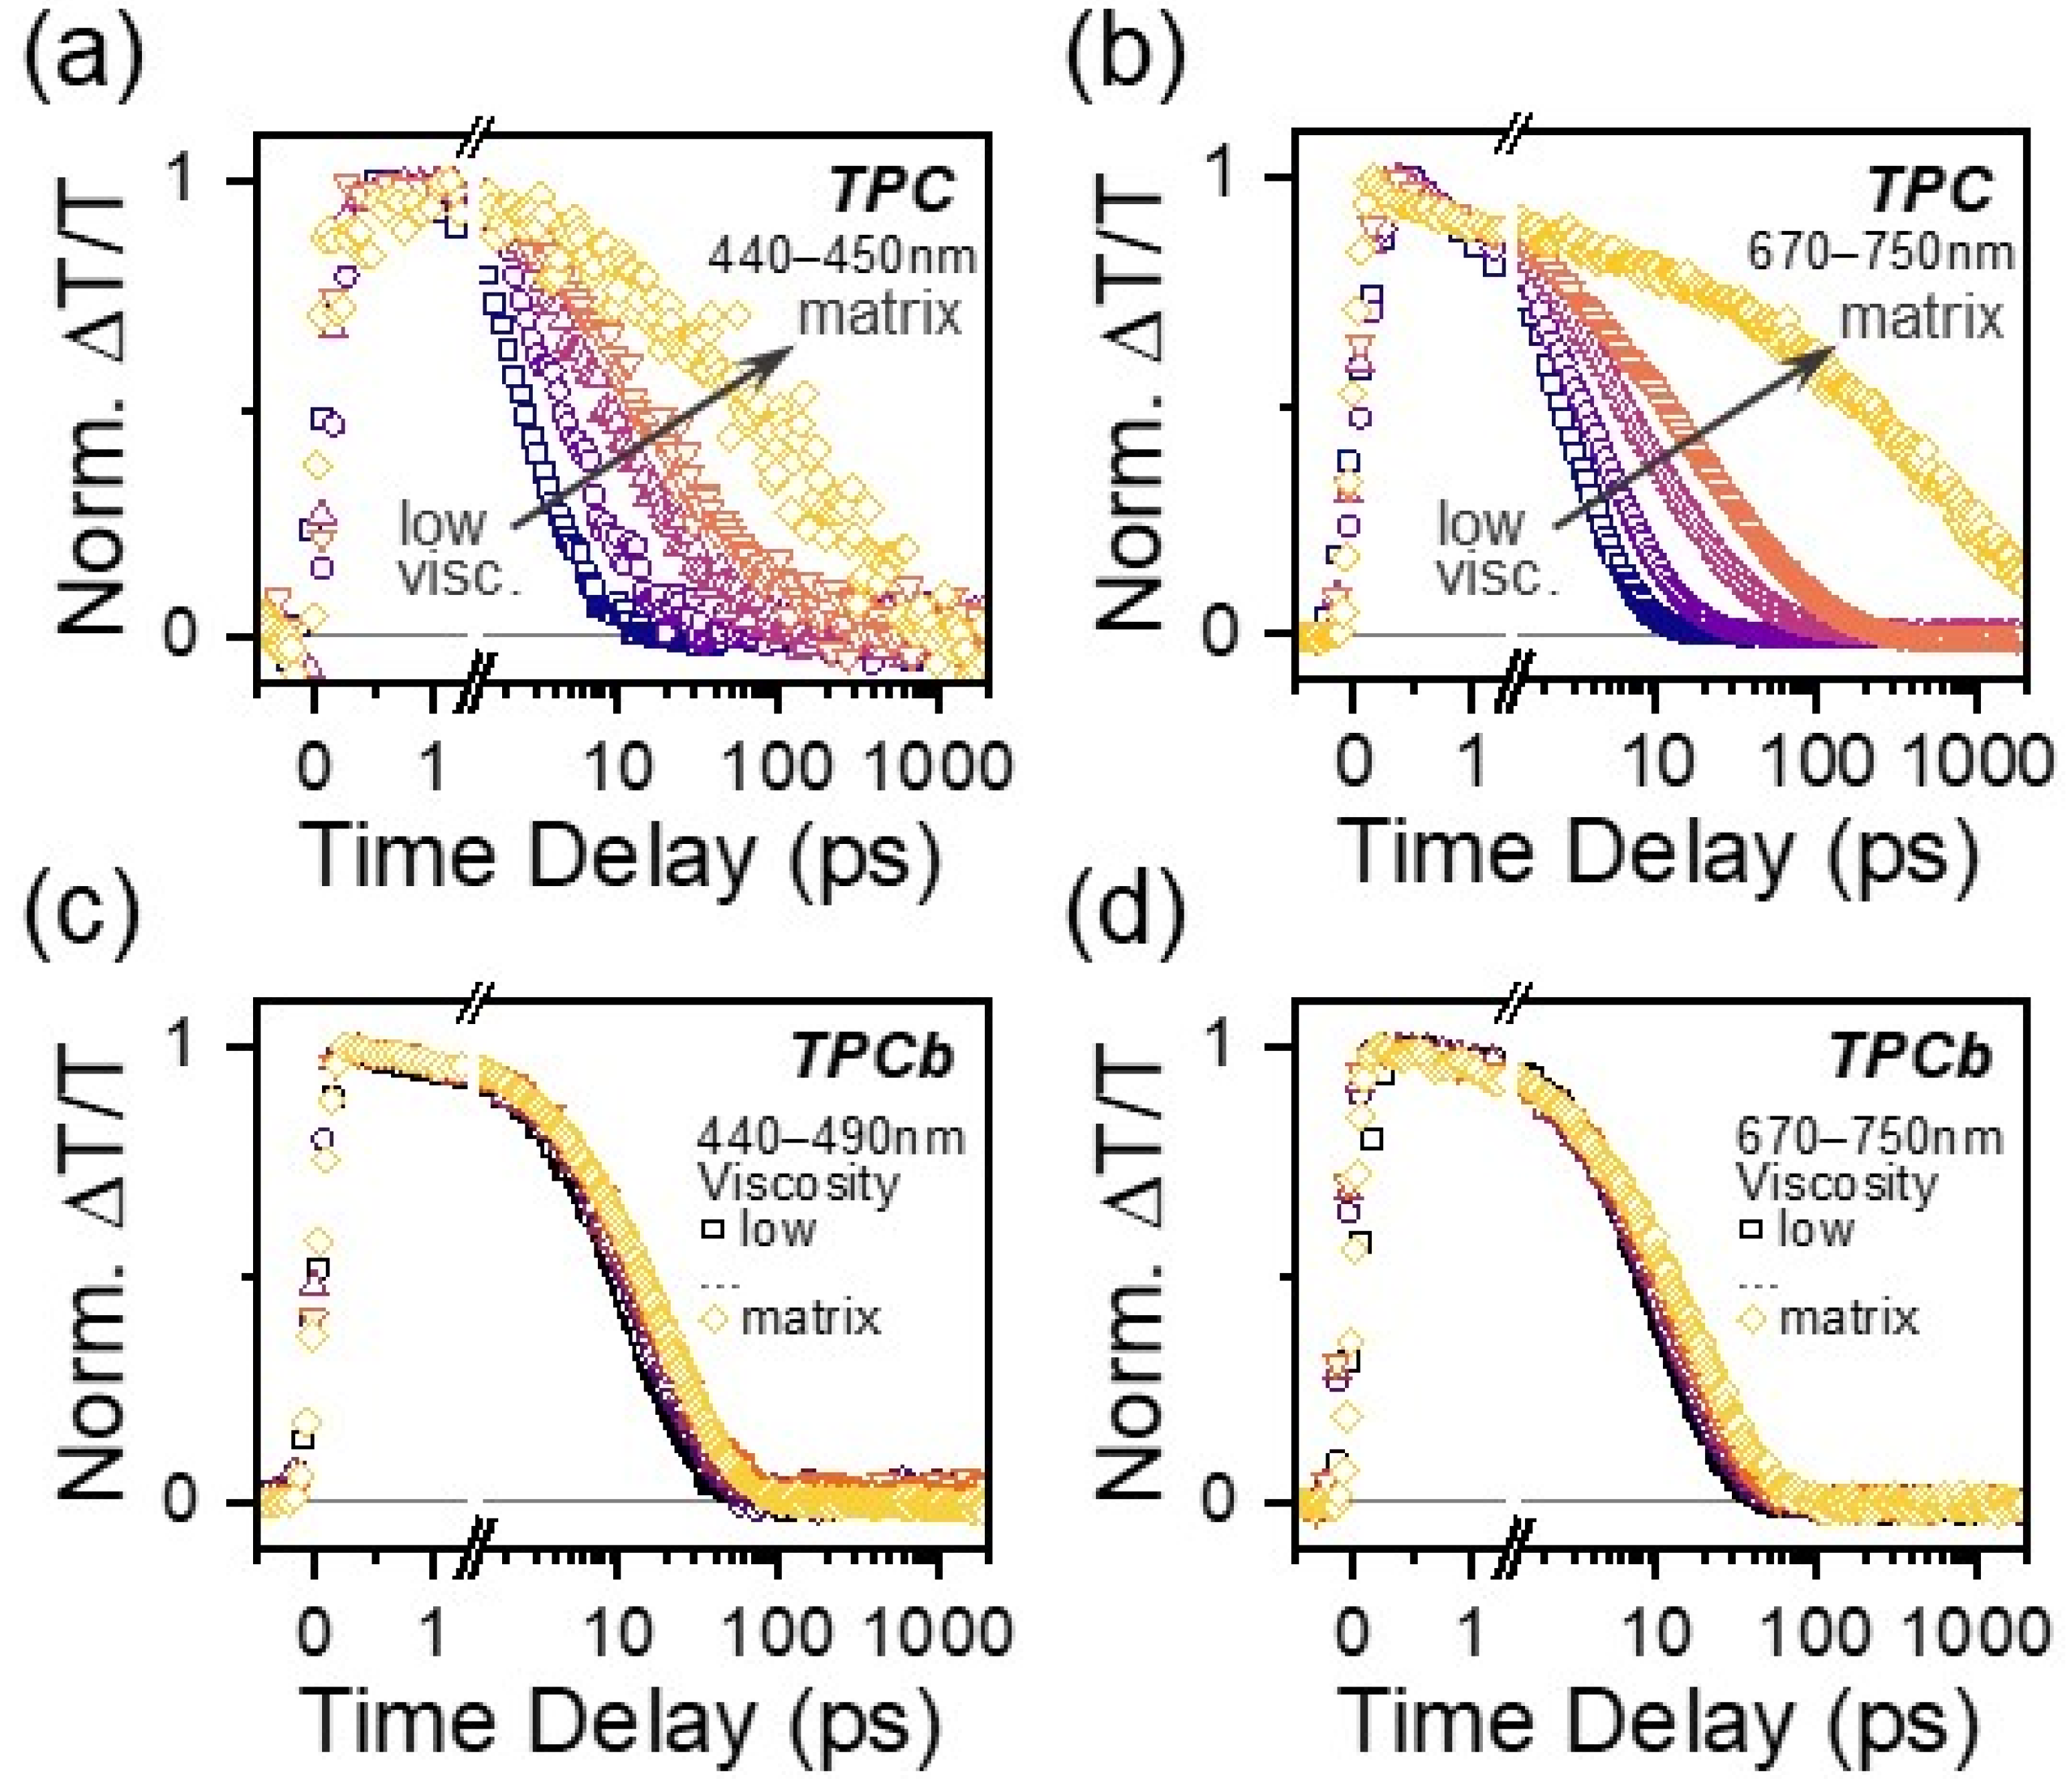
Viscosity-dependent TA measurements were performed to investigate more systematically how the restriction of large-scale intramolecular motion affects excited state relaxation in TPC and TPCb. Solvent viscosity was increased by adding increasing amounts of paraffin oil (see Materials and Methods for more information). In TPC, the same GSA* and 730 nm PIA were tracked and show a clear increase in lifetime with increasing solvent viscosity, as expected from the comparison above (Figure 4a,b and Figure S16), although even at the highest viscosity, the signal fully decays within 100 ps. In TPCb, the GSB and 710 nm PIA kinetics are largely independent of solvent viscosity (Figure 4c,d and Figure S16). To establish whether other factors like charge-transfer excitations contribute to the dynamics, we further probed solvent polarity dependence and observed minimal effects on the lifetime and TA spectral shapes for both molecules (Figures S17–S19). We did, however, detect subtle changes in the excited state dynamics when we scanned the excitation wavelength from the red absorption edge to higher energies, as discussed in more detail below (Figures S20–S23, Table S10). Lastly, we note that there is a detectable but instrument-limited rise dynamic in the 730/710 nm PIA in our solution measurements of TPC and TPCb, distinct from the instantaneous formation of GSB. These dynamics are not present in any of the polymer matrix data, so we attribute them to an ultrafast solvation process or vibrational relaxation that does not end up affecting the subsequent electronic relaxation processes.
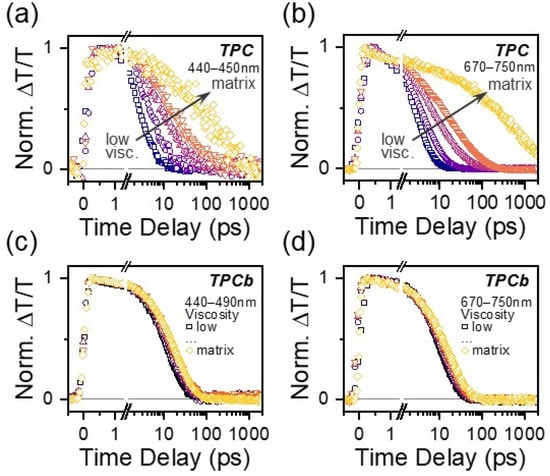
Figure 4.
Kinetic profiles of the GSA* (440–450 nm) and S1 PIA (670–750 nm) for TPC as solvent viscosity is varied (a,b). Kinetic profiles for the GSB (440–490 nm) and S1 PIA (670–750 nm) for TPCb (c,d) as solvent viscosity is varied. Viscosity was varied by changing the ratio of toluene to paraffin oil while the concentration of TPC or TPCb was kept at a constant 0.01 mg/mL. The kinetics for the corresponding matrix samples from Figure 2 and Figure 3 are overlaid for comparison.
4. Discussion
These results highlight the importance of molecular motion to excited state relaxation in [3]-cumulenes. First considering TPC in the solution, the single-exponential decay is indicative of just one relaxation pathway back to the ground state. The SE and 730 nm PIA both decay with similar time constants as they originate from the same state, while the longer time constant of 55 ps only occurs for the GSA* peak. The latter can be assigned as the vibrational cooling time for the hot ground state (S0*). However, when TPC is prepared within a matrix, the same basic S1 features (SE and 730 nm PIA) are now present up to the nanosecond timescale, simultaneously with GSA*. This is an unusual effect: typically, hot ground state signatures like GSA* are observed specifically when S1 rapidly relaxes back to the ground state. Our observation thus points to the presence of at least two parallel decay channels from S1—a rapid decay to S0* and a stabilized, longer-lived S1 state. Indeed, our observation of stretched exponential decay in the matrix points to significant disorder in the excited state and thus a distribution of decay pathways/lifetimes. This finding mirrors the evidence of conformational disorder in the ground electronic state, and we attribute it to the same origin. We interpret these effects as follows. In a solution, a wide range of distinct geometries are all photoexcited simultaneously. Regardless of the initial geometry after photoexcitation, rapid geometrical relaxation in the solution means that the same conformation for ultrafast relaxation back to S0 can always be reached, leading to the single-exponential 3 ps lifetime. Because large-scale conformational dynamics are suppressed in the film (or slowed in a high-viscosity solution), the excited state lifetime becomes strongly dependent on how close the initial conformation was to the deactivation geometry of S1. Hence, there is a distribution of lifetimes with some conformers that are still decaying rapidly while others are stabilized and exhibit long-lived S1.
By carrying out comparisons with the excited state dynamics of TPCb, we gain key insight into which motions quench the excited state since the bridging bond restricts phenyl group torsion but does not suppress cumulene bond rotation. Crucially, the decay dynamics of TPCb are nearly identical in the solution and matrix, where bond rotation is prevented in the matrix cumulene. This key observation demonstrates that the large-scale rotation relative to the cumulene bond cannot be the primary deactivation pathway in this class of [3]-cumulenes (see Table S11 for additional details). Interestingly, the lifetime of TPCb in all conditions is much more similar to TPC in the solution than TPC in films, despite the fact that phenyl group motions are likewise suppressed. The near independence of TPCb dynamics relative to conformational restraint (matrix and viscosity) confirms that the motions restricted by the covalent bridge are most strongly implicated in rapid deactivation. That is, the rotation of the phenyl groups on TPC is the primary motion that leads to quenching. This strong connection to vibrational motion and very short lifetime suggests that the decay is mediated specifically by a conical intersection or similar vibronic mechanism, although further ultrafast studies would need to be carried out for verification. Though this rationale can explain the different sensitivities to the environment in TPC and TPCb, it does not explain why the excited state is so short-lived if the key mode is suppressed. Moreover, we find that the planar structure of TPCb must be very similar to the quenching geometry accessed dynamically in TPC. This is the reason for their comparably fast decay constants and similar spectral shapes.
On closer evaluation of solution TA data, we observe significant spectral evolution in both TPC and TPCb solutions that is absent in the matrix data—indicative of geometric relaxation in the excited state. Specifically, there is a redshift in the SE and 710/730 nm PIAs that is more pronounced in TPCb (see Figure S24 for additional details). The evolution trends with solvent viscosity and is minimally affected by solvent polarity. Intriguingly, because the evolution is present in TPCb, it must not be related to phenyl group rotation like the excited state quenching mechanism discussed above. Instead, it must be related to cumulene bond rotation in the excited state, as has been demonstrated before in previous works [30,45,46]. So, while phenyl group rotation and cumulene bond rotation are both expected and generally active in the excited state, the latter motion does not impact the quenching pathway but only modulates the spectral shape. The absence of this spectral evolution in the polymer films confirms our supposition that the cumulene bond rotation is suppressed in those samples (see Supplementary Materials for more details on cumulene bond rotation).
Recalling that the ground state of TPC exhibits significant conformational disorder, we can compile a complete picture of the relaxation dynamics for TPC and TPCb. For TPC, molecules in a wide continuum of geometries with varying phenyl group rotation angles are all photoexcited simultaneously. In solution, regardless of the initial geometry, all molecules will planarize within a few picoseconds to the geometry that enables rapid relaxation to a hot ground state, which itself decays over tens of picoseconds. In a solid matrix, the phenyl groups cannot easily rotate. Some molecules will be in favorable geometry (near planar) to decay rapidly back to the ground state to produce GSA*, while some are locked in unfavorable geometries and decay slowly. This creates a distribution of excited state decay pathways and leads to stretched exponential decay. In TPCb, the ground state is more conformationally ordered due to the bridging bond, and planar geometry is ideal for rapid relaxation back to the ground state. So, regardless of sample preparation conditions, nearly the same relaxation dynamics are observed.
This model suggests that the dynamics could be modulated by excitation wavelength, as significant conformational disorder should enable specific sub-populations to be selectively photoexcited. However, upon the red-edge excitation of the TPC matrix, the decay pathway is nearly identical to that of resonant excitation, with only a small increase in the exponential stretching parameter from 0.42 to 0.56 (Table S10). This increase signifies that there is slightly less disorder within the excited state than under resonant excitation conditions. Upon excitation at still higher energies, we obtain similar results to those presented above. In the solution, the effects of excitation wavelength are still more subtle, with only a slight increase in the decay rate under red-edge excitation (Table S10). This set of results seems counterintuitive but can be reconciled by consideration of our calculations. Even at the most extreme red- or blue-edge excitation conditions where reasonable signal levels in TA measurements are attained (470 nm), the density of transitions corresponding to distinct conformations means that there remains significant disorder. Thus, any excitation condition will still inevitably excite a distribution of conformers, and it is impossible to excite single conformations with our instrument. Indeed, the calculations in Tables S3 and S4 are calculated based on either the symmetric rotation of all four phenyl groups or the rotation of just one, with the others held in the equilibrium geometry. Accounting for the possibility of the random rotation of all phenyl groups, the number of accessible geometries would be vast, suggesting that the conformational disorder in TPC cannot be avoided without constraining the structure physically (as in TPCb).
A key consequence of these observations is that the PL of TPC can be greatly enhanced by increasing the rigidity of the system. Whether this is achieved by tuning solvent viscosity or preparing the sample in a rigid matrix, the quenching pathway is turned off as the dynamic planarization of the phenyl groups is hindered. This effect is demonstrated in Figure 5a: as solvent viscosity increases, the relative PL intensity also increases. Moreover, the comparison of TPC and TPCb prepared in the solution and matrix shows that only the TPC matrix is brightly emissive (Figure 5b). Previously, this class of [3]-cumulenes was categorized and studied for AIE properties that are analogous to the similar tetraphenylethylene family, albeit with the notable exception of TPC. Our result demonstrates that TPC likewise can exhibit this enhancement, and aggregation is not necessary for changing the emission of these molecules [31].
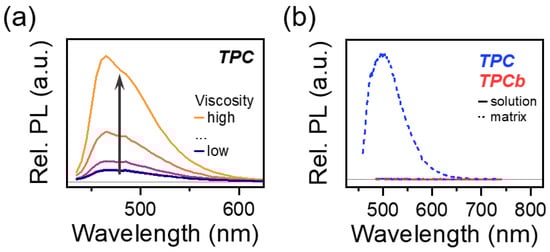
Figure 5.
(a) TPC relative PL intensity as solution viscosity is increased. Viscosity was varied by changing the ratio of toluene to paraffin oil while the concentration of TPC or TPCb was kept at a constant 0.01 mg/mL. (b) Relative PL intensity comparison for TPC and TPCb samples prepared in dilute solution and as polymer matrices.
5. Conclusions
The excited state quenching mechanism for TPC has been unresolved for decades. By using TA spectroscopy in a wide range of conditions (solution vs. matrix, solvent viscosity, and solvent polarity), we have identified the quenching mechanism to be the planarization of the phenyl groups. Quenching occurs on a picosecond timescale and could either occur through a conical intersection or other vibronic mechanisms due to its fast nature and coordination with intramolecular motion. The previously described excited state cumulene bond rotation still occurs but does not play a major role in quenching. Because TPC has a significant conformational disorder in the ground state, we are also able to control the excited state lifetime, thus turning on its PL. Samples prepared in higher viscosity or more rigid environments have brighter emissions that are unrelated to intermolecular aggregation, as described in previous works. The insight gathered here shows how the PL for [3]-cumulenes can be turned on through simple conformational control. In the future, controlling molecular conformation more carefully by employing covalent or metal–organic frameworks or even through end group functionalization could be useful. Building on this model, we suggest that future photochemical applications of such cumulenes that depend on bright emission or enhanced singlet lifetimes—sensing, photocatalysis, or even light harvesting such as singlet fission—should most beneficially focus on derivatives with bulky phenyl substituents that prevent planarization.
Supplementary Materials
The following supporting information can be downloaded at https://www.mdpi.com/article/10.3390/photochem4010008/s1. Additional information about materials synthesis, calculations, and further spectroscopic measurements [30,45,47,48]. Figures S1–S24; Tables S1–S11. Figure S1: Synthesis of 1,1,4,4,-tetraphenylbut-2-yne-1,4-diol. Figure S2: Synthesis of TPC. Figure S3: 1H NMR (400 MHz, CDCl3) and 13C NMR (101 MHz, CDCl3) spectra of TPC. Figure S4: Synthesis of 9-ethynyl-9H-fluoren-9-ol. Figure S5: Synthesis of 9-(2-(9-Hydroxy-9H-fluoren-9-yl)ethynyl)-9H-fluoren-9-ol. Figure S6: Synthesis of TPCb. Figure S7: 1H NMR (400 MHz, CDCl3) spectra of TPCb. Table S1: Optimized TPC geometry on the S0 potential energy surface. Figure S8: Visualization of the S0 TPC structure from Table S1. Table S2: Definition of phenyl group torsion angles for TPC based on Figure S8. Table S3: TDDFT first and second vertical transition energies for TPC as all phenyl groups are rotated symmetrically by the same amount (α = β = γ = δ). Table S4: TDDFT first and second vertical transition energies for TPC as one phenyl group is rotated (α) and the others are fixed at the optimized value of ~32°. Figure S9: Ground state potential energy curve for rotation of one phenyl group (torsion angle α) on TPC as the others are fixed at the optimized value of ~32°. Table S5: TDDFT first vertical transition energies for TPC as cumulene twist angle is varied. All other angles are held constant. Twist angle is defined as the dihedral angle between atoms 5, 16, 27, and 33. Figure S10: Ground state potential energy curve for cumulene bond twisting in TPC. Table S6: Optimized TPC geometry on the S1 potential energy surface. Figure S11: Visualization of the S1 TPC structure from Table S1. Figure S12: Excited state potential energy curve for cumulene bond twisting in TPC. Twist angle is defined similarly to the ground state as the dihedral angle between atoms 5, 16, 27, and 33. Table S7: Optimized TPCb geometry on the S0 potential energy surface. Figure S13: Visualization of the S0 TPCb structure from Table S7. Figure S14: Ground state and excited state potential energy curves for cumulene bond twisting in TPCb. Twist angle is defined equivalently to TPC. Figure S15: Comparison of time averaged TA spectra for 0.01 mg/mL TPC (a) and TPCb (b) in toluene along with their absorbance, first derivative of absorbance, and PL spectra. Table S8: Extracted time constants from exponential fitting of TPC solution and matrix. Time constants are in units of picoseconds and amplitudes are given in parentheses. Table S9: Extracted time constants from exponential fitting of TPCb solution and matrix. Time constants are in units of picoseconds and amplitudes are given in parentheses. Figure S16: Full viscosity dependent TA spectra for TPC and TPCb. Samples of low, medium-low, medium-high, and high viscosity were measured and compared with polymer matrix data in Figure 4. Figure S17: TA spectra for TPC prepared in various solvents. Toluene data is presented in Figure 2. Figure S18: TA spectra for TPCb prepared in various solvents. Toluene data is presented in Figure 3. Figure S19: Representative kinetics extracted from solvent dependent TA data. Figure S20: TA data for TPC under red- (a and b) and blue-edge (c and d) excitation. Figure S21: 730 nm kinetics for TPC matrix and dilute solution (b) under red- and blue-edge excitation. Table S10: Extracted time constants from exponential fitting of TPC under red- and blue-edge excitation. Figure S22: TA data for TPCb under red- (a and b) and blue-edge (c and d) excitation. Figure S23: 710 nm kinetics for TPC matrix and dilute solution (b) under red- and blue-edge excitation. Table S11: Lifetimes from Tables S7 and S8 (670–750 nm) converted to rate constants in units of ps−1. Figure S24: S1 PIA peak position (converted to eV) tracked over time in both TPC and TPCb solutions and matrices.
Author Contributions
D.B. and J.C. prepared samples and carried out spectroscopic measurements. Y.L. synthesized materials. T.K. performed calculations. D.B. wrote the original manuscript and created figures. A.J.M. edited the manuscript and figures with additional input from the other authors. P.J.M. and A.J.M. supervised the project. All authors have read and agreed to the published version of the manuscript.
Funding
Cornell Atkinson Center for Sustainability (D.B., J.C., and T.K.). The College of Arts and Sciences at Cornell University (D.B., J.C., T.K., and A.J.M.). Alfred P. Sloan Foundation (A.J.M.). National Institute of General Medical Sciences of the National Institutes of Health R35GM138165 (Y.L., P.J.M.). Camille and Henry Dreyfus Foundation TC-23-048 (P.J.M.).
Data Availability Statement
The data presented in this study are available upon request from the corresponding author.
Acknowledgments
This work made use of the Cornell Center for Materials Research Shared Facilities, which is supported through the NSF MRSEC program (DMR-1719875).
Conflicts of Interest
The authors declare no conflicts of interest.
References
- Brand, K. Über Untersuchungen in der Tetraarylbutan-Reihe und Über Das 1.1 4.4-Tetraphenyl-Butatrien. (4. Mitteilung Über die Reduktion Organischer Halogen-Verbindungen.). Berichte Dtsch. Chem. Ges. A B Ser. 1921, 54, 1987–2006. [Google Scholar] [CrossRef]
- Tammann, G. Über Kohlenstoff, der Bei der Einwirkung von Quecksilber Auf CCl4, CBr4 Und CJ4 Entsteht. Z. Anorg. Allg. Chem. 1921, 115, 145–158. [Google Scholar] [CrossRef]
- Januszewski, J.A.; Tykwinski, R.R. Synthesis and Properties of Long [n]Cumulenes (n ≥ 5). Chem. Soc. Rev. 2014, 43, 3184–3203. [Google Scholar] [CrossRef] [PubMed]
- Banhart, F. Chains of Carbon Atoms: A Vision or a New Nanomaterial? Beilstein J. Nanotechnol. 2015, 6, 559–569. [Google Scholar] [CrossRef] [PubMed]
- Bryce, M.R. A Review of Functional Linear Carbon Chains (Oligoynes, Polyynes, Cumulenes) and Their Applications as Molecular Wires in Molecular Electronics and Optoelectronics. J. Mater. Chem. C 2021, 9, 10524–10546. [Google Scholar] [CrossRef]
- Casari, C.S.; Milani, A. Carbyne: From the Elusive Allotrope to Stable Carbon Atom Wires. MRS Commun. 2018, 8, 207–219. [Google Scholar] [CrossRef]
- Casari, C.S.; Tommasini, M.; Tykwinski, R.R.; Milani, A. Carbon-Atom Wires: 1-D Systems with Tunable Properties. Nanoscale 2016, 8, 4414–4435. [Google Scholar] [CrossRef] [PubMed]
- Jin, C.; Lan, H.; Peng, L.; Suenaga, K.; Iijima, S. Deriving Carbon Atomic Chains from Graphene. Phys. Rev. Lett. 2009, 102, 205501. [Google Scholar] [CrossRef]
- La Torre, A.; Botello-Mendez, A.; Baaziz, W.; Charlier, J.-C.; Banhart, F. Strain-Induced Metal–Semiconductor Transition Observed in Atomic Carbon Chains. Nat. Commun. 2015, 6, 6636. [Google Scholar] [CrossRef]
- Zang, Y.; Fu, T.; Zou, Q.; Ng, F.; Li, H.; Steigerwald, M.L.; Nuckolls, C.; Venkataraman, L. Cumulene Wires Display Increasing Conductance with Increasing Length. Nano Lett. 2020, 20, 8415–8419. [Google Scholar] [CrossRef]
- Wang, M.; Lin, S. Ballistic Thermal Transport in Carbyne and Cumulene with Micron-Scale Spectral Acoustic Phonon Mean Free Path. Sci. Rep. 2015, 5, 18122. [Google Scholar] [CrossRef] [PubMed]
- Scaccabarozzi, A.D.; Milani, A.; Peggiani, S.; Pecorario, S.; Sun, B.; Tykwinski, R.R.; Caironi, M.; Casari, C.S. A Field-Effect Transistor Based on Cumulenic Sp-Carbon Atomic Wires. J. Phys. Chem. Lett. 2020, 11, 1970–1974. [Google Scholar] [CrossRef] [PubMed]
- Pecorario, S.; Scaccabarozzi, A.D.; Fazzi, D.; Gutiérrez-Fernández, E.; Vurro, V.; Maserati, L.; Jiang, M.; Losi, T.; Sun, B.; Tykwinski, R.R.; et al. Stable and Solution-Processable Cumulenic Sp-Carbon Wires: A New Paradigm for Organic Electronics. Adv. Mater. 2022, 34, 2110468. [Google Scholar] [CrossRef] [PubMed]
- Hendon, C.H.; Tiana, D.; Murray, A.T.; Carbery, D.R.; Walsh, A. Helical Frontier Orbitals of Conjugated Linear Molecules. Chem. Sci. 2013, 4, 4278–4284. [Google Scholar] [CrossRef]
- Garner, M.H.; Hoffmann, R.; Rettrup, S.; Solomon, G.C. Coarctate and Möbius: The Helical Orbitals of Allene and Other Cumulenes. ACS Cent. Sci. 2018, 4, 688–700. [Google Scholar] [CrossRef]
- Gunasekaran, S.; Venkataraman, L. Tight-Binding Analysis of Helical States in Carbyne. J. Chem. Phys. 2020, 153, 124304. [Google Scholar] [CrossRef]
- Lai, Y.; Halder, A.; Kim, J.; Hicks, T.J.; Milner, P.J. Electroreductive Radical Borylation of Unactivated (Hetero)Aryl Chlorides Without Light by Using Cumulene-Based Redox Mediators. Angew. Chem. Int. Ed. 2023, 62, e202310246. [Google Scholar] [CrossRef]
- Hirao, Y.; Ihara, K.; Ishibashi, Y.; Tiu, E.G.; Asahi, T.; Kubo, T. Mechanism and Kinetics of Fluorescence Quenching of Fluorene-Endcapped Butatriene: A Microspectroscopic Study of the Discrete State Constructed in Microcrystals. J. Phys. Chem. C 2022, 126, 1196–1203. [Google Scholar] [CrossRef]
- Hirao, Y.; Daifuku, Y.; Ihara, K.; Kubo, T. Spin–Spin Interactions in One-Dimensional Assemblies of a Cumulene-Based Singlet Biradical. Angew. Chem. 2021, 133, 21489–21496. [Google Scholar] [CrossRef]
- Messelberger, J.; Grünwald, A.; Pinter, P.; Hansmann, M.M.; Munz, D. Carbene Derived Diradicaloids—Building Blocks for Singlet Fission? Chem. Sci. 2018, 9, 6107–6117. [Google Scholar] [CrossRef]
- Morris, V.R.; Pollack, S.K. Singlet−Triplet Gap in 1,2,3-Butatriene and Its Consequences on the Mechanism of Its Spontaneous Polymerization. J. Phys. Chem. B 1998, 102, 5042–5046. [Google Scholar] [CrossRef]
- Wang, Z.-Y.; Zhu, R. Conjugated [5]Cumulene Polymers Enabled by Condensation Polymerization of Propargylic Electrophiles. J. Am. Chem. Soc. 2023, 145, 23755–23763. [Google Scholar] [CrossRef] [PubMed]
- Gu, X.; Kaiser, R.I.; Mebel, A.M. Chemistry of Energetically Activated Cumulenes—From Allene (H2CCCH2) to Hexapentaene (H2CCCCCCH2). ChemPhysChem 2008, 9, 350–369. [Google Scholar] [CrossRef] [PubMed]
- Kabaciński, P.; Marabotti, P.; Fazzi, D.; Petropoulos, V.; Iudica, A.; Serafini, P.; Cerullo, G.; Casari, C.S.; Zavelani-Rossi, M. Disclosing Early Excited State Relaxation Events in Prototypical Linear Carbon Chains. J. Am. Chem. Soc. 2023, 145, 18382–18390. [Google Scholar] [CrossRef] [PubMed]
- Wrobel, R.; Sander, W.; Cremer, D.; Kraka, E. Photochemistry of Butatriene—Spectroscopic Evidence for the Existence of Allenylcarbene. J. Phys. Chem. A 2000, 104, 3819–3825. [Google Scholar] [CrossRef]
- Cremer, D.; Kraka, E.; Joo, H.; A. Stearns, J.; S. Zwier, T. Exploration of the Potential Energy Surface of C4H4 for Rearrangement and Decomposition Reactions of Vinylacetylene: A Computational Study. Part I. Phys. Chem. Chem. Phys. 2006, 8, 5304–5316. [Google Scholar] [CrossRef] [PubMed]
- Connors, R.E.; Mochel, J.; Chynwat, V. Electronic Absorption Spectrum of 1,1,4,4-Tetraphenylbutatriene. J. Phys. Chem. 1988, 92, 1792–1793. [Google Scholar] [CrossRef]
- Ermer, S.P.; Lovejoy, S.M.; Leung, D.S.; Altman, J.C.; Aron, K.P.; Spitzer, R.C.; Hansen, G.A. Synthesis and Evaluation of Cumulenes: Novel Rigid Nonlinear Optical Molecules. In Proceedings of SPIE 1337, Nonlinear Optical Properties of Organic Materials III. Proceedings of the 34th Annual International Technical Symposium on Optical and Optoelectronic Applied Science and Engineering, San Diego, CA, USA, 8–13 July 1990; Khanarian, G., Ed.; SPIE: Bellingham, WA, USA, 1990; p. 89. [Google Scholar]
- Chynwat, V.; Coffin, T.L.; Wang, H.; Connors, R.E. Excited Electronic States of Arylbutatrienes. J. Phys. Chem. 1996, 100, 5217–5223. [Google Scholar] [CrossRef]
- Connors, R.E.; Chynwat, V.; Clifton, C.H.; Coffin, T.L. Temperature Dependence of Aryl Butatriene Fluorescence: Barrier to Twisting on S 1 for 1,1,4,4-Tetraphenylbutatriene. J. Mol. Struct. 1998, 443, 107–113. [Google Scholar] [CrossRef]
- Jiménez, V.G.; Tapia, R.; Medel, M.A.; Mariz, I.F.A.; Ribeiro, T.; Blanco, V.; Cuerva, J.M.; Maçôas, E.; Campaña, A.G. Aggregation-Induced Emission of [3]Cumulenes Functionalized with Heptagon-Containing Polyphenylenes. Chem. Commun. 2018, 54, 3359–3362. [Google Scholar] [CrossRef]
- Neese, F. The ORCA Program System. WIREs Comput. Mol. Sci. 2012, 2, 73–78. [Google Scholar] [CrossRef]
- Neese, F. Software Update: The ORCA Program System—Version 5.0. WIREs Comput. Mol. Sci. 2022, 12, e1606. [Google Scholar] [CrossRef]
- Lehtola, S.; Steigemann, C.; Oliveira, M.J.T.; Marques, M.A.L. Recent Developments in Libxc—A Comprehensive Library of Functionals for Density Functional Theory. SoftwareX 2018, 7, 1–5. [Google Scholar] [CrossRef]
- Becke, A.D. Density-functional Thermochemistry. III. The Role of Exact Exchange. J. Chem. Phys. 1993, 98, 5648–5652. [Google Scholar] [CrossRef]
- Lee, C.; Yang, W.; Parr, R.G. Development of the Colle-Salvetti Correlation-Energy Formula into a Functional of the Electron Density. Phys. Rev. B 1988, 37, 785–789. [Google Scholar] [CrossRef] [PubMed]
- Weigend, F.; Ahlrichs, R. Balanced Basis Sets of Split Valence, Triple Zeta Valence and Quadruple Zeta Valence Quality for H to Rn: Design and Assessment of Accuracy. Phys. Chem. Chem. Phys. 2005, 7, 3297–3305. [Google Scholar] [CrossRef] [PubMed]
- Neese, F.; Wennmohs, F.; Hansen, A.; Becker, U. Efficient, Approximate and Parallel Hartree–Fock and Hybrid DFT Calculations. A ‘Chain-of-Spheres’ Algorithm for the Hartree–Fock Exchange. Chem. Phys. 2009, 356, 98–109. [Google Scholar] [CrossRef]
- Stoychev, G.L.; Auer, A.A.; Neese, F. Automatic Generation of Auxiliary Basis Sets. J. Chem. Theory Comput. 2017, 13, 554–562. [Google Scholar] [CrossRef] [PubMed]
- Grimme, S. A Simplified Tamm-Dancoff Density Functional Approach for the Electronic Excitation Spectra of Very Large Molecules. J. Chem. Phys. 2013, 138, 244104. [Google Scholar] [CrossRef] [PubMed]
- Hanwell, M.D.; Curtis, D.E.; Lonie, D.C.; Vandermeersch, T.; Zurek, E.; Hutchison, G.R. Avogadro: An Advanced Semantic Chemical Editor, Visualization, and Analysis Platform. J. Cheminform. 2012, 4, 17. [Google Scholar] [CrossRef]
- Lenzer, T.; Ehlers, F.; Scholz, M.; Oswald, R.; Oum, K. Assignment of Carotene S* State Features to the Vibrationally Hot Ground Electronic State. Phys. Chem. Chem. Phys. 2010, 12, 8832–8839. [Google Scholar] [CrossRef] [PubMed]
- Grilj, J.; Laricheva, E.N.; Olivucci, M.; Vauthey, E. Fluorescence of Radical Ions in Liquid Solution: Wurster’s Blue as a Case Study. Angew. Chem. Int. Ed. 2011, 50, 4496–4498. [Google Scholar] [CrossRef] [PubMed]
- Johnston, D.C. Stretched Exponential Relaxation Arising from a Continuous Sum of Exponential Decays. Phys. Rev. B 2006, 74, 184430. [Google Scholar] [CrossRef]
- Zang, Y.; Zou, Q.; Fu, T.; Ng, F.; Fowler, B.; Yang, J.; Li, H.; Steigerwald, M.L.; Nuckolls, C.; Venkataraman, L. Directing Isomerization Reactions of Cumulenes with Electric Fields. Nat. Commun. 2019, 10, 4482. [Google Scholar] [CrossRef]
- Bühringer, M.U.; Padberg, K.; Phleps, M.D.; Maid, H.; Placht, C.; Neiss, C.; Ferguson, M.J.; Görling, A.; Tykwinski, R.R. Double Bonds? Studies on the Barrier to Rotation about the Cumulenic C=C Bonds of Tetraaryl[n]Cumulenes (N = 3, 5, 7, 9). Angew. Chem. Int. Ed. 2018, 57, 8321–8325. [Google Scholar] [CrossRef]
- Kerisit, N.; Gawel, P.; Levandowski, B.; Yang, Y.-F.; García-López, V.; Trapp, N.; Ruhlmann, L.; Boudon, C.; Houk, K.N.; Diederich, F. A Four-Step Synthesis of Substituted 5,11-Dicyano-6,12-Diaryltetracenes with Enhanced Stability and High Fluorescence Emission. Chem. Eur. J. 2018, 24, 159–168. [Google Scholar] [CrossRef]
- Dahl, B.J.; Mills, N.S. Antiaromatic Spacer-Bridged Bisfluorenyl Dications Generated by Superacid Induced Ionization. J. Am. Chem. Soc. 2008, 130, 10179–10186. [Google Scholar] [CrossRef]

Disclaimer/Publisher’s Note: The statements, opinions and data contained in all publications are solely those of the individual author(s) and contributor(s) and not of MDPI and/or the editor(s). MDPI and/or the editor(s) disclaim responsibility for any injury to people or property resulting from any ideas, methods, instructions or products referred to in the content. |
© 2024 by the authors. Licensee MDPI, Basel, Switzerland. This article is an open access article distributed under the terms and conditions of the Creative Commons Attribution (CC BY) license (https://creativecommons.org/licenses/by/4.0/).