Abstract
Short-time thermal exchange (0–20 s) between human skin and textile surfaces determines initial warm–cool sensations, which influences comfort perception. Classical Fourier models predicting a √t cannot fully describe this early transient phase, particularly for porous or heterogeneous materials such as fabrics. This study investigates the early and short-time temperature response of a fingertip to contact with eight woven and knitted fabrics of different compositions, densities, thermal resistances, and thicknesses, measured under controlled laboratory conditions using a fine-gauge thermocouple at the skin–fabric interface. Experimental temperature–time data, when converted to the Laplace domain, exhibited slopes corresponding to time-domain exponents of t⅙, t¼, and occasionally t⅒, all lower than the classical diffusion exponent of ½.The dual-phase lag (DPL) model was applied to interpret these deviations through two lag times—τq (heat flux) and τT (temperature gradient)—and their ratio Z = τT/τq, which controls the slope of the Laplace-domain response. DPL curves reproduced the observed exponents without additional empirical parameters. The results show that short-time heat transfer depends strongly on textile structure: higher thickness leads to slower transient responses (“warmer” feel), whereas denser fabrics promote faster equilibration (“cooler” feel). This dual-phase interpretation bridges physical heat transfer with tactile thermal perception, providing a predictive framework for the design of textiles with thermal properties.
1. Introduction
The thermal perception of textiles against human skin plays a crucial role in determining consumer preference and their comfort, particularly during the initial contact of human skin with a fabric [1,2,3,4]. This tactile thermal interaction—often referred to as the haptic perception of temperature—is governed by the transient heat transfer between two heterogeneous materials: human skin and textiles [2,5].
The sensation experienced during this short-term contact, often within the first few seconds, forms the foundation of a consumer’s first impression of a textile product [4]. In many purchasing contexts, particularly where touch is involved (such as apparel or bedding), the way a fabric feels—cool, warm, dry, or damp—can influence the decision to buy or not to buy [3,4]. Studies show that thermal comfort is one of the most important predictors of textile acceptability, as well as in sportswear and everyday clothing, where both psychological and physiological responses to temperature are relevant [3,6,7]. This perception-related dimension encompasses thermal, tactile, and even emotional elements [8,9], reflecting an individual’s response to how a fabric interacts with their body [4,5].
Fabrics’ thermal features can be measured objectively using instruments such as Kawabata Evaluation System KES F7 Thermo Labo [10] and subjectively using the Fabric Hand Subjective Evaluation procedure [11]. In the case of empirical studies, placing a thermocouple directly between fabric and skin allows for monitoring how temperature changes when a human fingertip, usually at a temperature around 31 °C [4,12] comes into contact with a cooler textile (measured in standard laboratory temperature conditions are 21 °C) [2,12]. This measurable transient thermal profile provides insights into how heat is transferred between the two materials and, by extension, how “cool” or “warm” the fabric may feel against the skin [9,11,12].
Accurate thermal skin–fabric interface models can serve as a bridge between subjective human sensations and objective physical measurements, enabling the quantification of how human skin may thermally perceive fabrics. This quantification is vital for predicting and enhancing the thermal comfort of textiles, ensuring that they meet the physiological needs of users. Incorporating thermal modelling into textile design allows engineers to predict a fabric’s thermal behaviour before its production [13,14]. On the level of the fabric’s materials and construction, factors such as raw materials, spinning technology of yarns, yarn density, yarn arrangement, and chemical and mechanical finishes collectively impact fabrics’ thermal characteristics. Collectively, it encompasses the following physical parameters of fabrics: (a) thermal diffusivity (indicates how quickly a fabric transfers heat; higher values = cooler sensation); [13,14,15] (b) thermal resistance (measures insulation or resistance to heat flow; higher values = warmer fabric) [16,17]; (c) heat flux or maximum heat flux (Qmax) (indicates initial cool/warm feeling upon skin contact; higher Qmax = cooler touch) [18]; (d) thermal absorptivity (correlates with warm/cool sensation at first touch; lower value = warmer sensation) [7,19,20]; (e) heat transfer coefficient (total rate of heat transfer through the fabric; it is used in comparative thermal studies and modelling) [21]; (f) specific heat capacity (measures heat required to raise temperature of fabric by 1 °C, which is important in performance/technical textiles) [21,22]; and (g) surface temperature distribution (visual map of heat spread across fabric surface [23,24].
In the development of functional textiles, modelling heat and mass transfer properties is crucial for ensuring that garments provide adequate insulation and breathability [22,25,26]. Furthermore, as textiles evolve into smart and functional materials, understanding heat transfer mechanisms becomes increasingly important. Advanced thermoregulatory textiles, designed to manipulate heat transport and storage, rely on precise thermal models to function effectively, drifting towards personal thermal management, which is a holistic approach to offering thermal comfort to humans wearing clothing [22,27,28]. These models inform the development of fibres and fabrics that can adapt to environmental conditions, providing personalised thermal management without the need for external energy sources. By accurately modelling heat transfer dynamics prior to the mass production of clothing, especially during the initial contact between fabric and skin, manufacturers can optimise the first impression of textiles. This would lead to improved marketability and user experience [22,25,28,29]. However, mathematical modelling of this thermal behaviour, without mass transportation, encompasses both the human skin and textiles, and is not straightforward. Traditional approaches based on classical Fourier heat conduction theory assume that heat propagates with infinite speed and follows a predictable square-root time dependency (T ∝ √t), at least for short times. However, during the first seconds after contact, the coupled skin–textile system consists of at least two heterogeneous media (skin tissue with blood perfusion and textile fibres with entrapped air), which often causes deviations from the √t prediction.
While this may be suitable for homogeneous solids observed over longer periods of time, it is insufficient for porous, dual-phase materials like textiles or biological systems such as skin, particularly during short time periods [30,31].
To overcome these limitations, researchers have turned to the Dual-Phase Lag (DPL) [30,31,32,33] approach, which incorporates two independent time delays:
(a) τq, the lag of heat flux in response to a temperature gradient [30,31,32,33];
(b) τT, the lag of the temperature gradient in response to a heat flux [34,35].
This model is suitable for materials like woven or knitted fabrics that exhibit both solid (fibres) and porous (air) phases, as well as for biological materials like human skin, where tissue and blood flow create internal thermal lags [2,30,31,32,33,34,35,36,37,38]. These systems often display anomalous conduction behaviour where the temperature follows a power-law dependency T ∝ tα, with α ≠ 0.5—highlighting the inadequacy of classical models for short-duration events.
The goals of this study are to (a) apply the dual-phase approach to model the results and extract meaningful parameters in the initial short period of contact (0–20 s); (b) experimentally capture short-time temperature profiles using a precise thermocouple setup; and (c) analyse differences across a variety of textile structures.
Through this investigation, the study aims to build a bridge between objective thermal measurements and subjective comfort perception, offering a tool for the design of thermal characteristics of textiles, including high-performance materials, wearables, and next-generation smart materials.
2. Theoretical Approach
To establish a baseline, one can consider classical heat conduction in a semi-infinite solid subjected to a constant heat flux step at the free surface. The boundary condition for a constant heat flux per unit area applied at x = 0 is as follows:
where u(t) is the unit step function and p0 is the applied heat flux amplitude.
This can be expressed in terms of the standard semi-infinite solution [12,16,36,37]:
where a = k/cv is the thermal diffusivity, k is the thermal conductivity, cv is the specific heat capacity, and p0 is the power per unit area applied at the free surface. The result of (2) shows the well-known square-root dependence on time, T ∝ √t, predicted by classical Fourier heat conduction. One will find that cv = ϱ cp, where ϱ is the density and cp the specific heat capacity per unit mass. The relation T ∝ √t is also valid for bodies with different geometries but only for sufficiently short periods. Equation (2) is also used in specialised equipment to measure the product kcv of solid materials.
If a heat pulse is used as the heat source, the temperature behaviour turns out to be
Equation (3) can be easily found by taking the time derivative of (2). The reason for the widespread use of the √t relationship is that it is an exact analytical solution for a half-infinite medium. The time-dependent heat transfer equation in the one-dimensional case is as follows:
The fundamental solution of (4) is in the following form:
Equation (4) is known as the diffusion equation. Equation (5) is the solution for a single heat pulse in space and time, i.e., in the origin x = y = z = 0 and t = 0. Equation (5) is known as the fundamental solution or the Green’s function of (4). In the origin (x = 0), a temperature decay of the form T ∝ 1/√t is found. If a power step is applied instead of a pulse, integrating T ∝ 1/√t with respect to time yields T ∝ √t.
As a consequence, the √t has been considered as a fundamental law. Any time a √t behaviour is observed, the conclusion is that one is dealing with a time-dependent heat conduction problem or, more generally, with a diffusion phenomenon.
Over the last two decades, several experimental studies have concluded that the behaviour of √t no longer has a universal value. Instead, a tα relationship was measured where α ≠ 1/2. These experimental observations were mainly found in porous and amorphous materials. In porous materials, two phases are involved, and the heat transfer Equation (6) has to be adequately modified to reflect the dual-phase phenomenon.
In other studies [17,39], mathematical analysis is based on fractal geometry of the percolation network, i.e., how the heat-conducting paths in the material are connected. A tα relation could be proved where α depends on the fractal dimension of the structure. An overview of these topics, especially macroscale heat transfer, was provided by Tzou [30]. These macroscale phenomena are only observed for sufficiently short periods, and after longer periods, all materials follow √t, indicating that the classical heat transfer equation can be used for modelling.
Textiles are considered porous, non-homogeneous objects. Not only are there empty spaces in between threads of yarn, but also yarn being composed of many fibres creates spaces filled with air, hence the dual-phase approach (textiles and air). A fingertip is also a dual-phase material due to the different properties of the tissues composing the fingertip, such as the epidermis, dermis, and hypodermis (solid) and blood (liquid).
The initial experimental approach presenting the transient temperature between a fingertip and a fabric was published previously [18]. The goal of this study was to learn how textiles feel when they are in contact with the human body. These kinds of feelings are very subjective and difficult to quantify. Therefore, we have chosen to measure the temperature variation at the interface between a textile fabric and a human finger. Temperature can be measured with sufficient accuracy, and this contact temperature can also be associated with the feeling (perception) of a piece of textile. After touching a fabric for too long, the initial sensation dissipates. Therefore, transient temperature measurements have been performed.
In the present paper, short time measurements (0 < t < 20 s) are studied.
3. Materials and Methods
3.1. Materials
Eight fabrics were selected to represent a range of textile structures and raw materials, ensuring that their thermal behaviour could be systematically compared under identical experimental conditions. The samples included both knitted and woven fabrics composed of natural and synthetic fibres (e.g., wool, cotton, linen, polyester, and Lycra), as well as some of their blends. The selection aimed to encompass fabrics known for distinctly different tactile thermal sensations—from warm, bulky structures to thinner and cooler-feeling textiles—which were tested earlier. The thermal sensation of these fabrics was examined in the previous study [4,18]. It was established that the 100% angora wool knitted fabric provided the warmest tactile sensation, being perceived as very warm by nearly all participants and showing the highest thermal resistance among tested samples. On the opposite end of the spectrum, the 65% linen/35% cotton woven fabric and the 100% polyester (Outlast) fabric demonstrated the coolest tactile sensations, associated with the lowest thermal resistance and highest heat flux at skin–fabric contact. Intermediate sensations were observed for cotton and blended fabrics such as 70% wool/20% linen/10% cotton and 60% linen/40% cotton, while the 97% cotton/3% Lycra knitted fabric showed moderate warmth due to its higher thickness and elasticity.
The fabrics were preconditioned under standard atmospheric conditions for textile testing (20 ± 2 °C and 65 ± 5% relative humidity) prior to measurements. The physical characteristics of the samples—including their raw material composition, structural type, mass per unit area, thickness, and thermal resistance—are summarised in Table 1.

Table 1.
Selected physical and thermal characteristics of the investigated fabrics.
Table 1.
Selected physical and thermal characteristics of the investigated fabrics.
| Reference to Figure no. | Figure 1a | Figure 1b | Figure 1c | Figure 1d | Figure 1e | Figure 1f | Figure 1g | Figure 1h |
|---|---|---|---|---|---|---|---|---|
| Raw Materials | 100% Angora Wool | 100% Polyester (PET) | 97% Cotton 3% Lycra | 100% Cotton | 65% Linen 35% Cotton | 70% Wool 20% Linen 10% Cotton | 60% Linen 40% Cotton | 70% Cotton 30% Linen |
| Symbol and Descriptor of the Fabric, if Used | ∆; Green | ∇;Outlast | ◊; Ecrue Fancy Yarn | ⁕; Beige | ○ | × | ● | +; Chenille |
| Weight [g/m2] | 305 | 180 | 255 | 225 | 354 | 559 | 400 | 466 |
| Thickness [mm] | 1.65 | 1.09 | 2.50 | 1.50 | 0.90 | 1.46 | 0.75 | 1.25 |
| Structure type | knitted | knitted | knitted | knitted | woven | woven | woven | woven |
| Stitch/weave type | single jersey | single jersey | single jersey | single jersey | complex | plain | complex | twill ½ Z |
| Fabric count [per 1 dm] | wale: 43 course: 67 | wale: 43 course: 67 | wale: 50 course: 66 | wale: 45 course: 62 | warp: 123 linen +248 cotton; weft: 64 linen 127 cotton | warp: 62 cotton +30 linen; weft: 50 wool +150 linen | warp: 210 cotton +160 linen; weft: 120 cotton +120 linen | warp: 140 cotton +140 linen; weft: 180 cotton + 50 cotton |
| Thermal resistance [m2 × °C/W)] | 0.0413 | 0.0259 | 0.0350 | 0.0368 | 0.0164 | 0.0289 | 0.0145 | 0.0235 |

Figure 1.
Representative images of the fabrics used in this study: (a) 100% angora wool (∆, green); (b) 100% polyester (PET) (∇, Outlast); (c) 97% cotton/3% Lycra (◊, ecru fancy yarn); (d) 100% cotton (⁕, beige); (e) 65% linen/35% cotton (○); (f) 70% wool/20% linen/10% cotton (×); (g) 60% linen/40% cotton (●); (h) 30% linen/70% cotton (+, chenille).
Each photograph was captured under uniform illumination and magnification to emphasise differences in texture, yarn architecture, and weave or knit pattern.
3.2. Weight of Fabrics
The mass per unit area of the fabrics was determined according to the standard [40]. Samples were conditioned for at least 24 h under standard atmospheric conditions before testing. Each specimen of 100 cm2 (10 × 10 cm) was weighed using a precision analytical balance (±0.001 g), and the mean value was calculated from five independent measurements. Results were expressed in grams per square metre [g/m2].
3.3. Thickness of Fabrics
Fabric thickness was measured following a relevant standard [41], using a digital thickness gauge equipped with a 10 mm diameter presser foot applying a pressure of 0.5 kPa. Each specimen was measured at five randomly selected points (avoiding yarn intersections), and the mean value was reported in millimetres (mm). All measurements were performed under standard testing conditions.
3.4. Thermal Resistance of Fabrics
The thermal resistance (Rₜ) of each fabric was measured using the guarded hot plate apparatus (NETZSCH Analyzing & Testing, Selb, Germany) following the standard [42]. During testing, each fabric was placed between a warm plate (35 ± 0.1 °C) and a cold plate (25 ± 0.1 °C). The temperature difference across the specimen and the energy required to maintain the steady-state temperature gradient were recorded. The thermal resistance was calculated based on the temperature difference between the plates (°C) and q—heat flux through the fabric (W/m2). Each measurement was repeated three times, and the mean value was expressed in m2 × °C/W. The instrument was calibrated using reference materials of known thermal resistance prior to testing.
4. Experimental Results
The experimental data for the modelling and analysis were obtained from the previous study [18]. In that study, a sample of fabric was put on a piece of polyurethane foam to provide sufficient thermal insulation. The role of the 55 mm thick foam was to minimise heat loss through the back of the fabric sample and ensure consistent boundary conditions; each textile specimen was mounted on it to be measured. The foam created a quasi-adiabatic boundary that restricted heat flow to a single dominant direction—from the fingertip through the fabric. This configuration ensured that the recorded temperature–time response represented the true transient heat transfer at the fingertip–fabric interface rather than being affected by substrate conduction. Also, in that initial study, only three types of fabrics were tested ((∆) knit 100% angora; (○) woven 65% linen + 35% cotton; and woven 70% wool + 20% linen + 10% cotton). The data from the short-time transient thermal behaviour measured for these three fabrics were used in the current study. In addition, the short-time transient thermal behaviour for five other fabrics was examined, and the collected data were used in the modelling in this current study. Figure 2 shows an experimental setup with the right-hand index fingertip of a 35-year-old female placed on a thermocouple connected to a voltmeter that records online changes in the temperature of the interface between a fabric sample placed on isolating foam and a fingertip. A thin nickel–chromium thermocouple was put on the fabric to record the temperature variation. This thermocouple generates a voltage of 36.8 µV/°C. Next, the finger was placed on the thermocouple in such a way that the thermocouple junction was at the centre of the fingertip. The fingertip used in all measurements belonged to a single individual, allowing full control over the repeatability of the contact procedure. Although the applied pressure was not directly quantified, the consistency of contact was ensured by maintaining the indentation of the polyurethane foam layer beneath the fabric, thermocouple, and fingertip within 3–4 mm. This approach provided a gentle, repeatable touch without squishing the fingertip, fabric, or thermocouple, ensuring stable and comparable contact conditions across all tested fabrics.
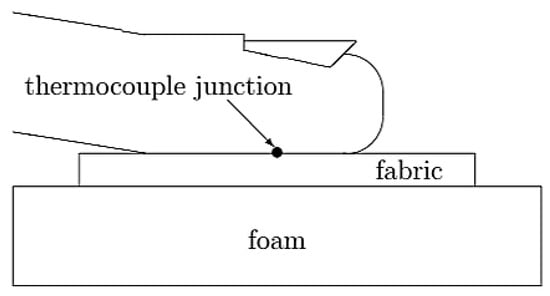
Figure 2.
Fingertip in contact with fabric; a nickel–chromium thermocouple between the fingertip and the fabric; a thermal insulator in the form of polyurethane foam.
The thermocouple junction was a small sphere with a diameter of 0.5 mm. Hence, it can be assumed that its size would not disturb the measurements. Once the finger made contact with the fabric, the temperature was recorded with an electronic voltage metre with a high input impedance of 10 MΩ. The temperature readout was evaluated every second. The starting time, t = 0, was exactly the moment the finger made contact with the fabric.
Figure 3 presents a typical, theoretical temperature plot versus time when a fingertip is in contact with a piece of fabric, as presented in Figure 2. The temperature rises for about 15–20 s followed by a continuous decrease.

Figure 3.
Transient temperature between a fingertip contacting a fabric. T (°C) denotes the temperature rise above the initial value; t represents time (s).
Note that the temperature rises until t ≈ 15 s, then decreases continuously. The decrease occurs because, after about 15 s, a large portion of the fingertip’s heat capacity has been used, causing the fingertip’s temperature to drop, as shown in Figure 3. However, in our experiments, we are focusing on the short-time behaviour, i.e., t < 15 s.
Eight different woven and knit fabrics were used in the experiment: woven 65% linen and 35% cotton fabric (○), woven coarse linen (●), thin woven chenille polyester fabric (×), Outlast® chenille polyester fabric (), 100% angora knitted fabric (∆), plain knitted polyester fabric in ecru colour (◊), plain knitted cotton fabric in beige colour (⁕), and thick woven chenille fabric (+). The measurements were performed for each fabric separately. The results of the measurements are presented in Figure 4. The character of the curves in Figure 4 resembles the curve from Figure 3.
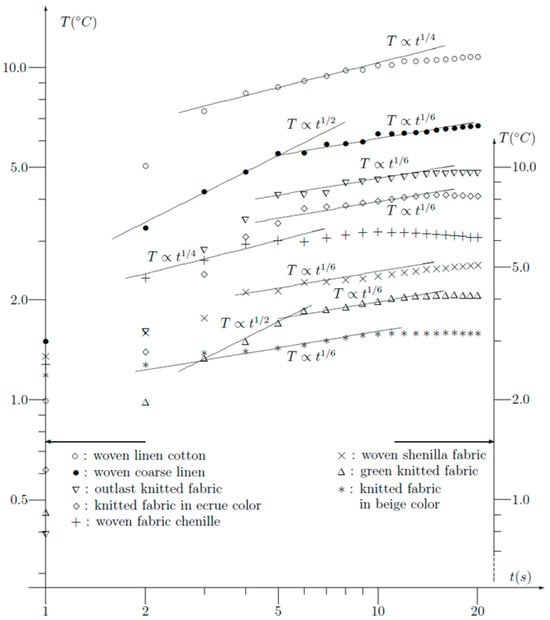
Figure 4.
Transient temperature of a fingertip in contact with different kinds of fabrics. T (°C) denotes the temperature rise above the initial value; t represents time (s).
To detect any kind of DPL, it is necessary to present all results in a double logarithmic plot, as presented in Figure 4.
The first observations are the remarkable differences between the different fabrics. Temperatures vary between 2 °C and 10 °C. A second observation is that fittings can be made of the shape tα. Most frequently, t1/6 is observed. Note that all values of the exponent α can be explained using the dual-phase model, which will be explained further on in this paper.
Two curves can be fitted to t1/2 at the very beginning, followed by t1/6 for larger values of time (woven coarse linen and green knitted fabric). First, a diffusion t1/2 followed by a dual-phase transient, and then once again, a diffusion is observed and described in the literature.
5. Mathematical Analysis—The Dual-Phase Lag (DPL) Model
To provide a theoretical explanation for the observed phenomena, one can propose applying the DPL model, which offers a physically grounded explanation. In many textbooks dealing with heat transfer, one finds the Fourier law (the one-dimensional case). In this formulation, T denotes temperature (°C) and t represents time (s). The term T(x,t) expresses the transient temperature field within the fingertip–fabric system as a function of position x and time t.
where q denotes the heat flux and T the temperature distribution. Conservation of energy is expressed by
where cv is the specific heat capacity. The combination of (6) and (7) yields
- Equation (8) is known as the diffusion equation. As pointed out, the diffusion equation can explain the exponent ½, but not the other values observed experimentally.
- In the dual-phase approach, the Fourier law Equation (6) is replaced by
Note that two delay times, τq and τT, have been inserted in (9). Using a Taylor series expansion, (7) is replaced by
And Equation (11) is converted to
which gives rise to the following equation for the temperature distribution after inserting (10):
The above equation has to be solved with the following boundary condition:
where u(t) denotes the unit step function.
Next, (13) is to convert the time-dependent terms to the Laplace domain:
or
where s is the Laplace variable. The boundary condition (14) in the Laplace domain is
Finally, the solution is given by
and with boundary x = 0 one receives
The relevant literature notes that the analytical inversion of Equation (19) into the time domain is not possible. The theoretical step response of the DPL model is illustrated in Figure 5 for a representative case where Z = τT/τq = 0.05. The plot presents the response in the Laplace domain, showing how the slope of the function changes with the variable s. In the intermediate region, the slope of approximately −7/6 corresponds to a t1/6 dependence in the time domain.

Figure 5.
Step response using the DPL model with Z = 0.05 vs. the Laplace variable s. In the middle part, a slope −7/6 is observed corresponding to t1/6 in the time domain.
However, such an inversion is not necessary. The theory can be verified entirely within the Laplace domain, which will largely simplify the mathematical analysis. To explain the slope (−1/6) observed in Figure 5, it is sufficient to consider the following Laplace transform.
where Γ is the Euler Gamma function. Note that Γ(7/6) = 0.928. It will be sufficient to make a plot of the following function:
where Z = τT/τq appears to be the dominating parameter according to Tzou [30]. For very small values of s (or t→∞) and also for very large values of s (or t→0), the function (21) can be approximated by 1/s3/2, which corresponds to √t in the time domain.
Figure 5 shows a plot of the function (19) for the value Z = τT/τq = 0.05. A double logarithmic plot was used for clarity. It turns out that in the interval 1 < s < 10, the plot can be fitted very well to a slope −7/6 or t1/6 in the time domain. It has been shown that the experimental results can be well explained using the dual-phase model for conduction heat transfer.
Other slopes can be explained similarly.
For high and low values of s—corresponding, respectively, to low and high values of time t—the plot in Figure 5 exhibits a slope of −3/2, which is characteristic of a diffusion process proportional to √t. Experimentally, the behaviour of √t was not observed at short times, as measurements commenced at 1 s. For a purely diffusive process, the penetration depth d can be estimated using the following empirical relationship [16,17,18]:
Using typical data for textile fabrics, k = 0.1 W/mK and cv =2 MJ/m3 K, one obtains after t = 10 s that d = 1.4 mm, which is smaller than the thickness of the fabric. In other words, the heat did not reach the back side of the fabric. In other words, the thicknesses of the fabrics, all of which were more than 2 mm, were not relevant to explaining the experiments.
6. Two Fingertips Making Contact
While the presented experiment and the theoretical approach (modelling) focus on two different materials, fingertip and textile fabrics, the thermal contact behaviour between two fingertips was examined as a reference for this study. Figure 4 demonstrates that the type of fabric influences the transient temperature behaviour. To assess whether the experiments might have been significantly affected by fingertip contact, the same experiment was repeated using two fingertips in contact with a thermocouple junction. The results, presented in Figure 6, show that the experimental data in this case could be fitted to t1/10. Notably, the exponent 1/10 was smaller than all exponent values observed in Figure 4. This suggests that the influence of the fingertip was less significant than that of the fabric itself.

Figure 6.
Transient temperature of two fingers making contact. A slope t1/10 is clearly visible. T (°C) denotes the temperature rise above the initial value; t represents time (s).
For the sake of completeness, a similar analysis as before was carried out, with the results shown in Figure 6. First, one needs to evaluate the Laplace transform of t1/10:
Figure 7 shows a plot of Equation (24) for a value Z = τT/τq = 0.01. It turns out that in the interval 0.5 < log(s) < 1.5, the plot is very well fitted to a slope of −11/10, which is equivalent to a function t1/10 in the time domain. At the same time, it has been proven that human tissues can be modelled using the dual-phase model.
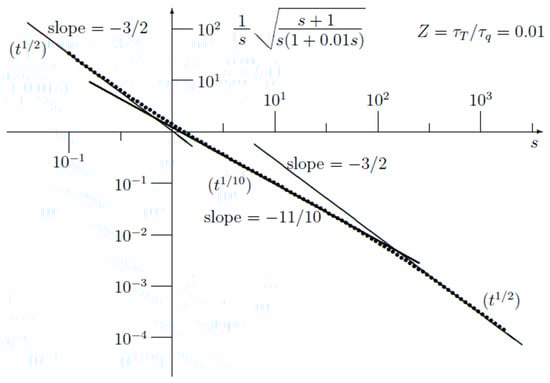
Figure 7.
Step response using the DPL model with Z = 0.01 vs. the Laplace variable s. In the middle part a slope −11/10 is observed, corresponding exactly to t1/10 in the time domain.
This statement holds for short time measurements. For larger values of the time, the classical diffusion theory can still be applied.
7. Discussion
The present findings align with our earlier work on the subjective and objective assessment of thermal haptic perception of textiles [4,18], in which knitted wool fabrics with higher contact thermal resistance and lower initial heat flux were consistently rated as “warm” or “very warm” by a human subjects, whereas smoother linen–cotton fabrics with higher initial heat flux were perceived as “neutral” to “cool.” In the current study, fabrics exhibiting smaller DPL exponents (α ≈ 1/6) demonstrated slower initial heat transfer, corresponding to the “warm” category in the previously published subjective assessments of selected fabrics. Conversely, fabrics with larger α values, indicating faster heat transfer to the textile, correlated with the “cooler” sensations previously reported. This consistency across independent experimental approaches supports the hypothesis that early-time transient temperature behaviour—quantified here through DPL analysis—can serve as a predictive indicator of perceived thermal comfort.
The slope values obtained from the DPL fits (t1/6, t1/4, and t1/10) can be interpreted as indicators of how quickly heat travels through the combined skin–fabric system. Smaller exponents, such as t1/6, correspond to slower initial heat transfer, which occurs when the contact thermal resistance is high due to greater air content in the fabric structure or a more discontinuous fibre–skin contact. In physical terms, the heat pathways are more tortuous and the solid–solid contact area is reduced, limiting the rate at which thermal energy leaves the fingertip. Fabrics with such behaviour typically correspond to “warm” sensations, as confirmed in our earlier study on subjective thermal haptic perception, where knitted wool fabrics with lower initial heat flux were rated as warm or very warm. Larger exponents, approaching t1/2, indicate faster initial heat transfer through more continuous conductive pathways in smoother, denser fabrics, which draw heat away from the skin rapidly and produce a cooler sensation. This correspondence between measured short-time transient behaviour and reported warm–cool feeling suggests that DPL parameters can be used as quantitative predictors of thermal comfort perception.
The thermal response described by the DPL model is closely related to measurable textile characteristics such as porosity, fabric density, and thickness. These structural parameters determine how heat travels through the fabric and therefore influence the time-dependent temperature changes observed at the fingertip–fabric interface.
Fabrics that contain a larger volume of entrapped air—hence higher porosity and lower bulk density—transfer heat more slowly. The air within the structure acts as an insulating medium, delaying the rise in temperature and producing a slower transient response that corresponds to a “warmer” tactile sensation. This effect is associated with longer temperature-gradient lag times within the DPL model. In contrast, denser fabrics with lower porosity and more continuous fibre contacts conduct heat more efficiently and reach temperature equilibrium more rapidly, producing a “cooler” feel and smaller lag times.
Fabric thickness also plays a major role because it defines the main heat-transfer path. Thicker fabrics delay the temperature rise and display higher thermal resistance, whereas thinner fabrics allow faster heat exchange. However, thickness does not act alone—it interacts with porosity and density to determine the overall rate of heat propagation through the fabric. Therefore, the DPL parameters that describe the short-time temperature evolution can be directly associated with the combined influence of the fabric’s thickness, compactness, and air content.
8. Conclusions
Short-time temperature measurements (0–20 s) of the interface between a fingertip’s skin and fabrics showed significant deviations from the classical √t transient predicted by Fourier’s law, confirming that standard diffusion models are insufficient for modelling the contact of textiles with human skin.
The DPL model successfully captured the observed phenomenon, with fitted exponents ranging from t1/6 to t1/4 for fabrics and t1/10 for fingertip–fingertip contact, which reflects the combined effects of fibre/yarn/fabric and air trapped in textile structures and the heterogeneity of the fingertip (skin tissue, fat, bones, and the blood).
The Laplace domain approach allowed for straightforward slope analysis without complex time-domain inversions, making it a practical tool for experimental–theoretical comparison.
The findings provide a quantitative basis for linking physical measurements to subjective thermal perception, enabling the design of textiles with tailored warm–cool sensations for applications from apparel to technical wear.
Author Contributions
Conceptualisation, G.D.M. and I.C.-W.; methodology, G.D.M. and I.C.-W.; validation, M.S., B.W., and G.D.M.; formal analysis, M.S., B.W., G.D.M., and I.C.-W.; investigation, C.H. and L.V.L.; data curation, G.D.M.; writing—original draft preparation, G.D.M. and I.C.-W.; writing—review and editing, G.D.M. and I.C.-W.; visualisation, G.D.M. All authors have read and agreed to the published version of the manuscript.
Funding
This research received no external funding.
Institutional Review Board Statement
Not applicable.
Data Availability Statement
The original contributions presented in this study are included in the article. Further inquiries can be directed to the corresponding author(s).
Conflicts of Interest
The authors declare no conflicts of interest.
Abbreviations
The following parameters, their abbreviations, and typical units of these parameters are used in this manuscript:
| q | Heat flux [W·m−2] |
| T | Temperature [K or °C]; experimental temperatures are reported in degrees Celsius (°C), but theoretical equations use Kelvin (K) for absolute values |
| k | Thermal conductivity [W·m−1·K−1] |
| cv | Volumetric heat capacity [J·m−3·K−1] |
| ρ | Density [kg·m−3] |
| cp | Specific heat capacity at constant pressure [J·kg−1·K−1] |
| a | Thermal diffusivity, a = k/cv [m2·s−1] |
| τq | Phase lag of the heat flux [s] |
| τT | Phase lag of the temperature gradient [s] |
| Z | Dimensionless ratio of phase lags, Z = τT/τq [–] |
| p₀ | Applied heat flux amplitude [W·m−2] |
| u(t) | Unit step function [–] |
| δ(t) | Thermal penetration depth [m] |
| s | Laplace variable [s−1] |
References
- Wilfling, J.; Havenith, G.; Raccuglia, M.; Hodder, S. Consumer expectations and perception of clothing comfort in sports and exercise garments. Res. J. Text. Appar. 2022, 26, 293–309. [Google Scholar] [CrossRef]
- Ciesielska-Wróbel, I.L.; Van Langenhove, L. The hand of textiles—Definitions, achievements, perspectives—A review. Text. Res. J. 2012, 82, 1457–1468. [Google Scholar] [CrossRef]
- Kamalha, E.; Zeng, Y.; Mwasiagi, J.I.; Kyatuheire, S. The comfort dimension: A review of perception in clothing. J. Sens. Stud. 2013, 28, 423–444. [Google Scholar] [CrossRef]
- De Mey, G.; Ciesielska-Wróbel, I.; Van Langenhove, L. Mathematical model of haptic perception of temperature. Text. Res. J. 2016, 87, 155–164. [Google Scholar] [CrossRef]
- Ho, H.N.; Jones, L.A. Modeling the thermal responses of the skin surface during hand-object interactions. J. Biomech. Eng. 2008, 130, 021005. [Google Scholar] [CrossRef]
- Mukae, H.; Watanabe, T. Psychophysical relations between fabric physical properties and psychological touch perceptions. J. Sens. Stud. 2016, 31, 489–500. [Google Scholar] [CrossRef]
- Zeng, F.; Wang, G.; Qiao, J.; Wang, Q.; Wu, M.; Zeng, X.; Hong, X. Modeling the relationship between fabric textures and the evoked emotions through different sensory perceptions. J. Eng. Fibers Fabr. 2024, 19, 15589250241248761. [Google Scholar] [CrossRef]
- Jay, O.; Havenith, G. Finger skin cooling on contact with cold materials: An investigation of male and female responses during short-term exposures with a view on hand and finger size. Eur. J. Appl. Physiol. 2004, 93, 1–8. [Google Scholar] [CrossRef]
- Bejan, A. Heat Transfer; John Wiley & Sons: New York, NY, USA, 1993. [Google Scholar]
- KatoTech. Kawabata Thermo Labo System KES-F7. Available online: https://english.keskato.co.jp/archives/products/kes-f7 (accessed on 22 July 2025).
- American Association of Textile Chemists and Colorists (AATCC). Evaluation Procedure (EP) 5, Guidelines for the Subjective Evaluation of Fabric Hand. In AATCC Manual of International Test Methods and Procedures; American Association of Textile Chemists and Colorists: Durham, NC, USA, 2025; Volume 100. [Google Scholar]
- Cengel, Y.A. Heat Transfer: A Practical Approach, 2nd ed.; McGraw-Hill: Columbus, OH, USA, 2003. [Google Scholar]
- Tzou, D.Y. Macro-to Microscale Heat Transfer: The Lagging Behavior; Taylor & Francis: London, UK, 1996. [Google Scholar]
- Zhou, J. Macroscale and Nanoscale Heat Transfer: Fundamentals and Engineering Applications; Wiley: Hoboken, NJ, USA, 2009. [Google Scholar]
- Incropera, F.; De Witt, D.P. Introduction to Heat Transfer; Wiley: Hoboken, NJ, USA, 1985; pp. 202–206. [Google Scholar]
- Bayazitoglu, Y.; Ozisik, M.N. Elements of Heat Transfer; Mc Graw Hill: Columbus, OH, USA, 1988; pp. 140–148. [Google Scholar]
- Fournier, D.; Boccara, A.C. Heterogenous media and rough surfaces: A fractal approach for heat diffusion studies. Phys. A Stat. Mech. Appl. 1989, 157, 587–592. [Google Scholar] [CrossRef]
- Ciesielska-Wróbel, I.; De Mey, G.; Van Langenhove, L. Dry heat transfer from the skin surface into textiles: Subjective and objective measurement of thermal haptic perception of textiles–preliminary studies. J. Text. Inst. 2016, 107, 445–455. [Google Scholar] [CrossRef]
- Chatziathanasiou, V.; Chatzipanagiotou, P.; Papagianopoulos, I.; De Mey, G.; Wiecek, B. Dynamic thermal analysis of underground medium power cables using thermal impedance, time constant distribution and structure function. Appl. Therm. Eng. 2013, 60, 256–260. [Google Scholar] [CrossRef]
- Ciesielska-Wrobel, I.L.; Langenhove, L.V.; Grabowska, K. Fingertip skin models for analysis of the haptic perception of textiles. J. Biomed. Sci. Eng. 2014, 7, 1–6. [Google Scholar] [CrossRef]
- Abreu, M.J.; Martins, E.; Nagamatsu, N.; Amaral, W. Tactile Perception in the Sensory Comfort of Fabric Samples. J. Biomim. Biomater. Biomed. Eng. 2022, 57, 57–63. [Google Scholar] [CrossRef]
- Cardone, G.; Ianiro, A.; Ioio, G.D.; Passaro, A. Temperature maps measurements on 3D surfaces with infrared thermography. Exp. Fluids 2012, 52, 375–385. [Google Scholar] [CrossRef]
- Więcek, B.; De Mey, G. Termowizja w Podczerwieni: Podstawy i Zastosowania; Wydawnictwo PAK: Warsaw, Poland, 2011. [Google Scholar]
- Zhou, Y.; Yu, H.; Luo, M.; Zhou, X. Skin Heat Transfer and Thermal Sensation Coupling Model under Steady Stimulation. Buildings 2024, 14, 547. [Google Scholar] [CrossRef]
- Mandal, S.; Annaheim, S.; Greve, J.; Camenzind, M.; Rossi, R.M. Modeling for predicting the thermal protective and thermo-physiological comfort performance of fabrics used in firefighters’ clothing. Text. Res. J. 2018, 89, 2836–2849. [Google Scholar] [CrossRef]
- Omer, B.I.; Ahmed, Y.M.; Abdalrahman, R.M. Impact of textile types and their hybrids on the mechanical properties and thermal insulation of mohair-reinforced polyester Composite laminates. Results Mater. 2024, 21, 100502. [Google Scholar] [CrossRef]
- Kocik, S.; Psikuta, A.; Ferdyn-Grygierek, J. Human body area view factors for radiative heat transfer: Influence of body region, shape, and posture. Build. Environ. 2025, 281, 113200. [Google Scholar] [CrossRef]
- Joshi, A.; Psikuta, A.; Annaheim, S.; Rossi, R.M. Modelling of heat and mass transfer in clothing considering evaporation, condensation, and wet conduction with case study. Build. Environ. 2023, 228, 109786. [Google Scholar] [CrossRef]
- Kalaoglu-Altan, O.I.; Kayaoglu, B.K.; Trabzon, L. Improving thermal conductivities of textile materials by nanohybrid approaches. iScience 2022, 25, 103825. [Google Scholar] [CrossRef] [PubMed] [PubMed Central]
- Tzou, D.Y. The generalized lagging response in small-scale and high-rate heating. Int. J. Heat Mass Transf. 1995, 38, 3231–3240. [Google Scholar] [CrossRef]
- Mukhopadhyay, S.; Kothari, S.; Kumar, R. Dual Phase-Lag Thermoelasticity. In Encyclopedia of Thermal Stresses; Hetnarski, R.B., Ed.; Springer: Dordrecht, The Netherlands, 2014. [Google Scholar] [CrossRef]
- Quintanilla, R.; Racke, R. Qualitative aspects in dual-phase-lag heat conduction. Proc. R. Soc. A Math. Phys. Eng. Sci. 2007, 463, 659–674. [Google Scholar] [CrossRef]
- Elahi Mangat, A.; Hes, L.; Bajzik, V.; Mazari, A. Thermal absorptivity model of knitted rib fabric and its experimental verification. Autex Res. J. 2018, 18, 3–8. [Google Scholar] [CrossRef]
- Atalie, D.; Tesinova, P.; Tadesse, M.G.; Ferede, E.; Dulgheriu, I.; Loghin, E. Thermo-Physiological Comfort Properties of Sportswear with Different Combination of Inner and Outer Layers. Materials 2021, 14, 6863. [Google Scholar] [CrossRef] [PubMed] [PubMed Central]
- Mandal, S.; Mazumder, N.U.; Agnew, R.J.; Song, G.; Li, R. Characterization and Modeling of Thermal Protective and Thermo-Physiological Comfort Performance of Polymeric Textile Materials-A Review. Materials 2021, 14, 2397. [Google Scholar] [CrossRef] [PubMed] [PubMed Central]
- Peng, Y.; Cui, Y. Thermal management with innovative fibers and textiles: Manipulating heat transport, storage and conversion. Natl. Sci. Rev. 2024, 11, nwae295. [Google Scholar] [CrossRef]
- Puszkarz, A.K.; Machnowski, W.; Błasińska, A. Modeling of thermal performance of multilayer protective clothing exposed to radiant heat. Heat Mass Transf. 2020, 56, 1767–1775. [Google Scholar] [CrossRef]
- Gholamreza, F.; Su, Y.; Li, R.; Nadaraja, A.V.; Gathercole, R.; Li, R.; Dolez, P.I.; Golovin, K.; Rossi, R.M.; Annaheim, S.; et al. Modeling and Prediction of Thermophysiological Comfort Properties of a Single Layer Fabric System Using Single Sector Sweating Torso. Materials 2022, 15, 5786. [Google Scholar] [CrossRef]
- Goldman, C.H.; Norris, P.M.; Tien, C.I. Picosecond energy transport by fractons in amorphous materials. In Proceedings of the National Heat Transfer Conference, Portland, Oregon, 6–8 August 1995. [Google Scholar]
- ISO 3801:1977; Textiles—Woven Fabrics—Determination of Mass per Unit Length and Mass per Unit Area. International Organization for Standardization: Geneva, Switzerland, 1977.
- ISO 5084:1996; Textiles—Determination of Thickness of Textiles and Textile Products. International Organization for Standardization: Geneva, Switzerland, 1996.
- ISO 8302:1991; Thermal Insulation—Determination of Steady-State Thermal Resistance and Related Properties—Guarded Hot Plate Method. International Organization for Standardization: Geneva, Switzerland, 1991.
Disclaimer/Publisher’s Note: The statements, opinions and data contained in all publications are solely those of the individual author(s) and contributor(s) and not of MDPI and/or the editor(s). MDPI and/or the editor(s) disclaim responsibility for any injury to people or property resulting from any ideas, methods, instructions or products referred to in the content. |
© 2025 by the authors. Licensee MDPI, Basel, Switzerland. This article is an open access article distributed under the terms and conditions of the Creative Commons Attribution (CC BY) license (https://creativecommons.org/licenses/by/4.0/).