Abstract
A symbiotic relationship exists between the state and the energy sector that often leads to conflicting relationships between the two. The best example of this complicated relationship is between the state and free markets is the case of the United States, European Union, and Global Energy Sector. The decline in the gas import—due to sanctions placed on the Russian Federation—to Europe from Russia, along with other counties that import gas from Russia, has negatively affected the economies of European counties. The Russian government has restructured the exporting of gas to other counties in order to continue to sustain companies’ growth. This literature review will analyze how sanctions against Russian Federation have affected the energy market and how it will affect entire energy markets.
1. Introduction
A symbiotic relationship exists between the state and the energy sector that often leads to conflict between these two entities in the global market. The best examples of such complicated relationships are the cases of the United States, the European Union, and the global energy sector. The main industries in the world market are oil and natural gas, which play essential roles in the economy worldwide and are the main fuel sources for every country on every continent [1]. Oil has been the leading cause of wars since 1973 [2]. Conflicts over oil can occur due to competition over shipping lanes and pipelines, oil-related terrorism, petrol aggression, and resource scarcity in consumer states [3]. In 2014, the Autonomous Republic of Crimea became part of the Russian Federation after a referendum that took place, and people voted in a referendum for integration with the Russian Federation, which resulted in integration with the Russian Federation. This has led to sanctions on Russia that remain in place today. Russia has received 5532 to date, which is more than Iran has received (3616) [4]. The countries that have imposed sanctions on Russia are Switzerland (568), the European Union (518), Canada (454), Australia (413), the United States (243), the United Kingdom (35), and Japan (35) [5].
In September 2021, Gazprom (a Russian energy company) completed Nord Stream 2, which has provided an additional pipeline to import oil in order to support the growing economy of Europe and its consumers’ needs. Figure 1 shows that Nord Stream 2 and Nord Stream connect Germany and Russia directly, eliminating transit countries such as Ukraine, Austria, Belarus, and Poland. Even though Nord Stream 2 is complete, the pipeline has not received certification to begin operation. This situation will be analyzed by economists of the European Union to determine how this decision has affected the German, EU, and global economies and energy markets. In this research paper, I will analyze the energy market and how it has changed due to the current economic and political environment. It is quite important to gain an understanding of how the state influences and affects the energy market and economies worldwide.
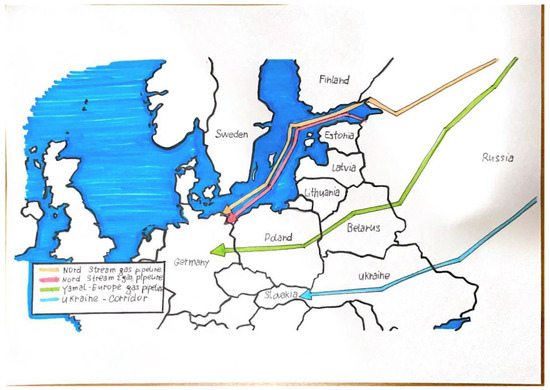
Figure 1.
Map of Gas Pipelines from Russia to Europe.
2. Theoretical/Conceptual Framework
I framed my research using the dynamic capabilities framework [6], which is an updated extension of Porter’s Five Forces model [7]. Scholars have used this model to explain knowledge gaps in the symbiotic relationship between the state and energy companies, as well as the possible future consequences of the conflicting institutional relationships between the state and the private energy sector [5]. The dynamic capabilities framework [8] applies to this study because it provides an alternative view on strategic management of the gas industry and the economic capability that additional exploration opportunities create [9,10]. In addition, it can be used to analyze the intricacies of various obstacles that may arise regarding the conflicting relationship between the state and the private energy sector, as well as how they affect the economy.
3. Results
Oil and gas have been some of the leading causes of global conflicts among various nations.
These are the mechanisms that explain such conflicts:
- ❖
- Resource wars: state(s) attempt to obtain oil sources by force;
- ❖
- Petro-aggression: state(s) take on risky international policies;
- ❖
- The exteriorization of civil wars in oil: internal conflict for oil and gas;
- ❖
- Financing uprising: funding terrorist organization(s) such as ISIS;
- ❖
- Divergences triggered by the expectation of oil-market supremacy: for example, the United States began a war with Iraq to take control of Kuwait’s oil sources in 1990;
- ❖
- Conflicts over control of oil transit channels: for example, pipelines and shipping of oil through Ukraine;
- ❖
- Oil infringements due to foreign personal presence that leads to terrorist organizations, such as ISIS, recruiting local citizens;
- ❖
- Oil-related impediments to multidimensional support: when a distributor’s attempts to show preference for a petrostate preclude multidimensional collaboration on security concerns [11].
There is a link between oil and global conflicts that is strengthening due to a significant transition in the global energy sector. A major shift has occurred in the energy industry today, which has affected the energy industry and, as a result, economies worldwide. Natural gas prices have increased by 46% or more this year [12]. For example, the cost of gasoline in Aventura, FL, on 10 June 2022, ranged from USD 4.99 to 5.99 per gallon; in the United Kingdom, the average price of gas is USD 9.77 per gallon [13], and in the European Union, it is USD 7.78 per gallon [14]. Despite the ability to diversify using clean energy, we still rely heavily on gas and oil, as well as coal.
The energy industry has been evolving as the demand for clean energy has increased to preserve the climate and clean air. Figure 2 and Figure 3 below show how energy consumption has changed over the years as demand from consumers has increased due to population growth as well as the growth of factories, plants, and other commercial infrastructure. In 2018, oil accounted for 31.6% of the energy supply, whereas in 1973, it accounted for 46.2%, revealing a decrease of 14.6% [15]. However, the share of coal in the energy supply increased from 24.5% in 1973 to 26.9% in 2018, a 2.4% increase [15]. Also, the share of natural gas in energy supply increased from 16% in 1973 to 22.8% in 2018 [15]. In addition, there is a shale oil reserves at global estimation is at 345 billion barrels, which 75 billion of barrels reserves belongs to Russia, 58 billion barrels belongs to United States, and 35 billion barrels belongs to China [16]. The rest of shale oil reserves belong to: Argentina (27 billion barrels), Libya (26 billion barrels), Venezuela (13 billion barrels), Mexico (13 billion barrels), Pakistan (9 billion barrels), Canada (9 billion barrels), and Indonesia (8 billion barrels) [16]. One could argue that the demand for clean energy has increased and will continue to increase due to newly developed polices and regulations for clean and renewable energy [17].
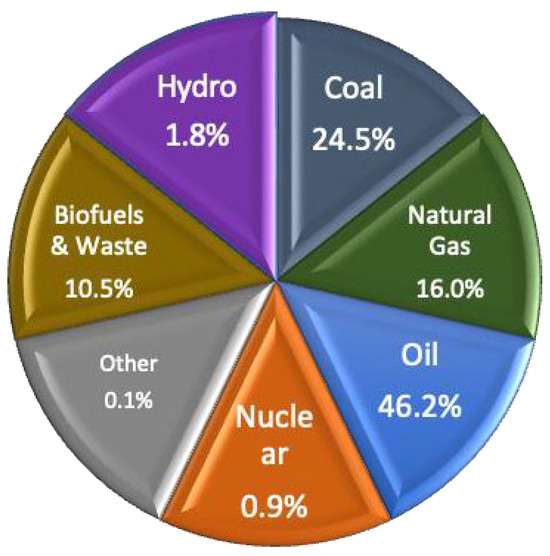
Figure 2.
World Total Energy Supply, 1973 [15]. Adapted from: These Charts Show How Little the Global Energy Supply Has Changed Since the 1970s, by A. Willige, 2020, World Economic Forum (https://www.weforum.org/agenda/2020/09/energy-mix-1970s-today/, accessed on 25 May 2022).
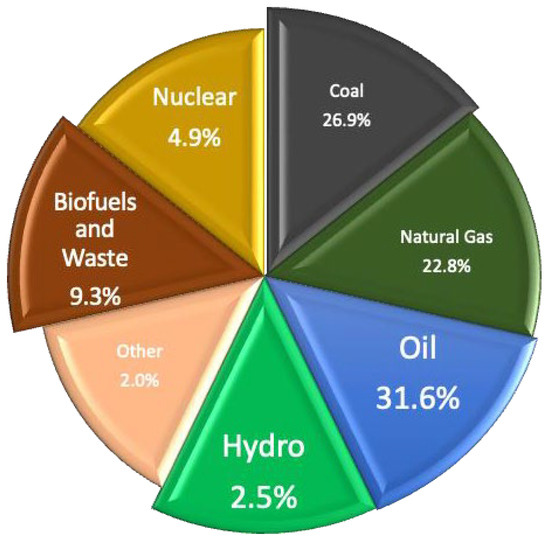
Figure 3.
World total energy supply, 2018 [18]. Adapted from: Andrea Willige, 8 September 2020. These charts show how little the global energy supply has changed since the 1970s, World Economic Forum, (https://www.weforum.org/agenda/2020/09/energy-mix-1970s-today/, accessed on 14 March 2022).
Figure 4 shows how much energy consumers are using globally in the 2020s. The consumption of oil, coal, and natural gas has increased since 2018 due to global economic growth, the rising population, and technological growth.
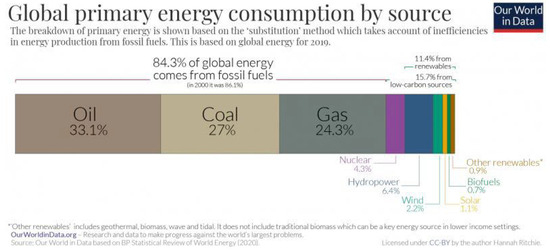
Figure 4.
Global Primary Energy Consumption by Source [11]. Adopted from: Hannah Ritchie and Max Roser, Energy mix, 2020, Published online at OurWorldInData.org, https://ourworldindata.org/energy-mix, accessed on 22 July 2022.
Global economic growth has resulted from the following:
- ❖
- Agriculture: increased demand for food, which leads to increased cultivation of land and farming and increased consumption of energy to fuel machinery, such as tractors and combines, and to provide electricity;
- ❖
- Industry: speedy industrialization will cause expansion of the processing and manufacturing industries;
- ❖
- Transport: increase in vehicle purchases, which increases demand for gas/oil;
- ❖
- Urbanization: increase in the need for lighting, cooking, and household appliances
- ❖
- Wealth: people have increased their wealth, which leads to increased purchasing of various domestic goods and an increase in additional activities, such as travel [11].
The global population is increasing by 1% each year. According to data from World Population View [19], the world population in 2022 was 7,953,303,361, a 1% increase from 2021, whereas in 2021, the population was 7,874,965,825 [19]. This leads to increased demand for energy, which in turn consumes two billion oil barrels, and electricity usage is expected to increase by 52% by 2040 [20]. The population currently obtains 80% of its energy supply from fossil fuel, which includes nuclear power; biofuels; and hydro, solar, wind, and geothermal energy [21].
3.1. Fossil Fuel History
A black rock that was found to be coal was discovered in China 4000 years ago. According to some archeologists, this is when humans used the first fossil fuel [22]. About 1900 years ago (100–124 CE), in present-day Iraq, natural gas was discovered, but at that time, people did not realize its importance as a fuel source for domestic use [22]. Today, natural gas is used for domestic purposes, such as heating and cooking. Figure 5 shows how fracking is conducted and extracted.
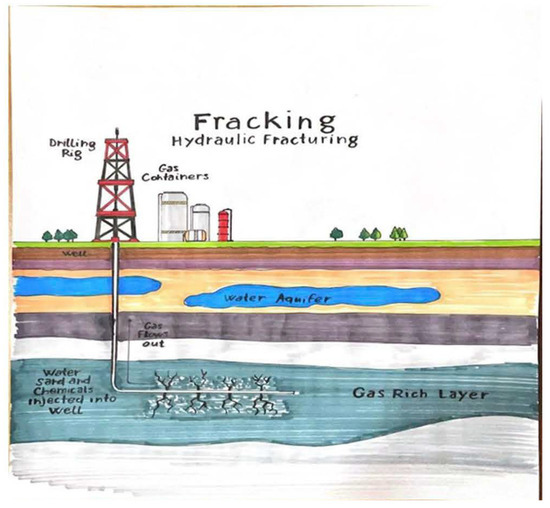
Figure 5.
Hydraulic Fracturing.
Scientists have established that fossil fuels (coal, oil, and natural gas) are made of the remains of plants and animals which are found in the earth’s crust and contain carbon and hydrogen that can be burned for energy [23]. Today, many scientists around the world are seeking to ensure that there will be enough fuel and that the environment is not affected, because this would have a negative effect on human life.
3.2. Natural Energy Consumption/Import
Renewable energy plays an important part in U.S. and global energy and in decreasing greenhouse gas emissions. The United States planned to diversify the energy imports from five main countries in 2021: Mexico, Canada, Russia, Saudi Arabia, and Colombia. It imported around 8.47 million barrels per day of petroleum from 73 countries. Petroleum consists of crude oil, hydrocarbon gas liquids, and refined petroleum products (gasoline, diesel fuel, and biofuels). The United States imports around 6.11 million barrels per day of crude oil, which is about 72% of total U.S. gross petroleum imports in 2021 [24]. The European Union imported natural energy from the following countries in 2020:
- □
- Crude oil imports:
- ➣
- from Russia (29%);
- ➣
- from the United States (9%);
- ➣
- from Norway (8%);
- ➣
- from Saudi Arabia and the United Kingdom (7% each);
- ➣
- from Kazakhstan and Nigeria (6% each).
- □
- Natural gas:
- ➣
- from Russia (43%);
- ➣
- From Norway (21%);
- ➣
- From Algeria (8%);
- ➣
- From Qatar (5%).
- □
- Solid fossil fuel (coal):
- ➣
- from Russia (54%);
- ➣
- from United States (16%);
- ➣
- from Australia (14%) [25].
This data show that the United States and the European Union rely heavily on imports of natural energy from a number of countries, including Russia. Russia is the main exporter of natural energy to a number of countries and Russia will remain to be the largest exporter of gas (2). It is the world’s second-biggest supplier of natural gas; the United States is the largest. Russia is also the third-largest supplier of oil, after the United States and Saudi Arabia [26]. According to Imsirovic [9], world leaders did not prepare for a post-fuel future, a fact that has led to the energy crisis the world is facing today.
The International Energy Agency (IEA) [27,28] reported that the development of capricious gas generated in the United States and its future expansion to China and Europe will challenge business operations for gas exporters [29]. Russia is ranked ninth in terms of recoverable shale gas in the industry; the top nations that recover shale gas are China, Argentina, and Algeria [30]. The IEA (2012) predicted that the United States might surpass Russia in shale gas development and become the world’s largest natural gas producer [31].
The U.S. Energy Information Agency [32] estimated that China possesses the world’s largest recoverable shale reserves, of 31.6 tcm (1275 tcf). In addition, BP (2013) has stated that Russia will remain the largest gas exporter to the European Union and the United States. Despite numerous sanctions imposed on Russia, the European Union and the United States still depend on imports of natural energy. Sanctions placed on Russia’s financial sector prevent the receipt of payments for gas and oil exported to European countries.
The Russian state will provide all necessary support to ensure Gazprom’s effective and efficient operations in the global energy industry and maintain its competitiveness in the global energy market [33]. Gazprom resumed the development of South Stream in 2017, and it was competed in 2020, resulting in diversification due to the use of the Ukrainian pipeline. Gazprom no longer relies on this transit line as of the end of 2019 [34]. This led Ukraine to object, as it will be losing great financial gain from transit, but the objections did not affect the South Stream project, which was completed and is being used today as one of the main routes for importing gas to Eastern Europe and Europe itself.
In turn, Russia has decreased exports of natural energy to the European Union and the United States. How will the energy market be affected, considering the current decrease in gas/oil imports to European countries and the United States?
3.3. How the Energy Market Has Changed since Sanctions against Russia
In 2014, the first sanctions were imposed on Russia, and more sanctions were imposed in 2022. Some of these were economic sanctions that restricted Russia from receiving funds in both EUR and USD for exported gas/oil. In addition, Germany did not issue a certificate for the Nord Stream 2 pipeline, preventing the export of gas from Russia to Germany [35]. Furthermore, Russia has refused to export gas/oil until payment is made in its local currency (RUB). On 28 March 2022, Russian President Vladimir Putin asked the Russian Central Bank, the government, and Gazprom to develop a proposal by 31 March 2022 for a gas payment plan in RUB that would be applied to “unfriendly countries” and the entire European Union [36]. The Russian president’s statement means that the European Union, Britain, Canada, Japan, Switzerland, Ukraine, and the United States, which have imposed sanctions, will have to purchase RUB with USD or EUR at a rate that Russia’s Central Bank determines in order to purchase gas for exports [36]. Figure 6: Payments in RUB to Bypass Sanctions.
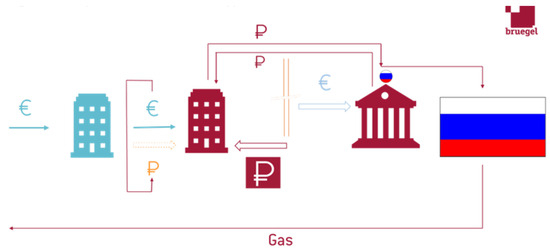
Figure 6.
Payments in RUB to bypass sanctions [37]. Adopted from: Maria Demertzis and Francesco Papadia, 19 April 2022, global economy and Trade, https://www.bruegel.org/2022/04/a-sanctions-counter-measure-gas-payments-to-russia-in-rubles/, accessed on 12 December 2022.
This policy would strengthen the Russian RUB because the demand to purchase would increase. Today, the price for crude oil per barrel is USD 113.06, and it has been increasing for the past 3 months. Once governments become involved in industry, such as the energy sector, in negative ways, it will result in a negative outcome. Gas prices have increased greatly worldwide, especially in countries that have implemented sanctions against Russia. These countries did not analyze the outcome of the sanctions placed on Russia’s banking system and the energy sector, and this will result in a negative outcome and hinder their own economies. Ping [38] stated that 13,382 sanctions were imposed on Russia between 2014 and 2022.
For example, gasoline prices in the United States range from USD 5 to 7, depending on the state, which results in increased prices for all goods for citizens. In March 2022, inflation in the European Union stood at 7.8%, an increase from 6.2% in February 2022 [39]. According to the European Commission, inflation had increased in July 2022 to 8.9% [40]. According to Branis [3], sanctions against Russia have affected the profits of corporations in the United States and Europe, as well as the GDPs of some countries. In other countries, including in the European Union, prices for energy and goods have increased as well.
Inflation in various sectors has affected prices as follows:
- Energy: 39.7% (July), up from 42% (June);
- Food, alcohol, and tobacco: 9.8% (July), up from 8.9% (June);
- Non-energy industrial goods: 4.5% (July), up from 4.3% (June).
The UK government has been informing its citizens that energy prices will increase; as a result, many families have begun to limit their spending by minimizing the use of their heating system for long periods and dining out less often [32].
Nelson [8] stated that many citizens’ energy bills have increased by 54%, which will create more dire living conditions for millions. The European Union Commission’s recommendations to save energy are as follows:
- ❖ Turn down heating and use less air conditioning
- ❖ Adjust your boiler’s settings
- ❖ Work from home
- ❖ Use your car more economically
- ❖ Reduce your speed on highways
- ❖ Leave your car at home on Sunday in large cities
- ❖ Walk or bike short distances instead of driving
- ❖ Use public transport
- ❖ Skip the plane and use the train [14]
According to the EU Commission, as Figg [11] stated that this will make it possible to save enough oil to fill 120 super tankers and save enough natural gas to heat 20 million households [39]. European leaders are asking citizens to reduce energy usage to support their leaders’ agenda, which is quite destructive to these leaders’ economies and citizens.
In January 2022, Germany shut down the last 6 nuclear reactors that were left of a total of 19, and the last 3 will be closed at the end of 2022 [1]. Many will argue that this is an unwise decision that will prevent Germany from decarbonizing and will place Germany in a challenging position and increase the energy crisis in the country, leading to factory and plant shutdowns [37]. In addition, Russia is a major supplier of palladium (40%), which is essential for vehicles (it decreases harmful emissions into the atmosphere), and 30% of titanium, which is essential for the aerospace industry (such as Airbus, which will be complying with sanctions), is exported from Russia [7]. This will greatly affect Airbus and its production, but to comply with European sanctions, the company is willing to endure a shortage of titanium.
Despite accusations that gas/oil prices have risen due to Russia, the supply of gas/oil has been disrupted by the COVID-19 pandemic, the interlinking of the natural gas industry globally, and unpredictability in the pricing of energy due to diversification from fossil fuels to green energy [39].
4. Projection 2050
Developing countries are working towards diversifying from oil and gas consumption into clean energy that will minimize emissions into the atmosphere. During the pandemic in 2020, the global emissions decreased by 4.9%, which is recorded as the biggest drop since 1960 [41]. However, in 2021, emissions have increased by 0.1%, reaching a level higher than that in 2019 [33]. During the pandemic, travel was restricted; thus, less air traffic as well as less automobile traffic led to fewer emissions into the atmosphere. All countries collectively are aiming towards net zero emissions by 2050, but there are some countries that continue to contribute to the increase in emissions. There are 100 countries that contribute to emissions, but their contributions account for 2.9%, whereas three countries contribute to 42.6% of emissions [33]. These countries are China, the United States, and India (emissions measured in millions of tons in CO2):
- China → more than 10,065 million tons of CO2 released;
- United States → 5416 million tons of CO2;
- India → 2654 million tons of CO2 [3].
Russia, being fourth on the list of emitters, is working towards minimizing emissions by 33% by the year 2030 in order to minimize the greenhouse effect on the climate [42]. In addition, countries such as South Africa, Vietnam, and Indonesia have come to a decision to minimize emissions, as they are major coal consumers. They are reverting to clean energy due to the Just Energy Transition Partnerships pact, an organization led by the United States and additional Group of Seven countries [14].
On 30th November 2023, OPEC+ held a meeting, and upon completion of the summit, countries have come to a conclusion to voluntarily cut down by a total of 2.2 million barrels per day [43]. The countries from OPEC which have decided to cut down on oil production are: Saudi Arabia (1000 barrels per day); Iraq (223 thousand barrels per day); United Arab Emirates (163 thousand barrels per day); Kuwait (135 thousand barrels per day); Kazakhstan (82 thousand barrels per day); Algeria (51 thousand barrels per day); Oman (42 thousand barrels per day); and Russia (500 thousand barrels per day) [43]. This agreement was reached in order to establish stability in the oil and energy market.
5. Discussion Section
This study focused on an analysis of how sanctions placed on the Russian Federation have affected the countries that imposed these sanctions, such as the European Union, the United States, some Latin American counties, Japan, and Sri Lanka. The sanctions that have been imposed on Russia are the largest sanctions that have been imposed in history. The countries that have imposed sanctions on Russia expected them to harm Russia’s economy and create instability in its government, but the reality of the sanctions is not what was expected. Europe and various countries are enduring the effects of the sanctions against Russia, such as increased energy, product, and food costs. Europe has decided to decrease or completely eliminate the usage of Russian gas/oil, but has not considered how such a policy would affect its economy or industries. As aforementioned, the cost of energy and other goods has increased drastically.
European leaders are directing citizens to use less energy and water to cut the costs of energy usage. This coming winter, European countries are facing difficult times regarding energy and its usage. European leaders need to focus more on their citizens’ welfare and not their ambitions to punish Russia for the so-called invasion of Ukraine. The cost of energy will continue to rise unless Nord Stream 2 is given certification and begins its operations. The German government has decided not to certify Nord Stream, which has led to an energy crisis in the European Union. If European leaders forego personal ego and consider their citizens’ welfare, people will not have to decrease energy use in their homes, use less water, or spend conservatively on groceries. The question is, how long will European leaders be willing to continue on the current path of converting to “alternative energy” and leaving their citizens in dire economic conditions? Only time will tell.
Funding
This research received no external funding.
Institutional Review Board Statement
Not applicable.
Informed Consent Statement
Not applicable.
Data Availability Statement
No new data were created or analyzed in this study. Data sharing is not applicable to this article.
Conflicts of Interest
The authors declare no conflict of interest.
References
- Blas, J.; Kluth, A.; Denning, L.; Ford, J. Why Germany Will Regret Its Nuclear Plant Shut-319 Downs. The Washington Post. 25 January 2022. Available online: https://www.washingtonpost.com/business/energy/why-germany-will-regret-its-nuclear-plant-shutdowns/2022/32101/25/3ab42de8-7dad-11ec-8cc8-b696564ba796_story.html (accessed on 13 March 2022).
- BP. Prognoz Razvitiya Mirovoy Energeticy: Energy Outlook 2030. 2011. Available online: http://www.bp.com/liveassets/bp_internet/globalbp/globalbp_uk_english/reports_and_publications/statistical_energy_review_2011/STAGING/local_assets/pdf/Energy_outlook2030_russian.pdf (accessed on 13 July 2011).
- Branis, S.V. ECB between Scylla & Charybdis: Stagflation vs. Fragmentation. IHGP Working Paper No. 5. 2022. INSTITUTE OF HELLENIC GROWTH AND PROSPERITY AMERICAN COLLEGE OF GREECE. Available online: https://acg150.acg.edu/wp-content/uploads/2023/01/WorkingPaper_ECB_Backstop_2023-01-03.pdf (accessed on 12 October 2022).
- Russia Becomes World’s Most Sanctioned Country. The Economic Times. 19 October 2022. Available online: https://economictimes.indiatimes.com/news/international/world-news/russia-becomes-worlds-most-sanctioned-country/articleshow/90070310.cms?from=mdr (accessed on 23 March 2022).
- Which Countries Are The World’s Biggest Cardbon Polluters. Climate Trade. 17 May 2021. Available online: https://climatetrade.com/which-countries-are-the-worlds-biggest-carbon-polluters. (accessed on 13 March 2022).
- Teece, D.J.; Pisano, G.; Shuen, A. Dynamic Capabilities and strategic management. Strat. Manag. J. 1997, 18, 509–533. [Google Scholar] [CrossRef]
- Cholacu, A. Government and the private energy sector in Russia: A brief review of the literature. Int. J. Teach. Case Stud. 2018, 9, 347–363. [Google Scholar] [CrossRef]
- Kluth, A. In Germany, Scholz the Bold Reverts to Scholz the Smurf. The Washington Post. 22 April 2022. Available online: https://www.washingtonpost.com/business/energy/in-germany-scholz-the-bold-reverts-to-scholz-the-smurf/2022/04/22/c0f26270-c205-11ec-b5df-1fba61a66c75_story.html (accessed on 12 June 2022).
- Imsirovic, A. History Lessons for the Energy Transition. Energy Intelligence Forum. 11 January 2022. Available online: https://www.energyintelligenceforum.com/2022/History-Lessons-for-the-Energy-Transition (accessed on 2 February 2022).
- Nelson, A. Britain Will Take Measures to Ease Inflation’s Impact. Finance Minister Says. The New York Times. 2022. Available online: https://www.nytimes.com/2022/03/23/business/british-economy-russian-sanctions.html (accessed on 5 April 2022).
- Figg, H. The European Commission and the IEA Outline Key Energy Saving Actions. The European Commission’s Directorate General for Mobility and Transport. 29 April 2022. Available online: https://www.eltis.org/in-brief/news/european-commission-and-iea-outline-key-energy-saving-actions (accessed on 22 July 2022).
- 10 Best Performing Tips for Successful Hydraulic Fracturing. Oilman Magazine. 27 December 2018. Available online: https://oilmanmagazine.com/10-best-performing-tips-for-successful-hydraulic-fracturing/ (accessed on 15 June 2017).
- Stokel-Walker, C. This Is How the Global Energy Crisis Ends. WIRED.com. 5 April 2022. Available online: https://www.wired.com/story/global-energy-crisis-price-rise-solution/ (accessed on 25 May 2023).
- Fallin, D.; Lee., K.; Poling, G.B. Clean Energy and Decarbonization in Southeast Asia: Overview, Obstacles, and Opportunities. Center for Strategic and International Studies. May 2023. Available online: https://csis-website-prod.s3.amazonaws.com/s3fs-public/2023-05/230501_Fallin_SEA_Decarbonization.pdf?VersionId=mZRX4SCptRpseo_OB5sds9ocp0uiS1VG (accessed on 14 November 2023).
- Willige, A. These Charts Show How Little the Global Energy Supply Has Changed since the 1970s. World Economic Forum. 8 September 2020. Available online: https://www.weforum.org/agenda/2020/09/energy-mix-1970s-today/ (accessed on 25 May 2022).
- Zelma, G. Russia Has Largest Shale Oil Reserves–EIA Report. RIA Novosti. 2013. Available online: http://en.rian.ru/business/20130611/181615780.html (accessed on 17 June 2017).
- Ifflander, H.; Soneryd, L. The relative power of environmental assessment as a governance tool: Organization and the case of the Nord Stream gas pipeline. Impact Assess. Proj. Apprais. 2014, 32, 98–107. [Google Scholar] [CrossRef]
- EuroStat. From Where Do We Import Energy? 2022. Available online: https://ec.europa.eu/eurostat/cache/infographs/energy/bloc-2c.html (accessed on 14 March 2022).
- 2022 World Population by Country. World Population Review. 2022. Available online: https://worldpopulationreview.com/ (accessed on 25 May 2022).
- Ritchie, H.; Roser, M.; Rosado, P. Energy. Published Online at OurWorldInData.org. 2020. Available online: https://ourworldindata.org/energy (accessed on 22 March 2022).
- CAPP. World Energy Needs. Canada’s Oil and Natural Gas Producers. 2022. Available online: https://www.capp.ca/about/capp/ (accessed on 12 December 2022).
- Fossil Fuels. What Is a Fossil Fuel and What Is Being Done to Make Fossil Fuels More Environmentally Friendly? National Geographic Society. 2022. Available online: https://education.nationalgeographic.org/resource/fossil-fuels (accessed on 5 April 2022).
- Internet Geography. Why Is Energy Consumption Increasing? Economic Development, Rising Population and Technology. Internet Geography Plus. 2022. Available online: https://www.internetgeography.net/topics/why-is-energy-consumption-increasing/ (accessed on 22 March 2022).
- Colgan, J.D. Oil, Conflict, and U.S. National Interests. Policy Brief, Quarterly Journal: International Security. October 2013. Available online: https://www.belfercenter.org/publication/oil-conflict-and-us-national-interests (accessed on 12 June 2017).
- Constable, S. How Sanctions on Russia Will Hurt—and Help—The World’s Economies. Financial Times. 7 March 2022. Available online: https://www.ft.com/content/26d7e3d5-dd06-4117-a889-9a7d6735f920 (accessed on 16 March 2022).
- United Kingdom Gasoline Prices. Global Petrol Price. 2022. Available online: https://www.globalpetrolprices.com/United-Kingdom/gasoline_prices/ (accessed on 14 March 2022).
- International Energy Agency. The Oil and Gas Industry in Energy Transitions. January 2020. Available online: https://iea.blob.core.windows.net/assets/4315f4ed-5cb2-4264-b0ee-2054fd34c118/The_Oil_and_Gas_Industry_in_Energy_Transitions.pdf (accessed on 22 March 2022).
- International Energy Agency (IEA). Golden Rules for a Golden Age of Gas. 2012. Available online: http://www.iea.org/publications/freepublications/publication/WEO2012SpecialReportGoldenRulesforaGoldenAgeofGas.pdf (accessed on 13 January 2017).
- Gilbert, A.; Bazilian, M.D.; Gross, S. The Emerging Global Natural Gas Market and the Energy Crisis of 2021–2022. The Brookings Institution. December 2021. Available online: https://www.brookings.edu/research/the-emerging-global-natural-gas-market-and-the-energy-crisis-of-2021-2022/ (accessed on 14 March 2022).
- Porter, M. Competitive Advantage: Creating and Sustaining Superior Performance; The Free Press: New York, NY, USA, 1985. [Google Scholar]
- Congressional Research Service (CRS). U.S. Energy in the 21st Century: A Primer. Congressional Research Service, R46723, VERSION 2. 16 March 2021. Available online: https://crsreports.congress.gov/product/pdf/R/R46723 (accessed on 13 March 2022).
- EIA. Shale in the United States; US Energy Information Administration: Washington, DC, USA, 2016. [Google Scholar]
- EIA. How Much Petroleum Does the United States Import and Export? U.S. Energy Information Administration. 20 May 2021. Available online: https://www.eia.gov/tools/faqs/faq.php?id=727&t=6 (accessed on 5 April 2022).
- Friedrich, J.; Ge, M.; Pickens, A.; Vigna, L. This Interactive Chart Shows Changes in the World’s Top 10 Emitters. World Resources Institute. 2 March 2023. Available online: https://www.wri.org/insights/interactive-chart-shows-changes-worlds-top-10-emitters (accessed on 1 October 2023).
- GIS. Focus Germany: The Nord Stream 2 Headache. Geopolitical Intelligence Services AG. 1 October 2019. Available online: https://www.gisreportsonline.com/r/nord-stream-2-germany/ (accessed on 22 March 2022).
- RFE/RL’s Russian Service. Russia Says ‘Unfriendly’ Countries Will Have to Pay in Rubles For Gas Supplies. Radio Free Europe/Radio Liberty (RFE/RL). 23 March 2022. Available online: https://www.rferl.org/a/russia-gas-supplies-rubles-unfriendly/31766930.html (accessed on 5 April 2022).
- Demertzis, M.; Papadia, F. Global Economy and Trade. Bruegel. 19 April 2022. Available online: https://www.bruegel.org/2022/04/a-sanctions-counter-measure-gas-payments-to-russia-in-rubles/ (accessed on 12 December 2022).
- Ping, X. US Sanctions the Problem, Not the Solution. Global Times. 10 April 2022. Available online: https://www.globaltimes.cn/page/202204/1258915.shtml (accessed on 1 July 2022).
- Henderson, J.; Moe, A. Gazprom’s LNG offensive: A Femonstration of monopoly strength or impetus for Russian gas sector reform? Post-Communist Econ. 2016, 28, 281–299. [Google Scholar] [CrossRef]
- Eurostat. Annual Inflation. Eurostat/Euro Indicator. 2022. Available online: https://ec.europa.eu/eurostat/documents/2995521/14497739/2-21042022-AP-EN.pdf/24299719-6c7c-606b-cd57-c1d69218e23820c (accessed on 22 March 2022).
- Ross, K. Russia’s Proposed Climate Plan Means Higher Emissions Through 2050. World Resources Institute. 13 April 2020. Available online: https://www.wri.org/insights/russias-proposed-climate-plan-means-higher-emissions-through-2050 (accessed on 14 November 2023).
- Shuen, A.; Feiler, P.F.; Teece, D.J. Dynamic capabilities in the upstream oil and gas sector: Managing next generation competition. Energy Strategy Rev. 2014, 3, 5–13. [Google Scholar] [CrossRef]
- OPEC. Declaration of Cooperation of OPEC and non-OPEC Oil-Producing Countries Reaches Seven Years. Organization of the Petroleum Exporting Countries. 10 December 2023. Available online: https://www.opec.org/opec_web/en/press_room/7270.htm (accessed on 1 December 2023).
Disclaimer/Publisher’s Note: The statements, opinions and data contained in all publications are solely those of the individual author(s) and contributor(s) and not of MDPI and/or the editor(s). MDPI and/or the editor(s) disclaim responsibility for any injury to people or property resulting from any ideas, methods, instructions or products referred to in the content. |
© 2024 by the author. Licensee MDPI, Basel, Switzerland. This article is an open access article distributed under the terms and conditions of the Creative Commons Attribution (CC BY) license (https://creativecommons.org/licenses/by/4.0/).