Abstract
Pile foundations are widely used to transfer axial loads to deeper strata, where uplift resistance is critical for offshore structures, towers, and retaining systems. Uplift capacity is governed primarily by shaft resistance mobilized along the pile–soil interface, yet its behavior in sand remains inadequately defined. This study investigates the shaft resistance of vertical model piles subjected to pure pullout loading in dry sand, using instrumented steel piles in a rigid steel tank with reaction beams and earth pressure sensors to capture lateral stress distribution. The effects of pile diameter D, embedment ratio L/D, and sand relative density Dr on uplift performance were systematically examined. The results show that higher relative density produces higher earth pressure coefficients Ks and, accordingly, higher uplift capacity. An analytical model was developed to predict the earth pressure coefficient Ks and shaft resistance, introducing a friction-based critical depth ratio linked to the sand friction angle. The critical depth ratio increases with friction angle and is greater in denser sands under uplift loading. This study contributes in the following ways: (1) developing an improved analytical framework for uplift prediction, (2) introducing a friction-based critical depth ratio concept, and (3) establishing an empirical OCR relationship for sand.
1. Introduction
The study of pile uplift resistance has long been a central topic in geotechnical engineering given its essential contribution to the design of foundations for offshore structures, transmission towers, and other systems subjected to tensile forces. Meyerhof [1] established early theoretical contributions for evaluating the uplift capacity of piles and anchors in sand and clay, accounting for load inclination, embedment ratio, and soil failure mechanisms. These approaches were extended through analytical and semi-empirical methods by employing earth pressure theories or limiting friction assumptions to better predict shaft resistance under different loading conditions [2,3]. Under conditions of pure uplift loading, in which the pile is subjected solely to tension without any preceding compressive load, the full shaft resistance is mobilized in the upward direction. This mobilization generally corresponds to the maximum attainable capacity in the specific pile–soil system, as documented in previous experimental and theoretical studies [4,5]. Experimental investigations show that the compressive resistance of open-ended steel piles in sand can double over 64 weeks due to aging, while marginal soil plugging during installation becomes a major contributor to long-term capacity, highlighting the importance of these effects for reliable offshore pile design [6]. Several methods are utilized to determine the uplift piles’ capacity: (i) static load tests (i.e., prototype or full-scale), (ii) analytical methods based on the properties of the soil that are determined from in situ tests or in the laboratory [5]. On the other hand, the literature consistently shows that the shaft resistance mobilized in uplift loading is lower than that mobilized in compression for otherwise identical piles in sand [7].
Experimental investigations have shown notable shortcomings in traditional design equations due to their reliance on idealized assumptions of uniform stress distribution and complete friction mobilization along the pile–soil interface. Laboratory and field tests with instrumented piles have demonstrated that shaft resistance is strongly influenced by embedment depth, pile diameter, sand relative density, and installation method (e.g., jacked versus driven). Kulhawy et al. [8] confirmed that the shaft resistance improved when the relative sand density and pile roughness increased, with driven piles typically showing higher capacities than jacked piles [9]. These investigations also identified a critical depth beyond which the increase in shaft resistance with depth tends to plateau, with its magnitude depending on soil density and pile geometry. Moreover, the overconsolidation ratio (OCR) reflects soil stress history and increases with prior compaction or unloading [10]. Higher OCR enhances stiffness and strength in sands, especially in shallow layers exposed to densification [10,11]. Understanding and measuring OCR is essential for predicting soil and foundation performance [12]. Finite element analysis (FEA) has emerged as a robust tool for simulating the stress–strain response of piles embedded in granular soils, offering improved insight into compression and uplift mechanisms [13].
More recent studies incorporating instrumented earth pressure sensors along the pile shaft have provided direct measurements of lateral stress during pullout. These results reveal non-uniform stress transfer mechanisms and complex mobilization patterns, advancing understanding beyond simplified theoretical assumptions. Such insights have supported refinements of analytical methods, particularly limit equilibrium approaches, that can integrate measured pressure distributions to better capture uplift behavior. Nonetheless, existing models often overlook the influence of pile diameter, sand compaction variability, and stress redistribution effects [14]. Despite these advances, gaps remain in the quantitative assessment of shaft resistance in sand under uplift loading, especially when considering variations in installation method, pile geometry, and soil density. Therefore, comprehensive experimental data sets that integrate direct pressure measurements with calibrated analytical predictions remain scarce. These findings are consistent with established geotechnical observations reported in the literature. These findings advance the understanding of soil–pile interaction under tensile loading, elucidate the role of stress distribution in shaft resistance, and provide a rational basis for designing piles in cohesionless soils subjected to uplift loading. This study addresses these gaps through systematic testing of instrumented model piles subjected to monotonic uplift in sand, with particular emphasis on measuring earth pressure distribution and calibrating a limit equilibrium-based analytical model.
2. Mode of Failure
Meyerhof [1] and Kulhawy [8] described the failure modes of the single vertical pile under uplift loading based on their experimental studies. They also showed that when the embedment depth increases, the soil movement decreases due to dilating dense sand subjected to shear stresses. This behavior agreed well with a similar failure observed by Chattopadhyay and Pise [15], as depicted in Figure 1 and Equation (1).
where
In these expressions, L is the length of the pile, D is the pile diameter, ϕ is the angle of shearing resistance, and δ is the friction angle between the soil and pile. The inclination of the failure surface is represented by θ.

Figure 1.
The failure pattern for pile under uplift [15].
3. Critical Depth Theory
The existence and definition of critical depth for pile foundations where shaft resistance plateaus below a specific embedment have been widely examined. Kraft [16] attributed this behavior to sand arching effects, whereby densification below the pile tip and loosening around the shaft create ideal conditions for arching, restricting the development of full lateral earth pressure on the pile. For uplift loading, Das [17] provided explicit relationships demonstrating that the critical embedment ratio depends on sand relative density, as shown by the following equations:
where is the pile length, is the pile diameter, and is the relative density.
Many studies [8,18,19] support the existence of critical depth in both compression and uplift loading, although it tends to be shallower and less distinct for uplift. Conversely, researchers such as Altaee and Fellenius [19], Kulhawy [20], and Kim and Chung [21] have argued that the observed plateau may be influenced by residual loads locked in during installation, rather than a fundamental soil–structure boundary. Thus, while critical depth remains a useful design guideline, its magnitude and character differ between compression and uplift loading [17].
4. Test Tank and Loading System Setup
The experimental setup employed in this study consists of a rigid steel tank measuring 1000 mm in width, 1000 mm in length, and 1250 mm in depth, securely anchored to the laboratory floor using four ground pins. Figure 2 presents a schematic cross-section and overall view, detailing the principal components, including the steel tank, reaction frame, loading apparatus, data acquisition system (DAS), and power supply. A centrally positioned cylindrical actuator with a maximum capacity of 25 kN is bolted to the central beam to facilitate precise loading.
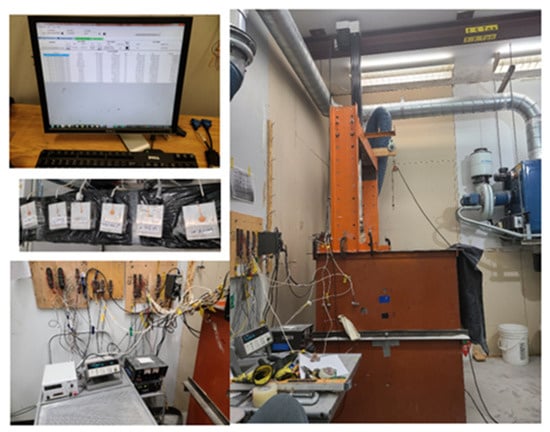
Figure 2.
Experimental setup showing the loading frame, instrumented test tank, and DAS.
Considering the scale effect in model pile tests, Garnier et al. [22] recommend that the boundary distance (B) should be at least 10 times the pile diameter (D) to minimize boundary influences. Accordingly, this investigation maintains a clearance of 13.15 D of scaling factor at pile diameter D = 38 mm and 8 D at pile diameter D = 63 mm from the center of the pile head and tip to the nearest rigid tank wall, ensuring negligible interference with test results. The overall configuration of the test system, including the reaction frame assembly, sand placement procedures, and instrumentation, is illustrated in Figure 2. This arrangement allows for reliable simulation and measurement of pile uplift behavior under controlled laboratory conditions.
5. Characteristics of Test Sand
Silica Sand 4010, characterized by sub-rounded particles, was selected to represent cohesionless soil in this study. The physical properties of the sand are summarized in Table 1. The internal friction angles corresponding to different relative densities, determined through direct shear tests, are also reported in Table 1. To evaluate the effect of relative density on shaft resistance, pile load tests were performed at three relative density levels: 30%, 45%, and 60%.

Table 1.
Relative density and corresponding angle of shearing resistance.
6. Test Pile Instrumentation Setup
Two model piles fabricated from mechanical steel pipes were utilized in this study to examine the influence of pile diameter on axial uplift resistance under both loading and unloading conditions, as depicted in Figure 3a,b. Each pile model comprises four components: a mechanical pipe, a rounded steel box, a drilling rod, and a tip. A bottom load cell (LC-2000 lb) at the pile tip measured tip resistance, while a top load cell (LC-5000 lb) at the pile head recorded total resistance. Shaft resistance was obtained by subtracting tip resistance from the total. Additionally, ten calibrated 8 mm and 15 mm micro SingleTact force sensors (five on each side) were installed along the pile shaft as shown in Figure 3a to assess shaft resistance distribution. The 63 mm pile was divided into five segments, with measurements taken at each segment to evaluate the distribution of earth pressure along the pile shaft. The calibration results of the SingleTact force sensors are presented in Figure 4. Additionally, the SingleTact force sensors and load cells were connected to a data acquisition system to record readings at specified intervals. The total length of both piles was 800 mm, with external diameters of 38 mm and 63 mm, respectively. To simulate the roughness of the pile surface, Grade 150 sandpaper was glued to the exterior of both piles, following the procedure recommended by Vakili [23]. Accordingly, both pile models were fully covered with sandpaper to reproduce realistic soil–pile interface behavior, as illustrated in Figure 3a,b.
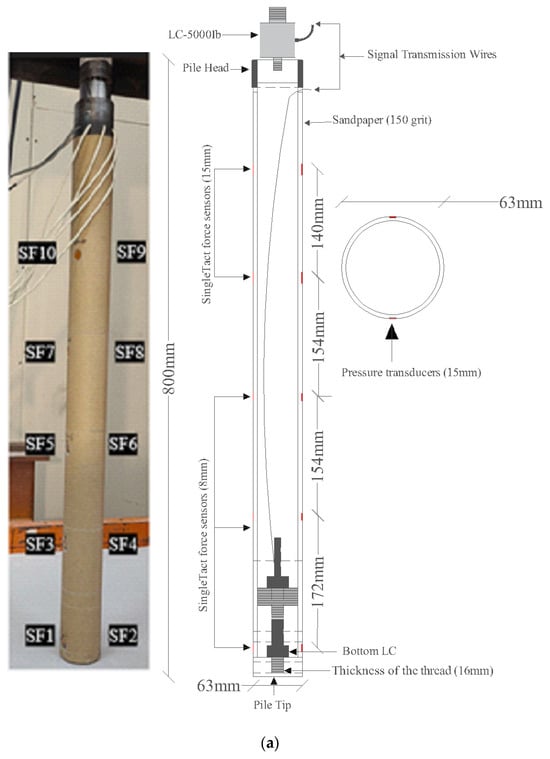
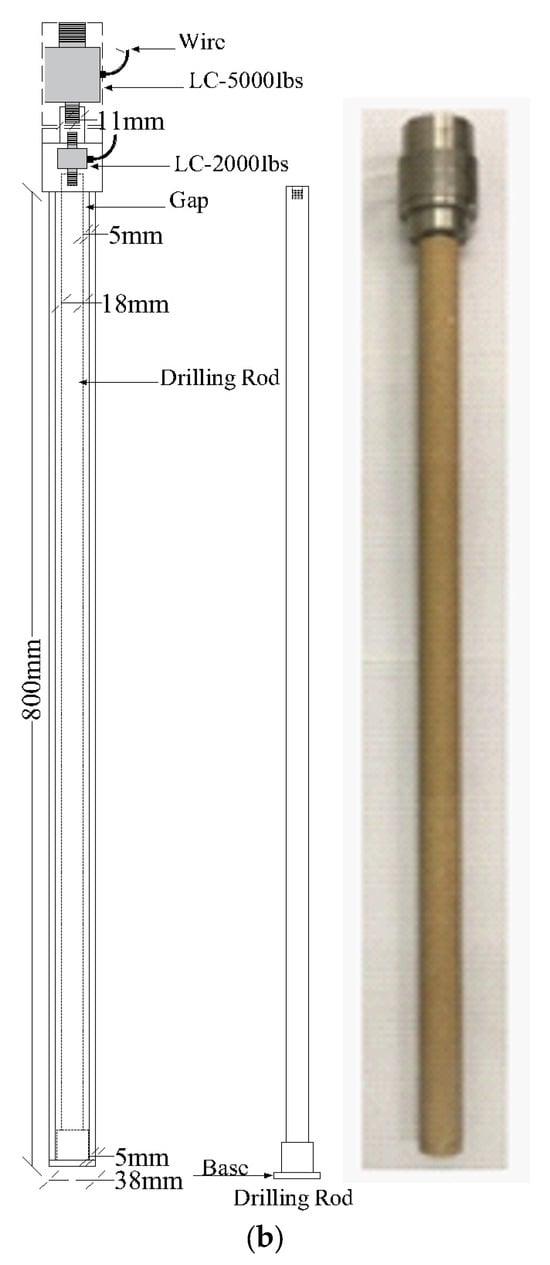
Figure 3.
Geometry and instrumentation: (a) 63 mm pile model; (b) 38 mm pile model.
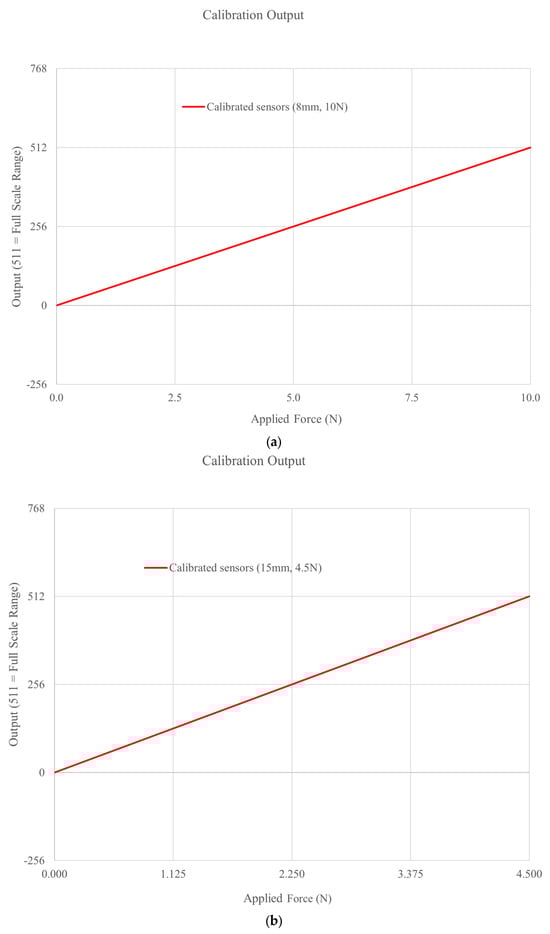
Figure 4.
SingleTact calibration reports for the force sensors: (a) sensor with 8 mm diameter; (b) sensor with 15 mm diameter [24].
7. Testing Program
The testing program comprised two main series: A—Tp, involving nine pile load tests using 63 mm diameter piles (D) at relative densities (Dr) corresponding to loose, medium, and dense sand, and embedment length ratios (L/D) of 6, 9, and 12; and B—Tp, consisting of six pile load tests with 38 mm diameter piles at the same relative density levels and embedment ratios of 15 and 20. In total, fifteen pile load tests were performed to systematically evaluate the effects of pile diameter, relative density, and embedment ratio on axial uplift resistance. Each test was conducted under pure uplift loading conditions (denoted as Tp). To maintain consistency and facilitate clear identification, a structured labeling system was adopted: (A) for the 63 mm pile, (B) for the 38 mm pile, and (Tp) to indicate the loading type. This framework allowed systematic comparisons between the A-series and B-series piles, highlighting the influence of scale and shaft surface area on uplift performance, as presented in Table 2.
Table 2.
Testing program for 38 mm and 63 mm pile models under uplift loading.
8. Test Preparation of the Sand
Three target relative densities, 30%, 45%, and 60%, were achieved by preparing sand at corresponding unit weights and depositing it into the test tank in 15 cm thick layers using a wheeled bin–hose distribution system operated by a crane–pulley as featured in Figure 5. The sand preparation process was as follows: (a) pouring sand, (b) compaction, (c) compacted layer.
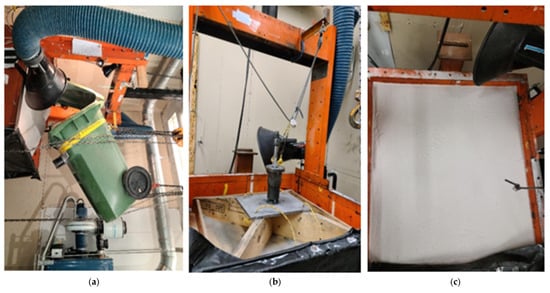
Figure 5.
Sand preparation process: (a) pouring sand; (b) compaction, (c) compacted layer.
At each layer, two plastic cans (diameter: 6.35 cm, height: 5 cm, volume: 633.38 cm3) were placed at mid-height, 200 mm from the tank walls, to monitor density, as shown in Figure 6. The test preparation was as follows: (a) the transducer unit layout was determined; (b) the locations of the cans in the testing tank were chosen.
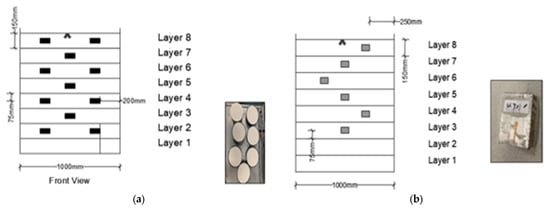
Figure 6.
Test preparation: (a) Transducer unit layout; (b) Can locations in testing tank.
After ensuring the cans were covered and the surface was leveled, each layer was compacted by applying a falling weight to a 500 mm × 500 mm aluminum plate on the compaction wood plate, as presented in Figure 5. The sand preparation process was as follows: (a) pouring sand, (b) compaction, (c) compacted layer.
The mass weight of 7.14 kg applied from a height of 20 cm above the sand surface of the layer was required to compact the sand. The compaction effort was progressively increased by applying a greater number of hammer drops as the target relative density increased, ensuring adequate densification of each layer, as displayed in Figure 5. The sand preparation process was as follows: (a) pouring sand, (b) compaction, (c) compacted layer.
Following each test series, the unit weight was determined by weighing the soil collected in the cans (Ws) and dividing by the can volume (Vcan= 633.38 cm3). The relative density of each sand layer was obtained from the measured can weights, as calculated using the following equation:
where
- weight of soil in the can [g]
- : can volume [cm3]
- minimum dry unit weight of the soil [g/cm3]
- : maximum dry unit weight of the soil [g/cm3]
9. Overconsolidation Ratio (OCR)
Pressure transducers were installed at various locations within the tank to measure both horizontal and vertical stresses in the sand. The placement of these pressure transducers is illustrated in Figure 6. The test preparation was as follows: (a) the transducer unit layout was determined; (b) the locations of the cans in the testing tank were chosen.
In all cases, the measured stress was compared with theoretical value to assess the influence of locked-in stresses and overconsolidation. The OCR was highest in the top layers, reflecting the greater compaction energy applied near the surface, while lower values were observed in deeper layers where the effect of vertical stress became more pronounced. As relative density increased from 30% to 60%, OCR values also increased, indicating that denser specimens developed higher locked-in stresses and greater structural rigidity. Figure 7a–c shows the theoretical and measured vertical stress values after compaction to achieve relative densities of 30%, 45%, and 60%.
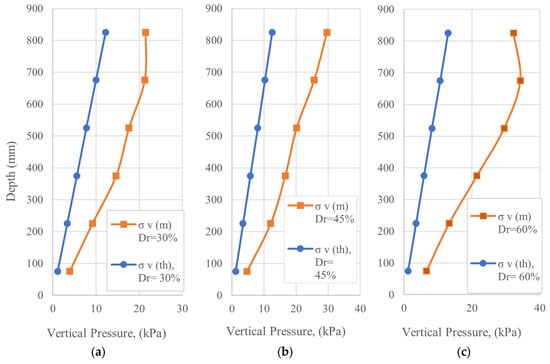
Figure 7.
Theoretical and measured vertical stress: (a) Dr = 30%; (b) Dr = 45%; (c) Dr = 60%.
In all cases, the measured stress exceeded the theoretical value due to locked-in stresses or the overconsolidation effect, which is represented by the overconsolidation ratio (OCR). The OCR was calculated using the following expression:
where ) is theoretical vertical stress and ( is the measured vertical stress, corresponding to the tests performed at different relative densities.
The analytical model proposed to estimate the overconsolidation ratio (OCR) is based on a regression equation that combines depth (z) and relative density (Dr) into a single predictive formula:
where A, B, and C are model coefficients determined as functions of Dr:
Figure 8 illustrates that both the experimental test results and the proposed analytical model for OCR estimation are in strong agreement with previous studies, which consistently found that compaction and surface densification processes significantly elevate OCR in sand, especially near the ground surface [10,11,25,26,27,28].
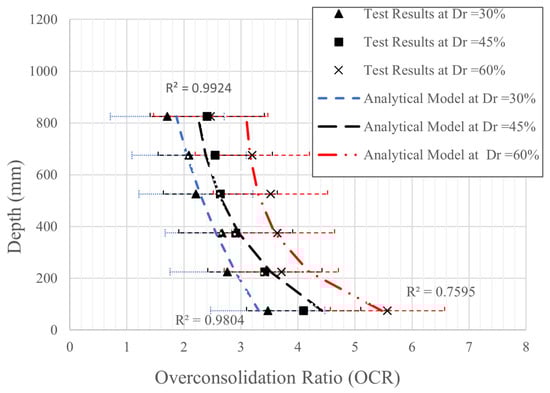
Figure 8.
Depth profiles of overconsolidation ratio (OCR) for sand at relative densities.
10. Pile Driving and Static Load Testing
Following the completion of the loading mechanism setup, the connection of the pile to the actuator, and sand preparation at the specified relative density, each pile model was driven into the compacted sand at a constant rate of 15 mm per minute, as recommended by Hanna and Nguyen [29], until the designated embedment depth was reached, as illustrated in Figure 9a,b. The loading system, operated via “Kollmorgen Workbench 2.11.0.8192” software, precisely managed the driving and testing process. The test tank was filled with sand in sequentially divided layers and compacted to the target relative densities of Dr = 30%, 45%, and 60%. This procedure was conducted for embedment length ratios (L/D) of 6, 9, and 12 using the 63 mm pile model as depicted in Figure 9a, and 15 and 20 using the 38 mm pile model as presented in Figure 9b.
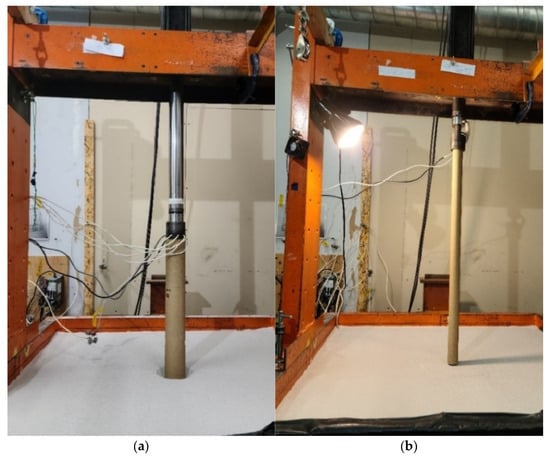
Figure 9.
Testing procedure: (a) 63 mm pile diameter model; (b) 38 mm pile diameter model.
Once the pile reached the target embedment ratio, installation stresses were mitigated by resetting the load cells. The static pile test was conducted by applying a constant displacement rate of −1.5 mm/min, in accordance with ASTM D3689 [30], which specifies standardized procedures for performing static axial tensile (uplift) load tests on deep foundations to evaluate their load–displacement behavior. Using an electric actuator, the pile model was extracted to a total displacement of −15 mm over a duration of 600 s. This was followed by unloading and reading reset, after which an uplift test of equal displacement and duration was performed at the same embedment depth. The pile was then advanced to the next embedment ratio, and the testing sequence was repeated. This systematic approach enabled the evaluation of shaft resistance under uplift loading conditions across varying embedment ratios (L/D), relative densities (Dr), and pile diameters (Dout), providing a robust experimental framework for the study.
11. Pile Load Test Results
Measured Uplift Load Capacities
The ultimate load capacity was determined using the Single Tangent Method from the load–displacement curve, identifying the point at which the slope of the curve reached its steady minimum value. Figure 10a and Figure 9b present the shaft resistance (load–displacement behavior) of model piles subjected to uplift (tension) loading for a range of relative densities (Dr) and embedment ratios (L/D) for both 63 mm and 38 mm pile diameters, respectively. In both subfigures, the maximum uplift resistance increases systematically with higher relative density and greater embedment ratio. For the 63 mm pile, dense sand (Dr = 60%) and higher L/D ratios yield significantly greater shaft resistance and stiffer initial response, with the load–displacement curves showing a rapid increase in load followed by gradual plateauing, characteristic of shaft resistance mobilization and subsequent ductile behavior, as presented in Figure 10a. A notable feature in the load–displacement curves for the 38 mm pile is the similarity in shaft resistance observed for different combinations of embedment ratio (L/D) and relative density (Dr). For example, at L/D = 20 with Dr = 30%, the peak shaft resistance is nearly equal to that at L/D = 15 with Dr = 45%. A similar trend appears at higher densities, with L/D = 20 and Dr = 45% yielding shaft resistance comparable to L/D = 20 and Dr = 60%, as evidenced in Figure 10b. These results indicate that higher relative density can offset lower embedment, and vice versa, leading to similar uplift performance. This pattern highlights the interplay between relative density and embedment ratio, both of which are critical for predicting pile shaft resistance in sandy soils. In contrast, for larger diameter piles (D = 63 mm), increases in embedment ratio have a greater impact on shaft resistance than changes in relative density.
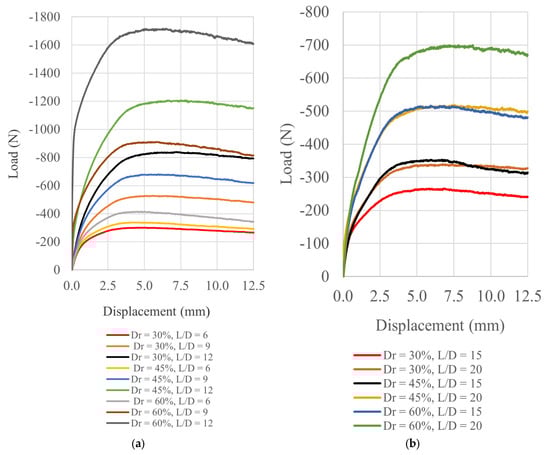
Figure 10.
Shaft resistance of model piles under uplift testing (Tp) at varying relative densities (Dr) and embedment ratios (L/D): (a) 63 mm pile model; (b) 38 mm pile model.
In this study, repeatability was assessed by performing two independent tests at a relative density of 60% for each pile geometry. For the 38 mm and 63 mm diameter piles, tests were repeated at embedment ratios of 15 and 9, respectively, and the measured load–displacement and stress responses showed very good agreement, as illustrated in Figure 11a,b, confirming the consistency of the specimen preparation and loading procedures.
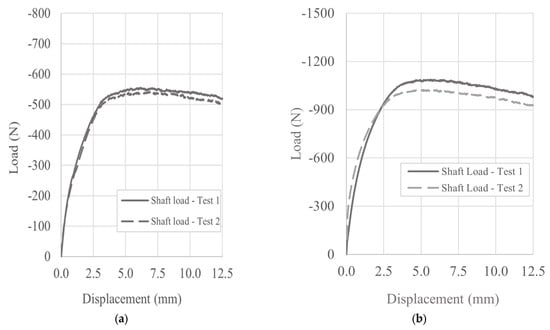
Figure 11.
Test results of the following: (a) repeated test for (Tp-A-60-15); (b) repeated test (Tp-B-60-9).
12. Ultimate Shaft Resistance
As indicated by the load–settlement curves discussed in the previous chapter, shaft resistance reached a peak before exhibiting a slight reduction and eventually stabilizing as pile displacement increased toward the end of the test. These findings are consistent with Foray et al. [31], whose pile load tests also showed that shaft resistance increased with both pile depth and relative density. Additionally, the ultimate shaft resistance of the 63 mm and 38 mm pile models versus the relative depth (L/D) under pure uplift loading is shown in Figure 12.
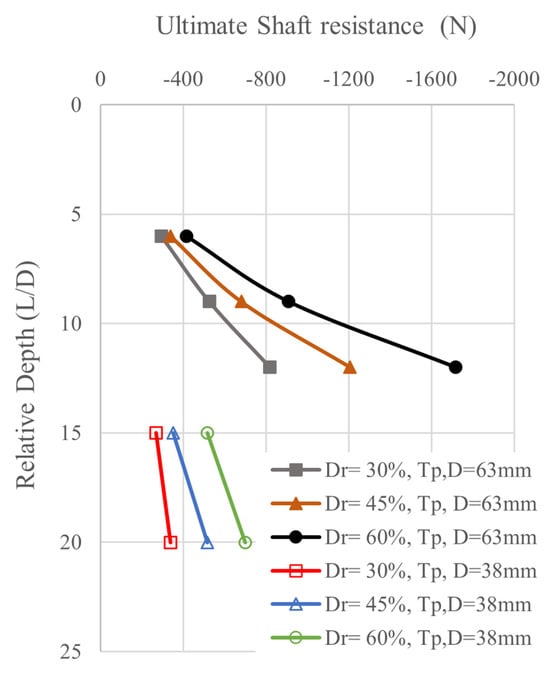
Figure 12.
Ultimate shaft resistance of piles subjected to uplift loading (Tp).
For all relative densities, as the embedment ratio increases, the ultimate shaft resistance also increases. This is due to the increase in earth pressure and the longer pile length, which enhances the shaft pile resistance capacity. However, the increase in shaft resistance is less significant for the 38 mm pile model compared to the 63 mm pile model. This difference is mainly due to the smaller diameter of the pile, which results in a lower shaft resistance capacity. An increase in relative density results in substantially higher ultimate shaft resistance for both pile diameters, as seen in Figure 12. This trend is consistent with prior experimental findings; Han et al. [32] demonstrated that increasing the sand relative density leads to a significant increase in shaft friction and the ultimate resistance of non-displacement piles. Denser sand packs more tightly around the pile, increasing interparticle friction and normal stress at the interface, which enhances resistance. Similar findings are reported by Nagai et al. [33], who noted up to 1.15 times greater shaft resistance in high-density backfill compared to looser conditions. Thus, relative density is a critical factor in mobilizing shaft resistance in sand. Moreover, Shaft resistance in sands is mobilized through shear stresses that develop along the pile–soil interface as horizontal effective stresses build up during loading. In this study, the evolution of these horizontal stresses along the pile shaft, which directly governs the mobilized shaft resistance, is illustrated in Figure 13.
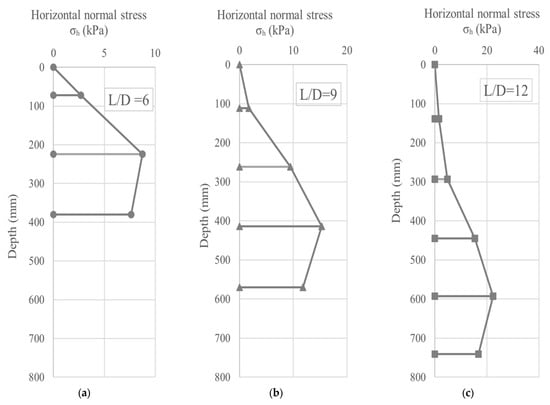
Figure 13.
Horizontal normal stress at 30% under pure loading at different embedment ratios: (a) L/D = 6; (b) L/D = 9; (c) L/D = 12.
13. Impact of Soil Density and Pile Geometry on Ks
By conducting axial load experiments on model piles with different materials (steel, timber, and composite piles) embedded in sand at varying relative densities, the lateral earth pressure coefficient can be back-calculated from measured shaft friction resistance and used to develop predictive equations applicable to field conditions [34]. Figure 14 displays the relationship between the lateral earth pressure coefficient () and the embedment ratio (L/D) for model piles tested under tension (Tp-Test) at two pile diameters (D = 63 mm and 38 mm) and three different relative densities (30%, 45%, and 60%). Additionally, the 63 mm pile consistently achieves higher Ks values than the 38 mm pile at the same relative density and embedment ratio as shown in Table 3.
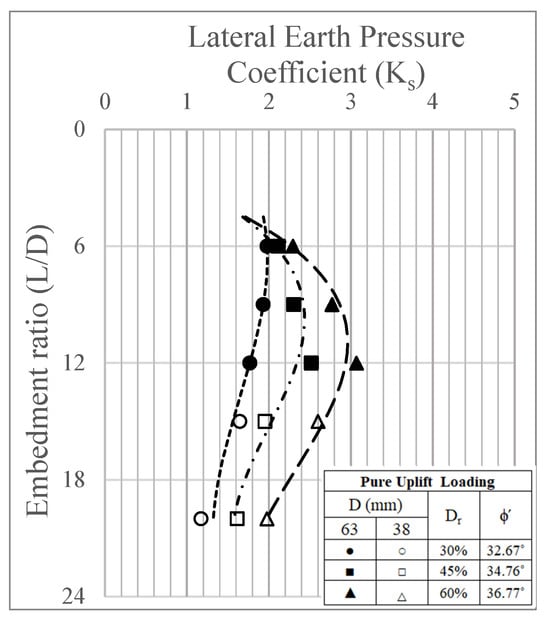
Figure 14.
Earth pressure coefficients () for piles with diameters of 38 mm and 63 mm.
Table 3.
Earth pressure coefficients () for piles with diameters of 38 mm and 63 mm.
However, for D = 38 mm, at L/D = 15 is higher than at L/D = 20, which might represent the critical depth for the pile as indicated in Figure 14. At L/D = 20, the pile is likely at a depth where the surrounding soil becomes more confined, and the lateral resistance does not increase significantly, causing a slight reduction in . Larger pile diameters (D = 63 mm) result in higher values compared to smaller diameters (D = 38 mm), reflecting more substantial interaction with the surrounding soil. In all conditions, denser sands provide better lateral resistance, and the effect of relative density remains significant across all embedment ratios.
The lateral earth pressure coefficient () under pure uplift loading was determined using third-degree polynomial regression, as depicted in Figure 9. The resulting regression equations for (Equations (11), (13) and (15)) were each incorporated into the general shaft resistance equation (Equation (10)) to calculate depth-dependent shaft resistance () at relative densities of 30%, 45%, and 60%, respectively.
where D is the external diameter of the pile; Ks(z) is the coefficient of earth pressure at depth z; δ is the interface friction angle between the pile and sand; γ is the unit weight of sand; and L is the embedded length of the pile. The cubic regression adopted for as a function of is purely empirical, but its magnitude and trends are consistent with classical earth pressure concepts and the expected influence of overconsolidation. For Dr = 60% , the fitted values along the pile are substantially higher than the Rankine active coefficient and even exceed the at-rest value estimated from , reflecting the increase in horizontal effective stress associated with the measured overconsolidation ratios along the shaft. This behavior is compatible with theoretical expressions for overconsolidated soils in which grows with OCR, so the polynomial is best viewed as a convenient interpolation of how this enhanced confinement varies with embedment rather than as a new fundamental law; its applicability is therefore limited to the tested range of and stress history.
For Dr = 30%, (ϕ = 32.67°):
For Dr = 45%, (ϕ = 34.76°):
For Dr = 60%, (ϕ = 36.77°):
14. Model Validation
To validate the proposed analytical model, calculated shaft resistance values () were compared with experimental results obtained from pile load tests. Although the model was developed using horizontal stress data from the same tests, the validation remains valid as Ks was derived from localized measurements, while reflects global pile behavior. The analytical expressions, developed through the integration of regression-based Ks(z), were not directly fitted to the total values. This approach ensures that the model is assessed by its ability to predict overall shaft performance.
The consistency between predicted and measured values demonstrates the reliability of the model for practical application. The proposed analytical model was validated against three independent field studies, as summarized in Table 4. Despite some deviations, the predicted shaft resistances generally align well with the observed experimental trends. The relatively large error for Briaud et al. [35] in Table 4 is acknowledged and has been discussed in this section. This discrepancy is mainly attributed to differences between the conditions and assumptions underlying the present analytical model and those of the original field tests, including pile geometry, installation method, and stress history of the sand, which are only approximately represented in the input parameters.
Table 4.
Comparison between analytical predictions and published results.
The prediction errors of the unit shaft resistance ranged from 13.2% to 39.5% falls within an acceptable range for geotechnical analyses, considering inherent soil variability and testing limitations.
15. Critical Depth Analytical Model
Figure 15 presents the variation in the embedment critical depth ratio (Lc/D) with the angle of shearing resistance (ϕ′). The experimental results obtained from the pure uplift tests are plotted alongside the predictions of the proposed analytical model and the empirical relationship reported by Das [17].
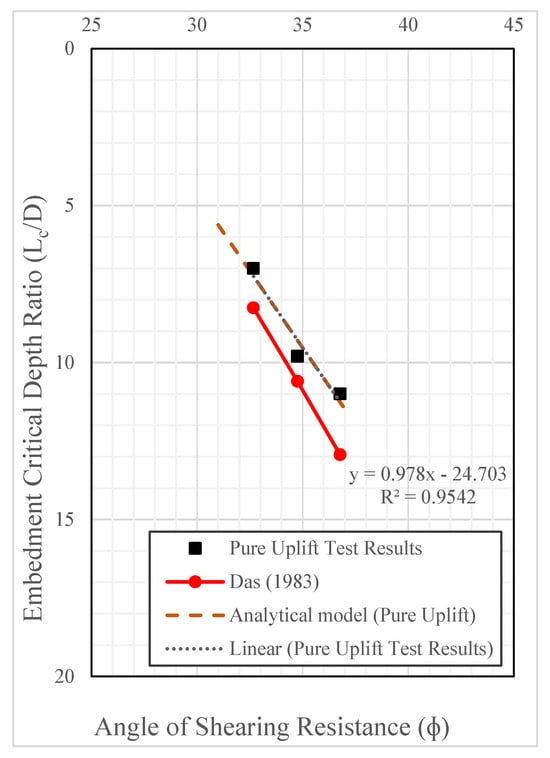
Figure 15.
Analytical model of critical depth ratio (Lc/D) under pure uplift loading [17].
The analytical model demonstrates a clear linear dependence of the critical depth ratio on ϕ′, with a coefficient of determination R2 = 0.95, indicating an excellent correlation, which can be expressed as follows:
This formulation explicitly incorporates the angle of shearing resistance, thereby providing a more fundamental representation of soil strength parameters. In contrast, the model by Das [17] was primarily based on relative density, without direct reference to ϕ′. However, since ϕ′ increases with increasing relative density, the two approaches are inherently linked. The alignment of the proposed model with the results of Das [17] illustrates that both approaches capture the same physical mechanism, where soils with higher relative density mobilize uplift resistance more rapidly, resulting in smaller values of Lc/D. The friction angle range investigated in this study (ϕ′ = 32.6–38°) is representative of many loose, medium, and dense sands commonly encountered in foundation engineering practice, and thus the proposed critical depth model remains practically relevant within this context; however, it has not yet been verified for very loose sands with lower friction angles or for highly angular/very dense granular materials exhibiting markedly higher ϕ′ values.
Overall, the analytical model exhibits close agreement with the empirical formulation of Das [17], while offering broader applicability by explicitly accounting for ϕ′. This convergence between experimental, analytical, and empirical trends reinforces the reliability of the proposed approach in evaluating critical depth under uplift loading conditions.
16. Conclusions
- Uplift load tests in overconsolidated sand confirmed that shaft resistance () increases with pile diameter, relative density (), and embedment ratio (L/D) up to the critical depth (), beyond which resistance plateaus due to confinement effects.
- The earth pressure coefficient () and shaft resistance were strongly influenced by sand density and pile geometry, highlighting the importance of pile–soil interaction under uplift conditions.
- An empirical model of overconsolidated ratio (OCR) correlation was developed, offering a practical approach for predicting preconsolidation effects in sands. Nevertheless, additional experimental data under broader soil, embedment ratio, and geometry of pile are required to further validate this model.
- A design chart relating to the friction angle (ϕ) demonstrated that Ks increases with ϕ, reflecting enhanced lateral confinement and higher shaft resistance with steeper friction angles.
- The analytical model for Qs, based on the earth pressure equation and validated for Dr = 30%, 45%, and 60%, showed good agreement with both test data and previous studies.
- The empirical equation for (/D) as a function of (ϕ) confirmed that critical depth increases with increasing friction angle, aligning with the observations of Das [17].
- Comparable uplift capacities were obtained from different combinations of L/D and Dr, indicating a compensatory relationship between embedment depth and soil density.
- For instance, L/D = 20 at = 30% produced shaft resistance analogous to L/D = 15 at = 45%, while L/D = 20 at = 45% matched L/D = 20 at = 60%. However, for the cases cited in the text, the computed values are /(γ DL2 = 1.04) for L/D = 20 at Dr = 30% and /(γ DL2 = 1.87) for L/D = 15 at = 45%. These results indicate that the two combinations do not exhibit truly equivalent uplift performance when expressed in dimensionless form.
- These findings highlight design flexibility, allowing optimization of either embedment or relative density to achieve desired uplift capacity without excessive pile depth.
- Collectively, the results provide a rational framework for understanding soil–pile interaction under uplift loading and improve the basis for designing pile foundations in overconsolidated sands.
Author Contributions
Investigation, A.A.; data curation, A.A.; methodology, A.A.; software, A.A.; writing—review and editing, A.A.; supervision, A.H. All authors have read and agreed to the published version of the manuscript.
Funding
This research received no external funding.
Institutional Review Board Statement
Not applicable.
Informed Consent Statement
Not applicable.
Data Availability Statement
The raw data supporting the conclusions of this article will be made available by the authors on request.
Conflicts of Interest
The authors declare no conflict of interest.
Nomenclature
The following symbols are used throughout this paper:
| As | Pile shaft area |
| A—Tp | Axial Uplift Loading series for 38 mm pile model |
| Axial Uplift Loading series for 63 mm pile model | |
| D | Pile Diameter |
| Dr | Relative density (%) |
| fs | Mobilized shaft friction |
| Ks | Lateral earth pressure coefficient on the pile shaft |
| Coefficient of earth pressure at depth z | |
| Ku | Uplift lateral earth pressure coefficient |
| L | Pile embedment depth |
| Ratio Pile embedment critical depth | |
| OCR | Overconsolidation ratio |
| Ultimate shaft resistance | |
| Axial Uplift Loading | |
| z | Depth variable |
| Pile-soil interface friction angle | |
| Effective unit weight of soil | |
| γ | Unit weight of the sand |
| Vertical Effective stress | |
| Angle of shearing resistance |
References
- Meyerhof, G.G. Uplift Resistance of Inclined Anchors and Piles. In Proceedings of the 8th ICSMFE, Moscow, USSR, 6–11 August 1973; pp. 167–172. [Google Scholar]
- Vesic, A.S. Design of Pile Foundations. NCHRP Synthesis of Highway Practice 1977. Available online: https://trid.trb.org/View/60308 (accessed on 10 December 2025).
- Poulos, H.G.; Davis, E.H. Pile Foundation Analysis and Design; The National Academies of Sciences, Engineering, and Medicine: Washington, DC, USA, 1980. [Google Scholar]
- Ghaly, A.; Hanna, A. Experimental and Theoretical Studies on Installation Torque of Screw Anchors. Can. Geotech. J. 1991, 28, 353–364. [Google Scholar] [CrossRef]
- Fang, L.; Brown, M.; Davidson, C.; Wang, W.; Sharif, Y. A 1g Model Experimental Study on the Effects of Installation Parameters on Vibratory Driving Performance of Monopiles. In Proceedings of the ECPMG 2024: 5th European Conference on Physical Modelling in Geotechnics; International Society for Soil Mechanics and Geotechnical Engineering, Delft, The Netherlands, 2–4 October 2024. [Google Scholar]
- Manthey, S.; Vogt, S.; Cudmani, R.; Kidane, M. Experimental Study on the Time-Dependent Resistance of Open-Ended Steel Piles in Sand. Geotechnics 2024, 4, 985–1006. [Google Scholar] [CrossRef]
- Ma, H.; Ma, Y.; Zhu, L.; Zhang, H. Experimental Study on the Difference Mechanism of Shaft Resistance between Uplift Piles and Compressive Piles. Appl. Sci. 2023, 13, 3158. [Google Scholar] [CrossRef]
- Kulhawy, F.H.; Kozera, D.W.; Withiam, J.L. Uplift Testing of Model Drilled Shafts in Sand. J. Geotech. Eng. 1979, 105, 31–47. [Google Scholar] [CrossRef]
- Jeevagan, P. Understanding over Consolidation Ratio in Geotechnical Design. Available online: https://www.vjtech.co.uk/ocr-understanding-over-consolidation-ratio-in-geotechnical-design/ (accessed on 10 December 2025).
- Massarsch, K.R.; Fellenius, B.H. Deep Compaction of Sand Causing Horizontal Stress Change. Geotech. Eng. J. SEAGS AGSSEA 2020, 51, 9–21. [Google Scholar]
- Monaco, P.; Marchetti, D. Evaluation of OCR in Sand from DMT & CPT. In In Situ and Laboratory Characterization of OCR Subsoil, 6th International Workshop; Exemplum: Poznań, Poland, 2017; pp. 69–80. [Google Scholar]
- Chang, M.F. Interpretation of Overconsolidation Ratio from In Situ Tests in Recent Clay Deposits in Singapore and Malaysia. Can. Geotech. J. 1991, 28, 210–225. [Google Scholar] [CrossRef]
- Sui, S.; Zhang, X.; Lu, K.; Li, Z.; Liu, W.; Xu, H.; Han, P. Finite Element Analysis of Combined Bearing Characteristics of Pile–Soil Interaction in Composite Foundation. Appl. Sci. 2024, 14, 3894. [Google Scholar] [CrossRef]
- Ukritchon, B.; Keawsawasvong, S. Design Equations of Uplift Capacity of Circular Piles in Sands. Appl. Ocean Res. 2019, 90, 101844. [Google Scholar] [CrossRef]
- Chattopadhyay, B.C.; Pise, P.J. Uplift Capacity of Piles in Sand. J. Geotech. Eng. 1986, 112, 888–904. [Google Scholar] [CrossRef]
- Kraft, L.M. Performance of Axially Loaded Pipe Piles in Sand. J. Geotech. Eng. 1991, 117, 272–296. [Google Scholar] [CrossRef]
- Das, B.M. A Procedure for Estimation of Uplift Capacity of Rough Piles. Soils Found. 1983, 23, 122–126. [Google Scholar] [CrossRef]
- De Nicola, A.; Randolph, M.F. Tensile and Compressive Shaft Capacity of Piles in Sand. J. Geotech. Eng. 1993, 119, 1952–1973. [Google Scholar] [CrossRef]
- Altaee, A.; Fellenius, B.H.; Evgin, E. Load Transfer for Piles in Sand and the Critical Depth. Can. Geotech. J. 1993, 30, 455–463. [Google Scholar] [CrossRef]
- Fellenus, B.H.; Altaee, A.A.; Kulhawy, F.H. Critical Depth: How It Came into Being and Why It Does Not Exist. Proc. Inst. Civ. Eng. Geotech. Eng. 1996, 119, 244. [Google Scholar]
- Kim, S.-R.; Chung, S.-G. Equivalent Head-Down Load vs. Movement Relationships Evaluated from Bi-Directional Pile Load Tests. KSCE J. Civ. Eng. 2012, 16, 1170–1177. [Google Scholar] [CrossRef]
- Garnier, J.; Gaudin, C.; Springman, S.M.; Culligan, P.J.; Goodings, D.; Konig, D.; Kutter, B.; Phillips, R.; Randolph, M.F.; Thorel, L. Catalogue of Scaling Laws and Similitude Questions in Geotechnical Centrifuge Modelling. Int. J. Phys. Model. Geotech. 2007, 7, 1–23. [Google Scholar] [CrossRef]
- Vakili, R. Load Sharing Mechanism of Piled-Raft Foundation in Sand. Ph.D. Thesis, Concordia University, Montreal, QC, Canada, 2015. [Google Scholar]
- SingleTact. SingleTact Miniature Force Sensors. Available online: https://www.eu.singletact.com (accessed on 10 December 2025).
- Brzeziński, K.; Ciężkowski, P.; Józefiak, K.; Bąk, S.; Michalczyk, R.; Kwaśniewski, A. Enhancing Plate Compactor Efficiency: A Study on Frequency Effects for Different Soil Types. Transp. Geotech. 2024, 49, 101393. [Google Scholar] [CrossRef]
- Choo, H.; Lee, W.; Lee, C.; Kim, Y.-S.; Lee, M.-J. Perception of Overconsolidated States of Coarse-Grained Soils Using DMT Results. In Proceedings of the Third International Conference on the Flat Dilatometer DMT’15, Rome, Italy, 14–17 June 2015; pp. 205–212. [Google Scholar]
- Verbrugge, J.-C.; Schroeder, C. Geotechnical Correlations for Soils and Rocks; Wiley: Hoboken, NJ, USA, 2018. [Google Scholar]
- Krogh, L.; Quinteros, S.; Engin, H.K.; Lunne, T. Revisiting Interpretation of Relative Density from Shallow Depth CPTs in Sand. Can. Geotech. J. 2022, 59, 808–826. [Google Scholar] [CrossRef]
- Hanna, A.; Nguyen, T.Q. Shaft Resistance of Single Vertical and Batter Piles Driven in Sand. J. Geotech. Geoenviron. Eng. 2003, 129, 601–607. [Google Scholar] [CrossRef]
- ASTM D3689–07; Standard Test Methods for Deep Foundations under Static Axial Tensile Load. ASTM: West Conshohocken, PA, USA, 2007.
- Foray, P.; Balachowski, L.; Colliat, J.-L. Bearing Capacity of Model Piles Driven into Dense Overconsolidated Sands. Can. Geotech. J. 1998, 35, 374–385. [Google Scholar] [CrossRef]
- Han, F.; Salgado, R.; Prezzi, M.; Lim, J. Shaft and Base Resistance of Non-Displacement Piles in Sand. Comput. Geotech. 2017, 83, 184–197. [Google Scholar] [CrossRef]
- Nagai, H. Shaft Resistance of Piles Close to Backfilled Sand Columns. GEOMATE J. 2021, 21, 121–128. [Google Scholar]
- Aksoy, H.S.; Taher, N.R.; Ozpolat, A.; Gör, M.; Edan, O.M. An Experimental Study on Estimation of the Lateral Earth Pressure Coefficient (K) from Shaft Friction Resistance of Model Piles under Axial Load. Appl. Sci. 2023, 13, 9355. [Google Scholar] [CrossRef]
- Briaud, J.; Tucker, L.M. Measured and Predicted Axial Response of 98 Piles. J. Geotech. Eng. 1988, 114, 984–1001. [Google Scholar] [CrossRef]
- Stas, C.V.; Kulhawy, F.H. Critical Evaluation of Design Methods for Foundations under Axial Uplift and Compression Loading; Final Report; Cornell University: Ithaca, NY, USA, 1984. [Google Scholar]
- Fellenius, B.H. Unified Design of Piles and Pile Groups. Transp. Res. Rec. 1989, 1169, 75–82. [Google Scholar]
- Hanna, A.M.; Afram, A. Pull-Out Capacity of Single Batter Piles in Sand. Can. Geotech. J. 1986, 23, 387–392. [Google Scholar] [CrossRef]
Disclaimer/Publisher’s Note: The statements, opinions and data contained in all publications are solely those of the individual author(s) and contributor(s) and not of MDPI and/or the editor(s). MDPI and/or the editor(s) disclaim responsibility for any injury to people or property resulting from any ideas, methods, instructions or products referred to in the content. |
© 2026 by the authors. Licensee MDPI, Basel, Switzerland. This article is an open access article distributed under the terms and conditions of the Creative Commons Attribution (CC BY) license.