Abstract
The Transylvanian Basin is an intra-Carpathian sedimentary unit displaying complex tectonic and sedimentary evolution that started in the Late Cretaceous. This study presents a geotechnical characterization of three Paleogene lithostratigraphic units located in the northwestern part of the basin, i.e., Brebi, Mera, and Moigrad. These formations record the transition from marine carbonate facies to brackish and subsequently fluvial environments, controlled by tectonic uplifts, marine regressions, and fluctuations in sediment supply. A total of 583 soil samples were collected through geotechnical boreholes and analyzed in the laboratory according to EN ISO standards, assessing natural moisture content, bulk density, grain size distribution, Atterberg limits, carbonate content, unconfined compressive strength, and shear strength parameters. Characteristic values of these properties were determined based on probabilistic distributions. The analyzed formations exhibit well-differentiated lithological and geotechnical characteristics, primarily governed by the degree of plasticity and the presence of calcium carbonate. The Brebi Formation predominantly consists of medium-plasticity clays with highly to very highly carbonate content, indicating a partially cemented microstructure. The Mera Formation is mainly composed of high-plasticity clays having a variable content of carbonates, with frequent sandy intercalations, resulting in significant variability in mechanical properties. The Moigrad Formation consists of two distinct lithological complexes: a clay-rich complex composed of variably plastic calcareous clays spanning all four plasticity classes and a sandy unit made up of weakly cohesive sediments with a granular structure and locally developed carbonate microcementation.
1. Introduction
1.1. General Frame
Modern urban development increasingly requires land for new industrial and residential buildings, as well as for a rapidly expanding and densifying infrastructure. A representative example in this regard is the Cluj-Napoca metropolitan area—the second largest in Romania—where numerous major infrastructure projects are planned or underway. However, accurately predicting ground conditions remains a frequent challenge. In general, geological formations in Romania lack detailed and systematic geotechnical characterization in the scientific literature—a gap that is also evident in the case of the Brebi, Mera, and Moigrad Formations, which constitute the geological substrate of areas targeted for infrastructure expansion within the Cluj-Napoca metropolitan area. Although well-defined from a stratigraphic perspective, these formations have not been rigorously investigated in terms of their physical and mechanical properties. Lithological complexity, variable calcium carbonate content, and differences in cohesion and degree of cementation significantly influence their mechanical behavior, which is a key factor in the design of underground works, deep foundations, and earth structures.
For the investigated area, previous studies and research have focused mainly on the identification and characterization of landslides and on delineating zones considered unstable. These works have demonstrated a high potential for slope instability and have been primarily based on geomorphological analyses and regional mapping [1,2,3]. Nevertheless, they are predominantly descriptive, aiming mainly to outline affected areas, without integrating a detailed analysis of the geotechnical properties of the involved formations.
Earlier contributions by [4] represent one of the first attempts to link slope instability in the Cluj-Napoca area with the geological and hydroclimatic context. The author analyzed landslides that occurred on the southern slope of the Cetățuia Hill during the 1970s and 1980s, highlighting the influence of rainfall on slope stability. Although insightful in identifying the mechanisms driving slope deformation, the study remains largely qualitative and does not include systematic laboratory determinations of physical or mechanical parameters.
A first systematic attempt to address the geotechnical conditions of the city of Cluj-Napoca was made by [5], who elaborated a geotechnical zoning map of the municipality, defining areas with distinct behaviors according to foundation conditions, slope stability, and groundwater infiltration. The authors identified seven main geotechnical units and formulated general construction recommendations, emphasizing drainage, slope stabilization, and the adaptation of foundations to local conditions. Although the study provides an integrated overview of the geological and geomorphological framework of the city, it remains predominantly descriptive and does not include experimental determinations of physical and mechanical parameters, which limits its applicability in quantitative stability assessments.
Complementing this general perspective, [6] focused on the southern slope of the Cetățuia–Hoia Hill, aiming to identify and model the landslide mechanism associated with continental deposits of the Moigrad Formation through analysis of their physical and mechanical behavior. The authors documented the presence of an old, deep-seated rotational landslide and developed a conceptual model explaining its potential reactivation under the influence of water infiltration through discontinuities and local lithological variations, considered the main factors controlling slope instability.
Building on these previous contributions, the main objective of the present study is detailed geotechnical characterization of the Brebi, Mera, and Moigrad Formations, through the determination and statistical processing of an extensive set of physical and mechanical parameters obtained in accordance with current European standards. The purpose of this work is to provide reliable experimentally and statistically validated values that can serve as preliminary data for evaluating ground conditions in terms of construction costs and associated risks. In the context of rapid urban development and numerous infrastructure projects planned in the Cluj-Napoca metropolitan area, such a geotechnical database is indispensable. The added value of this study lies in its systematic nature, the scale of the dataset—which includes approximately 600 analyzed samples—and the unified mode of presentation, which allows for direct comparison of the properties of the three formations.
1.2. Geological Overview
The Transylvanian Basin (Figure 1) is an intra-Carpathian sedimentary area bordered by the Preluca-Țicău crystalline massif to the north, the Eastern Carpathians to the east, the Southern Carpathians to the south, and the Apuseni Mountains to the west [7]. Its development began during the Late Cretaceous due to the main deformation phases of the Carpathian orogen [7,8] and continued until the Pliocene [9,10,11].
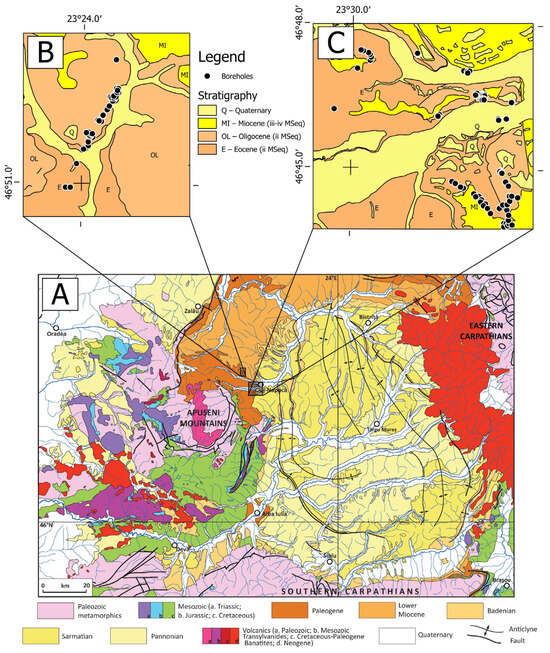
Figure 1.
Geological overview. (A) Geological map of the Transylvanian Basin and its surroundings [12] based on [13]; (B) simplified geological map of the Highway A3 area of interest [14]; (C) simplified geological map of Cluj area of interest [2].
The geological evolution of the Transylvanian Basin is closely linked to two phases of the Alpine orogeny. The initial phase, spanning from Triassic to Early Cretaceous, involved extension and led to the formation of the basin’s basement. The subsequent phase, from Albian till Miocene, involved compression, which initiated the sedimentation process and resulted in the accumulation of the sedimentary cover [7,9,10].
The formation and evolution of the Transylvanian Basin have been influenced by a series of tectonic events that have controlled sedimentation in this area. The existence of major regional discontinuities within the stratigraphic succession has allowed the delineation of four tectonic-stratigraphic megasequences [10], including (i) the Uppermost Cretaceous; (ii) Paleogene; (iii) Lower Miocene; and (iv) Middle to Upper Miocene megasequences [10].
The Late Cretaceous megasequence covers sediments formed in rift and gravitational collapse settings. During the Paleogene, three sag-type basin phases governed the sedimentation environment. Later on, during the Lower Miocene, a flexural basin developed in the central-northern part of the Transylvanian Basin due to the final emplacement of the Pienides nappes. The final sedimentary cycle (Middle-Upper Miocene megasequence) ended the sedimentary succession of the Transylvanian Basin in the Upper Miocene, and it is governed by gravitational tectonics in a back-arc setting [10].
Our area of interest includes lithostratigraphic formations within the Paleogene megasequence, namely from the deposits of the second sag phase of the basin development. The sedimentary succession developed during a post-rift compressional phase, characterized by a relatively constant but low rate of sedimentation [10]. During this period, minor compressional reactivations of Uppermost Cretaceous fault systems occurred, as indicated by the presence of continental facies, which separate three sag-type basin phases [9,10,11].
Within the Paleogene megasequence (Figure 2), sedimentation begins with continental alluvial fans and fluvial deposits (Jibou Formation), which by Bartonian environments progressively change to marine environments. A two-phase (sag 1 and sag 2) transgressive and regressive cycle began and extended until the Early Rupelian, namely the Calata and Turea groups. The groups were built up by the following general succession: evaporites, shallow-marine carbonates, outer shelf marls, and shallow-marine sands, ending with continental fluvial deposits [10].
During the third sag phase, starting from the Early Oligocene, the depositional environment became dominated by siliciclastic terrigenous material [10,15]. Both deepwater and shallow water sediments were deposited. In the western part of the basin, shallow water environments characterize the period, with alternating shallow marine, brackish, and continental successions [16].
In the western part of the basin, which corresponds to our area of interest, the pre-Pyrenean tectonic movements caused the tilting and uplifting of extensive regions in northwestern Transylvania during the Early Priabonian. This geological activity promoted the accumulation of continental sedimentary deposits, specifically the Valea Nadășului Formation [15,17].
The uplift was followed by a transgression [15], leading to a transition from continental to marine sedimentation. This event marks the onset of the second sag subphase of the Paleogene. The early phase of the transgression was marked by the development of evaporitic facies of the Jebucu Formation [18]. This was subsequently overlain by platform carbonates of the Cluj Limestone Formation [19], which gradually transitioned into a carbonate-terrigenous pelitic facies characteristic of the Brebi Formation [15,16,17,18,19,20].
The turbiditic limestone intercalations and bioclastic quartz limestone of the Hoia Limestone [19] that cover the pelitic carbonate-terrigenous facies of the Brebi Formation [19] indicate a rapid marine regression [15]. This regression was caused by an abrupt drop in the planetary ocean level at the beginning of the Oligocene [14,15,17,20,21,22]. The last marine phase of this cycle is represented by the Mera Formation, a relatively thin succession (20 m) with heterogenous lithological composition (clays, sands, sandstones, and bioclastic limestones) [16].

Figure 2.
Lithostratigraphic units and main sediment types of the Paleogene megasequence in the W-NW part of the Transylvanian Basin, adapted from [10,16].
Figure 2.
Lithostratigraphic units and main sediment types of the Paleogene megasequence in the W-NW part of the Transylvanian Basin, adapted from [10,16].

Tectonic movements during the Pyrenean phase of the Early Rupelian resulted in a new uplift of the Transylvanian Basin. As a consequence, the second sag subphase ceased, and the sequence gradually transitioned into fluvial sedimentation characteristic of the Moigrad Formation [10,14,16,17,20,21,22,23].
2. Materials and Methods
2.1. Raw Materials
The soil samples used for laboratory testing were collected during geotechnical borehole investigations conducted under ISO norms. Geographically, the sampling sites are located in an area stretching from the central-southwestern part of Cluj-Napoca municipality, crossing the northern part of Florești commune and extending up to Sânpaul commune, Cluj County (Figure 1). From a geological perspective, the investigated area belongs to the northwestern part of the Transylvanian Basin. The analyzed soil samples are part of the Late Priabonian–Rupelian sedimentary succession (Paleogene), attributed, based on available references [16,17,20], to the Brebi Formation [19], the Mera Formation [24], and the Moigrad Formation [21].
Geotechnical boreholes were drilled to depths of up to 50.0 m below ground level. Soil sampling was carried out over a depth interval of 0.4 m to 50.0 m below ground level, in accordance with EN ISO 22475-1:2021 [25], using continuous rotary drilling and wireline coring techniques.
Single-tube and double-tube core barrels, as well as thin-walled Shelby-type samplers, were employed depending on stratigraphic conditions and soil stiffness. The adopted sampling procedures resulted predominantly in specimens corresponding to sampling category A, with a limited number of samples classified as categories B and C, reflecting local lithological variability and drilling conditions.
In non-cemented sandy units, sampling was performed using thin-walled Shelby-type samplers where feasible, or single-tube core barrels where Shelby sampling was not applicable. Double-tube core barrels were deliberately avoided in these layers to prevent water ingress, sample washing, and loss of material during drilling.
In contrast, cemented sandy horizons (sandstones) were cored using appropriate coring techniques, allowing the recovery of intact specimens suitable for laboratory testing.
Representative coring boxes are presented to give a visual idea of the kind of material under consideration (Figure 3a–d).
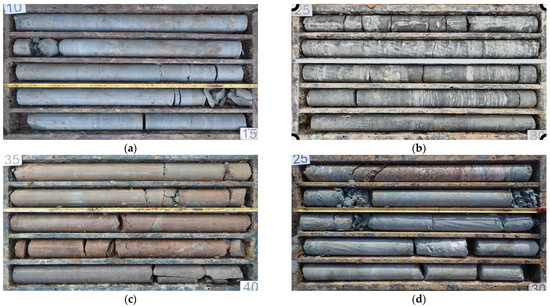
Figure 3.
(a) Representative coring box from the Brebi Formation, (b) representative coring box from the Mera Formation, (c) representative coring box from the Moigrad Formation—clay unit, (d) representative coring box from the Moigrad Formation—sand unit.
A total of 583 soil samples were collected and used to determine the physical and mechanical properties within a specialized laboratory, following current technical standards.
Classification of the collected soil samples was performed according to EN ISO 14688-1:2017 [26] and EN ISO 14688-2:2017 [27] standards, as well as the Unified Soil Classification System (USCS) [28]. The classification was based on physical characteristics determined in the laboratory, specifically grain size distribution and Atterberg limits (plastic limit and liquid limit).
In the present study, the Brebi, Mera, and Moigrad Formations are characterized within a soil-mechanics framework, because their mechanical response is controlled by effective stress, plastic deformation, and progressive degradation of bonding. These features govern stiffness and strength once the material is subjected to excavation and stress redistribution, which correspond to the conditions relevant for most engineering applications.
According to EN ISO 14688-2 [27], materials exhibiting uniaxial compressive strength values exceeding approximately 600 kPa may be classified as rock-type materials. For the investigated formations, the majority of the measured UCS values exceed this threshold, indicating a partially lithified state at the specimen scale. However, the UCS characterizes the behavior of intact material under idealized conditions and does not account for fabric disturbance, fissuring, or the progressive loss of structure that governs field behavior.
Under engineering-scale conditions, strength and stiffness are instead dominated by strain-softening behavior and by evolution from an initially structured state towards a destructured fabric state. In this context, effective stress-based strength parameters remain mechanically meaningful beyond the intact state, whereas the UCS primarily provides information on initial bonding and cementation. The adopted soil-mechanics-based characterization therefore allows consistent interpretation of both intact strength and post-peak behavior within a unified mechanical framework.
2.2. Methods for Testing Geotechnical Parameters
The following geotechnical parameters were determined for the collected soil samples: water content, bulk density, particle density, particle size distribution, Atterberg limits, carbonate content, unconfined compression tests (UCS), unconsolidated undrained (UU) triaxial tests, and direct shear tests (consolidated drained). Based on the laboratory results, secondary parameters such as porosity and degree of saturation were subsequently derived.
The water content was determined according to EN ISO 17892-1:2014 [29]. Soil samples were initially weighed in their natural state and then oven-dried using a forced-ventilation system at a controlled temperature of 105 ± 2 °C until a constant mass was achieved. Soil water content is defined as the percentage ratio between the mass of water lost during drying and the dry mass of the sample.
The bulk density of the soil was determined following EN ISO 17892-2:2014 [30], using either the linear measurement method or the immersion in fluid method. The linear measurement method is used to determine the density of soil specimens with regular shapes, including those prepared for other tests, and encompasses calculating the density as the ratio of the mass to the volume determined from geometric measurements. In contrast, the immersion in fluid method is particularly suitable for irregularly shaped specimens and allows calculation of density as the ratio of the specimen’s mass to its volume, with the latter being obtained indirectly as the difference between the total mass (specimen coated with paraffin) and its apparent mass in fluid.
The particle density was determined following EN ISO 17892-3:2015 [31], using the fluid pycnometer method applied to oven-dried soil samples. The procedure involves weighing a known quantity of dry soil and determining its volume based on the difference in the amount of fluid required to fill the pycnometer with and without the sample.
The particle size distribution of the soil was determined according to EN ISO 17892-4:2016 [32], using mainly the combined method, the sieving method for the coarse fraction (d > 0.063 mm), and the hydrometer method for the fine fraction (d < 0.063 mm).
The Atterberg limits were determined following EN ISO 17892-12:2018 [33]. The liquid limit was determined using the fall cone method, with a standard cone weighing 80 g and a 30° apex angle. The test was carried out at four distinct water content points, with the depth to which the cone penetrated the specimen recorded for each run. Samples were taken from the penetration zone to determine the corresponding water content associated with each recorded penetration depth. The liquid limit was established by graphical interpolation as the water content corresponding to a standard cone penetration depth of 20 mm. The plastic limit was determined on the same material by manually rolling it on a frosted glass plate until cylindrical threads with a diameter of approximately 3 mm were obtained. The plastic limit was defined as the water content at which the threads begin to crack or disintegrate. Based on the determined values of the liquid and plastic limits, the plasticity index and consistency index were calculated.
The carbonate content was determined in accordance with ASTM D4373-14 [34], using the gasometric method. A soil sample (approximately 1 g) was placed in a sealed reaction chamber, and hydrochloric acid (HCl) with a molarity of 1 N was added. The carbon dioxide (CO2) released by the reaction between the carbonates in the sample and the acid generates a measurable pressure proportional to the total carbonate content of the specimen. In geotechnical practice, the carbonate content is expressed as the calcite equivalent percentage (CaCO3%), determined using the standardized method mentioned above. This procedure quantifies the total amount of carbonate minerals in the sample based on their chemical reaction with acid, without distinguishing between individual mineral types (e.g., calcite, aragonite, dolomite, siderite). The results are reported as CaCO3 equivalents, representing the overall carbonate content of the analyzed samples.
The unconfined compressive strength was determined according to EN ISO 17892-7:2017 [35]. The soil specimens, prepared as cylindrical samples, were subjected to axial loading under conditions of unrestrained lateral deformation until failure occurred. The test was performed at a controlled axial strain rate ranging between 1% and 2% of the initial specimen height per minute. The unconfined compressive strength was calculated as the ratio of the maximum recorded force to the corrected cross-sectional area of the specimen. Furthermore, Young’s modulus was determined according to ASTM D7012-14 [36] as the ratio of the increment of axial stress to the corresponding increment of axial strain in the linear elastic range of the stress–strain curve.
Unconsolidated undrained (UU) triaxial tests were performed following EN ISO 17892-8:2018 [37]. The soil specimens were tested in a triaxial cell under undrained conditions, without any prior consolidation stage. The samples were subjected to a constant lateral pressure (σ2 = σ3) maintained throughout the entire duration of the test. Axial loading was applied at a controlled speed of 0.5 mm/min until failure occurred or 20% deformation was achieved. The undrained shear strength (cu) was determined based on the maximum deviator stress recorded during the test and the area of the sample.
The direct shear test was performed following EN ISO 17892-10:2018 [38]. Soil specimens were tested in shear boxes and were initially subjected to constant vertical normal stresses for consolidation purposes. These stresses were maintained throughout the entire duration of the test. Shearing occurred along a predefined horizontal plane by applying a tangential force to the upper part of the shear box, which was displaced relatively to the lower part. The test was carried out under drained conditions, with a shear rate slow enough to ensure that there was no increase in pore water pressure during shearing. Shear strength was determined based on the peak shear stress corresponding to each applied normal stress.
2.3. Statistical Evaluation of the Geotechnical Parameters
In geotechnical practice, for characterization of a geotechnical layer, the parameters are introduced into design as characteristic values (Xk) that have a 95% probability of not being exceeded in a hypothetically unlimited test series [39]. For example, since the force acting on a retaining wall depends on the weight density of the soil behind it, the wall should be designed to withstand an upper estimate of that bulk density; this value is noted as Xk,sup. This means that, for the parameter, which in this case is the bulk density, there is a 95% probability that the real value will be lower than Xk.sup. On the other hand, the lower characteristic value should be used to see if a material is strong enough to carry a particular load (situations where overestimating the magnitude of a material property may be unsafe). In the case of Xk.inf, there is a 95% probability that the value of the parameter will be greater than the lower characteristic value, Xk.inf [40]. These characteristic values are obtained using the probability density function (PDF), where a value depends on the combination of a large number of individuals and random effects, and the 95% confidence limits are compared to the 50% fractile.
2.4. Interpretation of Direct Shear Values
The geotechnical characterization of overconsolidated clays and shales presents significant challenges, due to their complex mechanical behavior. Initial efforts to address this complexity were pioneered in 1966 by Dr. Laurits Bjerrum, who established a foundational framework for understanding the shear strength properties of these materials [41]. Given their potential to exhibit transitional behavior between rock and soil over the lifespan of a civil engineering project, a conservative and practical approach is to classify and analyze these materials as soils to ensure safer design.
All analyzed geological formations and their subunits can be considered as brittle soils that are subject to strain softening. After these types of soils reach the peak of their stress-strain curves, further strain decreases shearing resistance (Figure 4). Due to this property, natural slopes and cuts created in such soils present a high chance of progressive failure [42].
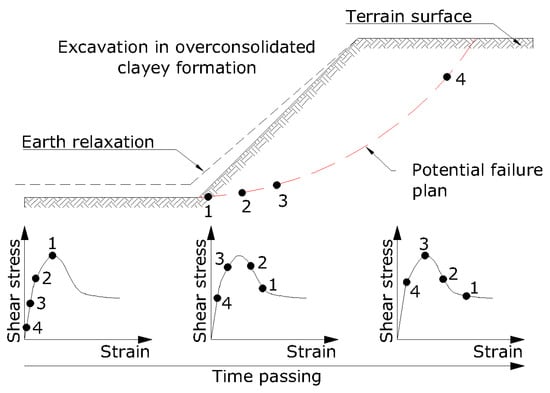
Figure 4.
Progressive failure mechanism on an excavated slope in shales/overconsolidated–clays, illustrating stress relief (“earth relaxation”) and progressive mobilization along a potential failure plane (points 1–4), together with the time-dependent evolution of shear stress versus shear strain shown in the lower plots (time passing from left to right) [42].
In such cases, several authors [43,44,45,46] recommend the use of either fully softened strengths or residual strengths. From analytical practice, such an approach would lead to very conservative results, and in some situations the slope analysis would yield unrealistically deep failure planes. Accordingly, post-peak strength is considered to be the value that more closely simulates in situ behavior. Post-peak strength is recommended to be used for slope stability analysis at depths of 10 m and deeper, because, out of 69 first-time failures in stiff clays, only 11% had a Factor of Safety equal or less to 1 when fully softened values were used [45]. In the upper part, the use of fully softened values can be considered conservative and realistic for the analyzed geological formations. Also, this approach considers a homogenous geological unit with no weak planes, such as pre-existing failure planes or faults.
3. Results
The soil samples analyzed in the laboratory originate from sedimentary deposits of terminal Priabonian to Rupelian age (Paleogene), attributed to the Brebi [19], Mera [24], and Moigrad [21] geological formations.
Based on the physical properties determined in the laboratory according to EN ISO 14688-1 [26] and EN ISO 14688-2 [27] standards, as well as the USCS classification system [28], the samples were grouped into lithological complexes. This approach led to the identification of four distinct lithological units: the Brebi Formation (116 samples), the Mera Formation (67 samples), the Moigrad Formation—clay unit (327 samples), and the Moigrad Formation—sand unit (73 samples). Determination of geotechnical parameters was not uniform across the entire dataset. Test execution was conditioned by sample quality and methodological applicability, resulting in parameter-specific subsets of samples and, consequently, a variable number of determinations for each investigated parameter.
In this paper, the geotechnical parameters of the geological formations (Brebi, Mera, and Moigrad) and their subunits (e.g., Moigrad Formation—sand unit; Moigrad Formation—clay unit) are presented as minimum, maximum, average, superior characteristic value, and inferior characteristic value.
3.1. Brebi Formation
The Brebi Formation [19], also known as the “Bryozoan Marls” [47], of Late Priabonian to Early Rupelian age (Eocene–Oligocene boundary), consists of epicontinental pelitic-carbonate sedimentary deposits [16,17,20]. Lithologically, it is composed predominantly of medium-plasticity clay, with local intercalations of low- and high-plasticity clays. The clays are grey in color and exhibit a very stiff consistency. They are mainly highly calcareous, frequently containing levels with very highly calcareous content, while calcareous levels occur only locally. The formation is fossiliferous, containing fragments of bryozoans, foraminifera, and mollusks.
A total of 48 samples were analyzed for particle size distribution, and the results showed an average composition of 40.26% clay, 53.82% silt, and 5.92% sand. Based on particle size distribution, the material falls within the fine-grained domain (Figure 5).
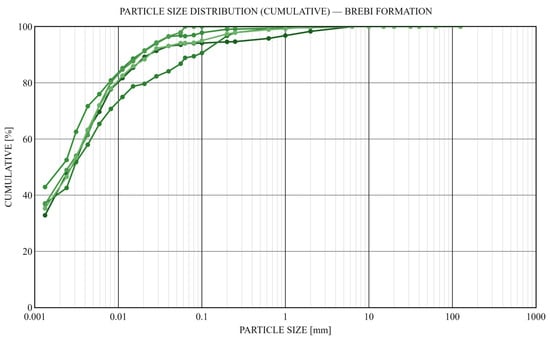
Figure 5.
Particle size distribution (cumulative) for the Brebi Formation. The curves represent the cumulative percentage of particles finer than a given grain size, plotted against particle diameter (mm) on a logarithmic scale. Each curve corresponds to an individual sample.
The statistical evaluation of the physical and mechanical parameters is presented in Table 1, where Vx (coefficient of variation) is included as a statistical descriptor, in accordance with the requirements of EN 1997-2.

Table 1.
Statistical evaluation of the physical and mechanical parameters of the Brebi Formation.
The Brebi Formation, of marine origin, exhibits a mean saturation degree of 84%, with closely aligned upper and lower characteristic values. Regarding the consistency index, the formation can be considered from a geotechnical point of view as very stiff, given the inferior characteristic value of 1.07. The plasticity index ranges from 15% to 47%, with a mean value of 29% and characteristic limits of 27% and 31%.
The bulk unit weight ranges from 18.65 to 23.44 kN/m3, with characteristic values closely aligned around a mean of 21.49 kN/m3. Similarly, the porosity exhibits a narrow distribution of characteristic values clustered around a mean value of 28.52%. The carbonate content exhibits large variation, ranging from 14.33% to 97.58%, with a mean value of 53.75%.
The results of the plasticity index (PI) for the 83 samples from the Brebi Formation for which Atterberg limits were determined reveals a range of values between 15% and 47%. According to the Casagrande (1948) [48] classification system, the distribution of samples indicates a clear predominance of medium-plasticity soils (CIM, LL = 35–50%), which account for 69.9% of the total (Figure 6a). High-plasticity soils (CIH, LL = 50–70%) represent 19.3%, while low-plasticity soils (CIL, LL < 35%) are identified in 10.8% of cases. No sample exceeded the 70% threshold for the liquid limit, indicating the absence of very high-plasticity soils (CIV) in this dataset.
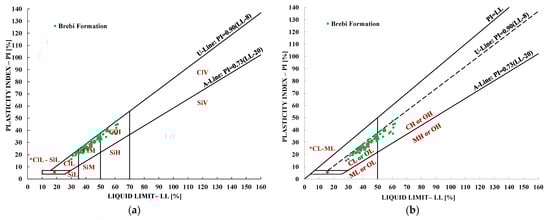
Figure 6.
(a) Soil classification according to ISO standards (plasticity chart) [27]—Brebi Formation, (b) soil classification according to ASTM standards (plasticity chart) [28]—Brebi Formation.
When the same data are expressed using the Unified Soil Classification System Casagrande plasticity chart (Annex B) [28], the samples are grouped into the CL (lean clay) and CH (fat clay) classes, based on the LL = 50% criterion. This representation highlights the dominance of lean clays (CL), which account for 80.7% of the analyzed samples, while fat clays (CH) represent 19.3% (Figure 6b).
Samples were grouped into two categories based on carbonate content: highly calcareous (CaCO3 ≤ 50%) and very highly calcareous (CaCO3 > 50%).
Samples with CaCO3 ≤ 50% exhibit higher median values of water content and plasticity index compared to samples with CaCO3 > 50% (Figure 7a,b). Samples classified as highly calcareous (CaCO3 ≤ 50%) exhibit average values of approximately 32% for the plasticity index (PI) and 13.32% for natural water content. In contrast, soils classified as very highly calcareous (CaCO3 > 50%) systematically display lower values, with a plasticity index of around 26% and a mean natural water content of 10.31%.
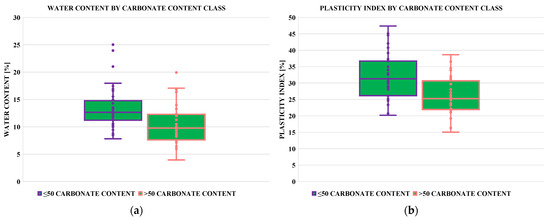
Figure 7.
(a) Comparison of the water content of Brebi Formation samples grouped by carbonate content class: ≤50% and >50% CaCO3; (b) comparison of plasticity index values for Brebi Formation samples grouped by carbonate content class: ≤50% and >50% CaCO3. The rectangles represent the interquartile range (IQR), the horizontal line indicates the median, and the whiskers extend to the minimum and maximum values within 1.5 × IQR. Each point corresponds to an individual tested sample, while those positioned above or below the whiskers represent statistical outliers.
The unconfined compressive strength (UCS) ranges from 911 kPa to 7753 kPa, with a mean value of 3647 kPa. The elastic modulus (E) ranges between 104 and 536 MPa, with an average of 235 MPa. In both cases, the coefficients of variation are around 0.48, yet the lower and upper characteristic values are well-aligned with the arithmetic mean. Samples containing ≤ 50% CaCO3 exhibit higher median values of unconfined compressive strength (UCS) and deformation modulus (E) than samples containing > 50% CaCO3 (Figure 8a,b).
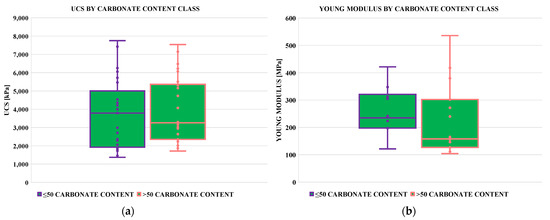
Figure 8.
(a) Comparison of the unconfined compressive strength (UCS) of Brebi Formation samples grouped by carbonate content class: ≤50% and >50% CaCO3; (b) comparison of the Young’s modulus of Brebi Formation samples grouped by carbonate content class: ≤50% and >50% CaCO3. The rectangles represent the interquartile range (IQR), the horizontal line indicates the median, and the whiskers extend to the minimum and maximum values within 1.5 × IQR. Each point corresponds to an individual tested sample, while those positioned above or below the whiskers represent statistical outliers.
In the case of drained shear strengths, a total of 86 samples were analyzed for peak values and 79 samples for post-peak values. The results are presented as an envelope for all determined values (Figure 9a,b).
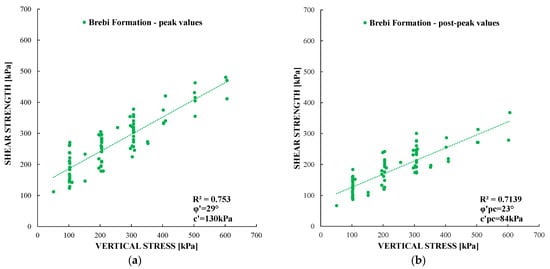
Figure 9.
(a) Results from direct shear analysis of the Brebi Formation–peak values; (b) results from direct shear analysis of the Brebi Formation–post-peak values. The dots represent the experimental data points obtained from direct shear tests, while the dashed line represents the linear regression of the Mohr–Coulomb shear strength criteria, describing the correlation between shear strength and normal stress.
With regard to drained shear strength behavior, the correlation between shear strength and effective vertical stress yielded a coefficient of determination of R2 = 0.753 in the case of peak values and R2 = 0.7139 in the case of post-peak values, indicating good fit of the regression model.
Regarding the shear strength parameters, a reduction is observed between peak and post-peak conditions. The effective angle of friction decreases from 29° to 23°, representing a reduction of approximately 21%. Similarly, the effective cohesion decreases from 130 kPa to 84 kPa, corresponding to a decrease of about 35%. The coefficient of determination remains relatively stable, with R2 maintaining a value of approximately 0.71 under post-peak conditions.
The shear resistance–horizontal displacement curves obtained for the Brebi Formation under normal stresses of 100 kPa, 200 kPa, and 300 kPa show a well-defined peak shear resistance followed by a distinct post-peak reduction (Figure 10a). Peak shear resistance is generally mobilized at relatively small horizontal displacements, after which a rapid decrease in shear resistance is observed. The magnitude of the peak shear resistance increases with increasing normal stress, while the post-peak response tends to stabilize towards comparable residual levels over a limited displacement range.
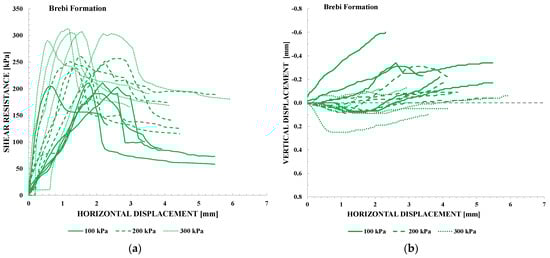
Figure 10.
Shear resistance and volumetric response of representative samples from the Brebi Formation tested under normal stresses of 100 kPa, 200 kPa, and 300 kPa: (a) shear resistance versus horizontal displacement; (b) vertical displacement versus horizontal displacement.
Post-peak shear resistance values were identified based on engineering judgement, corresponding to displacement intervals where further reductions in shear resistance become minor and the curves approach a quasi-stable residual trend.
The volumetric response, expressed as vertical displacement versus horizontal displacement (Figure 10b), shows an initial contraction for most specimens, regardless of the applied normal stress level (100, 200, or 300 kPa), up to peak shear strength. Over the range of horizontal displacement analyzed, the volumetric behavior remains predominantly contractive, although a tendency towards volumetric expansion is observed at the 100 kPa stress level in the post-peak regime. At 200 kPa, volumetric expansion is limited, and at 300 kPa the response remains predominantly contractive. The transition from contraction to dilation generally coincides with, or occurs shortly after, peak shear strength, where present.
3.2. Mera Formation
The Mera Formation [24], assigned to the Rupelian stage of the Oligocene, consists of sedimentary deposits laid down in marine to brackish facies. Lithologically, the succession begins with a packstone-type limestone layer, described by Hofmann [19] as the Hoia Limestone [16,20], overlain predominantly by high-plasticity clays, subordinately by medium- and very high-plasticity clays, and locally by low-plasticity clays, with intercalations of sand layers on the order of tens of centimeters. The formation is predominantly grey in color and displays a very stiff consistency. The sediments are mainly calcareous, frequently containing layers with slightly calcareous or highly calcareous content, while layers with very highly calcareous content occur only sporadically. The formation is fossiliferous, containing fragments of bivalves and echinoids. For granulometric characterization, only the clayey deposits were considered, while limestone layers and sandy intercalations were excluded due to their limited thickness and lack of statistical representativeness.
From a granulometric point of view, the Mera Formation is also fine-grained, characterized by an average composition of 30.96% clay, 56.46% silt, and 12.58% sand, as indicated by particle size distribution analysis of 46 samples (Figure 11). Compared with the Brebi Formation, the Mera Formation exhibits a slightly higher average content of silt and sand.
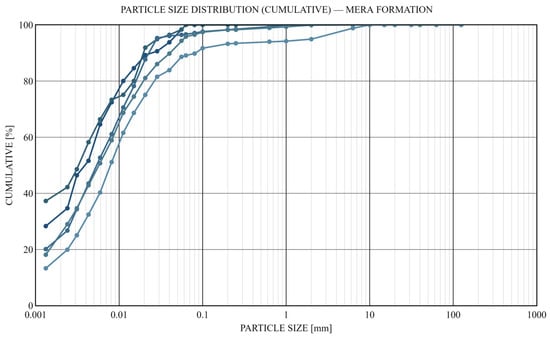
Figure 11.
Particle size distribution (cumulative) for the Mera Formation. The curves represent the cumulative percentage of particles finer than a given grain size, plotted against particle diameter (mm) on a logarithmic scale. Each curve corresponds to an individual sample.
Regarding the physical and mechanical parameters, a statistical evaluation is presented in Table 2.
Table 2.
Statistical evaluation of the physical and mechanical parameters of the Mera Formation.
The Mera Formation is characterized by a mean degree of saturation of 90%. The plasticity index ranges from 16% to 135%, with a mean value of 53%, while the consistency index varies between 0.80 and 1.47, with a mean value of 1.07 and characteristic values of 1.03 and 1.10. The natural bulk unit weight ranges from 19.21 to 23.84 kN/m3, with a mean value of 21.11 kN/m3, whereas porosity varies between 15.42% and 39.62%, with a mean value of 30.77%. The carbonate content ranges from 2.8% to 51.1%, with a mean value of 23.88%.
The results of the plasticity index (PI) for the 41 samples from the Mera Formation for which Atterberg limits were determined reveal wide variability in plastic behavior, with values ranging from 16% to 135%. According to the Casagrande (1948) [48] classification system (Figure 12a), there is a clear predominance of highly plastic soils. Specifically, 41.5% of the samples fall within the high-plasticity class (CIH, LL = 50–70%), while 31.7% are classified as very high-plasticity (CIV, LL > 70%). Medium-plasticity soils (CIM, LL = 35–50%) account for 24.4% of the dataset, whereas low-plasticity (CIL, LL < 35%) soils are rarely observed, being identified in only one case (2.4%).
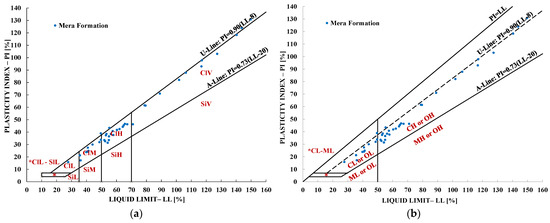
Figure 12.
(a) Soil classification according to ISO standards (plasticity chart) [27]—Mera Formation; (b) soil classification according to ASTM standards (plasticity chart) [28]—Mera Formation.
According to the Unified Soil Classification System classification [28], the Mera Formation is dominated by fat clays (CH), which represent 73.2% of the analyzed samples, while lean clays (CL) account for the remaining 26.8% (Figure 12b).
Samples were grouped into two categories based on carbonate content: calcareous (CaCO3 < 25%) and highly calcareous (CaCO3 ≥ 25%). Samples with CaCO3 < 25% exhibit higher average values of water content and plasticity index compared to samples with CaCO3 ≥ 25% (Figure 13a,b). The samples classified as calcareous (CaCO3 < 25%) exhibit average values of approximately 65% for the plasticity index (PI) and 16.0% for natural water content. In contrast, samples categorized as highly calcareous (CaCO3 ≥ 25%) display lower values, with mean values of 51.3% for PI and 12.5% for natural water content.
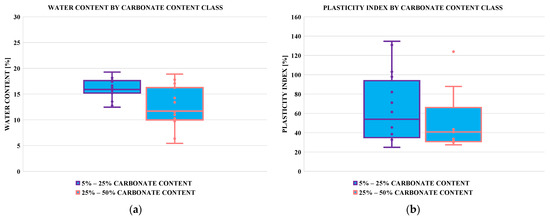
Figure 13.
(a) Comparison of water content of the Mera Formation samples grouped by carbonate content class: 5–25% and 25–50% CaCO3; (b) comparison of plasticity index values of Mera Formation samples grouped by carbonate content class: 5–25% and 25–50% CaCO3. The rectangles represent the interquartile range (IQR), the horizontal line indicates the median, and the whiskers extend to the minimum and maximum values within 1.5 × IQR. Each point corresponds to an individual tested sample, while those positioned above or below the whiskers represent statistical outliers.
In the Mera Formation, unconfined compressive strength (UCS) shows differences between groups defined by calcium carbonate (CaCO3) content (Figure 14a). Samples classified as highly calcareous (CaCO3 ≥ 25%) exhibit an average UCS of 5155.9 kPa, ranging from 1885 kPa to 10,128.0 kPa. In contrast, the calcareous samples (CaCO3 < 25%) show a considerably lower average strength of approximately 1765.4 kPa, with values between 565 kPa and 3152 kPa.
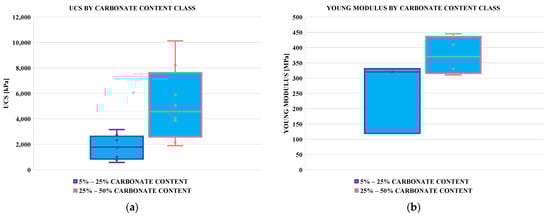
Figure 14.
(a) Comparison of unconfined compressive strength (UCS) for Mera Formation samples grouped by carbonate content class: 5–25% and 25–50% CaCO3; (b) comparison of Young’s modulus for Mera Formation samples grouped by carbonate content class: 5–25% and 25–50% CaCO3. The rectangles represent the interquartile range (IQR), the horizontal line indicates the median, and the whiskers extend to the minimum and maximum values within 1.5 × IQR. Each point corresponds to an individual tested sample, while those positioned above or below the whiskers represent statistical outliers.
The measured values of the elastic modulus (E) also show higher stiffness in samples with greater carbonate content (Figure 14b). Specifically, highly calcareous samples exhibit an average E of 374.1 MPa, ranging from 310.5 to 445.2 MPa, while the calcareous group presents a lower average of 256.7 MPa, with values between 119.1 and 330.8 MPa.
In the case of drained shear strengths, a total of 35 samples were analyzed for peak values and 32 samples for post-peak values. The results are presented as an envelope for all determined values in Figure 15a and Figure 15b, respectively.
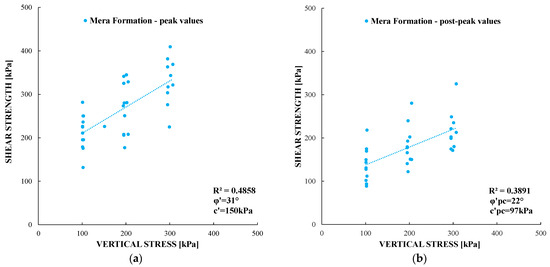
Figure 15.
(a) Results from direct shear analysis of the Mera Formation–peak values; (b) results from direct shear analysis of the Mera Formation–post–peak values. The dots represent the experimental data points obtained from direct shear tests, while the dashed line represents the linear regression of the Mohr–Coulomb shear strength criteria, describing the correlation between shear strength and normal stress.
Regarding the drained shear strength behavior, the correlation between shear strength and effective vertical stress resulted in a lower coefficient of regression, with an R2 just of 0.486 for the peak values and 0.389 in the case of the post-peak values.
Analyzing the reduction in shear strength parameters obtained from direct shear tests, the effective angle of friction decreases from a peak value of 31° to a post-peak value of 22°, which represents a drop of approximately 28%. The effective peak cohesion decreases from 150 kPa to 97 kPa, corresponding to a reduction of about 36%.
The shear resistance–horizontal displacement curves obtained for the Mera Formation under normal stresses of 100 kPa, 200 kPa, and 300 kPa show the development of peak shear resistance followed by a progressive post-peak reduction (Figure 16a). In contrast to the Brebi Formation, the decrease in shear resistance occurs over a wider range of horizontal displacements, with no abrupt strength loss immediately after peak mobilization. Peak shear resistance increases with increasing normal stress, while the post-peak response tends to stabilize gradually towards residual levels.
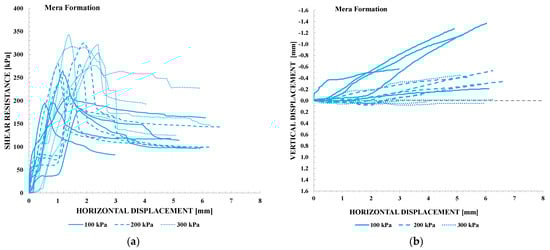
Figure 16.
Shear resistance and volumetric response of representative samples from the Mera Formation tested under normal stresses of 100 kPa, 200 kPa, and 300 kPa: (a) shear resistance versus horizontal displacement; (b) vertical displacement versus horizontal displacement.
Post-peak shear resistance values were identified based on engineering judgement, corresponding to displacement intervals where further changes in shear resistance become limited and the curves approach a stable trend.
The volumetric response of the Mera Formation, expressed as vertical displacement versus horizontal displacement (Figure 16b), is characterized by predominantly dilative behavior across all applied normal stress levels. Following a very limited initial contraction, the response transitions rapidly towards volumetric expansion, which becomes increasingly pronounced with increasing shear displacement. This behavior is most evident at the 100 kPa normal stress level, while at 200 kPa, volumetric expansion remains clearly developed, but with a reduced magnitude. At 300 kPa, the volumetric response is close to neutral, with only minor vertical displacements observed and no significant dilation. In contrast to the Brebi Formation, no distinct transition from contraction to dilation associated with the attainment of peak shear strength is observed, indicating a volumetric response largely governed by dilation throughout the shearing process.
3.3. Moigrad Formation
The Moigrad Formation [21], of Rupelian age [16,21], consists of an alternation of reddish silty clays with violet, brown, or brick-red hues, containing lenticular bodies of sands, sandstones, or microconglomerates deposited in a continental sedimentary environment [16,21]. The Moigrad Formation was divided into two geotechnical units: a clay and a sand one.
3.3.1. Moigrad Formation—Clay Unit
The Moigrad Formation—clay unit predominantly consists of medium-plasticity clays, subordinately of high- and very high-plasticity clays, and locally of low-plasticity clays, with intercalations of sand layers on the order of centimeters. This complex exhibits a predominantly reddish color, with hues varying from violet to brown and brick-red, and a very stiff consistency. It is mainly calcareous, frequently containing slightly calcareous to highly calcareous layers.
In the case of the Moigrad clay unit, there are mean values of 35.58% clay, 54.98% silt, and only 9.46% sand (Figure 17).
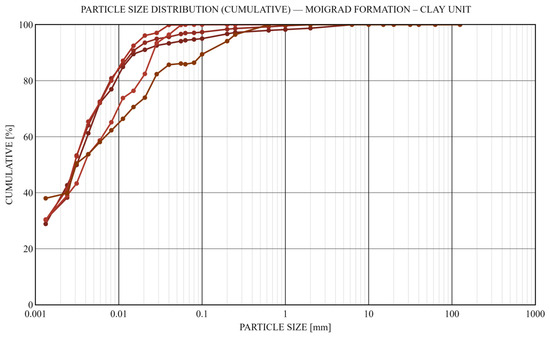
Figure 17.
Particle size distribution (cumulative) for the Moigrad Formation—clay unit. The curves represent the cumulative percentage of particles finer than a given grain size, plotted against particle diameter (mm) on a logarithmic scale. Each curve corresponds to an individual sample.
A total of 327 analyses were carried out for this clay unit. Regarding the physical and mechanical parameters of the clay unit, a statistical evaluation is presented in Table 3.
Table 3.
Statistical evaluation of the physical and mechanical parameters of the Moigrad Formation—clay unit.
The Moigrad Formation—clay unit is characterized by a high degree of saturation, with a mean value of 88%. The plasticity index shows large variability, ranging from 13% to 98%, with an average of 35%. The consistency index shows a narrower range, from 0.47 to 1.53, with a mean of 1.06, indicating generally high material stiffness.
The structural parameters of the Moigrad Formation—clay unit show relatively uniform distribution. The bulk unit weight varies within a moderate range, from 18.13 to 22.71 kN/m3, with an average value of 20.78 kN/m3, while the porosity falls between 23.07% and 46.52%, with a mean of 32.82%. In contrast, the carbonate content—despite its generally low average value of 15.81%—exhibits high internal variability, ranging from 0.40% to 43.04%.
Analysis of the plasticity index (PI) of the 254 samples from the Moigrad Formation—clay unit for which the Atterberg limits were determined reveals a range of values between 13% and 98%. According to the Casagrande (1948) [48] classification system, Figure 18a, the distribution of samples shows a clear predominance of medium-plasticity soils (CIM, LL = 35–50%), which account for 55.1% of the total. High-plasticity soils (CIH, LL = 50–70%) are identified in 30.3% of the cases, while very high-plasticity soils (CIV, LL > 70%) represent 11.4%. Low-plasticity soils (CIL, LL < 35%) are poorly represented, with a proportion of only 3.1%. These results highlight the predominance of cohesive plastic materials with swelling potential and behavior sensitive to moisture variations.
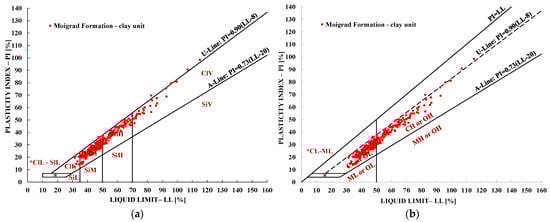
Figure 18.
(a) Soil classification according to ISO standards (plasticity chart) [27]—Moigrad Formation—clay unit; (b) soil classification according to ASTM standards (plasticity chart) [28]—Moigrad Formation—clay unit.
Within the USCS plasticity [28] framework, the Moigrad Formation—clay unit exhibits a predominance of lean clays (CL), which account for 58.3% of the analyzed samples, while fat clays (CH) represent 41.7% (Figure 14b).
To enable comparative analysis of geotechnical behavior based on carbonate content, the samples were grouped into three categories: slightly calcareous (<5% CaCO3), calcareous (5–25% CaCO3), and highly calcareous (25–50% CaCO3).
In the case of the Moigrad Formation—clay unit, the values of moisture content and PI do not follow a linear trend with respect to calcium carbonate content. The calcareous samples (5–25% CaCO3) exhibit the highest values, with an average moisture content of 16.10% and a PI of 35%, compared to 15.75% moisture and 32% PI in the slightly calcareous samples (<5% CaCO3) and 14.72% moisture and 30% PI in the highly calcareous samples (25–50% CaCO3). This differentiation is closely related to the grain-size composition, with the calcareous category containing the highest clay fraction of 37.4%, compared to 24.6% in the slightly calcareous group and 32.6% in the highly calcareous group. The higher clay proportion explains the increased moisture content and PI values through enhanced water retention capacity(Figure 19).
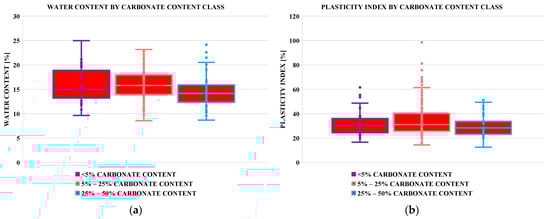
Figure 19.
(a) Comparison of the water content of Moigrad Formation—clay unit samples grouped by carbonate content class: <5%, 5–25% and 25–50% CaCO3; (b) comparison of plasticity index values for Moigrad Formation—clay unit samples grouped by carbonate content class: <5%, 5–25% and 25–50% CaCO3. The rectangles represent the interquartile range (IQR), the horizontal line indicates the median, and the whiskers extend to the minimum and maximum values within 1.5 × IQR. Each point corresponds to an individual tested sample, while those positioned above or below the whiskers represent statistical outliers.
The values of undrained strength (UCS) and deformation modulus (E) show that the influence of calcium carbonate on the mechanical behavior of the Moigrad Formation—clay unit does not exhibit a monotonic trend. The undrained compressive strength (UCS) is 1948 kPa for the slightly calcareous category, decreases to 1513 kPa for the calcareous samples, and increases again to 1600 kPa for the highly calcareous category. The deformation modulus (E) follows a similar pattern, with values of 108 MPa, 101 MPa, and 114 MPa, respectively (Figure 20).
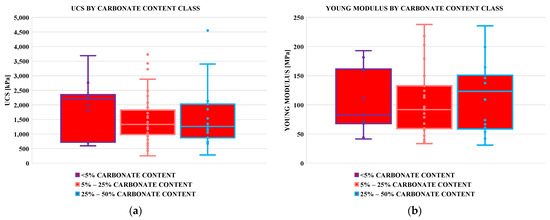
Figure 20.
(a) Comparison of unconfined compressive strength (UCS) values of Moigrad Formation—clay unit samples grouped by carbonate content class: <5%, 5–25% and 25–50% CaCO3; (b) comparison of Young’s modulus values of Moigrad Formation—clay unit samples grouped by carbonate content class: <5%, 5–25% and 25–50% CaCO3. The rectangles represent the interquartile range (IQR), the horizontal line indicates the median, and the whiskers extend to the minimum and maximum values within 1.5 × IQR. Each point corresponds to an individual tested sample, while those positioned above or below the whiskers represent statistical outliers.
In the case of drained shear strengths, a total of 296 samples were analyzed for peak values and 266 samples for post-peak values. The results are presented as an envelope for all determined values in Figure 21a and Figure 21b, respectively.
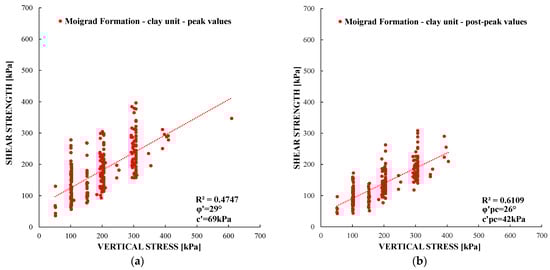
Figure 21.
(a) Results from direct shear analysis of Moigrad Formation—clay unit—peak values; (b) results from direct shear analysis of Moigrad Formation—clay unit—post-peak values. The dots represent the experimental data points obtained from direct shear tests, while the dashed line represents the linear regression of the Mohr–Coulomb shear strength criteria, describing the correlation between shear strength and normal stress.
In terms of drained shear strength behavior, regression analysis between effective shear strength and vertical effective stress yielded a determination coefficient of R2 = 0.475 for peak values and R2 = 0.611 in the case of post–peak values.
The shear strength parameters of the Moigrad Formation—clay unit show systematic variation, with increasing calcium carbonate content. At peak conditions, the effective friction angle decreases from 31° (<5% CaCO3) to 28° (5–25% CaCO3) and further to 24° (25–50% CaCO3), while the effective cohesion increases from 58 kPa (<5% CaCO3) to 79 kPa (5–25% CaCO3) and finally to 80 kPa (25–50% CaCO3).
The shear resistance–horizontal displacement curves obtained for the Moigrad Formation—clay unit under normal stresses of 100 kPa, 200 kPa, and 300 kPa exhibit marked variability in both peak shear resistance and post-peak evolution (Figure 22a). While peak shear resistance is consistently mobilized at relatively small horizontal displacements, the subsequent response differs significantly among samples. In several cases, a pronounced reduction in shear resistance is observed after peak values are reached, whereas other specimens show a more gradual decrease or a tendency towards stabilization over an extended displacement range.
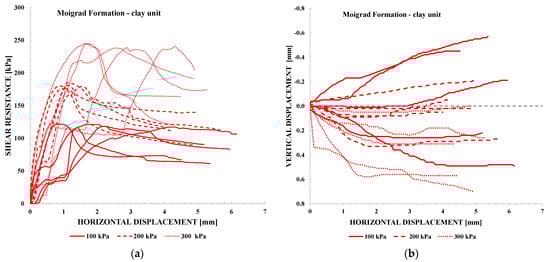
Figure 22.
Shear resistance and volumetric response of representative samples from the Moigrad Formation—clay unit tested under normal stresses of 100 kPa, 200 kPa, and 300 kPa: (a) shear resistance versus horizontal displacement; (b) vertical displacement versus horizontal displacement.
Peak shear resistance generally increases with increasing normal stress; however, the post-peak shear resistance does not converge towards a single residual level, reflecting heterogeneity in material structure and fabric within the clay unit. Post-peak values were identified based on engineering judgement, corresponding to displacement intervals where further changes in shear resistance become limited for each individual curve.
The volumetric response of the Moigrad Formation—clay unit, expressed as vertical displacement versus horizontal displacement (Figure 22b), is characterized by predominantly contractive behavior across all applied normal stress levels. Following the onset of shearing, vertical displacement indicates progressive volumetric contraction, which becomes more pronounced with increasing shear displacement. This contractive response is observed at all stress levels, but its magnitude increases systematically from 100 kPa to 300 kPa, indicating strong stress dependency of the volumetric behavior. At 100 kPa, limited dilation may occur locally, whereas at 200 kPa, and particularly at 300 kPa, contraction dominates throughout the shearing process. No clear transition from contraction to dilation associated with the attainment of peak shear strength is evident, suggesting that the volumetric response of the clay unit is governed primarily by compressive mechanisms during shear deformation.
3.3.2. Moigrad Formation—Sand Unit
The Moigrad Formation—sand unit—occurs as intercalated layers with thicknesses predominantly up to 4 m, but occasionally reaching as much as 10 m. It is composed mainly of sands, with isolated sequences of clayey sands or silty sands, exhibiting colors ranging from grey to reddish hues.
Granulometric analysis of 61 samples shows sand contents ranging from 50.8% to 97.5%, with a mean value of 67.9%. The clay fraction varies between 0.0% and 27.2%, and the silt fraction ranges from 0.5% to 39.6%, with average values of 11.1% and 19.0%, respectively (Figure 23). Consequently, plasticity parameters were not included in the testing program, as these indicators are methodologically irrelevant for non-cohesive soils.
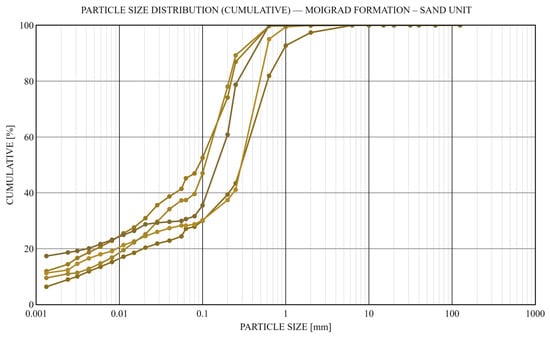
Figure 23.
Particle size distribution (cumulative) for the Moigrad Formation—sand unit. The curves represent the cumulative percentage of particles finer than a given grain size, plotted against particle diameter (mm) on a logarithmic scale. Each curve corresponds to an individual sample.
A total of 73 analyses were carried out for the sand unit. The statistical evaluation of the physical and mechanical parameters is presented in Table 4.
Table 4.
Statistical evaluation of the physical and mechanical parameters of the Moigrad Formation—sand unit.
The Moigrad Formation—sand unit is characterized by a degree of saturation ranging from 75% to 98%, with a mean value of 83%. The bulk unit weight varies between 18.75 and 23.40 kN/m3, with an average value of 20.67 kN/m3, while the porosity ranges from 20.29% to 42.56%, averaging 34.01%. The calcium carbonate (CaCO3) content determined for 35 samples ranges from 0.08% to 44.52%, with a mean value of 10.90%.
From a mechanical perspective, unconfined compressive strength (UCS) values range from 756 kPa to 6370 kPa, with a mean value of 2120 kPa. The elastic modulus (E) varies between 81 and 317 MPa, with an average value of 175 MPa.
In the case of drained shear strengths, a total of 72 samples were analyzed for peak values and 72 samples for post-peak values. The results are presented as an envelope for all determined values in Figure 24a and Figure 24b, respectively. Regression analysis between effective shear strength and effective vertical stress yielded coefficients of determination of R2 = 0.8326 for peak values and R2 = 0.919 for post-peak values.
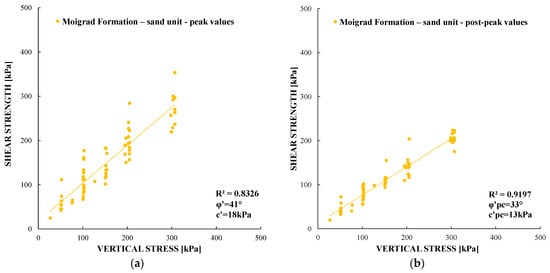
Figure 24.
(a) Results from direct shear analysis of the Moigrad Formation—sand unit—peak values; (b) results from direct shear analysis of the Moigrad Formation—sand unit—post-peak values. The dots represent the experimental data points obtained from direct shear tests, while the dashed line represents the linear regression of the Mohr–Coulomb shear strength criteria, describing the correlation between shear strength and normal stress.
The effective friction angle shows a decrease from a median peak value of 41° to a post-peak value of 33°, corresponding to a reduction of approximately 20%. The effective cohesion decreases from 18 kPa at peak conditions to 13 kPa in the post-peak state, representing a reduction of approximately 30%.
The shear resistance–horizontal displacement response of the Moigrad Formation (sand unit) under normal stresses of 100 kPa, 200 kPa, and 300 kPa shows consistent evolution across the tested samples (Figure 25a). Peak shear resistance is mobilized at small horizontal displacements, followed by a post-peak response characterized by limited strength loss and the development of quasi-stable residual shear resistance levels over an extended displacement range.
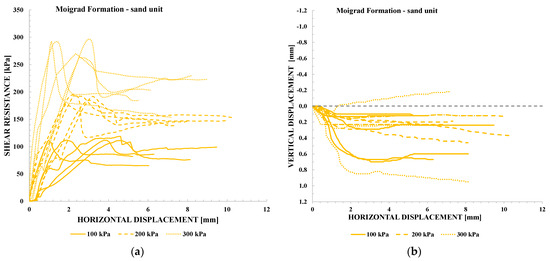
Figure 25.
Shear resistance and volumetric response of representative samples from the Moigrad Formation—sand unit tested under normal stresses of 100 kPa, 200 kPa, and 300 kPa: (a) shear resistance versus horizontal displacement; (b) vertical displacement versus horizontal displacement.
Peak shear resistance increases systematically with increasing normal stress, while post-peak shear resistance exhibits a narrower scatter compared to the clay unit, indicating a more uniform response of the granular material. Post-peak values were identified based on engineering judgement, corresponding to displacement intervals where variations in shear resistance become minor and the curves tend to stabilize.
The volumetric response of the Moigrad Formation—sand unit, expressed as vertical displacement versus horizontal displacement (Figure 25b), is dominated by contractive behavior across all applied normal stress levels. Immediately after the onset of shearing, vertical displacement indicates a pronounced volumetric contraction, which develops rapidly and continues with increasing shear displacement. The magnitude of contraction is lowest at 100 kPa, increases at 200 kPa, and reaches its maximum at 300 kPa, indicating clear dependence on the applied normal stress level. Manifestations of dilation are absent or very limited, and the volumetric response remains contractive both before and after reaching peak shear strength. This behavior suggests that the sand unit of the Moigrad Formation is characterized by grain compaction and rearrangement mechanisms that control volumetric evolution during shearing.
4. Discussion
Given the non-uniform horizontal distribution of the sampling locations and the potential influence of inter-site distances on stratigraphic and lithological variability, depth-based analysis of geotechnical parameters is not deemed generally representative. Accordingly, interpretation of the results relies on grouped datasets, organized by parameter, to emphasize correlations between physical–mechanical behavior and mineralogical or structural features.
4.1. Brebi Formation
The mechanical behavior of the Brebi Formation reflects the combined control of plasticity and calcium carbonate content, superimposed on a heterogeneous fine-grained fabric. Although the formation is predominantly clayey, significant variability in strength and stiffness is observed, indicating strong microstructural and cementation effects beyond grain-size control.
To facilitate interpretation of the mechanical behavior, the main physical and mechanical characteristics are discussed below in relation to plasticity classes and carbonate content, which provide a consistent framework for understanding the observed variability.
Low-plasticity clays (CIL) are relatively uncommon in the Brebi Formation, representing 10.8% of the analyzed samples. The plasticity index (PI) ranges from 15% to 22%, with a mean of 20%. Natural moisture content varies between 6.4% and 10.5%, with an average of 8.5%. From a mechanical perspective, the unconfined compressive strength (UCS) ranges from 1811 to 5313 kPa, with a mean value of 3356.4 kPa, while the elastic modulus (E) varies between 302.2 and 535.6 MPa, averaging 418.9 MPa. The highly calcium carbonate content (CaCO3), with an average of 63.1%, indicates the presence of carbonate cementation in these soils.
Medium-plasticity clays (CIM) dominate the Brebi Formation, being present in 69.9% of the analyzed samples. The PI values range from 21% to 37%, with an average of 28%. The natural moisture content falls between 7.3% and 17.0%, with a mean of 11.6%. The unconfined compressive strength (UCS) exhibits a wide variation, ranging from 1372 to 7753 kPa, with an average of 3925.3 kPa, while the elastic modulus (E) ranges from 104.2 to 421.3 MPa, with a mean value of 219.0 MPa. The average calcium carbonate content of 55.5% suggests the existence of carbonate cementation, similar to the CIL class.
High-plasticity clays (CIH) represent 19.3% of the Brebi Formation dataset. The PI ranges from 33% to 47%, with a mean value of 39%. Natural moisture content varies between 9.4% and 25.0%, with an average of 16.3%. The unconfined compressive strength (UCS) ranges from 1459 to 4538 kPa, with an average value of 3016.2 kPa, while the elastic modulus (E) range from 223.5 to 311.8 MPa, averaging 267.6 MPa. The average calcium carbonate (CaCO3) content of 39.7% indicates the presence of carbonate cementation in this category as well, albeit to a lesser extent. The reduced degree of cementation is associated with a decrease in both strength and stiffness, suggesting that the diminishing carbonate contribution negatively affects the mechanical behavior—particularly in the context of elevated plasticity.
Comparison between the EN ISO and ASTM plasticity-based classifications for the Brebi Formation reveals that differences in mechanical interpretation are mainly associated with the low- to medium-plasticity domain. At the high-plasticity end, the ISO-defined CIH class and the ASTM-defined fat clay (CH) group exhibit comparable ranges of strength, stiffness, and water content, indicating a consistent mechanical behavior dominated by elevated plasticity and reduced carbonate cementation. In this respect, the two classification systems provide similar information for highly plastic clays. In contrast, the EN ISO classification highlights a clearer and more consistent evolution of physical parameters within the low- to medium-plasticity domain. From CIL to CIM, both the plasticity index and the natural moisture content exhibit progressively less favorable values, reflecting increasing clay activity and water retention capacity. This gradual physical evolution cannot be resolved within the Unified Soil Classification System framework, where low- and medium-plasticity materials are grouped together as lean clays (CL), thereby obscuring internal trends present within this plasticity range. From a mechanical perspective, however, the finer resolution provided by the ISO classification enables more detailed interpretation of soil behavior at low-plasticity levels. Within the CIL and CIM classes, plasticity alone does not govern strength and stiffness, as these parameters are strongly influenced by the degree of carbonate cementation. At low plasticities, carbonate bonding plays a dominant role in controlling mechanical response, decoupling strength and stiffness from plasticity-related effects. This explains why, despite a clear physical progression from CIL to CIM, a corresponding linear evolution of mechanical parameters is not observed.
The differentiation observed across plasticity classes can be attributed to microstructural effects associated with calcium carbonate content. Calcium carbonate occurs both as thin films coating clay mineral surfaces and as intergranular cement, directly influencing soil fabric and particle interactions. Carbonate films reduce the mineralogical activity of clay minerals by limiting their hydration potential, thereby restricting plastic–expansive behavior and water retention. At the same time, intergranular carbonate cementation stabilizes the granular framework, decreases interparticle distances, and limits volumetric deformation. The combined action of these mechanisms explains why soils with similar grain-size distributions may exhibit markedly different plastic and mechanical responses depending on carbonate content. As plasticity increases, the stabilizing effect of carbonate cementation becomes progressively less dominant, while the contribution of clay mineral activity increases. This transition leads to a shift from a bonding-controlled mechanical behavior toward a response increasingly governed by clay cohesion and fabric rearrangement, resulting in lower stiffness and higher deformability under loading [49].
Within this microstructural framework, the influence of calcium carbonate content is further reflected in the behavior of the shear strength parameters.
The internal friction angle (φ′) and effective cohesion (c′) show systematic variation with calcium carbonate (CaCO3) content. Laboratory results indicate that samples classified as highly calcareous (CaCO3 < 50%) exhibit average values of φ′ ≈ 27.3° and c′ ≈ 149.6 kPa. In contrast, soils in the very highly calcareous category (CaCO3 ≥ 50%) display an apparent increase in internal friction angle to φ′ ≈ 31.0°, while effective cohesion decreases to c′ ≈ 108.3 kPa. This evolution of strength parameters may be attributed to the dual influence of calcium carbonate on soil microstructure. At moderate contents (25–50%) of carbonate, it contributes partially to the cementation of fine particles, strengthening the granular network and supporting higher cohesion. However, at higher concentrations (>50%), even high values of peak effective cohesion exist, and the excess carbonate tends to dilute the active clay fraction, reducing the number and strength of cohesive bonds between particles. As a result, the soil structure becomes more fragile and increasingly reliant on frictional contacts, which explains the higher drop in cohesion and the slight increase in internal friction angle [49].
Post-peak strength parameters reinforce this trend regarding the influence of carbonate content on mechanical behavior. In highly calcareous soils (CaCO3 < 50%), the post-peak internal friction angle and cohesion are approximately φ′pp ≈ 21.2° and c′pp ≈ 98.4 kPa, respectively. For very highly calcareous soils (CaCO3 ≥ 50%), the post-peak friction angle increases significantly to about φ′pp ≈ 28.9°, while cohesion remains relatively low and stable, with an average of c′pp ≈ 56.6 kPa. This redistribution between the two parameters suggests a shift toward more frictional behavior, typical of weakly cohesive or granular materials with partial cementation. The presence of carbonate enhances flocculation and aggregate stiffening, promoting the development of more irregular slip surfaces. This, in turn, increases frictional resistance after failure while reducing the colloidal forces that contribute to cohesive strength.
The undrained mechanical response of the Brebi Formation is characterized by pronounced variability, reflecting differences in soil microstructure, degree of cementation, and consolidation history. This dispersion highlights the heterogeneous nature of the tested materials, in which structural factors exert a strong control on strength development under undrained loading conditions. A positive correlation between unconfined compressive strength (UCS) and elastic modulus (E) indicates that soils with a stiffer elastic response tend to mobilize higher undrained strength, emphasizing the role of internal fabric and bonding in controlling resistance.
When samples are grouped according to carbonate content, soils with CaCO3 ≤ 50% generally exhibit higher median values of both UCS and deformation modulus compared with those containing more than 50% CaCO3. This differentiation reflects the influence of carbonate on soil microstructure. At moderate carbonate contents, carbonate compounds enhance intergranular cementation, increasing strength and stiffness without significantly reducing the activity of the clay fraction. In contrast, at higher carbonate contents (>50%), the clay matrix becomes increasingly diluted and progressively coated by carbonate films, leading to reduced colloidal cohesion and the development of a weaker, more fragile structure characterized by lower UCS and stiffness.
The occurrence of relatively high UCS and E values within the very highly calcareous class can be attributed to localized processes of secondary carbonate cementation or specific structural arrangements; however, these cases do not alter the overall tendency toward reduced mechanical performance at elevated carbonate proportions. Statistical analysis further indicates that total calcium carbonate content alone is not a direct predictor of undrained strength. Instead, factors such as overconsolidation, internal fabric, and post-depositional bonding appear to play a dominant role. The weak positive correlation observed between UCS and effective cohesion suggests that part of the mobilized undrained strength may be sustained by remanent cohesive interactions, potentially developed through sedimentary processes or secondary cementation.
4.2. Mera Formation
The distribution of plasticity classes within the Mera Formation reflects a lithological context dominated by plastic-active clays with a pronounced swelling potential, indicating strong mineralogical control of the fine fraction on geotechnical behavior. Unlike formations characterized by uniform clay activity, the Mera Formation exhibits a wide spectrum of plasticity and carbonate contents, resulting in heterogeneous mechanical responses that are governed by the combined effects of clay mineral activity, soil fabric, and secondary bonding processes
Low-plasticity clays (CIL) are scarcely represented within the Mera Formation, with only one sample identified. This sample exhibits a plasticity index (PI) of 16%, and the natural water content is reduced, at 6.1%, reflecting a limited capacity for water absorption and volumetric expansion. From a mechanical standpoint, this single sample registers an unconfined compressive strength (UCS) of 4723 kPa and an elastic modulus (E) of 302.3 MPa. Although the calcium carbonate (CaCO3) content was not determined for this specimen, correlations identified within the Mera Formation between CaCO3 content and strength parameters suggest that these characteristics may reflect either a high degree of natural compaction or the localized presence of carbonate microcementation processes.
Clays in the medium-plasticity category (CIM), representing 24.4% of the total analyzed samples, exhibit plasticity index (PI) values ranging from 17% to 39%, with a mean of 27%. The natural water content ranges from 8.7% to 20.8%, with a mean of 13.4%. The unconfined compressive strength (UCS) varies between 2368 kPa and 4224 kPa, with an average value of 3402.8 kPa, while the elastic modulus (E) has a mean value of 259.1 MPa. The average calcium carbonate (CaCO3) content for this group is approximately 25.1%, supporting the hypothesis of carbonate cementation bridges at the microstructural level. Such intergranular bonds contribute to strengthening the particle framework and increasing bearing capacity, while also reducing deformability—without completely suppressing the plastic behavior characteristic of these soils [49].
Clays in the high-plasticity category (CIH, LL = 50–70%) represent the most prevalent group within the Mera Formation, accounting for 41.5% of the analyzed samples. The plasticity index (PI) ranges from 31% to 47%, with an average of 39%. The natural water content varies between 10.0% and 21.53%, with an average of 16.5%. The unconfined compressive strength (UCS) shows considerable variability, ranging from 336 to 5883 kPa (mean: 1745 kPa), while the elastic modulus (E) varies between 310.49 and 330.61 MPa, with an average of 320.6 MPa. This heterogeneity reflects the interplay between the weakening effect of high-plasticity on mechanical behavior and the stabilizing influence of carbonate microcementation. The average calcium carbonate (CaCO3) content for this class is 27.3%, with maximum values reaching up to 51.1%, supporting the hypothesis of secondary structural bonding that contributes to the consolidation of the granular network.
Clays in the very high-plasticity category (CIV, LL > 70%) represent 31.7% of the total samples analyzed from the Mera Formation. The plasticity index (PI) varies significantly, ranging from 46% to 135%, with an average value of 93%. The natural water content varies between 13.54% and 21.90%, with an average of 17.0%. The unconfined compressive strength (UCS) of CIV clays ranges from 1015 to 2730 kPa, with an average value of 1924.8 kPa. The elastic modulus (E) ranges from 119.1 to 320.27 MPa, with a mean of 219.7 MPa. The average calcium carbonate (CaCO3) content is 18.5%, notably lower than that observed in the CIH and CIM categories, suggesting limited influence of microcementation on the mechanical behavior of these soils.
The comparison between the EN ISO and ASTM plasticity-based classifications for the Mera Formation indicates that differences in mechanical interpretation are primarily associated with the high- to very high-plasticity range. In this domain, the ISO-defined CIH and CIV classes are grouped into a single fat clay (CH) category within the Unified Soil Classification System, resulting in reduced resolution of both physical and mechanical variability. Within the ISO classification, CIH and CIV clays exhibit clear differentiation of physical properties, expressed by systematic increases in plasticity index and natural water content. This progressive evolution is not captured within the ASTM framework, where these materials are treated as a single class, thereby obscuring differences that are relevant at higher levels of plasticity. From a mechanical standpoint, the ISO classification enables more refined assessment of strength and stiffness at elevated plasticity levels. The CIH and CIV classes display distinct ranges and variability of unconfined compressive strength and elastic modulus, reflecting differences in the relative contribution of carbonate cementation to mechanical response. When aggregated within the ASTM system, this variability is expressed as a broad scatter of mechanical properties within the CH class, providing overall characterization of the formation without resolving internal mechanical differentiation. Overall, the observed evolution of mechanical properties across plasticity classes reflects the increasing dominance of clay mineral activity over bonding effects with rising plasticity. At low- to medium-plasticity levels, as resolved by the EN ISO classification and encompassed within the lean clay (CL) group, carbonate-induced intergranular bonding partially counteracts plastic weakening, resulting in higher strength and stiffness. In contrast, at high- to very high-plasticity levels, grouped within the fat clay (CH) category, the mechanical response is increasingly governed by the intrinsic behavior of the clay fraction, while carbonate bonding plays a secondary role.
The differences observed in unconfined compressive strength (UCS) between the groups defined by carbonate content further indicate the role of calcium carbonate in shaping the mechanical behavior of the Mera Formation. Significantly higher UCS values associated with highly calcareous samples suggest a more rigid internal structure, promoted by carbonate microcementation processes that enhance interparticle contact efficiency. Conversely, samples with lower CaCO3 content exhibit reduced strength, reflecting a response dominated by the active clay matrix and a higher susceptibility to deformation under undrained loading.
This trend is consistently reflected by the elastic modulus (E), which shows higher stiffness in samples with increased carbonate content. Elevated E values in highly calcareous soils indicate a stiffer elastic response associated with additional structural bonding, whereas calcareous soils display lower stiffness and more deformable behavior, governed primarily by the plastic properties of the fine fraction. The association between UCS and E emphasizes the link between structural rigidity and the mobilization of undrained strength. Nevertheless, the wide scatter observed within each category indicates that carbonate content alone does not exclusively control mechanical behavior, as local factors such as sedimentary fabric, natural compaction, and heterogeneous cementation also play an important role.
The influence of calcium carbonate (CaCO3) content on the geotechnical behavior of the Mera Formation becomes evident when shear strength parameters are examined in relation to soil structure and bonding conditions. In contrast to the Brebi Formation, calcium carbonate contents within the Mera Formation are generally lower, with values exceeding 50% recorded only locally and in isolated samples. Under these conditions, CaCO3 does not act as a dominant controlling factor, but instead contributes to modifications of soil fabric through localized cementation and particle aggregation. These microstructural effects are associated with variations in bulk density and porosity, as well as changes in natural water content and plasticity index, which are ultimately reflected in the effective shear strength parameters.
In a manner consistent with the trends observed for unconfined compressive strength, calcium carbonate (CaCO3) content exerts a clear influence on the effective shear strength parameters of the Mera Formation, namely the internal friction angle (φ′) and the effective cohesion (c′). The experimental results reveal pronounced differences between the two carbonate classes: samples classified as highly calcareous (CaCO3 > 25%) exhibit average values of φ′ ≈ 40° and c′ ≈ 270.3 kPa, whereas calcareous samples (CaCO3 ≤ 25%) are characterized by lower values of φ′ ≈ 28.6° and c′ ≈ 127 kPa. These differences are attributed to the effect of secondary carbonate cementation, which promotes flocculation and aggregation of fine particles, reduces porosity, and increases the density and effectiveness of interparticle contacts.
Post-peak strength parameters further support this interpretation. Highly calcareous samples retain elevated post-peak values of φ′pp ≈ 35.8° and c′pp ≈ 144.4 kPa, indicating the persistence of a consolidated internal structure and the development of rougher shear surfaces following failure. In contrast, calcareous samples (CaCO3 ≤ 25%) display lower post-peak values of φ′pp ≈ 23.8° and c′pp ≈ 72.0 kPa, suggesting a failure mechanism predominantly governed by plastic deformation and progressive degradation of the soil fabric.
4.3. Moigrad Formation
4.3.1. Moigrad Formation—Clay Unit
The distribution of plasticity classes within the Moigrad Formation—clay unit reflects a lithological context dominated by cohesive, plastic-active clays with variable swelling potential, as indicated by the predominance of medium- and high-plasticity soils and a wide range of plasticity index values. Unlike units characterized by a narrow plasticity spectrum, the Moigrad clay unit exhibits pronounced variability in clay activity, which provides the framework for heterogeneous mechanical responses controlled by the intrinsic properties of the clay fraction and its interaction with the soil fabric.
Low-plasticity clays (CIL) are relatively rare within the Moigrad Formation—clay unit, representing only 3.1% of the total samples analyzed. The plasticity index (PI) ranges between 13% and 23%, with a mean value of 18%. The natural moisture content ranges from 10.7% to 19.3%, with a mean value of 13.7%. From a mechanical perspective, the unconfined compressive strength (UCS) ranges from 1352 to 1770 kPa, with an average value of 1561 kPa, while the elastic modulus (E) has a value of 66.8 MPa. The average calcium carbonate content (CaCO3) is approximately 25.8%.
Medium-plasticity clays (CIM) dominate the Moigrad Formation—clay unit, representing 55.1% of the total samples analyzed. The plasticity index (PI) varies between 15% and 36%, with a mean value of 26%. Natural moisture content ranges from 8.5% to 31.2%, with a mean value of 15.47%. From a mechanical point of view, the unconfined compressive strength (UCS) ranges from 253 to 3728 kPa, with a mean value of 1624 kPa, while the elastic modulus (E) ranges between 31.0 and 235.6 MPa, with a mean value of 105.5 MPa. The average calcium carbonate content (CaCO3) is approximately 15.5%.
Medium-plasticity clays (CIM) are followed in frequency by high-plasticity clays (CIH), which account for 30.3% of the total samples analyzed. These are characterized by a plasticity index (PI) ranging from 31% to 53%, with a mean of value of 41%. The natural moisture content varies between 11.0% and 22.1%, with a mean of value of 16.4%. From a mechanical perspective, the unconfined compressive strength (UCS) ranges from 320 to 4552 kPa, with an average value of 1417 kPa, while the elastic modulus (E) ranges between 30.4 and 237.8 MPa (mean: 103.4 MPa). The average calcium carbonate content (CaCO3) is approximately 16.3%.
Very high-plasticity clays (CIV) account for 11.4% of the samples analyzed from the Moigrad Formation—clay unit. These soils are characterized by a plasticity index (PI) ranging between 48% and 98% (mean: 64%). The natural moisture content varies from 14.4% to 25.0%, with an average value of 18.22%. From a mechanical standpoint, the unconfined compressive strength (UCS) ranges from 650 to 2306 kPa, with an average value of 1561 kPa, and the elastic modulus (E) ranges between 40.2 and 92.1 MPa (mean: 63.54 MPa). The average calcium carbonate content (CaCO3), of approximately 12.9%, indicates a limited influence of carbonate cementation on the structure of these clays, which remain strongly affected by high plasticity and activity, typical of smectite soils.
The comparison between the EN ISO and ASTM plasticity-based classifications for the Moigrad Formation—clay unit highlights differences in the resolution of both physical and mechanical variability across the dataset. The ISO framework distinguishes four plasticity classes (CIL, CIM, CIH, and CIV), allowing detailed description of the progressive increase in plasticity index and the natural moisture content from low- to very high-plasticity. This subdivision captures a continuous physical evolution within the clay unit, which is particularly evident in the transition from CIM to CIH and further toward CIV. When the same data are interpreted within the Unified Soil Classification System, this progressive physical differentiation is condensed into two broader plasticity groups (CL and CH). As a result, the internal variability observed within the medium- to very high-plasticity range under the ISO classification is no longer resolved. In particular, the ASTM framework groups materials with substantially different plasticity indices and moisture contents into the same CH class, thereby masking the physical gradation identified by the ISO system at higher plasticity levels. From a mechanical perspective, the ISO classification reveals that the unconfined compressive strength and elastic modulus do not evolve monotonically with increasing plasticity. Significant overlap in mechanical parameters is observed between the CIM and CIH classes, as well as between the CIH and CIV classes, indicating that plasticity alone does not control the mechanical response within the Moigrad clay unit. This behavior is reflected in the ASTM classification by wide ranges of strength and stiffness within both the CL and CH groups, which represent aggregated expressions of the same mechanical scatter. The comparison further indicates that, within the Moigrad clay unit, the ISO classification provides a clearer framework for identifying the physical evolution associated with increasing plasticity, whereas the ASTM classification offers a simplified mechanical characterization appropriate for broader-scale interpretation. Together, these approaches offer complementary insights into the complex behavior of the Moigrad clay unit, balancing detailed physical resolution with generalized mechanical grouping. The unconfined compressive strength (UCS) and elastic modulus (E) further reflect the complex role of calcium carbonate in controlling the undrained mechanical response of the Moigrad Formation—clay unit. The non-monotonic variation of both UCS and E with increasing CaCO3 content indicates that carbonate proportion alone does not directly govern strength and stiffness. Instead, mechanical behavior appears to be controlled by the manner in which carbonate is microstructurally integrated within the clay matrix. Slightly calcareous samples exhibit relatively high UCS values, likely associated with a denser clay fabric and higher clay fraction, while intermediate carbonate contents are accompanied by a reduction in both strength and stiffness. At higher CaCO3 contents, the partial recovery of UCS and E suggests the contribution of localized carbonate cementation, which enhances interparticle contacts without fully compensating for the weakening effect of clay plasticity. The close association between UCS and elastic modulus confirms that samples with a stiffer internal structure tend to mobilize higher undrained strength, although the wide scatter within each carbonate class highlights the influence of additional factors such as natural compaction, sedimentary fabric, and heterogeneous cementation.
The observed trends in peak and post-peak shear strength parameters indicate systematic reorganization of resistance mechanisms with increasing calcium carbonate content, reflecting a progressive transition from friction-dominated to bonding-controlled behavior. This transition corresponds to a reduction of approximately 22% in the effective friction angle (φ′) and an increase of about 37% in effective cohesion (c′), indicating a shift in the governing mechanical response. Higher carbonate contents promote interparticle bonding and cementation, which enhance cohesion while simultaneously reducing intergranular friction. After peak strength is reached, cohesion (c′pp) decreases substantially, with post-peak values ranging from 30.13 to 49.33 kPa, representing only 52–62% of the peak cohesion and reflecting the progressive breakdown of carbonate cementation bonds. In contrast, the post-peak friction angle (φ′pp) converges toward a nearly constant value of about 25°, with measured values of 24.95°, 25.44°, and 25.14°, suggesting relative independence from carbonate content. Nevertheless, the moderate increase in post-peak cohesion with higher carbonate contents indicates the persistence of a remanent bonding component even after failure.
4.3.2. Moigrad Formation—Sand Unit
The Moigrad Formation—sand unit is characterized by a grain-size distribution dominated by the sand fraction, with a generally low proportion of fines. This granulometric composition results in a predominantly frictional mechanical behavior, in which strength and deformability are primarily controlled by grain packing, density, and intergranular contact conditions rather than by plasticity-related mechanisms. Consequently, the geotechnical response of this unit differs fundamentally from that of the clay-dominated formations, with plasticity parameters playing a negligible role.
Although generally lower, the calcium carbonate content exhibits considerable internal variability and exerts a measurable influence on the structural characteristics of the sandy unit. The increase in bulk unit weight and the corresponding decrease in porosity with higher CaCO3 contents indicate a tendency toward denser packing conditions, most likely associated with localized carbonate cementation. These microstructural effects enhance grain-to-grain contact efficiency, resulting in a more compact and mechanically stable framework.
The mechanical behavior of the Moigrad Formation—sand unit is governed primarily by frictional mechanisms, controlled by grain-size distribution, packing density, and the efficiency of intergranular contacts. In this context, variations in calcium carbonate content play a secondary but measurable role, mainly through their influence on contact bonding and local cementation, which affect peak and post-peak shear strength parameters.
Regarding shear behavior, the slightly calcareous soils exhibit peak internal friction angles ranging from 27.1° to 34.6°, with a mean value of 30.6°, while effective peak cohesion ranges from 2.0 kPa to 10.4 kPa, averaging 6.7 kPa. In calcareous soils, the peak internal friction angle ranges from 30.0° to 39.2°, with an average of 35.0°, and effective peak cohesion varies between 5.2 kPa and 21.7 kPa, with a mean value of 12.1 kPa. The observed variations suggest enhancement of shear strength associated with the presence of calcium carbonate, likely due to more closely packed intergranular contacts.
In the case of the Moigrad Formation—sand unit, the direct shear test results show a notable reduction in shear strength parameters once the peak state is exceeded. The effective angle of friction decreases from a median value of all samples of 40.54° to 32.63°, representing a reduction of approximately 20%. This transition reflects a behavioral shift from dense sand conditions towards strength parameters more characteristic of medium-dense sand in the post-peak phase. The effective cohesion also drops, from 17.95 kPa to 12.52 kPa, corresponding to a decrease of approximately 30%, though cohesion plays a minor role in sandy materials that is often neglected in geotechnical design.
It should be noted that the unconfined compressive strength (UCS) tests within the Moigrad Formation—sand unit were performed exclusively on sandstone specimens, where sufficient cohesion and structural integrity allowed for reliable specimen preparation and testing. Consequently, the UCS values discussed herein reflect the mechanical behavior of cemented sandy facies rather than loose, non-cemented sands, for which UCS testing is not methodologically applicable.
In this context, the obtained UCS results primarily capture the effect of grain bonding, cementation degree, and internal fabric of the sandstones, rather than the purely frictional behavior typical of unconsolidated sands. The interpretation of the UCS data is therefore focused on the role of carbonate-induced cementation and its contribution to stiffness and strength development in the sandy horizons of the Moigrad Formation.
5. Conclusions
This study delivers a detailed geotechnical characterization of the Paleogene Brebi, Mera, and Moigrad formations in the northwestern Transylvanian Basin, revealing pronounced differences in lithology, physical properties, and mechanical behavior that reflect their distinct depositional environments.
The Brebi Formation, originating from marine carbonate facies, is characterized by medium-plasticity clays (average PI: 29%) with exceptionally highly carbonate content (average 54%), leading to partial cementation, high unconfined compressive strength (average UCS: 3647 kPa), and peak shear parameters (φ′: 29°, c′: 130 kPa) that indicate robust stiffness. In contrast, the Mera Formation, marking a transition to brackish conditions, comprises high-plasticity clays (average PI: 53%) with variable carbonate levels (average 24%) and frequent sandy intercalations, resulting in greater mechanical variability and slightly lower average UCS (3500 kPa) but higher peak friction angles (φ′: 31°). The Moigrad Formation, representing fluvial sedimentation, diverges further into two subunits: the clay-rich complex exhibits variable plasticity across all classes (average PI: 35%) with low carbonate content (average 15.81%), yielding moderate UCS (1550 kPa) and shear strengths (φ′: 29°), while the sandy unit features weakly cohesive, granular sediments (average sand: 67.85%, carbonate: 11%) with lower saturation (83%) but higher frictional resistance (peak φ′: 41°) and UCS (2120 kPa), influenced by local microcementation.
Across the Brebi, Mera, and Moigrad formations, the EN ISO classification consistently provides finer resolution of physical and mechanical variability within plasticity domains compared to the USCS (ASTM) system, which aggregates materials into broader lean clay (CL) and fat clay (CH) groups. This enhanced detail in EN ISO reveals gradual evolutions in parameters like plasticity index, moisture content, strength, and stiffness—particularly in the low-to-medium (Brebi) and high-to-very high (Mera) ranges—while USCS offers a simplified, formation-scale synthesis better suited for generalized mechanical characterization. Ultimately, EN ISO excels in capturing nuanced trends driven by clay activity and carbonate effects, whereas USCS prioritizes practical, broad applicability, making the systems complementary for comprehensive geotechnical analysis.
Considering that even EN ISO 14688-2-2018 [27] recommends describing materials with undrained shear resistance values higher than 300 kPa (UCS > 600 kPa) as rock, characterizing shales in geotechnical engineering is quite difficult, especially parametrizing slope failure problems. This is evident in the analyzed formations, which exhibit rock-like strengths yet soil-like plasticity and brittleness, necessitating integrated approaches that account for progressive failure mechanisms and site-specific variability to ensure safe and efficient engineering outcomes in urban expansion and infrastructure development. Future research should incorporate in situ testing and numerical modeling to further refine these parameters for practical applications.
Author Contributions
Conceptualization, I.G.C., C.G.T., O.B. and N.H.; data curation, I.G.C. and O.B.; formal analysis, I.G.C. and O.B.; investigation, I.G.C. and O.B.; validation, E.A., C.G.T. and N.H.; visualization I.G.C. and O.B., writing—original draft preparation, I.G.C. and O.B.; writing—review and editing, N.H., C.G.T., I.G.C., O.B. and E.A.; visualization, E.A.; supervision, I.G.C. and N.H.; project administration I.G.C.; funding acquisition, I.G.C., O.B. and N.H. All authors have read and agreed to the published version of the manuscript.
Funding
This research received no external funding.
Institutional Review Board Statement
Not applicable.
Informed Consent Statement
Not applicable.
Data Availability Statement
The data analyzed in this study were shared with the authors under a confidentiality agreement for the specific purpose of this research and cannot be made freely available to other entities due to privacy and ethical restrictions.
Acknowledgments
We express our sincere gratitude to the Geo Search Company for generously providing support with laboratory tests and samples that were critical to the analysis presented in this paper. Their support and contribution significantly enhanced the quality and reliability of our research findings.
Conflicts of Interest
Author Eduárd András was employed by the company S.C. Geo Search S.R.L. The remaining authors declare that the research was conducted in the absence of any commercial or financial relationships that could be construed as a potential conflict of interest.
Abbreviations
The following abbreviations are used in this manuscript:
| CaCO3 | Calcium carbonate content |
| CH | Inorganic clay of high plasticity |
| CIH | Clay of high plasticity |
| CIL | Clay of low plasticity |
| CIM | Clay of medium plasticity |
| CIV | Clay of very high plasticity |
| CL | Inorganic clay of low plasticity |
| CO2 | Carbon dioxide |
| c′ | Effective cohesion |
| c′pp | Post-peak effective cohesion |
| cu | Undrained shear strength |
| E | Young’s modulus |
| HCl | Hydrochloric acid |
| LL | Liquid limit |
| n | Porosity |
| PI | Plasticity index |
| R2 | Coefficient of determination |
| Sr | Saturation ratio |
| UCS | Unconfined compression strength |
| w | Water content |
| Xk | Statistic characteristic value |
| Xk,inf | Lower statistic characteristic value |
| Xk,sup | Upper statistic characteristic value |
| γ | Bulk unit weight |
| γs | Skeleton unit weight |
| σ2 | Lateral stress during triaxial undrained unconsolidated test |
| σ3 | Lateral stress during triaxial undrained unconsolidated test |
| φ′ | Effective friction angle |
| φ′pp | Post-peak effective friction angle |
References
- Wanek, F.; Poszet, S. Slope Danger on the Territory of Cluj-Napoca Resulting from the Structure and Morphology of the Hills between the River Someşul Mic and the Valley of Nadăş (between Tăietura Turcului and Cheile Baciului). Acta Univ. Sapientiae 2009, 1, 74–82. [Google Scholar]
- Lehel, P.S. Studiu de Geomorfologie Aplicată în Zona Urbană Cluj-Napoca. Ph.D. Thesis, Faculty of Environmental Science and Engineering, Babes-Bolyai University, Cluj-Napoca, Romania, 2011. [Google Scholar]
- Vîjdea, A.; Cociuba, I. Descrierea Geohazardelor Pentru Cluj-Napoca, PanGeo D7.1.33. 2013. Available online: http://www.pangeoproject.eu/pdfs/locale/cluj_napoca/Geohazard-Description-cluj_napoca.pdf (accessed on 2 June 2025).
- Tövissi, I. The Role of the Clay Minerals from Oligocene Layers in the Geomorphodynamical Evolution of the Slopes. In The Oligocene from the Transylvanian Basin; University of Cluj-Napoca: Cluj-Napoca, Romania, 1989; pp. 519–528. [Google Scholar]
- Clicici, O.; Nistor, P.; Tövissy, V. Raionarea Geotehnica a Municipiului Cluj-Napoca. Stud. Univ. Babeș Bolyai 1990, XXXV, 101–109. [Google Scholar]
- Marat, A.R.; Tămaș, T.; Șamșudean, C.; Gheorghiu, R. Physico-mechanical and Mineralogical Investigations of Red Bed Slopes (Cluj-Napoca, Romania). Bull. Eng. Geol. Environ. 2022, 81, 78. [Google Scholar] [CrossRef]
- Săndulescu, M. Geotehtonica Romaniei; Editura Tehnică: București, Romania, 1984. [Google Scholar]
- Csontos, L.; Nagymarosy, A.; Horvath, F.; Kovac, M. Tertiary Evolution of the Intra-Carpathian Area. Tectonophysics 1991, 208, 221–241. [Google Scholar] [CrossRef]
- Krézsek, C.; Filipescu, S. Middle to Late Miocene Sequence Stratigraphy of the Transylvanian Basin (Romania). Tectonophysics 2005, 410, 437–463. [Google Scholar] [CrossRef]
- Krézsek, C.; Bally, A.W. The Transylvanian Basin (Romania) and Its Relation to the Carpathian Fold and Thrust Belt: Insights in Gravitational Salt Tectonics. Mar. Pet. Geol. 2006, 23, 405–442. [Google Scholar] [CrossRef]
- Krézsek, C.; Filipescu, S.; Silye, L.; Maţenco, L.; Doust, H. Miocene Facies Associations and Sedimentary Evolution of the Southern Transylvanian Basin (Romania): Implications for Hydrocarbon Exploration. Mar. Pet. Geol. 2010, 27, 191–214. [Google Scholar] [CrossRef]
- Filipescu, S.; Silye, L.; Krézsek, C. Stratigraphic Overview of the Neogene Transylvanian Basin, Romania. Geol. Soc. Lond. Spec. Publ. 2026, 554, SP554-2024. [Google Scholar] [CrossRef]
- Săndulescu, M.; Kräutner, H. Geological Map of Romania, Scale 1:1.000.000; Institutul de Geologie și Geofizică București: Bucharest, Romania, 1978. [Google Scholar]
- Moisescu, V. Stratigrafia Depozitelor Paleogene Și Miocen-Inferioare Din Regiunea Cluj-Huedin-Romanasi; Geological and Geophysics Institute of Romania: Bucharest, Romania, 1975. [Google Scholar]
- Rusu, A. Oligocene Events in Transylvania and the First Separation of Paratethys. Comptes Rendus Séances 1988, 72–73, 207–223. [Google Scholar]
- Filipescu, S. Cenozoic Lithostratigraphic Units in Transylvania. In Calcareous algae from Romanian Carpathians; Cluj Universitary Press: Cluj-Napoca, Romania, 2011; pp. 37–48. [Google Scholar]
- Popescu, B.; Bombiță, G.; Rusu, A.; Iva, M.; Gheța, N.; Olteanu, R.; Popescu, D.; Tăutu, E. The Eocene of the Cluj-Huedin Area. Dări Seamă Ale Ședințelor 1977, LXIV, 295–357. [Google Scholar]
- Bombiță, G. Le Napocien, Vingt Ans Apres Sa Definition. Rev. Paléobiologie 1984, 3, 209–2017. [Google Scholar]
- Hofmann, K. Bericht Über Die Im Östlichen Teile Des Szilágyer Comitates Wahrend Der Sommercampagne 1878 Vollführten Geologischen Specialaufnahmen. Föld. Közl. 1879, 9, 231–283. [Google Scholar]
- Rusu, A. Eocene Formations in the Călata Region. Rom. J. Tectonical Reg. Geol. 1995, 76, 59–72. [Google Scholar]
- Rusu, A. Corelarea Faciesurilor Oligocenului Din Regiunea Treznea—Bizușa (NV Bazinului Transilvaniei). Stud. şi Cercet. Geol. Geof. Geogr. Ser. Geol. 1970, 15, 513–525. [Google Scholar]
- Moisescu, V. Molustele Si Echinidele Stampiene Si Egeriene Din Regiunea Cluj-Huedin-Romanasi; Geological Institute of Romania: Bucharest, Romania, 1972. [Google Scholar]
- Proust, J.-N.; Hosu, A. Sequence Stratigraphy and Paleogene Tectonic Evolution of the Transylvanian Basin (Romania, Eastern Europe). Sediment. Geol. 1996, 105, 117–140. [Google Scholar] [CrossRef]
- Koch, A. Über Das Tertiär in Siebenbürgens. Neues Jahrb. Min. Geol. Pal. 1880, I, 283–285. [Google Scholar]
- ISO 22475-1:2021; Geotechnical Investigation and Testing—Sampling Methods and Groundwater Measurements—Part 1: Technical Principles for the Sampling of Soil, Rock and Groundwater. Romanian Standard Association: Bucharest, Romania, 2021.
- ISO 14688-1:2017; Identification and Classification of Soil—Part 1: Identification and Description. Romanian Standard Association: Bucharest, Romania, 2017.
- ISO 14688-2:2017; Identification and Classification of Soil—Part 2: Principles for a Classification. Romanian Standard Association: Bucharest, Romania, 2017.
- ASTM D2487-17; Practice for Classification of Soils for Engineering Purposes (Unified Soil Classification System). ASTM International: West Conshohocken, PA, USA, 2020.
- ISO 17892-1:2014; Geotechnical Investigation and Testing—Laboratory Testing of Soil—Part 1—Determination of Water Content. Romanian Standard Association: Bucharest, Romania, 2014.
- ISO 17892-2:2014; Geotechnical Investigation and Testing—Laboratory Testing of Soil—Part 2—Determination of Bulk Density. Romanian Standard Association: Bucharest, Romania, 2014.
- ISO 17892-3:2015; Geotechnical Investigation and Testing—Laboratory Testing of Soil—Part 3—Determination of Particle Density. Romanian Standard Association: Bucharest, Romania, 2015.
- ISO 17892-4:2016; Geotechnical Investigation and Testing—Laboratory Testing of Soil—Part 4—Determination of Particle Size Distribution. Romanian Standard Association: Bucharest, Romania, 2016.
- ISO 17892-12:2018; Geotechnical Investigation and Testing—Laboratory Testing of Soil—Part 12—Determination of Liquid and Plastic Limits. Romanian Standard Association: Bucharest, Romania, 2018.
- ASTM D4373-14; Standard Test Method for Rapid Determination of Carbonate Content of Soils. ASTM International: West Conshohocken, PA, USA, 2021.
- ISO 17892-7:2017; Geotechnical Investigation and Testing—Laboratory Testing of Soil—Part 7—Unconfined Compression Test. Romanian Standard Association: Bucharest, Romania, 2017.
- ASTM D7012; Compressive Strength and Elastic Moduli of Intact Rock Core Specimens under Varying States of Stress and Temperatures. ASTM International: West Conshohocken, PA, USA, 2023.
- ISO 17892-8:2018; Geotechnical Investigation and Testing—Laboratory Testing of Soil—Part 8—Unconsolidated Undrained Triaxial Test. Romanian Standard Association: Bucharest, Romania, 2018.
- ISO 17892-10:2018; Geotechnical Investigation and Testing—Laboratory Testing of Soil—Part 10—Direct Shear Tests. Romanian Standard Association: Bucharest, Romania, 2018.
- European Commission; Joint Research Centre. Determination of Representative Values from Derived Values for Verification with Limit States with EN 1997: Guidelines for the Application of the 2nd Generation of Eurocode 7: Geotechnical Design; Publications Office: Luxembourg, 2025. [Google Scholar]
- Bond, A.; Harris, A. Decoding Eurocode 7, 1st ed.; Taylor & Francis: London, UK; New York, NY, USA, 2008. [Google Scholar]
- Smith, R.E.; Jhangir, M.A.; Rinker, W.C. Selection of Design Strengths for Overconsolidated Clays and Clay Shales. In Proceedings of the 40th Symposium of Engineering Geology and Geotechnical Engineering, Logan, UT, USA, 24–26 May 2006. [Google Scholar]
- Duncan, J.M.; Wright, S.G.; Brandon, T.L. Soil Strength and Slope Stability; John Wiley & Sons, Inc.: Hoboken, NJ, USA, 2014; 333p. [Google Scholar]
- Castellanos, B.A.; Brandon, T.L. Fully Softened Shear Strength: Application, Measurement, and Correlations. In Proceedings of the International Society for Soil Mechanics and Geotechnical Engineering (ISSMGE), Cancun, Mexico, 17–20 November 2019; p. 9. [Google Scholar]
- Bernander, S. Progressive Landslides in Long Natural Slopes: Formation, Potential Extension and Configuration of Finished Slides in Strain-Softening Soils; Luleå University of Technology: Luleå, Sweden, 2011. [Google Scholar]
- Castellanos, B.A.; Brandon, T.L.; VandenBerge, D.R. Use of Fully Softened Shear Strength in Slope Stability Analysis. Landslides 2016, 13, 697–709. [Google Scholar] [CrossRef]
- Fleming, R.W. NCG Technical Report No. 15 “Empirical Study of Behavior of Clay Shale Slopes”; NCG TECHNICAL REPOR; U.S. Army Engineer Nuclear Cratering Group: Livermore, CA, USA, 1970; p. 103. [Google Scholar]
- Pávai, E. A Kolozsvár És Bánffyhunyad Közötti Vasútvonal Ingadozó Talajának Geologiai Szerkezete. Földtani Közlöny 1872, I–X, 130–145. [Google Scholar]
- Casagrande, A. Classification and Identification of Soils. Transactions of the American Society of Civil Engineers. Trans. Am. Soc. Civ. Eng. 1948, 113, 901–930. [Google Scholar] [CrossRef]
- Lamas, F.; Lamas-López, F.; Bravo, R. Influence of Carbonate Content of Marls Used in Dams: Geotechnical and Statistical Characterization. Eng. Geol. 2014, 177, 32–39. [Google Scholar] [CrossRef]


Disclaimer/Publisher’s Note: The statements, opinions and data contained in all publications are solely those of the individual author(s) and contributor(s) and not of MDPI and/or the editor(s). MDPI and/or the editor(s) disclaim responsibility for any injury to people or property resulting from any ideas, methods, instructions or products referred to in the content. |
© 2026 by the authors. Licensee MDPI, Basel, Switzerland. This article is an open access article distributed under the terms and conditions of the Creative Commons Attribution (CC BY) license.