Abstract
Drag embedment anchors (DEAs) play a vital role in maintaining the stability and safety of offshore structures, including floating wind turbines, oil rigs, and marine renewable energy systems. Accurate prediction of anchor performance is essential for optimizing mooring system designs, reducing costs, and minimizing risks in challenging marine environments. By leveraging advanced machine learning techniques, this research provides innovative solutions to longstanding challenges in geotechnical engineering, paving the way for more efficient and reliable offshore operations. The findings contribute significantly to developing sustainable marine infrastructure while addressing the growing global demand for renewable energy solutions in coastal and deep-water environments. This current study evaluated tree-based machine learning algorithms, e.g., decision tree regression (DTR) and random forest regression (RFR), to predict the holding capacity and efficiency of DEAs in sand seabed. To train and validate the results of machine learning models, the K-fold cross-validation method, with K = 5, was utilized. Eleven geotechnical and geometric parameters, including sand friction angle (φ), fluke-shank angle (α), and anchor dimensions, were analyzed using 23 model configurations. Results demonstrated that RFR outperformed DTR, achieving the highest accuracy for capacity prediction (R = 0.985, RMSE = 344.577 KN) and for efficiency (R = 0.977, RMSE = 0.821 KN). Key findings revealed that soil strength dominated capacity, while fluke-shank angle critically influenced efficiency. Single-parameter models failed to capture complex soil-anchor interactions, underscoring the necessity of multivariate analysis. The ensemble approach of RFR provided superior generalization across diverse seabed conditions, maintaining errors within ±10% for capacity and ±5% for efficiency.
1. Introduction
Drag Embedment Anchors (DEAs) are a simple yet highly effective and economical option for securing floating offshore structures like production units, drilling platforms, and renewable energy devices. Installed by applying tension that drives them into the seabed, DEAs are suitable for temporary and permanent mooring and can be reused when needed. Their lightweight design offers high holding capacity and adaptability to various seabed conditions, making them a versatile anchoring solution. Despite the widespread use of traditional drag anchors in practical projects, thanks to their low cost, reusability, and strong bearing capacity, accurately predicting their embedded trajectory and ultimate capacity remains challenging due to factors such as soil conditions and fluke design. Figure 1 illustrates the schematic of DEA.
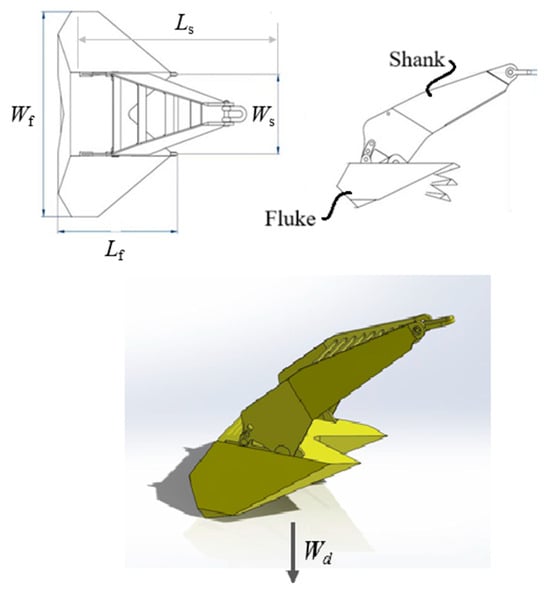
Figure 1.
Schematic layout of a drag embedment anchor.
Several researchers have advanced the understanding of drag embedment anchors (DEAs) by analyzing their static and dynamic holding capacities, embedment trajectories, and interactions with various soil types. Methods range from empirical testing and limit equilibrium analyses to kinematic modeling and quasi-static simulations, with factors such as anchor geometry, soil behavior, and installation techniques playing critical roles. While foundational studies laid the groundwork for current design guidelines, recent research emphasizes improving prediction accuracy and efficiency using analytical and experimental approaches [1,2,3,4,5,6,7].
Tian et al. [8] derived analytical solutions for the ultimate embedment depth and potential holding capacity of plate anchors in clay and sand. The authors supposed that the plate anchor is a rigid circular disk that penetrates the soil under a constant horizontal load, and applied limit equilibrium analysis and plasticity theory to model the soil failure mechanism and the soil-anchor interaction. They obtained closed-form expressions for ultimate embedment depth and potential holding capacity of plate anchors in terms of soil parameters, anchor geometry, and load angle, and compared the analytical solutions with experimental data and numerical results, showing good agreement. The study suggested simple and accurate approaches for predicting the performance of plate anchors in clay and sand seabed. Tian et al. [8] focused on plate anchors, which are fundamentally different from drag embedment anchors in both design and installation methods. Plate anchors are generally installed vertically or via suction, and their behavior is governed by their orientation, embedment depth, and soil conditions. In contrast, drag embedment anchors are dragged horizontally across the seabed during installation, creating complex trajectories and soil-anchor interaction mechanisms.
Moharrami and Shiri [9] conducted a reliability analysis of drag embedment anchors intended for use in deep offshore regions of Canada. Their study focused on estimating the probability of failure for these anchors when used with intact catenary mooring lines. They incorporated probabilistic models to represent seabed soil conditions and environmental loads specific to deep-water locations near Newfoundland and Labrador. Additionally, they simulated the ultimate holding capacity of the anchors using plastic yield loci, accounting for the embedded chain’s geometry and frictional resistance. In a subsequent study, Moharrami and Shiri [10] evaluated the reliability of drag embedment anchors in clay seabed using a first-order reliability method. This analysis considered uncertainties in soil properties, anchor configuration, and external loading, and the results were compared against those derived from conventional deterministic design approaches.
Zhang et al. [11] examined the uplift behavior of drag embedment anchors in sand, focusing on applications for renewable energy systems like floating wind turbines. Laboratory tests analyzed group anchor performance under varying embedment depths and spacings. Results showed reduced group efficiency at close spacing due to overlapping failure zones. Deeper embedment improved capacity but was limited by group effects. The findings aid in optimizing mooring systems for offshore renewable energy infrastructure.
Chen et al. [12] explored the six-degree-of-freedom (6DOF) behavior of drag embedment anchors (DEAs) in clay through both numerical modeling and large-scale experimental testing. They developed a 6DOF model based on rigid body dynamics and soil-anchor interaction, validating it against physical tests that measured anchor trajectory, orientation, and capacity. Their findings demonstrated that the model reliably predicts DEA performance and highlighted the significant influence of anchor geometry, soil properties, and load direction, offering valuable insights for the effective design and optimization of DEAs in clay seabed.
Guo et al. [13] investigated the axial resistance of embedded mooring chains in South China Sea carbonate sand, focusing on how resistance varies with confining stress. This was critical for understanding and improving the performance of DEAs used in mooring floating offshore structures such as wind turbines and oil platforms.
DEAs can withstand steady loads effectively; however, their performance under dynamic or rapidly changing forces is less predictable. To address this, designers often apply safety factors based on the mooring line’s load capacity. Additional considerations may include seabed erosion and hydrodynamic forces. Despite these factors, the DEA design remains relatively straightforward. They offer key advantages such as adaptability to various seabed conditions, as well as ease and speed of manufacturing and installation [14].
Although Drag Embedment Anchors (DEAs) are simple to install, accurately predicting their geotechnical performance is complex due to the three-dimensional nature of anchor–soil interaction. Traditional methods often simplify the problem to 2D models or rely on costly and time-intensive experimental or numerical techniques, such as large deformation finite element analysis (FEA). These limitations highlight the industry’s ongoing need for more efficient, accurate, and cost-effective solutions.
Traditional FEA, especially when used for large deformation seabed modeling, is hindered by high computational costs, numerical instability in plastic zones, and complex meshing and convergence issues. In contrast, real-time predictions, robustness across non-linear ranges, scalability to large design datasets, and flexibility for extension to multi-layer soils, cyclic loads, or real-time control are offered by the proposed ML-based framework. Thus, industry demands for rapid, cost-efficient design validation without accuracy compromise are effectively addressed.
The holding capacity being defined as the maximum horizontal load that can be resisted by the drag anchor before failure, based on embedment depth and soil resistance, while efficiency is calculated as the ratio of holding capacity to submerged weight, which reflects how effectively the anchor’s weight is converted into load-bearing resistance, a performance indicator commonly used in offshore mooring applications.
Machine Learning (ML) offers a promising alternative by capturing complex, non-linear relationships that traditional models may overlook [15]. However, existing ML studies on DEAs have often been limited in scope, failing to account for variations in anchor geometry, soil properties, and environmental conditions due to the use of small or narrow datasets.
This study addresses these gaps by developing two robust Tree-based ML algorithms, e.g., decision tree regression (DTR) and random forest regression (RFR), to predict the holding capacity and efficiency of DEAs. The approach includes four key steps: data generation (covering diverse anchor types, soil conditions, and loads using iterative analytical methods), data preprocessing (cleaning and transforming data for ML use), model training (applying algorithms like decision tree and random forest regression), and model evaluation (assessing performance based on accuracy, correlation, and complexity). The framework also incorporates sensitivity and uncertainty analyses to enhance model reliability and practical applicability in offshore mooring system design.
2. Methodology
2.1. Decision Tree Regression (DTR)
Using decision trees, machine learning can be achieved in a non-parametric manner. An algorithm for supervised learning determines and labels input variables. There is a hierarchical structure to a decision tree, which consists of an internal node, branches, and leaf nodes. The decision tree method divides the data into binary categories based on defined parameters called features for classification. A measure of ML’s accuracy can be found by measuring its entropy.
A set of nodes and branches makes up a tree data structure, in which each node is a decision tree (DT). The DT can be used to solve both classification and regression problems. The DT comprises several parts, including a root node, internal nodes, branches, and some leaf nodes. The root node is located at the top of the tree, while the terminal nodes (leaf nodes) contain class labels. The non-leaf nodes are referred to as internal nodes, and they are interconnected using branches [16]. To ensure the fitness function in the DT algorithm, the mean squared error (MSE) was used in the present study.
Despite their advantages, decision trees have notable drawbacks. One significant limitation is their tendency to overfit the training data, especially when the tree is deep and highly complex. Overfitting occurs when the model captures noise or random fluctuations in the training data rather than the underlying pattern, resulting in poor generalization to unseen data. This issue can be mitigated through pruning techniques, limiting tree depth, or using ensemble methods like random forests that aggregate multiple trees to reduce variance.
2.2. Random Forest Regression (RFR)
The random forest algorithm is a powerful ensemble learning method utilized for both classification and regression problems [17,18]. It serves as an extension of the Classification and Regression Tree (CART) algorithm, addressing one of its common issues, overfitting. Compared to CART, the random forest algorithm exhibits robustness against overfitting, making it a more reliable option [18].
The random forest algorithm operates by constructing multiple decision trees and combining their results through a voting process [17,18,19]. This approach enables the algorithm to provide accurate predictions by aggregating the outputs of individual trees. In the context of random forest regression, the number of trees created for a random vector is increased. The input and output parameters of the tree predictor are treated as numerical values. By generating a random vector of trees and independently constructing each tree using the training dataset, the algorithm calculates the mean squared generalization error [17,19].
To enhance the performance of random forest models, a weighted correlation between residuals and applied randomization is employed, effectively reducing the average error [17]. Additionally, this method utilizes bootstrap replicas, which are sets of resampled data generated based on the given dataset. These replicas serve multiple purposes, including filling in potential missing data and improving the quality of the trees within the random forest [19].
In summary, the random forest algorithm overcomes the overfitting issue associated with the CART algorithm, providing increased reliability. By constructing multiple decision trees and leveraging a voting mechanism, it produces accurate predictions. Moreover, the utilization of weighted correlation, along with bootstrap replicas, contributes to minimizing errors and enhancing the performance of random forest models.
Figure 2 shows the flowchart of the methodology for predicting the performance of DEAs using machine learning (ML) techniques, integrating both data-driven and geotechnical engineering perspectives. The process began with data collection, where the inputs consisted of critical anchor and soil parameters such as fluke-shank angle (α), soil strength (φ), embedment depth, and other relevant geometric and geotechnical features. Following this, data preprocessing was conducted to ensure quality and consistency, including normalization, outlier removal, and handling of missing values. Feature selection was then employed using statistical correlation techniques to identify dominant input variables influencing DEA capacity and efficiency. The refined dataset was split into training and testing subsets, and two ML models, DTR and RFR, were developed and trained. These models were evaluated using statistical metrics, allowing for a comprehensive assessment of their predictive accuracy. A model validation step confirmed the generalizability of the trained models across unseen data. Finally, performance interpretation involved radar plots and sensitivity analyses to quantify the influence of individual features, where RFR was demonstrated to outperform DTR, providing robust, reliable predictions. This workflow not only ensured a scientifically rigorous approach but also enabled the practical deployment of ML in offshore engineering design scenarios.
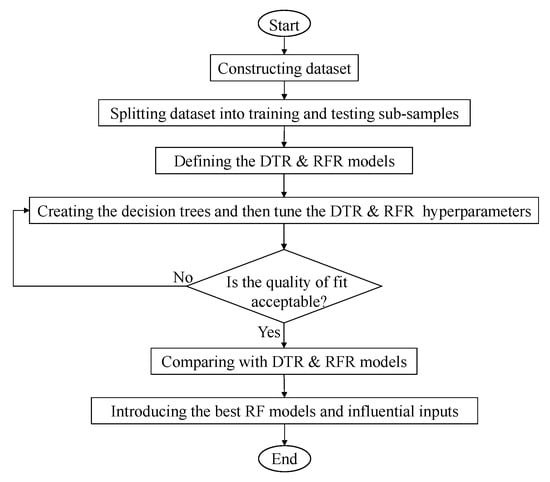
Figure 2.
Flowchart of the methodology for predicting the performance of DEAs.
2.3. Development of Models
This study is intended to develop data-driven models for predicting the performance of tensile anchors that consider the characteristics of the anchor as well as the relevant soil. The anchoring behavior of sand has been studied by a series of high-quality centrifugal anchor tests, where an extensive array of anchor force and kinematic data has been gathered. Additionally, the study of anchor chain behavior plays a vital role in the overall performance of the anchor system. Based on the results of these studies, static and kinematic models were developed for the drag anchor behavior, from which, in a simulation program, by entering various parameters, the capacity and efficiency of the anchor could be determined. Thus, the data generated by machine learning algorithms have been analyzed to determine the influence of the parameters on anchor behavior.
2.4. A Theoretical Study of Drag Anchors in Sand
Several factors determine drag embedment anchor capacities, including their size, shape, weight, and soil conditions at the seabed or riverbed. Anchor capacity may be affected by the design of a structure as well as the depth of the water and tidal and current conditions.
A theoretical model of the problem can be simplified by considering two fundamental aspects of drag anchor behavior. A correct understanding and model of the forces acting on the anchor at any given depth and orientation begins with an understanding of the balance of forces on the anchor. To predict the chain tension, the ultimate tension necessary to move the anchor, a static analysis adopts a system of forces acting on the anchor. These forces are evaluated for given soil properties and anchor geometry.
A second fundamental aspect to consider once the forces acting on the anchor are understood is how it will move at failure for a specific chain load orientation.
Chains are commonly used in drag embedment anchors. Anchor tension is transferred to the anchor shank padeye by the chain attached to the mooring line. The ultimate anchor capacity can be determined by both soil resistance and the frictional capacity of a chain [8,20,21] and can play a major role in overall system behavior.
As a result of the chain frictional capacity and second, the angle of the attachment points on the anchor, the soil-chain interaction should be analyzed. To implement the soil-chain interaction effects, Neubecker and Randolph [22] used a simplified closed-form solution. According to the model, there is an equilibrium force between the friction force F and the normal soil reaction Q for a segment of the embedded anchor chain, as shown in Figure 3.
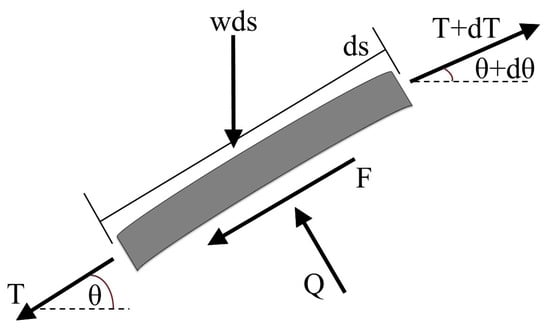
Figure 3.
Force equilibrium of the chain element embedded in the soil.
For the following general soil strength profile given by Neubecker and Randolph [22], the frictional capacity of the embedded anchor chain can be calculated as follows:
where su is undrained shear strength; k is the gradient of shear strength with depth; z is depth; α is soil profile index; Ta is chain tension at anchor; θa is chain inclination at anchor; da is the depth of the chain attachment point; is average normal resistance of chain over embedment depth; To is chain tension at mudline; µ is chain-soil friction coefficient; θo is chain inclination at mudline; z* is depth normalized by da; x* is horizontal distance normalized by da; w is chain self-weight per unit length; s is the length of chain; and θ is the chain angle in any given point.
2.5. Finite Element Modeling of Floating System
A floating wind turbine platform with a catenary spread mooring system was considered in the current study. The mooring design includes eight lines that each have a chain/wire-rope/chain structure. The lower and upper sections of the mooring system are chains, whereas the middle segment is a wire rope. The platform was supposed to be at a water depth of 700 m in the Caspian Sea. To involve the environmental loads on the platform and obtain the resulting tension forces in the mooring system touchdown point (TDP), a finite element analysis (FEA) model was conceptualized. The most laboriously burdened line was specified for a 100-year return period sea state, while significant wave height (Hs) = 9.5 m, spectral peak period (Tp) = 12.8 s, and wind velocity (U10) = 29 m/s, via generating 3 h’ time histories at TDP. The most important outcomes of the mooring system simulation, such as the design line tension (Td), the line angle at mudline (θo), the characteristic mean tension (Tmean-C), and characteristic mean maximum dynamic tension (Tdyn,max-C) for 100-year return period sea states, are provided in Table 1.

Table 1.
Applied parameters for the simulation of the catenary mooring system.
Based on the studies conducted and the standards used in the field of drag anchors and their performance in the sand, 11 important parameters in soil and anchors that affect anchor capacity were identified as data input parameters, including effective unit weight ɣ’ (KN/m3), Peak friction (Deg), Dilation angle ψ (Deg), Anchor friction δ (Deg), Anchor weight W (kg), Fluke-shank angle α(Deg), Fluke length Lf(m), Fluke width bf(m), Shank width bs(m), Shank length Ls (m) and Anchor submerged weight, Wa′ (kN) and were determined to determine anchor capacity and efficiency. Using the existing relationships and equations for the anchor in a programming language, a value for the anchor’s capacity and efficiency was determined and defined as an output of data. To evaluate the anchor capacity and anchor efficiency from the created data, 23 different models were created using machine learning and decision tree algorithms. Figure 4 depicts the DTR models developed based on combinations of input parameters.
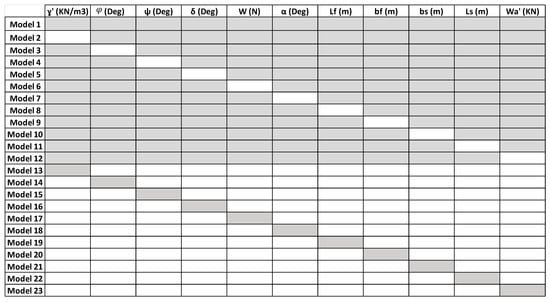
Figure 4.
Combinations of input parameters to develop ML models.
The dataset in this study was synthetically generated using a combination of theoretical models, validated analytical solutions, and finite element simulations grounded in geotechnical engineering literature, with key references including [8,12,22] that provided a sound physical basis for data generation. A total of 50 samples were generated to capture a range of seabed and anchor configurations, with 11 input parameters comprising geotechnical properties (effective unit weight γ′: 8–13 KN/m3, peak friction angle φ: 28°–45°, dilation angle ψ: 0°–15°, anchor–soil interface friction δ: 20°–35°), geometric characteristics (fluke length Lf: 1.2–2.5 m, fluke width bf: 0.3–0.6 m, shank width bs, shank length Ls, fluke–shank angle α: 25°–45°), and other factors (anchor weight W: 7845.32–13,729.31 kg, submerged weight Wa′), while output targets included holding capacity (~1500–9000 KN) and efficiency. Feature importance and sensitivity analysis were also applied in the manuscript to assess feature influence, indirectly capturing correlation structure, with the models identifying fluke length, peak friction angle, and fluke–shank angle as dominant predictors, consistent with established geomechanical theory.
The dataset employed in the present study was synthetically generated rather than obtained from direct laboratory or field measurements. Its construction was carried out through a combination of validated analytical solutions, finite element simulations, and theoretical models derived from established geotechnical engineering literature. References [8,12,22] were used to ensure that the simulated data were consistent with documented drag embedment anchor (DEA) behavior in sandy seabeds.
The parameterization of the dataset was based on full-scale anchor configurations. Geometric dimensions, unit weights, and soil strength ranges were selected to match those reported for offshore installations and experimental programs in sandy soils. The finite element simulations were calibrated against trends observed in published centrifuge and full-scale studies so that scale fidelity was preserved. No reduced-scale experimental results were directly incorporated into the dataset.
As the data were generated from models, no direct measurement errors, such as sensor noise or calibration drift, were present. However, uncertainty arose from modeling assumptions, including the representation of soil as homogeneous and isotropic. This uncertainty was addressed indirectly by applying broad parameter ranges to capture realistic variability in geotechnical and geometric properties. Sensitivity and feature importance analyses were subsequently performed to confirm that the developed machine learning models maintained robustness across the simulated variability.
Since no physical test beds were involved, non-uniformity due to differences in seabed preparation or stratification was not present in a literal sense. Instead, non-uniformity was emulated parametrically by systematically varying key soil properties such as peak friction angle (φ), dilation angle (ψ), and effective unit weight (γ′) across ranges documented for natural sandy seabeds. This procedure was intended to reproduce the diversity of seabed conditions while maintaining a controlled and reproducible dataset generation process.
To ensure reproducibility and facilitate application by other researchers, complete input and output parameter ranges, along with their units, were reported in the manuscript. References to all physical and numerical models used for data generation were provided, allowing the dataset to be reproduced under identical assumptions. It was clarified that the dataset and trained models were most directly applicable to full-scale DEA installations in sandy seabeds, and that application to clay or layered seabeds would require retraining with suitably representative data.
The 11 parameters were selected based on their relevance in the mechanics of anchor–soil interaction, their presence in prior experimental and analytical studies [14,21], and their representation of both material properties and geometric configuration. The necessity of these parameters was confirmed by feature importance analysis, as their removal was found to degrade model performance.
According to Figure 4, model 1 was created with all eleven input parameters; however, in the analysis of models 2 to 12, one input parameter was removed each time to determine the optimal model. The analysis of models 13 through 23 has been performed with only one input parameter, allowing the identification of the effective parameters to be performed.
To train and validate the results of machine learning models, the K-fold cross-validation method, with K = 5, was utilized. This approach divides the dataset into five equal-sized subsets (folds), where each fold serves as a validation set once, while the remaining four folds are used for training. The process is repeated five times, ensuring that every data point is used for both training and validation exactly once. The K = 5 configuration was chosen as it offers a good balance between computational efficiency and reliable performance estimation, providing sufficient validation iterations while maintaining adequate training data size in each fold.
To properly assess model generalization and detect potential overfitting, the dataset was initially split into training (80%) and test (20%) sets, with the test set held out entirely during the model development process. The K-fold cross-validation was performed exclusively on the training set to select optimal hyperparameters and evaluate model performance during development. After model selection and training were completed, a final performance evaluation was conducted on the previously unseen test set. This methodology ensures an unbiased assessment of model performance, as the test set metrics provide a reliable indicator of how well the models will generalize to new, unseen data. Comparison between the cross-validation scores and test set performance allows for detection of overfitting—significant degradation in test performance relative to validation performance would indicate that the model has memorized training patterns rather than learned generalizable features.
2.6. Quality of Fit
To examine the precision, correlation, and complexity of DTR models, five criteria were utilized, such as correlation coefficients (R), root mean square errors (RMSEs), the Willmott Index (WI), coefficients of residual mass (CRMs), and Akaike Information Criteria (AICs). These DTR models were evaluated based on the R and WI criteria. These models were, however, assessed for their precision using RMSE indices. DTR models have also been evaluated based on their performance and complexity using WI and AIC. R, and WI criteria were found to be highly correlated with values observed when compared to one representing the TDR model. Based on the proximity of the RMSE and CRM indices to zero, it appears that the TDR model has the lowest degree of imprecision; however, the complexity of the TDR model has not been examined based on the indices introduced. This restriction was overcome using the Akaike Information Criteria (AIC). Therefore, the best DTR model would have the lowest AIC index as well as the lowest error levels (RMSE and CRM), along with the highest correlation (R and WI) [17]:
The values of Oi, Pi, , , n and k are the observations, the predicted amounts, the average observational values, the average predicted amounts, the number of observations, and the number of independent variables.
3. Results and Discussion
Table 2 demonstrates the results of statistical indices for the capacity of the DEA predicted by the DTR models. The DTR models provided a clear hierarchy in predictive performance based on input parameters. DTR 1 to 12 exhibited strong predictive capability, with correlation coefficients (R) ranging from 0.937 to 0.973 and RMSE values between 441.5 KN and 671.3 KN. Notably, DTR 6 emerged as the optimal model, achieving an R of 0.973 and an RMSE of 441.5 KN, indicating that excluding certain parameters (e.g., shank width bs) did not significantly degrade performance. In contrast, DTR 13 to 23, which utilized only single parameters, performed poorly, with R values as low as 0.098 (DTR 18) and RMSE values exceeding 1800 KN. This stark decline underscored the multivariate nature of anchor capacity prediction, where isolated parameters cannot capture the complex interactions governing anchor behavior.

Table 2.
Results of statistical indices for the capacity of the DEA predicted by the DTR models.
Anchor capacity in sand was governed by soil strength parameters (e.g., peak friction angle φ, dilation angle ψ) and anchor geometry (e.g., fluke length Lf, fluke width bf). The strong performance of DTR 6 suggested that fluke geometry and soil friction are dominant factors, aligning with geotechnical theory that anchor holding capacity is primarily a function of shear resistance along the fluke-soil interface.
Hence, DTR 6 as a function of effective unit weight (ɣ′), peak friction (φ), dilation angle (ψ), dnchor friction (δ), fluke-shank angle (α), fluke length (Lf), fluke width (bf), shank width (bs), shank length (Ls), and anchor submerged weight (Wa’) showed the highest level of precision, correlation, and the lowest level of complexity. According to the sensitivity analysis, fluke length (Lf) was recognized as the most influential input parameters to predict the anchor holding capacity using the DTR algorithm.
Table 3 presents the results of statistical indices for the capacity of the DEA predicted by the RFR models. The Random Forest Regression (RFR) models consistently outperformed DTR, with RFR 5 emerging as the top performer (R = 0.985, RMSE = 344.577 kN). This represented a 22% improvement over the best DTR model, highlighting the advantages of ensemble learning in handling non-linear relationships. The robustness of RFR models, even with reduced parameters (e.g., RFR 8–12), suggested effective identification of key parameter interactions. Regarding the modeling results, RFR’s success stemmed from its ability to simulate progressive soil failure, particularly in cohesive sediments where strain-softening behavior was significant. The model accurately captured the combined effects of soil density (γ′), friction angle (φ), and anchor geometry, mirroring real-world anchor behavior across diverse seabed conditions.

Table 3.
Results of statistical indices for the capacity of the DEA predicted by the RFR models.
Therefore, RFR 5 was known as the superior RFR model to predict the holding capacity of DEAs using the RFR algorithm. The RFR 5 model predicted the target value using effective unit weight (ɣ’), peak friction (φ), dilation angle (ψ), anchor weight (W), fluke-shank angle (α), fluke length (Lf), fluke width (bf), shank width (bs), shank length (Ls), and anchor submerged weight (Wa’), whereas RFR 19 was identified as the best model between the models with one input parameter (Lf), so fluke length had the hieghest level of effectiveness to model the target values.
Table 4 shows the results of statistical indices for the efficiency of the DEA predicted by the DTR models. DTR models for efficiency prediction showed that DTR 1 (R = 0.971) and DTR 19 (R = 0.764) were the most reliable. The significant performance gap between these and single-parameter models (DTR 13 to 23) underscored that efficiency depended on specific parameter combinations, particularly fluke-shank angle (α) and submerged weight (Wa’). Sensitivity analysis revealed that DTR 19′s relative success was due to its focus on parameters governing energy dissipation during anchor setting. The poor performance of single-input models confirmed that no isolated variable could adequately represent the complex soil-flow mechanisms around the anchor fluke.

Table 4.
Results of statistical indices for the efficiency of the DEA predicted by the DTR models.
Thus, DTR 1, as a function of all inputs, demonstrated the highest degree of accuracy, correlation, and simplicity in estimating the efficiency of DEAs. Moreover, fluke length (Lf) was the most important input parameter to model the efficiency of the DEA, since DTR 19 was the best model among the DTR models with one input.
Table 5 represents the results of statistical indices for the efficiency of the DEA predicted by the RFR models. RFR models demonstrated exceptional consistency, with RFR 6 (R = 0.977) and RFR 19 (R = 0.767) leading in efficiency prediction. The minimal variation between RFR 1–12 indicated that the ensemble method effectively prioritized the most influential parameters, such as α and Wa’. From a geotechnical standpoint, RFR’s accuracy reflected its ability to model energy transfer during anchor penetration, including soil deformation and frictional losses. The maintained performance with fewer parameters suggested that the algorithm identified physically dominant interactions, aligning with experimental observations of anchor behavior.

Table 5.
Results of statistical indices for the efficiency of the DEA predicted by the RFR models.
Therefore, RFR 6, as the best RFR model in estimating the efficiency of the DEA, predicted the objective function in terms of effective unit weight (ɣ’), peak friction (φ), dilation angle (ψ), dnchor friction (δ), fluke-shank angle (α), fluke length (Lf), fluke width (bf), shank width (bs), shank length (Ls), and anchor submerged weight (Wa’). Similarly, among the models with one input, RFR 19 was the best model, as a result, the fluke length (Lf) was detected as the most significant parameter to model the efficiency of DEA in the sand seabed.
Figure 5 shows the scatter plots for the best DTR and RFR models for modeling the holding capacity and efficiency of the DEAs in the sand seabed. Regarding the modeling results, the superior ML models demonstrated the highest level of correlation in comparison to other ML models. The scatter plots illustrated RFR’s superior predictive capability. For capacity, RFR 5 (Figure 5c) exhibited tight clustering around the 1:1 line, while DTR 19 (Figure 5b) showed dispersion at higher loads. DTR 6 showed strong agreement between simulated and observed capacities using a DTR with 10 input features. Most points are situated close to the diagonal, indicating good prediction accuracy. For efficiency, RFR 6 (Figure 5g) achieved near-perfect alignment, whereas DTR 19 (Figure 5f) underestimated efficiency in low-friction soils. The RFR 6 model provided a good prediction of efficiency, closely following the observed trend.
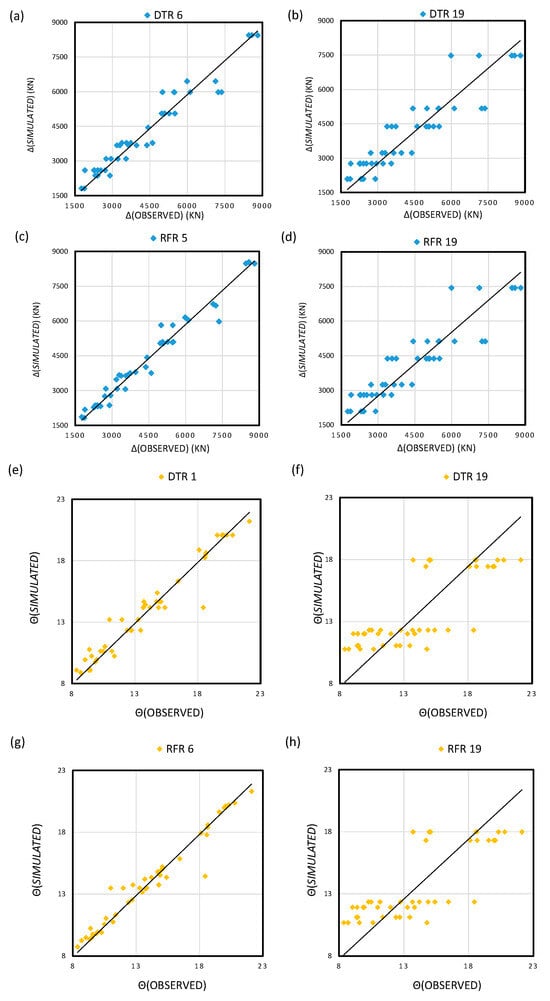
Figure 5.
Scatter plots for (a) capacity predicted by DTR 6 (b) capacity predicted by DTR 19 (c) capacity predicted by RFR 5 (d) capacity predicted by RFR 19 (e) efficiency predicted by DTR 1 (f) efficiency predicted by DTR 19 (g) efficiency predicted by RFR 6 (h) efficiency predicted by RFR 19.
Geotechnically, these trends mirrored the non-linear response of marine sediments to anchor loading. RFR’s ensemble approach better captured the transition from elastic to plastic soil behavior, a critical factor in capacity and efficiency prediction. RFR models tended to be more stable than DTR, especially RFR 5 and RFR 6.
Figure 6 demonstrates the results of error analysis for the best DTR and RFR models to predict the holding capacity and efficiency of DEAs. Error distributions revealed that RFR models (Figure 6c,g) maintained symmetric, low-magnitude errors, while DTR models (Figure 6b,f) exhibited skewness. This indicated that RFR balanced predictions across all soil conditions, whereas DTR struggled with extreme values. RFR 5 achieved the best performance for both capacity (83% < 10% error) and efficiency (94% < 10% error), while DTR 1 also demonstrated strong results for efficiency (90% < 10% error). For the DTR 6 model, 71% of predictions were within 10% error, and only 2% exceeded 20%, indicating strong predictive performance. The holding capacity predicted by the DTR 19 model had an error of 23% within a 10% range, and 25% of the results had errors of greater than 20%. In contrast, models using 19 features (DTR 19 and RFR 19) performed poorly, with a notable increase in errors ≥ 20%. Overall, the results suggested that Random Forest models outperformed Decision Trees, and that minimizing the number of input features significantly enhanced prediction reliability. The geotechnical interpretation highlighted RFR’s advantage in handling heterogeneous seabed, where anchor performance varied significantly with soil type and density. DTR’s limitations in extrapolating beyond training data were particularly evident in cohesive soils.
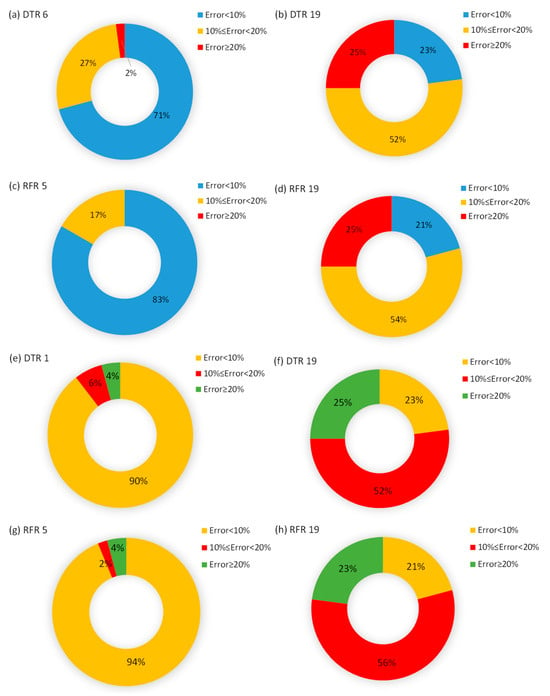
Figure 6.
Error analysis plots for (a) capacity predicted by DTR 6 (b) capacity predicted by DTR 19 (c) capacity predicted by RFR 5 (d) capacity predicted by RFR 19 (e) efficiency predicted by DTR 1 (f) efficiency predicted by DTR 19 (g) efficiency predicted by RFR 6 (h) efficiency predicted by RFR 19.
Figure 7 shows the discrepancy ratio (DR) values, minimum, average, and maximum, for both capacity and efficiency predictions using different models. DR is defined as the predicted values to observed values ratio, and the magnitude of the DR approaching unity indicates the better performance of the ML model. For capacity predictions, DR(max) consistently reached around 1.6 across all models (a & d), while DR(min) remained close to zero, and DR(ave) hovered around 0.6–0.7. For efficiency predictions (e & h), a similar pattern was observed: DR(max) values were also near 1.6, DR(min) close to 0, and DR(ave) values fell in the 0.6 to 0.7 range, indicating comparable dispersion and consistency in prediction discrepancies across all models.
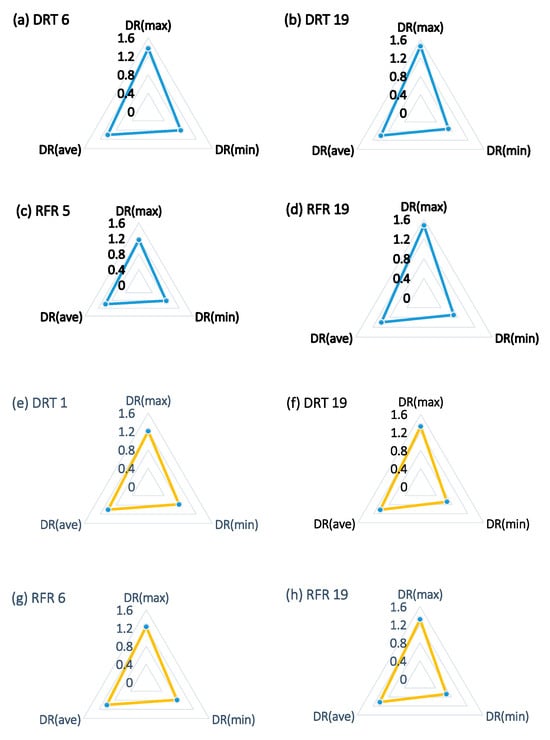
Figure 7.
Discrepancy ration analysis plots for (a) capacity predicted by DTR 6 (b) capacity predicted by DTR 19 (c) capacity predicted by RFR 5 (d) capacity predicted by RFR 19 (e) efficiency predicted by DTR 1 (f) efficiency predicted by DTR 19 (g) efficiency predicted by RFR 6 (h) efficiency predicted by RFR 19.
RFR models (Figure 6c,g) consistently stayed within ±10% error bands for capacity and ±5% for efficiency. In contrast, DTR models (Figure 6b,f) exceeded ±20% errors in certain conditions.
These results aligned with field data, where anchor capacity in stiff clay and efficiency in loose sand showed high variability. RFR’s robustness against such variability made it preferable for practical applications.
Figure 8 presents a comparison between observed and predicted values for two different performance metrics, capacity and efficiency, using DTR and RFR models across varying configurations. Subplots (a) through (d) depicted the capacity predictions, while (e) through (h) illustrated the efficiency predictions. Overall, both regression models demonstrated a strong ability to track the observed trends, although prediction accuracy varied across configurations. For capacity prediction, DTR 6 (a) and RFR 5 (c) closely follow the peaks and troughs of the observed values, indicating excellent fitting, while DTR 19 (b) and RFR 19 (d) showed slightly more deviation, particularly at sharp peaks, suggesting some reduced generalization. Similarly, in efficiency prediction, DTR 1 (e) and RFR 6 (g) showed high consistency with observed values, capturing fluctuations well. On the other hand, DTR 19 and RFR 19 revealed more scattered predictions, with noticeable divergence from observed trends, particularly between observation numbers 10 and 30. This indicated that lower tree depth (or fewer estimators) might help preserve model generalizability in these cases. Hence, the DTR 6, RFR 5, DTR 1, and RFR 6 models seemed to perform better, potentially due to reduced complexity and overfitting.
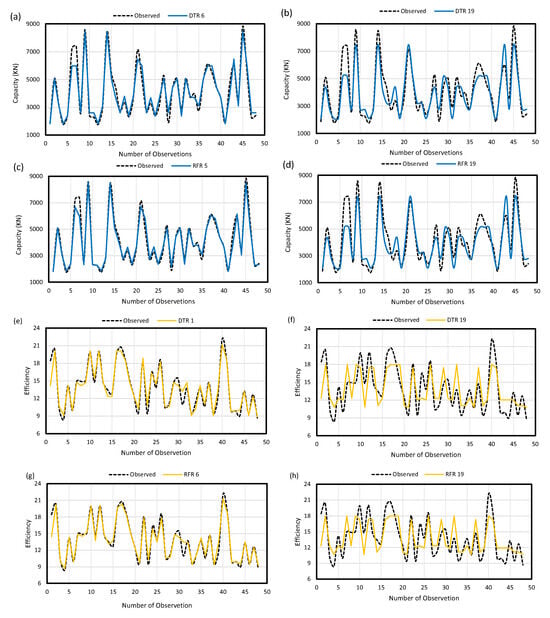
Figure 8.
Comparison between observed with (a) capacity predicted by DTR 6 (b) capacity predicted by DTR 19 (c) capacity predicted by RFR 5 (d) capacity predicted by RFR 19 (e) efficiency predicted by DTR 1 (f) efficiency predicted by DTR 19 (g) efficiency predicted by RFR 6 (h) efficiency predicted by RFR 19.
RFR models matched observed values across the full range, while DTR models deviated at extremes. This demonstrated RFR’s ability to generalize across diverse geotechnical conditions. The geotechnical significance was in RFR’s simulation of progressive anchor-soil failure, a complex phenomenon that single-tree models like DTR could not fully capture. This explained RFR’s superior performance in real-world scenarios.
The study demonstrated that RFR significantly outperformed DTR in predicting both anchor holding capacity and efficiency due to its ensemble learning approach, which effectively handled complex, non-linear relationships in the data. Key parameters influencing predictions were identified, with soil strength (φ) proving critical for capacity estimation and fluke-shank angle (α) being paramount for efficiency assessment. Single-parameter models consistently failed to capture the intricate soil-anchor interactions, underscoring the necessity of multivariate analysis for accurate predictions. RFR exhibited superior performance characteristics, maintaining a symmetric and tightly distributed error pattern that remained within ±10% for capacity and ±5% for efficiency, meeting rigorous engineering standards. These robust findings offered valuable, practical insights for offshore anchor design optimization, highlighting the transformative potential of advanced machine learning techniques in geotechnical engineering applications. The research validated RFR as a reliable predictive tool capable of addressing the complex, multi-faceted challenges inherent in marine foundation design, while simultaneously demonstrating the limitations of simpler modeling approaches in this domain.
To rigorously mitigate the overfitting issue, 5-fold cross-validation (K = 5) was incorporated into the methodology during model training and evaluation. The data was randomly partitioned into 5 equal subsets (folds), with 4 folds being used for training and 1 for testing in each iteration, and this process was repeated five times to ensure that each sample served as a test instance once, while final performance metrics were averaged across the 5 runs to reduce variance and prevent overfitting to any particular partition, thus ensuring that the reported performance metrics (e.g., RMSE, R, AIC, Willmott Index) reflect true generalization ability rather than mere in-sample fitting. Evidence of controlled overfitting was demonstrated through RFR models that exhibited tight error bands with 83% of predictions within ±10% error for capacity and 94% within ±5% for efficiency, while DTR models showed more dispersion but still provided useful baseline comparisons, and discrepancy ratio analysis confirmed that model predictions closely tracked observed values across the full dataset with low variance across folds.
Feature sensitivity analysis and model pruning were included in the methodology, with both approaches identifying dominant physical relationships where capacity was found to be influenced by peak friction angle (φ) and dilation angle (ψ) governing shear strength, as well as fluke length (Lf) and fluke width (bf) controlling bearing area and interaction depth, while efficiency was influenced by fluke–shank angle (α) and submerged weight (Wa′) affecting embedment trajectory and load transfer. These findings were observed to match field observations and mechanistic expectations [2], and the superior performance of multivariate models versus univariate models was noted to quantitatively reinforce that capacity and efficiency emerge from complex, interdependent soil–anchor behaviors rather than from any single variable.
4. Conclusions
This study held substantial importance for both geotechnical engineering and offshore mooring system design by addressing critical challenges in predicting the performance of Drag Embedment Anchors (DEAs). It introduced machine learning (ML) techniques, DTR & RFR, as cost-effective, accurate, and efficient alternatives to traditional empirical and numerical methods such as finite element analysis. It was demonstrated that RFR outperformed single-tree models due to its ensemble learning approach, which better captured non-linear soil-anchor interactions. The study identified critical parameters influencing DEA performance, with soil strength (φ) being the dominant factor for holding capacity and fluke-shank angle (α) the most influential for anchor efficiency. It validated that multivariate models were essential, as single-parameter predictions failed (R < 0.5), reinforcing the need for holistic soil-anchor interaction analysis. Highly accurate predictive models (RFR with R > 0.97, RMSE < 5%) were provided for offshore mooring systems, ensuring safer and more efficient anchor deployment. The study showed that RFR maintained ±10% error for capacity and ±5% for efficiency, meeting rigorous engineering standards for reliability. It offered a data-driven framework adaptable to different seabed conditions (e.g., clay, mixed soils) and anchor designs. Economically and environmentally, the study reduced reliance on expensive experimental testing such as centrifuge tests and field trials by providing computationally efficient ML models, and enhanced sustainability by optimizing anchor designs, minimizing material waste, and improving long-term mooring stability in offshore energy projects like wind turbines and oil platforms. It set a benchmark for applying ML in geotechnical anchor analysis and encouraged further integration of AI in offshore engineering, including real-time monitoring and adaptive mooring systems. Additionally, it suggested future work on dynamic loading, cyclic seabed conditions, and hybrid ML-physics models for greater accuracy. Overall, this study bridged the gap between traditional geotechnical methods and modern data science, offering a reliable, scalable, and efficient solution for DEA performance prediction with immediate applications in offshore construction, renewable energy, and marine infrastructure, contributing to safer, more economical, and sustainable mooring systems worldwide.
The framework can be easily adapted through retraining with datasets involving clays or mixed soils, incorporation of cyclic load features, e.g., load frequency, amplitude, and utilization of transfer learning if real-world data becomes available. Future studies can be conducted to test the model under cyclic seabed stressors, erosion, and multi-anchor systems, with the model’s modular architecture being leveraged for these investigations.
As the most important practical benefits of the current study, time-consuming field and centrifuge tests for preliminary design are replaced, design optimization for floating wind farms is enabled, sustainability is improved through minimized material use, and cost-sensitive offshore installations are supported. However, limitations exist: the study is based on synthetic data, requiring calibration with field tests; validation has only been conducted for sand seabed thus far; and dynamic loading, along with long-term degradation effects, have not yet been modeled. These aspects are openly highlighted, and future research directions are suggested.
Author Contributions
Conceptualization, H.S.; methodology, M.O. and H.A.; software, M.O. and H.A.; validation, M.O. and H.A.; formal analysis, M.O. and H.A.; investigation, M.O. and H.A.; resources, H.S.; data curation, M.O.; writing—original draft preparation, M.O. and H.A.; writing—review and editing, H.S., M.O. and H.A.; visualization, M.O. and H.A.; supervision, H.S.; project administration, H.S.; funding acquisition, H.S. All authors have read and agreed to the published version of the manuscript.
Funding
This research received no external funding.
Data Availability Statement
All data and materials are available on request from the corresponding author. The data are not publicly available due to ongoing researches using a part of the data.
Conflicts of Interest
The authors declare no conflict of interest.
References
- Rocker, K. Handbook for Marine Geotechnical Engineering. NCEL, Deep Ocean Technology; NCEL: Port Hueneme, CA, USA, 1985. [Google Scholar]
- Neubecker, S.R.; Randolph, M.F. The performance of drag anchor and chain systems in cohesive soil. Mar. Georesources Geotechnol. 1996, 14, 77–96. [Google Scholar] [CrossRef]
- Ruinen, R.; Degenkamp, G. Prediction of the holding capacity and trajectory of drag embedment anchors. In Proceedings of the Offshore Technology Conference, Houston, TX, USA, 6 May 2002; p. OTC-14305. [Google Scholar]
- Aubeny, C.P.; Chi, C. Mechanics of drag embedment anchors in a soft seabed. J. Geotech. Geoenvironmental Eng. 2010, 136, 57–68. [Google Scholar] [CrossRef]
- Shin, H.K.; Seo, B.C.; Lee, J.H. Experimental study of embedding motion and holding power of drag embedment type anchor on hard and soft seafloor. Int. J. Nav. Archit. Ocean. Eng. 2011, 3, 193–200. [Google Scholar] [CrossRef]
- Liu, H.; Liu, C.; Zhao, Y.; Wang, C. Reverse catenary equation of the embedded installation line and application to the kinematic model for drag anchors. Appl. Ocean. Res. 2013, 43, 80–87. [Google Scholar] [CrossRef]
- Wang, L.Z.; Shen, K.M.; Li, L.L.; Guo, Z. Integrated analysis of drag embedment anchor installation. Ocean. Eng. 2014, 88, 149–163. [Google Scholar] [CrossRef]
- Tian, Y.; Randolph, M.F.; Cassidy, M.J. Analytical solution for ultimate embedment depth and potential holding capacity of plate anchors. Géotechnique 2015, 65, 517–530. [Google Scholar] [CrossRef]
- Moharrami, M.J.; Shiri, H. Reliability assessment of drag embedment anchors in clay for catenary mooring systems. Mar. Struct. 2018, 58, 342–360. [Google Scholar] [CrossRef]
- Moharrami, M.J.; Shiri, H. Reliability of drag embedment anchors for applications in Canadian deep offshore. In Proceedings of the 71st Canadian Geotechnical Conference; 13th Joint with IAH-CNC, Edmonton, AB, Canada, 23–26 September 2018. [Google Scholar]
- Zhang, X.; Liu, J.; Liu, M. Experimental study on uplift behavior of group anchors in sand. Geotech. Test. J. 2019, 42, 687–702. [Google Scholar] [CrossRef]
- Chen, H.; Gao, Y.; Shu, S.; Lai, Y. The six-degree-of-freedom behavior of drag embedment anchor installed in clay. Ships Offshore Struct. 2024, 19, 461–470. [Google Scholar] [CrossRef]
- Guo, Z.; Zhou, Z.; Jostad, H.P.; Wang, L.; Rui, S. Relationship between chain axial resistance and confining stress for South China Sea carbonate sand: An element test. Can. Geotech. J. 2024, 61, 1449–1467. [Google Scholar] [CrossRef]
- Neubecker, S.R. The Behaviour of Drag Anchor and Chain Systems. Ph.D. Thesis, University of Western Australia, Crawley, WA, Australia, 1995. [Google Scholar]
- Azimi, H.; Shiri, H.; Mahdianpari, M. Generalized structure of the group method of data handling for modeling iceberg drafts. Ocean. Model. 2024, 188, 102337. [Google Scholar] [CrossRef]
- Pekel, E. Estimation of soil moisture using decision tree regression. Theor. Appl. Climatol. 2020, 139, 1111–1119. [Google Scholar] [CrossRef]
- Azimi, H.; Shiri, H.; Mahdianpari, M. Iceberg-seabed interaction analysis in sand by a random forest algorithm. Polar Sci. 2022, 34, 100902. [Google Scholar] [CrossRef]
- Breiman, L. Random forests. Mach. Learn. 2001, 45, 5–32. [Google Scholar] [CrossRef]
- Sahani, N.; Ghosh, T. GIS-based spatial prediction of recreational trail susceptibility in protected area of Sikkim Himalaya using logistic regression, decision tree and random forest model. Ecol. Inform. 2021, 64, 101352. [Google Scholar] [CrossRef]
- Fulton, T.M.; Stewart, W.P. Vertical loads on drag embedment anchors. In Proceedings of the Offshore Technology Conference, Houston, TX, USA, 2 May 1994; p. OTC-7491. [Google Scholar]
- Wang, D.; Merifield, R.S.; Gaudin, C. Uplift behaviour of helical anchors in clay. Can. Geotech. J. 2013, 50, 575–584. [Google Scholar] [CrossRef]
- Neubecker, S.R.; Randolph, M.F. Profile and frictional capacity of embedded anchor chains. J. Geotech. Eng. 1995, 121, 797–803. [Google Scholar] [CrossRef]
Disclaimer/Publisher’s Note: The statements, opinions and data contained in all publications are solely those of the individual author(s) and contributor(s) and not of MDPI and/or the editor(s). MDPI and/or the editor(s) disclaim responsibility for any injury to people or property resulting from any ideas, methods, instructions or products referred to in the content. |
© 2025 by the authors. Licensee MDPI, Basel, Switzerland. This article is an open access article distributed under the terms and conditions of the Creative Commons Attribution (CC BY) license (https://creativecommons.org/licenses/by/4.0/).