Abstract
Urban expansion in cold semi-arid regions poses significant threats to river ecosystems through land use changes and impervious surface proliferation. This study examined the Selbe River in Ulaanbaatar, Mongolia, integrating Landsat satellite imagery (2000–2020) with long-term water quality monitoring data (2012–2023) to assess land use change impacts on river water quality. Land use classification revealed that built-up areas expanded 3.5-fold from 16.20 km2 (2000) to 57.9 km2 (2020), driven primarily by informal Ger residential areas and high-rise residential zones. Over the same period, barren land decreased from 149.5 km2 to 64.80 km2, while green areas increased from 156.89 km2 to 200.11 km2, which was insufficient to offset ecological stress from impervious surfaces. Water quality analysis of five sampling sites along the river showed progressive deterioration, with the Water Quality Index (WQI) increasing from 1.08 (2012) to 7.24 (2023), classifying the river as “dirty”, the most severe pollution category in Mongolia’s national classification system. Downstream sites adjacent to high-rise residential and Ger districts exhibited elevated concentrations of NH4+, NO2−, NO3−, PO43−, and suspended solids, frequently exceeding permissible limits established by MNS 4586-98. These findings underscore the cumulative impact of unregulated urban growth on aquatic ecosystems and emphasize the urgent necessity for integrated land use regulation and watershed-based planning to safeguard urban water resources in cold semi-arid environments. The study provides a replicable framework for assessing land use impacts on water quality in rapidly urbanizing regions.
1. Introduction
Land use change and urbanization are major global drivers of environmental transformation in terrestrial ecosystems. The conversion of natural areas, such as forests and agricultural lands, into urban spaces increases impervious surfaces; reduces infiltration; accelerates surface runoff; and introduces nutrients, heavy metals, and pathogens into rivers and streams [1].
Numerous studies have reported that the conversion of agricultural land and forests into urban areas leads to a significant deterioration of water quality [2,3,4]. A global meta-analysis of 625 studies across 63 countries identified expansion as the dominant driver of water quality degradation over the past two decades [5]. In rapidly urbanizing regions, such as South Asia, Sub-Saharan Africa, and Latin America, the replacement of natural landscapes with impervious surfaces has intensified runoff and increased pollutant loads in river systems, leading to measurable declines in water quality [6,7]. This intensification of runoff has contributed to widespread contamination in urban rivers, where elevated levels of nutrients, heavy metals, and microbial pollutants [6,8,9] reflect the growing severity of water pollution as a global issue [10,11,12]. Similar patterns of water quality degradation linked to land use change have been documented in Mongolia and Central Asia, where rapid urbanization and mining activities have significantly impacted river systems, including the Tuul, Kharaa, and Selenge River Basins [13,14]. However, research on smaller urban tributaries such as the Selbe River in Ulaanbaatar (UB) remains limited, particularly in cold semi-arid regions where urbanization pressures are concentrated in specific geographic areas.
These global patterns are clearly reflected in Mongolia’s capital, UB, a rapidly growing city located in a cold semi-arid climate that concentrates a large proportion of the national population. Nearly half of Mongolia’s population lives in UB, occupying only 0.3% of the country’s territory. Figure 1 provides background demographic information to contextualize the study area. This concentration creates intense and often unsustainable demands on local land and water resources.

Figure 1.
Urban and rural population trends in Mongolia (1990–2023). Data source: National Statistics Office of Mongolia (NSO) population census reports.
Over 60% of Mongolia’s urban population and 90% of its national institutions are concentrated in UB, including governmental and international organizations. Figure 2 presents background information on the spatial distribution of key sectors to contextualize UB’s development pressures. The rapid, often unplanned expansion of peri-urban Ger areas has led to the development of informal settlements that lack adequate infrastructure [14,15], directly impacting river ecosystems, particularly the Selbe River Catchment (SRC).
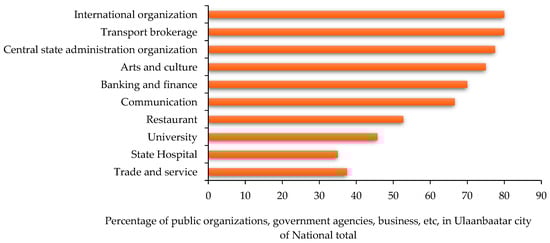
Figure 2.
Spatial concentration of sectors in UB City. Data source: Compiled from NSO sectoral distribution statistics and municipal records.
The Selbe River, a tributary of the Tuul River, flows through UB and supports urban life through ecological and recreational functions [16]. Although it is not used for drinking water, it supports irrigation, riparian habitats, and urban green spaces. However, land use changes and urban encroachment increasingly threaten these functions, especially in downstream areas. Early studies in the SRC date back to the Bukinich flood control in 1933. Systematic monitoring also began in 1986 but has largely been limited to the upstream and midstream sections [17], leaving the downstream dynamics underexplored. Urban expansion has been shown to significantly reshape watershed processes by increasing impervious surfaces, altering runoff regimes, and reducing infiltration capacity. In UB, rapid growth and land use changes have intensified these pressures, placing tributaries such as the Selbe River at heightened risk of ecological degradation and hydrological imbalance [18,19,20,21,22,23,24,25,26,27,28,29].
Although larger Mongolian river basins have been investigated in relation to mining and flood risk [14], the effects of land use change on smaller urban watersheds, particularly in cold semi-arid regions such as the SRC, have not been sufficiently addressed. This research gap is critical, given UB’s rapid expansion and the vulnerability of its urban rivers.
This study aims to clarify the relationship between land use change and water quality in the SRC and to provide insights for sustainable land use and water resource management in cold semi-arid regions. Specifically, it analyzes land use change and urbanization in the SRC from 2000 to 2020 based on remote sensing data and GIS technologies; evaluates temporal and spatial variations in water quality parameters and trends in the Water Quality Index (WQI) based on long-term monitoring data (2011 to 2023); and examines the relation between land use change and river water quality to assess the impacts of land use change and urbanization on the SRC environment.
2. Study Area: Selbe River Catchment
The SRC is located in the northern part of UB, the capital of Mongolia (Figure 3). It lies between the Khentii Mountains to the northeast and UB to the south and west [30,31,32]. The region has a cold, dry climate with long, cold winters and short, warm summers. The mean annual temperature is approximately −1.2 °C, with extreme values ranging from −39.6 °C in winter to 34.5 °C in summer. Annual precipitation averages 258.5 mm, over 70% of which falls between June and August during the main rainy season, and spring snowmelt also contributes substantially to catchment runoff [27].
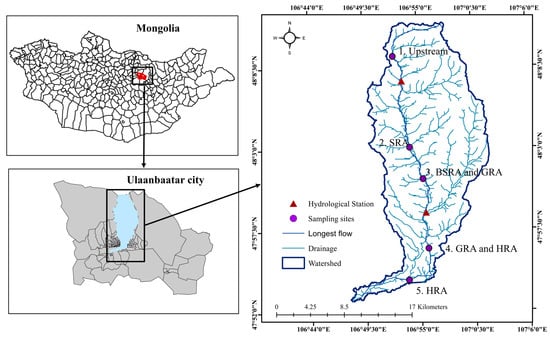
Figure 3.
SRC and sampling site locations. Note: Sampling sites: (1) upstream; (2) seasonal residential areas (SRA); (3) boundary between the SRA and the Ger residential area (GRA); (4) boundary between GRA and the high-rise residential area (HRA); and (5) HRA downstream.
The Selbe River extends 54 km and traverses forests, grasslands, agricultural land, and urban areas. Elevation ranges from 1300 to 2000 m, with brown forest soils in the uplands and richer alluvial soils in the downstream. Rapid urban expansion has accelerated soil and landscape alteration, particularly in downstream reaches [22].
Land use within the catchment is highly heterogeneous, forming a mosaic of forested, agricultural, and urban landscapes. As UB continues to expand, the SRC faces increasing pressure from residential development, informal settlements, and infrastructure growth, which are altering hydrological processes by reducing infiltration and increasing surface runoff, consequently affecting river water quality.
Given its geographic location and land use diversity, the SRC represents a typical example of urbanizing watersheds in a cold semi-arid region. Understanding the changes in land use and their effects on river water quality is essential for developing effective strategies to protect aquatic ecosystems and promote sustainable urban development.
3. Materials and Methods
3.1. Land Use Change Analysis
Land use changes in the SRC were assessed with particular focus on the expansion of impervious surfaces (built-up areas). Land use information for the spatial analysis was obtained from digitized historical maps, a 1:50,000 topographic map, and Landsat satellite imagery. A multi-source geospatial dataset was compiled, including a 1:50,000 topographic map, digitized historical maps (1970, 1984, 2005), and Landsat satellite imagery (Landsat 4/5 TM for 2000, Landsat 7 ETM+ for 2005, and Landsat 8 OLI/TIRS for 2015 and 2020).
All Landsat imagery used in this study was obtained from the USGS Earth Explorer platform, where it is already geometrically corrected and georeferenced in the UTM coordinate system. Spatial alignment was verified against the 1970 national topographic map to ensure consistency across all datasets. Supervised classification was conducted in ArcGIS 10.3 using the maximum likelihood algorithm. Additionally, NDVI and SAVI indices were applied to enhance vegetation discrimination and minimize soil background effects. Four land cover categories were defined: (i) built-up areas (residential, commercial, and transportation structures), (ii) barren land (exposed soil and sparsely vegetated areas), (iii) green areas (forests, grasslands, parks, and agricultural fields), and (iv) waterbodies (rivers, ponds, and reservoirs).
To quantify land use changes, the classified maps for each year were compared using post-classification comparison. Class areas were calculated for all time periods, and cross-tabulation matrices were used to identify gains, losses, and net changes among land-cover categories. This comparative analysis allowed for the detection of dominant transitions associated with urban expansion in the SRC.
3.2. Urban Growth Analysis
To quantify urban growth in the SRC, we applied the Urban Expansion Intensity Index (UEII), which measures changes in the built-up area relative to the total land area over time. Using satellite imagery from six key years (2000, 2005, 2010, 2015, 2020, and 2022), we calculated expansion rates and spatial coverage to assess the pace and intensity of urbanization. The UEII was calculated using the following formula [33].
where BLA is the built-up land area, TLA is the total land area of the study area, ΔAt is the change in built-up area over the time period, and t is the duration of the time period in years.
3.3. Water Quality Monitoring and Analysis
3.3.1. Field Sampling and Measurement
Five sampling sites were selected along the Selbe River to capture spatial variations in water quality (Figure 3). Sampling was conducted on four occasions, August 2012, August 2013, August 2022, and August 2023, providing temporal resolution for assessing long-term trends. In total, 20 water samples were collected across the 4 sampling campaigns (5 sites × 4 years). To verify analytical precision, all chemical parameters were measured in triplicate, and a representative QA/QC scatter plot is provided in Figure 4 to demonstrate strong agreement between replicate measurements.
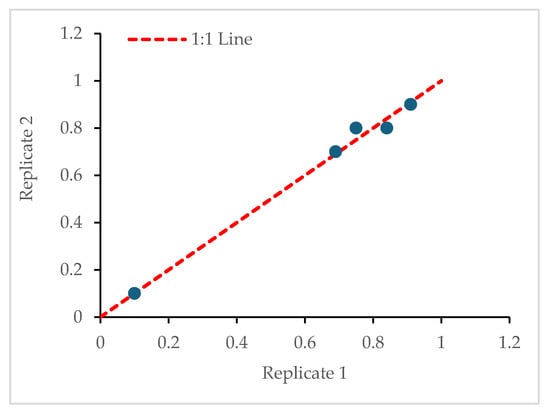
Figure 4.
QA/QC scatter plot comparing replicate measurements for NH4+ concentrations. Blue dots represent individual sample values from Replicate 1 and Replicate 2. The red dashed line indicates the 1:1 reference line (y = x), showing strong agreement between replicates (n = 3).
Sampling was conducted in August because this is the peak rainfall period when runoff from SRA and GRA, which lack central wastewater connections, is most strongly transported into the river. During each survey, key physicochemical parameters, including temperature, pH, electrical conductivity (EC), and dissolved oxygen (DO) were measured on-site using a portable water quality meter (Hach Company, Loveland, CO, USA). The two hydrological stations shown in Figure 3 record only water level and discharge and do not measure chemical water quality; therefore, all water quality data in this study were collected exclusively from the five designated sampling sites.
Water samples were collected as grab samples from 20–30 cm below the water surface at each site, following national standard procedures for surface water sampling. Sampling bottles (acid-washed polyethylene plastic bottles) were rinsed with distilled water and pre-rinsed with sample water prior to collection. Each sample was labeled with the site name, date, and sample ID and then stored in insulated coolers at approximately 4 °C and transported to the laboratory on the same day. Field preservation for Fe2+/Fe3+, NH4+, NO2−, NO3−, and heavy metals was performed using HNO3 and H2SO4 (Wako Pure Chemical Industries, Osaka, Japan) to prevent chemical transformation before analysis.
In the laboratory, chemical analyses were conducted at the Natural Science Central Laboratory of the National Agency for Meteorology and Environmental Monitoring. Spectrophotometric methods were used to determine nitrite (NO2−), nitrate (NO3−), ammonium (NH4+), orthophosphate (PO43−), and chemical oxygen demand (COD Mn) using HACH spectrophotometers (Hach Company, Loveland, CO, USA). Suspended solids (SS) were analyzed gravimetrically, while biochemical oxygen demand (BOD) was measured using the dilution method under standard laboratory conditions. All analyses were conducted in triplicate (n = 3) to ensure the reproducibility and reliability of the results. In addition to these parameters, major ions (Ca2+, Mg2+, Na++K+, Cl−, SO42−, HCO3−), hardness, TDS, and dissolved iron (Fe2+/Fe3+) were also analyzed using MNS/ISO standard methods.
3.3.2. Water Quality Index (WQI)
Water quality is influenced by complex natural and human factors. To simplify interpretation, we applied the Water Quality Index (WQI), which condenses multiple parameters into a single value for an effective assessment. Originating with Horton [34] and evolving through models such as the NSF-WQI, this method was adapted by Mongolia’s Ministry of Nature and Environment [35,36,37]. This study used the Erdenebayar and Bulgan approach to evaluate surface water quality.
In the Selbe River context, we applied the MNE’s WQI method—originally developed for the Tuul River Basin—using five hydrochemical variables: ammonium (NH4+), nitrite (NO2−), nitrate (NO3−), phosphate (PO43−), and suspended solids (SS) [35]. This adaptation reflects the specific pollution pressures linked to urban land use in UB. The WQI was calculated using the following formula:
where Ci is the measured concentration of the i-th variable, PLi is the permissible level of the i-th variable, and n is the number of parameters (n = 5 in this study). The permissible levels of the water quality variables are defined by the Mongolian National Standard MNS 4586-98 [38] and summarized in Table 1.

Table 1.
Permissible levels of surface water variables under Mongolian National Standard MNS4586-98.
In Mongolia, surface water quality is classified according to the calculated WQI values (Table 1). Using the permissible limits for NH4+, NO2−, NO3−, PO43−, and SS, the Water Quality Index (WQI) was calculated and applied to classify each sample according to the national system (Table 2) [39,40].
Table 2.
Mongolian classification of surface water quality.
3.3.3. Statistical Analysis
Descriptive statistics (mean, minimum, maximum, and standard deviation) were calculated for each water quality parameter. Temporal trends were assessed using linear trend lines, and Pearson’s correlation coefficients were computed to evaluate relationships among selected hydrochemical variables.
4. Results
4.1. Land Use Change (2000–2020)
Between 2000 and 2020, built-up areas in the SRC expanded from 16.20 km2 to 57.9 km2—an increase of more than 3.5 times—driven by rapid urbanization across residential and mixed-use zones, particularly in peri-urban settlements. Over the same period, barren land decreased from 149.5 km2 to 64.80 km2, reflecting land conversion to infrastructure and vegetated areas (Figure 5). The increase in green areas from 156.89 km2 to 200.11 km2 was influenced by seasonal vegetation growth and climate variability, particularly increased summer rainfall and delayed snowmelt. Water bodies remained relatively stable, with only minor fluctuations.
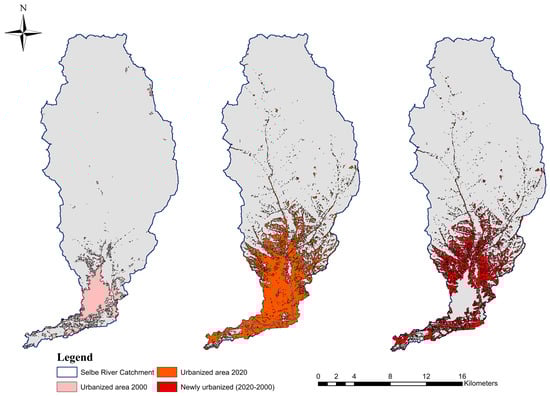
Figure 5.
Expansion of built-up area between 2000 and 2020 in the Selbe River Catchment.
The classification results for land cover types in the Selbe River Catchment across the five time periods (2000–2020) are summarized in Table 3.
Table 3.
Classification results for different land cover types in the Selbe River Catchment (2000–2020).
Classification accuracy was evaluated qualitatively through visual comparison with high-resolution Google Earth imagery and cadastral maps. Because no formal accuracy assessment (e.g., confusion matrix) was conducted, no numerical accuracy values are reported. Instead, the classification reliability is based on consistent visual agreement between mapped classes and reference imagery.
4.2. Urban Growth in Selbe River Catchment (SRC)
4.2.1. Population Growth by Residential Type
UB has undergone rapid population growth in recent decades. The SRC covers five districts—Bayangol, Bayanzurkh, Chingeltei, Khan-Uul, and Sukhbaatar—and includes 71 khoroos in total, where a khoroo is the smallest administrative subdivision within Ulaanbaatar’s district structure. Between 1995 and 2023, the catchment population increased from 0.24 million to more than 0.54 million, accounting for nearly one-third of UB’s total population (Figure 6). This growth has placed increasing pressure on housing, infrastructure, and public services.
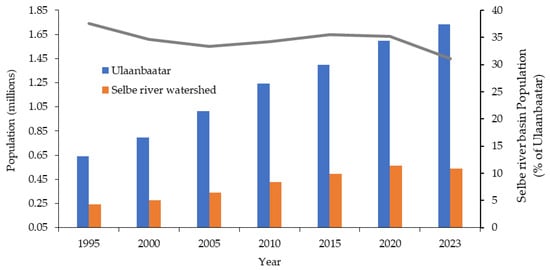
Figure 6.
Population growth in SRC. The blue and orange bars represent the populations of Ulaanbaatar and the Selbe River watershed, respectively. The grey line shows the Selbe River Basin population as a percentage of Ulaanbaatar’s total population. Data source: NSO district-level population statistics and UB city planning archives.
UB’s population has increased from approximately 0.65 million to over 1.6 million people. On the other hand, compared to the population growth rate of UB, its share of the city’s total population in the SRC declined from 35% to 27%, indicating a shift in settlement patterns and urban expansion beyond the watershed boundaries.
The urban structure of UB consists of four main zones: the core built-up area, intermediate transition areas (with ger and housing), peri-urban Ger areas, and seasonal residential areas. Based on these categories, three residential types were identified—the seasonal residential area (SRA), the Ger residential area (GRA), and the high-rise residential area (HRA)—and their respective population trends were analyzed (Figure 7 and Figure 8). The SRA refers to seasonal summer residential areas located outside the urban core, a pattern that originated during the Socialist period when institutions operated summer camps for employees and their families. These areas are used only during the warm months and are not connected to centralized water or wastewater systems. Basic electricity access may be available in some locations, while paved roads and sewerage infrastructure are generally absent.
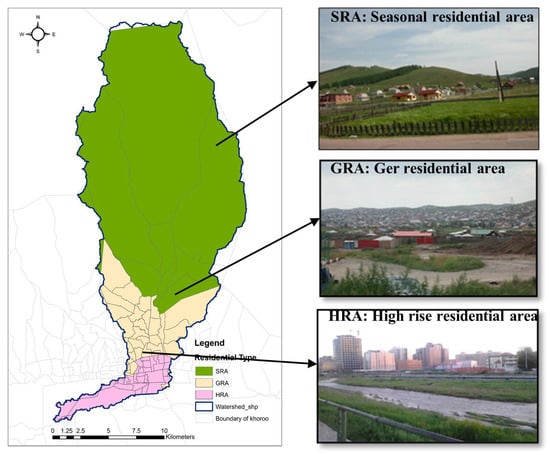
Figure 7.
Spatial distribution of residential types in the SRC. The map shows the locations of SRA (Seasonal Residential Area), GRA (Ger Residential Area), and HRA (High-Rise Residential Area), with colors corresponding to each residential type as indicated in the legend.
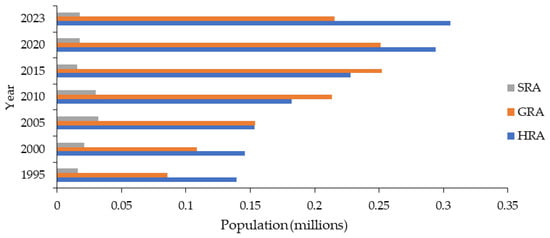
Figure 8.
Population trend by residential type in the SRC.
GRAs are suburban estates situated at the edges of the city and consist of fenced household plots (khashaas) that contain traditional Gers used either as long-term dwellings or as transitional housing while households incrementally construct single-story or permanent houses. Due to financial constraints, house construction often progresses slowly and may take several years. Some households do not plan to replace their Ger and continue to use it as a permanent dwelling. It is also common for residents of multi-story apartment buildings to own additional plots in GRAs and to use them as seasonal or summer residences. Residents typically collect water from kiosks or private wells, use pit latrines for sanitation, heat with coal or electricity, and rely on unpaved roads, as these areas lack centralized water supply, sewerage, district heating, and paved infrastructure.
The HRA represents the core built-up area of the city, comprising the most densely populated medium- and high-rise residential buildings, along with commercial and industrial compounds (Figure 7).
Figure 8 summarizes the population trends by residential type. GRAs experienced the most pronounced increase, from approximately 85,000 in 1995 to over 215,000 in 2023, reflecting migration and rapid informal settlement expansion. The HRA population also grew steadily, whereas the SRA remained relatively stable, with minor seasonal variation. The slight decline in the GRA population after 2020 may be attributed to migration into formal housing, administrative reclassification of residential zones, or limitations in census data coverage.
4.2.2. Urban Expansion Intensity and Metrics
To assess and compare growth over time, we applied the Urban Expansion Intensity Index (UEII) to the built-up area. Urban expansion was calculated for the following years: 2000, 2005, 2010, 2015, 2020, and 2022. Table 4 summarizes the built-up area, landscape coverage, expansion rates, and UEII values for each period.
Table 4.
Urban expansion in the SRC.
As shown in Table 5, the built-up area increased from 16.00 km2 in 2000 to 78.40 km2 in 2022, with the most rapid expansion occurring between 2020 and 2022. During this period, the annual urban expansion change reached 10.23 km2/year, which was the highest among all intervals, while the growth rate was 35.3%, indicating a sharp acceleration in the land conversion.
Table 5.
Measured physiochemical parameters.
The UEII values increased from 1.40 (2005–2010) to 5.50 (2015–2020), indicating a transition from low to high urban expansion intensity. According to previous studies, UEII values below 1.0 reflect very low expansion; values between 1.0 and 3.0 suggest low to moderate intensity; 3.0 to 6.0 indicate moderate to high intensity; and values above 6.0 represent very high expansion pressure. The rising UEII values in the SRC, particularly after 2015, underscore a trend toward more concentrated and accelerated urban development.
4.3. Water Quality Results
4.3.1. Spatiotemporal Physicochemical Measurements
Table 5 presents physicochemical water quality measurements across five sampling locations spanning four temporal periods. All reported values represent mean concentrations from triplicate measurements (n = 3) ± standard deviation. A clear spatial–temporal pattern emerges: upstream sites consistently maintained low pollutant concentrations across all sampling years, while downstream sites—particularly those adjacent to high-rise residential areas (HRAs) and Ger residential areas (GRAs)—demonstrated dramatic pollution increases.
4.3.2. Water Quality Index Result
As shown in Table 6, the calculated total WQI values ranged from 0.13 to 7.24 across the sampling sites and years. Under the Mongolian classification in Table 5, WQI < 0.30 is “very clean water,” while WQI > 2.50 indicates polluted to heavily polluted conditions. Upstream sites generally fell within the “clean” category, whereas downstream sites—particularly those adjacent to Ger residential areas (GRAs) and high-rise residential zones (HRAs)—frequently exceeded 3.0, indicating significant pollution and decline in water quality downstream.
Table 6.
Calculated Water Quality Index (WQI) values across sampling sites and years.
Figure 9a shows the frequency distribution of WQI values across sampling sites, which mainly fell within Classes 2–3 (clean to slightly polluted). Figure 9b displays the longitudinal spatial pattern, which shows a progressive increase in the WQI from upstream to downstream. During this period (2012–2013), the WQI values ranged from 0.13 to 2.98 (Table 2), with clear spatial heterogeneity corresponding to varying degrees of urban influence. Upstream sampling sites remained relatively clean, whereas downstream reaches showed early signs of pollution accumulation associated with growing population density and reduced natural buffering capacity.
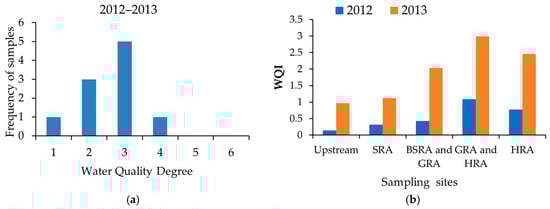
Figure 9.
Water Quality Index (WQI) patterns in the Selbe River (2012–2013). (a) Frequency distribution of WQI values across sampling sites and (b) longitudinal variation in WQI along the river.
By 2022–2023, the WQI had increased dramatically, ranging from 2.08 to 7.24 (Table 2, Figure 10a). Most sampling sites are classified as Class 3 or higher, indicating moderate to severely polluted conditions. The highest WQI value (7.24), classified as “dirty,” occurred at the fourth sampling site adjacent to dense residential and industrial zones (Figure 10b). This location represents a pronounced pollution hotspot where multiple wastewater sources converge, generating severe pollution and causing localized contamination. Downstream degradation patterns align with findings from comparable urbanizing watersheds, where expansion concentrates pollution loads beyond the river’s assimilation capacity.
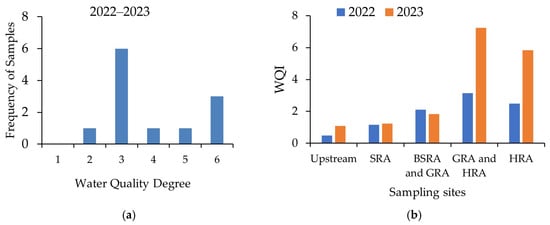
Figure 10.
Water Quality Index (WQI) patterns in the Selbe River (2022–2023). (a) Frequency distribution of WQI values across sampling sites and (b) longitudinal variation in WQI along the river.
As shown in Figure 11, the longitudinal comparison between 2012–2013 and 2022–2023 highlights the accelerating water quality degradation due to urban expansion over the decade. In the early period, WQI values increased moderately along the river, with deterioration becoming pronounced near existing urban settlements. By 2022–2023, the landscape had transformed dramatically: WQI values ranged from 2.08 to 7.24, with most sites falling into Class 3 or higher pollution categories. The eightfold increase in maximum values reflects cumulative pressures from expanding residential informal settlements, industrial activities, and insufficient wastewater treatment. Across both time periods, downstream progression of pollution remains evident, with the fourth sampling site—adjacent to dense residential and industrial zones—emerging as a critical contamination hotspot. This repeated pattern highlights the systematic and compounding effects of urban growth and is consistent with findings in similar urbanized watersheds, where rapid land use change occurs without corresponding environmental safeguards.
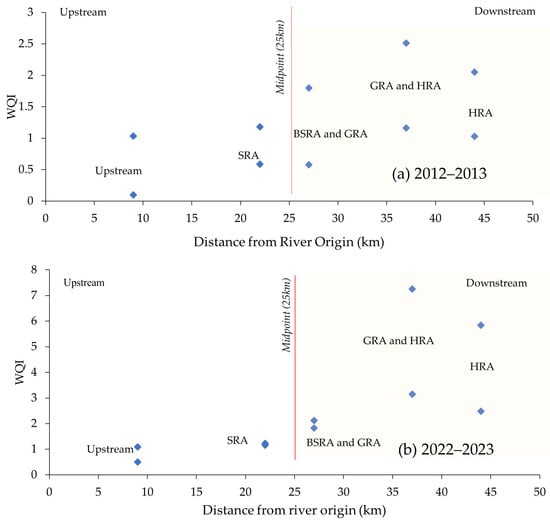
Figure 11.
Longitudinal WQI comparison along the Selbe river (2012–2013 vs. 2022–2023). (a) WQI values plotted against distance from the river origin during 2012–2013. (b) WQI values plotted against distance from the river origin during 2022–2023. The red vertical line indicates the midpoint of the river (25 km). Blue diamond symbols represent sampling sites. Yellow shading indicates urbanized zones. The river is divided into upstream and downstream sections based on the midpoint.
5. Discussion
Rapid urbanization in UB and the resulting land use changes within the SRC create significant water quality challenges, mirroring patterns observed in other Mongolian and Central Asian river systems [39]. Although the SRC area is smaller than that of larger systems, such as the Kharaa or Selenge basins, it exhibits a similar relationship between intensified land use, deteriorating riparian conditions, and declining water quality. Research from the Kharaa River Basin demonstrates that even low population densities can result in sharp downstream increases in nutrient concentrations due to dense settlements lacking proper wastewater treatment [14,40]. Total nitrogen and phosphorus levels nearly triple from the headwaters to lower reaches, driven mainly by untreated household effluent and localized agricultural activities. Comparable processes occur in the SRC, where unregulated or poorly regulated construction within the river safety zone, loss of riparian vegetation, soil compaction, and the expansion of impervious surfaces have accelerated runoff and pollutant transport into the river [13].
UB’s rapid expansion exerts more direct urban pressure on the SRC documented for the Kharaa or Selenge rivers [41]. Unlike the relatively natural headwaters of the Kharaa River, the Selbe originates near areas of intense land conversion, infrastructure development, and informal settlements [42]. Consequently, anthropogenic influences are present along much of the Selbe’s length, increasing its vulnerability to water quality degradation, even from small-scale land disturbances.
While nutrient enrichment and heavy metal variability characterize sections of the Kharaa River affected by settlement and mining pressures [40], the Selbe River lacks major mining inputs. Instead, urban runoff introduces hydrocarbons, sediments, road dust, construction-related metals, and untreated household wastewater. This reflects early-stage urban impacts similar to those observed in other basins, including increased nutrient loads from household effluents, organic debris accumulation, thermal changes from reduced shading and impervious surface expansion, sediment deposition from construction, and trace metals transported by runoff and waste materials [37].
Correlating land use change with water chemistry would provide additional quantitative insights; however, the available water quality dataset does not align temporally with the multi-year land cover series used in this study. Because all water-quality measurements were collected during August peak-runoff conditions, the results primarily represent high-flow seasonal conditions rather than full annual variability. Because of this mismatch, a statistically meaningful correlation analysis could not be performed. Nevertheless, the spatial correspondence between mapped urban expansion and observed water quality deterioration suggests a strong land use influence on nutrient enrichment, sediment loads, and thermal conditions in the SRC.
Although the full extent of contamination in the Selbe River remains to be quantified, ongoing land use pressures suggest that, without intervention, the river could follow the trajectory of the polluted middle reaches of the Kharaa River. Studies on the Gap-Cheon and SRC underscore the importance of urban green spaces in moderating water quality and stabilizing hydrological processes [37]. Forests and wetlands serve as natural filters, reducing surface runoff, increasing infiltration, and trapping nutrients and sediments before they enter the river. However, the Selbe River is compromised by fragmented green-space planning and weak ecological zoning, which diminish the resilience of its riparian corridor.
Partial restoration efforts conducted in 2012 fell short in ecological design, balancing recreation with ecosystem needs, and maintaining continuous riparian vegetation. Consequently, current conditions do not adequately support water purification or thermal regulation. The integrated methodological approach employed in this research—combining Landsat-based land use classification with long-term water quality monitoring and statistical trend analysis—proved effective for detecting urbanization impacts on river systems in semi-arid environments [39]. Building on foundational work by Altansukh Ochir in the larger Tuul River watershed, this study demonstrates that the same analytical framework is equally applicable to smaller, intensively urbanized tributary systems like the Selbe River, where anthropogenic pressures are more concentrated and acute. This methodological flexibility underscores the utility of remote sensing and field-based monitoring approaches across diverse river systems in semi-arid Central Asia, particularly where formal hydrological infrastructure is limited [43].
Evidence from the Selenge, Kharaa, and Gap-Cheon basins indicates that sustainable improvement of the Selbe River requires strict protection of riparian buffers, expansion of urban green infrastructure, integrated land–water management that includes monitoring land use changes; long-term hydrological and water quality monitoring; and nature-based solutions such as riverbank vegetation restoration, wetland creation, and permeable surface planning [13,42].
The SRC represents a concentrated urban watershed example where land use change is the central determinant of water quality and where the interactions identified in larger Mongolian basins are manifested more rapidly and severely. Across all comparative studies, one conclusion is consistent: land use change—particularly urban encroachment into riparian zones—has the strongest and most immediate impact on river water quality. The SRC, located in the rapidly urbanizing core of UB, reflects an intensified version of the trends observed in the Kharaa and Selenge River basins and parallels the urban watershed dynamics of East Asian examples such as the Gap-Cheon (Table 7).
Table 7.
River water quality and urbanization impacts: a comparative overview.
6. Conclusions
This study investigated the effects of land use change and urban growth on river water quality in the SRC, a rapidly urbanizing watershed in UB, Mongolia. The results demonstrated a strong association between urban expansion, particularly in Ger residential areas, and observed declines in water quality over time.
From 2000 to 2020, built-up areas increased by more than 3.5-fold, reflecting accelerated urbanization across residential and mixed-use zones in the city. This expansion coincided with a significant increase in population, placing growing pressure on land, infrastructure, and ecological systems. Informal settlements, often lacking adequate sanitation and waste management, are likely associated with increased surface runoff and pollutant discharge into the river.
Water-quality monitoring conducted from 2012 to 2023 showed elevated concentrations of NH4+, NO2−, PO43−, and suspended solids (SSs), particularly at downstream sites adjacent to high-density and industrial zones. These values frequently exceeded the permissible limits established by the Mongolian National Standard MNS 4586-98 [38]. Correspondingly, the Water Quality Index (WQI) rose from 1.08 in 2012 to 7.24 in 2023, classifying the river as “dirty”, the most polluted category in the national system. This marked deterioration reflects cumulative pressures associated with unregulated urban growth on aquatic ecosystems in cold and semi-arid regions.
Declines in water quality were most pronounced in areas where urban expansion outpaced the development of infrastructure. Seasonal fluctuations in nutrient concentrations suggest that both climatic factors and human disturbances shape pollution dynamics. Although the area classified as green space increased slightly, likely due to seasonal vegetation and land conversion, this has not offset the ecological stress associated with impervious surface growth.
Collectively, these findings highlight the urgent need for integrated urban and watershed management to mitigate further environmental degradation. Key recommendations include
- Strengthening land use regulation to manage informal settlement expansion;
- Implementing watershed-based planning that balances development with ecological protection;
- Upgrading infrastructure in peri-urban zones, including sanitation, drainage, and waste systems;
- Expanding long-term water-quality monitoring to support adaptive management and policy evaluation.
This research has several limitations. Ground-truth validation of land use classification was not possible due to the historical nature of the imagery and restricted field accessibility, and the number of water-sampling sites was constrained by logistical conditions in the upper basin. Additionally, a comparable reference basin unaffected by urban expansion was not available for parallel analysis, limiting direct comparison between disturbed and undisturbed catchments. These factors may influence the strength of interpretations regarding human–environment relationships; however, they do not diminish the overall patterns observed.
Overall, this research contributes to the limited body of knowledge on urban water systems in cold semi-arid climates and provides a replicable framework for assessing land use–water quality relationships. Future work should investigate the socioeconomic drivers of urban expansion, evaluate how policy interventions influence water-quality outcomes, and incorporate monitoring of an undisturbed reference basin to strengthen attribution of human impacts.
Author Contributions
Conceptualization, Z.C. and Y.W.; methodology, Z.C. and Y.W.; software, Z.C.; formal analysis, Z.C.; investigation, Z.C.; data curation, Z.C.; writing—original draft preparation, Z.C.; writing—review and editing, Z.C., Y.W. and K.H.; visualization, Z.C.; supervision, Y.W.; project administration, Y.W.; funding acquisition, Y.W. All authors have read and agreed to the published version of the manuscript.
Funding
This research received no external funding. The APC was fully waived by the publisher.
Data Availability Statement
Data supporting this study are available from the corresponding author upon reasonable request.
Acknowledgments
This work was supported by the THERS Make New Standards Program for Next Generation Researchers. I am deeply grateful to Chinbat Badamdorj for his invaluable guidance and support throughout this research. I also thank Oyunbaatar Dambaravjaa and Erdenetsetseg Tsogtbayar for their thoughtful contributions. Special thanks are due to Enkhtuya Nergui and Amarzaya Munkhbat for their essential assistance with field data collection. AI tools were used to assist with language refinement, formatting consistency, and clarity improvements during manuscript preparation. All content was generated under the authors’ supervision and reviewed for accuracy and originality. No AI tools were used for data analysis, interpretation, or scientific conclusions.
Conflicts of Interest
The authors declare no conflicts of interest. The funders had no role in the design of the study; in the collection, analyses, or interpretation of the data; in the writing of the manuscript; or in the decision to publish the results.
Abbreviations
The following abbreviations are used in this manuscript:
| SRC | Selbe River Catchment |
| UB | Ulaanbaatar City |
| WQI | Water Quality Index |
| UEII | Urban Expansion Intensity Index |
| SRA | Seasonal Residential Area |
| GRA | Ger Residential Area |
| HRA | High-Rise Residential Area |
References
- Shiferaw, N.; Habte, L.; Waleed, M. Land use dynamics and their impact on hydrology and water quality of a river catchment: A comprehensive analysis and future scenario. Environ. Sci. Pollut. Res. 2025, 32, 4124–4136. [Google Scholar] [CrossRef] [PubMed]
- Walsh, C.J.; Roy, A.H.; Feminella, J.W.; Cottingham, P.D.; Groffman, P.M.; Morgan, R.P. The urban stream syndrome: Current knowledge and the search for a cure. J. N. Am. Benthol. Soc. 2005, 24, 706–723. [Google Scholar] [CrossRef]
- Liu, Y.; Wang, Y.; Zhang, Y.; Li, J. Global evidence of urban expansion as a dominant driver of water quality deterioration. Sci. Total Environ. 2022, 806, 150656. [Google Scholar] [CrossRef]
- Allan, J.D. Landscapes and riverscapes: The influence of land use on stream ecosystems. Annu. Rev. Ecol. Evol. Syst. 2004, 35, 257–284. [Google Scholar] [CrossRef]
- Wang, Y.; Li, L.; Zhang, B.; Li, J.; Wang, Y. Global synthesis of the impacts of land use on water quality in rivers. Sci. Total Environ. 2020, 730, 138913. [Google Scholar]
- Booth, D.B.; Jackson, C.R. Urbanization of aquatic systems: Degradation thresholds, stormwater detection, and the limits of mitigation. J. Am. Water Resour. Assoc. 1997, 33, 1077–1090. [Google Scholar] [CrossRef]
- Vörösmarty, C.J.; McIntyre, P.B.; Gessner, M.O.; Dudgeon, D.; Prusevich, A.; Green, P.; Glidden, S.; Bunn, S.E.; Sullivan, C.A.; Liermann, C.R.; et al. Global threats to human water security and river biodiversity. Nature 2010, 467, 555–561. [Google Scholar] [CrossRef]
- Meyer, J.L.; Paul, M.J.; Taulbee, W.K. Stream ecosystem function in urbanizing landscapes. J. N. Am. Benthol. Soc. 2005, 24, 602–612. [Google Scholar] [CrossRef]
- Da Silva, A.M.M.; Sacomani, L.B. Using chemical and physical parameters to define the quality of the Pardo River water. Water Res. 2001, 35, 1609–1616. [Google Scholar] [CrossRef]
- UNEP. Global Environment Outlook 5: Environment for the Future We Want; United Nations Environment Programme: Nairobi, Kenya, 2012. [Google Scholar]
- UNESCO. The United Nations World Water Development Report 2023: Partnerships and Cooperation for Water; UNESCO Publishing: Paris, France, 2023. [Google Scholar]
- Cunningham, W.P.; Cunningham, M.; Saigo, B.W. Environmental Science: A Global Concern, 7th ed.; McGraw Hill Higher Education: New York, NY, USA, 2003. [Google Scholar]
- Altansukh, O.; Davaa, G. Application of index analysis to evaluate the water quality of the Tuul River in Mongolia. J. Water Resour. Prot. 2011, 3, 360–367. [Google Scholar] [CrossRef]
- Karthe, D.; Malsy, M.; Kopp, S.; Menzel, L.; Thevs, N.; Borchardt, D. Science-based IWRM implementation in a data-scarce Central Asian region: Experiences from a research and development project in the Kharaa River Basin, Mongolia. Water 2015, 7, 3486–3514. [Google Scholar] [CrossRef]
- Javzan, C.; Sauleguli, A.; Tsengelmaa, B. Study of Tuul River Contamination. Geo-Ecol. Mong. 2004, 4, 213–219. [Google Scholar]
- Chuluunbat, B.; Enkhtuya, B.; Munkhzul, O. Urban river ecosystem services and recreational functions in Ulaanbaatar. Geo-Ecol. Mong. 2014, 5, 112–120. [Google Scholar]
- MNE (Ministry of Nature and Environment). Surface Water Quality Monitoring Report of Mongolia (1986–2000); Ministry of Nature and Environment: Ulaanbaatar, Mongolia, 2001.
- Chinbat, B. Changes in the internal structure of Ulaanbaatar, Mongolia. East Cent. Asia Bus. Assoc. Acad. Conf. 2004, 39–59. [Google Scholar]
- Chinbat, B. On a new land use classification and zoning scheme of Ulaanbaatar, Mongolia. J. Soc. Sci. Stud. 2004, 10, 247–286. [Google Scholar]
- Chinbat, B.; Bayantur, M.; Amarsaikhan, D. Investigation of the internal structure changes of Ulaanbaatar city using RS and GIS. In Proceedings of the ISPRS Mid-Term Symposium, ITC, Enschede, The Netherlands, 8–11 May 2006; p. wg04_1-6. [Google Scholar]
- Kamata, T.; Reichert, J.A.; Tsevegmid, T.; Kim, Y.; Sedgewick, B. Enhancing Policies and Practices for Ger Area Development in Ulaanbaatar; World Bank: Washington, DC, USA, 2006. [Google Scholar]
- Purevtseren, M.; Tsegmid, B.; Indra, M.; Sugar, M. The fractal geometry of urban land use: The case of Ulaanbaatar city, Mongolia. Land 2018, 7, 67. [Google Scholar] [CrossRef]
- Munkhsuld, E.; Ochir, A.; Koop, S.; van Leeuwen, K.; Batbold, T. Application of the city blueprint approach in landlocked Asian countries: A case study of Ulaanbaatar, Mongolia. Water 2020, 12, 199. [Google Scholar] [CrossRef]
- Batsuuri, B.; Fürst, C.; Myagmarsuren, B. Estimating the impact of urban planning concepts on reducing the urban sprawl of Ulaanbaatar city using certain spatial indicators. Land 2020, 9, 495. [Google Scholar] [CrossRef]
- Huang, Q.; Zhang, H.; van Vliet, J.; Ren, Q.; Wang, R.Y.; Du, S.; Liu, Z.; He, C. Patterns and distributions of urban expansion in global watersheds. Earth’s Future 2021, 9, e2021EF002062. [Google Scholar] [CrossRef]
- Gantumur, B.; Wu, F.; Vandansambuu, B.; Tsegmid, B.; Dalaibaatar, E.; Zhao, Y. Spatiotemporal dynamics of urban expansion and its simulation using CA-ANN model in Ulaanbaatar, Mongolia. Geocarto Int. 2022, 37, 494–509. [Google Scholar] [CrossRef]
- Sumiya, E.; Dorligjav, S.; Purevtseren, M.; Gombodorj, G.; Byamba-Ochir, M.; Dugerjav, O.; Tsegmid, B. Climate patterns affecting cold season air pollution of Ulaanbaatar city, Mongolia. Climate 2022, 11, 4. [Google Scholar] [CrossRef]
- Damdinsuren, A.; Amarsaikhan, E.; Gurjav, T.; Altangerel, M.E.; Enkhtuya, J.; Damdinsuren, E.; Batdorj, B. Urban land use change study in Ulaanbaatar city using RS and GIS. J. Inst. Math. Digit. Technol. 2023, 5, 40–49. [Google Scholar] [CrossRef]
- Gordillo Fuertes, E. Understanding contemporary challenges for water security in Ulaanbaatar, a semi-arid region in Mongolia. PLoS Water 2023, 2, e0000160. [Google Scholar] [CrossRef]
- Davaa, G.; Oyunbaatar, D.; Sugita, M. Hydrological regime and water resources of the Tuul River Basin. Hydrol. Res. 2007, 38, 163–172. [Google Scholar]
- Byambadorj, T.; Amati, M.; Ruming, K.J. Twenty-first century nomadic city: Ger district and barriers to the implementation of the Ulaanbaatar city master plan. Asia Pac. Viewp. 2011, 52, 93–103. [Google Scholar] [CrossRef]
- Battsetseg, B.; Dolgorsuren, G. Water Resources and the Ecological and Economic Evaluation of Technical Manuals; World Bank: Ulaanbaatar, Mongolia, 2012. [Google Scholar]
- Liu, X.; Li, X. Urban expansion intensity index and its application. Acta Geogr. Sin. 2014, 69, 593–603. [Google Scholar]
- Horton, R.K. An index number system for rating water quality. J. Water Pollut. Control Fed. 1965, 37, 300–306. [Google Scholar]
- Erdenebayar, Y.; Bulgan, T. Formulae for Water Quality Index; Ministry of Nature and Environment: Ulaanbaatar, Mongolia, 2006.
- Ministry of Nature and Environment. Report on the State of the Environment for 2004–2005; Ministry of Nature and Environment: Ulaanbaatar, Mongolia, 2006; p. 27.
- Altansukh, O. Surface water quality study in Ulaanbaatar City. Geo-Ecol. Issues 2005, 4, 127–132. (In Mongolian) [Google Scholar]
- Ministry of Nature and Environment. Definition of Quality Grades Used for Surface Water in Mongolia; Ministry of Nature and Environment: Ulaanbaatar, Mongolia, 1998; p. 14.
- Dorjsuren, B.; Batsaikhan, N.; Yan, D.; Yadamjav, O.; Chonokhuu, S.; Enkhbold, A.; Qin, T.; Weng, B.; Bi, W.; Demberel, O.; et al. Study on relationship of land cover changes and ecohydrological processes of the Tuul River Basin. Sustainability 2021, 13, 1153. [Google Scholar] [CrossRef]
- Hofmann, J.; Rode, M.; Theuring, P. Recent developments in river water quality in a typical Mongolian river basin, the Kharaa case study. Proc. H 2013, 4, 123–131. [Google Scholar]
- Batbayar, G.; Pfeiffer, M.; Kappas, M.; Karthe, D. Development and application of GIS-based assessment of land-use impacts on water quality: A case study of the Kharaa River Basin. Ambio 2019, 48, 1154–1168. [Google Scholar] [CrossRef]
- Karthe, D.; Chalov, S.; Moreido, V.; Pashkina, M.; Romanchenko, A.; Batbayar, G.; Flörke, M. Assessment of runoff, water and sediment quality in the Selenga River basin aided by a web-based geoservice. Water Resour. 2017, 44, 399–416. [Google Scholar] [CrossRef]
- Oyuntugs, B.; Dorjsuren, B.; Munkhjargal, M.; Batbayar, G. Water Quality Assessment of the Selbe River, Ulaanbaatar; Technical Report; National Agency for Meteorology and Environmental Monitoring of Mongolia: Ulaanbaatar, Mongolia, 2012.
- Dorjsuren, B.; Yan, D.; Wang, H.; Chonokhuu, S.; Enkhbold, A.; Yiran, X.; Girma, A.; Gedefaw, M.; Abiyu, A. Observed trends of climate and river discharge in Mongolia’s Selenga Sub-Basin of the Lake Baikal Basin. Water 2018, 10, 1436. [Google Scholar] [CrossRef]
Disclaimer/Publisher’s Note: The statements, opinions and data contained in all publications are solely those of the individual author(s) and contributor(s) and not of MDPI and/or the editor(s). MDPI and/or the editor(s) disclaim responsibility for any injury to people or property resulting from any ideas, methods, instructions or products referred to in the content. |
© 2026 by the authors. Licensee MDPI, Basel, Switzerland. This article is an open access article distributed under the terms and conditions of the Creative Commons Attribution (CC BY) license.