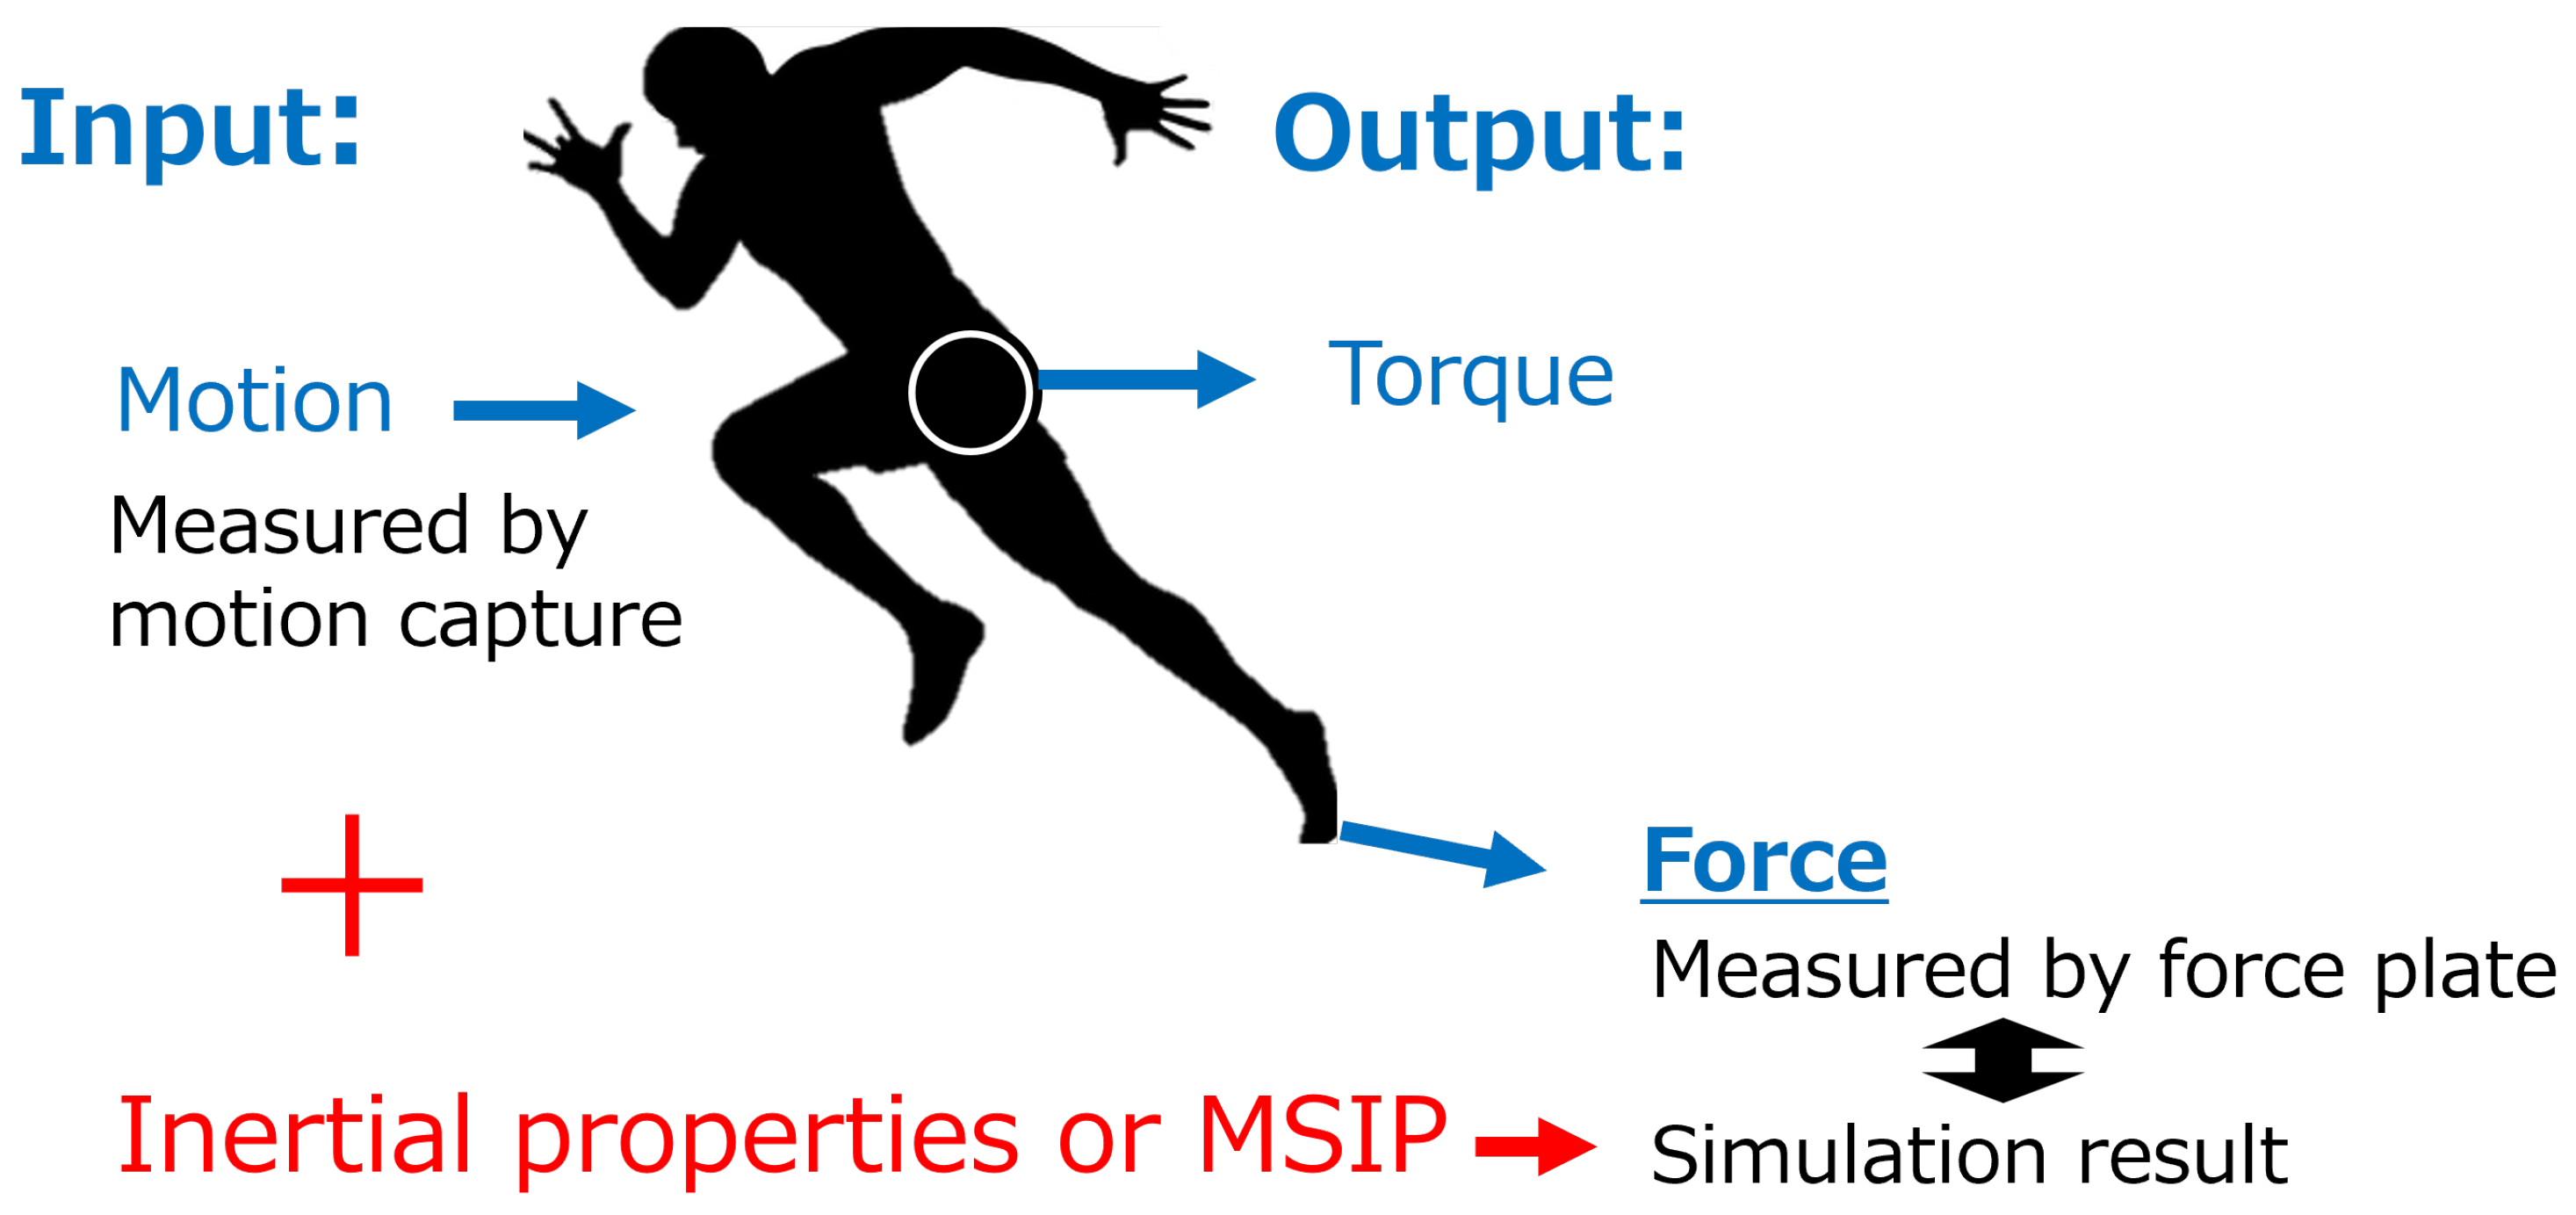
Figure 1.
Method for verifying the identification results.
Figure 1.
Method for verifying the identification results.
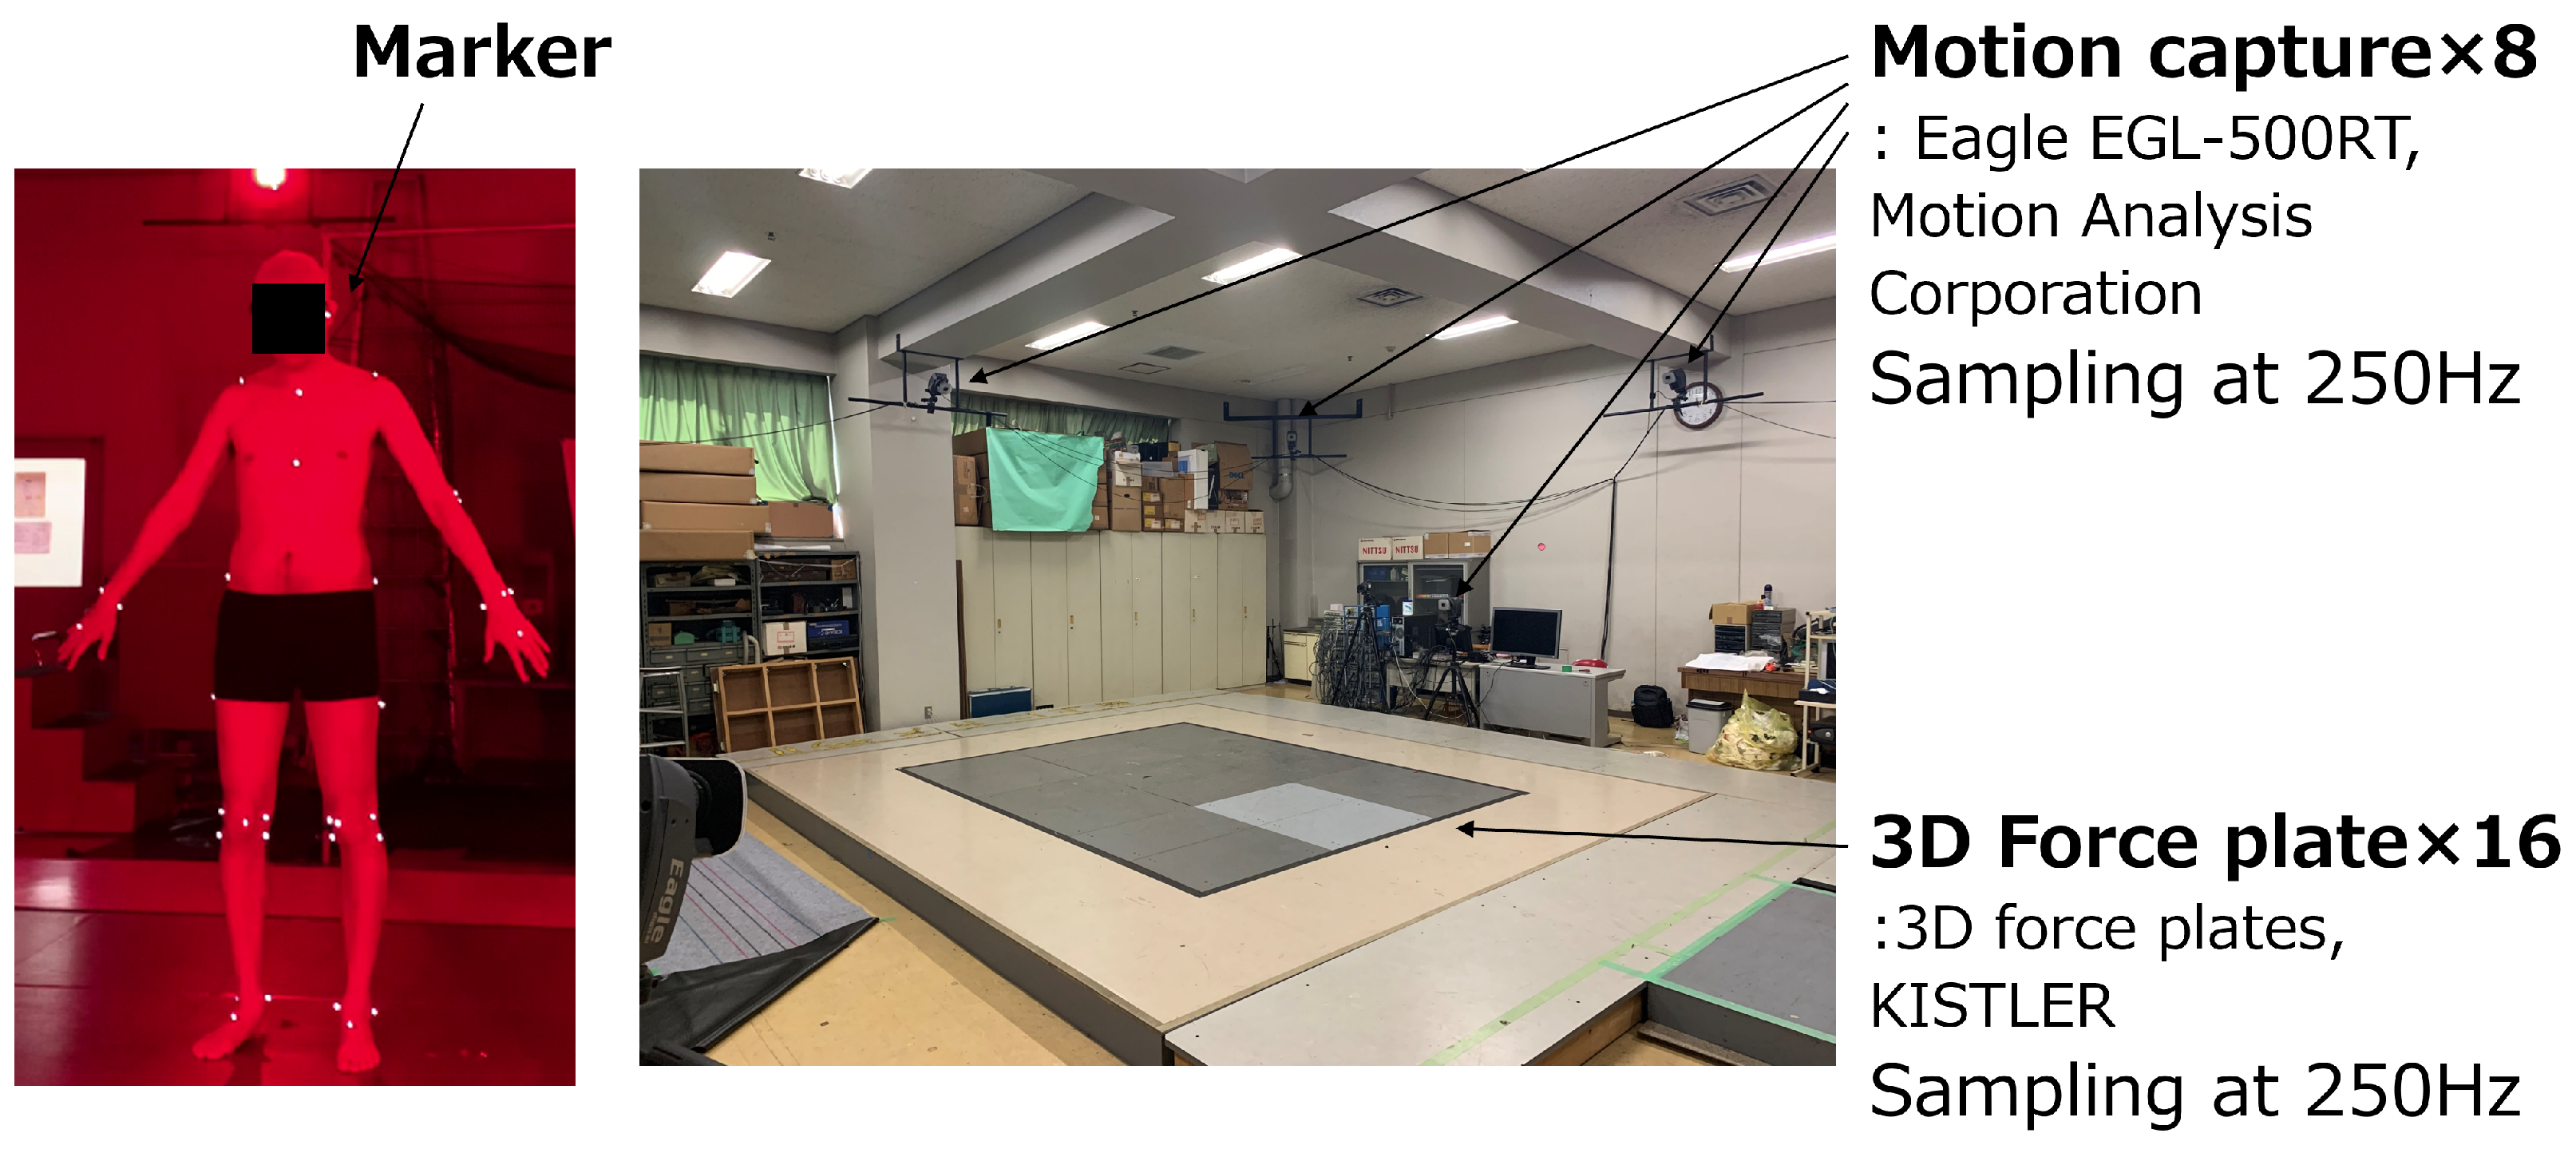
Figure 2.
Motion capture cameras, 3D force plates and markers.
Figure 2.
Motion capture cameras, 3D force plates and markers.
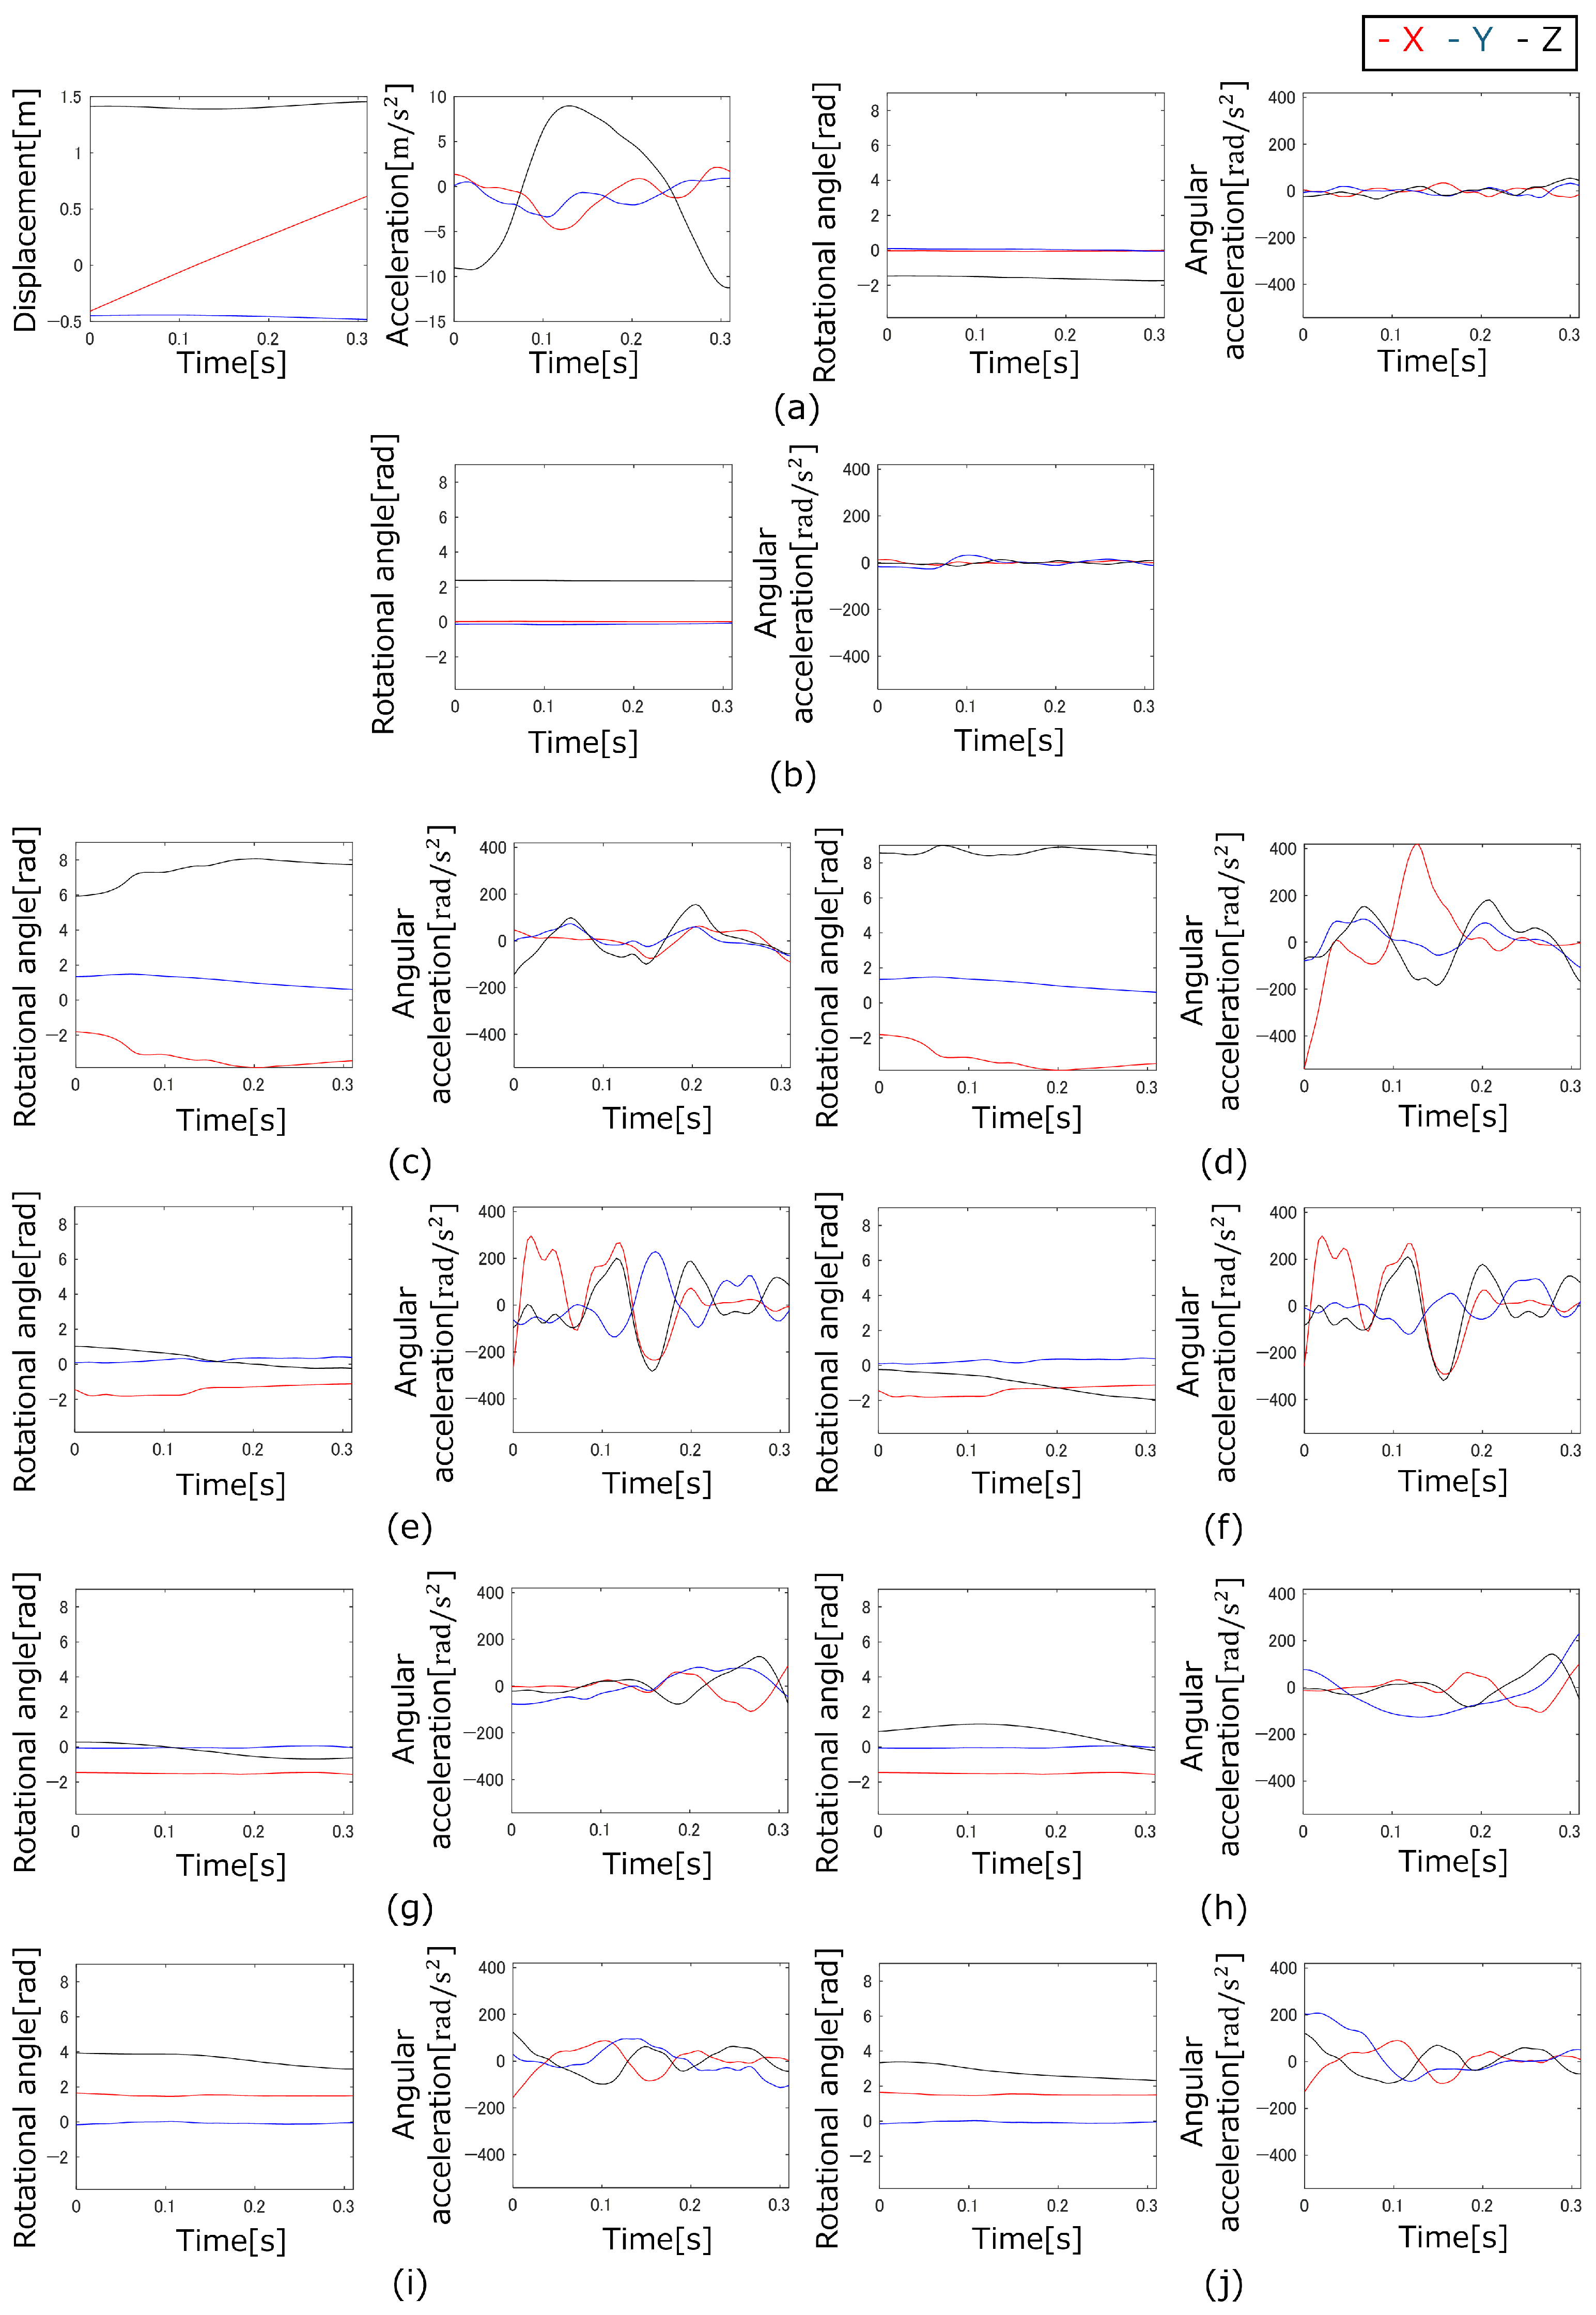
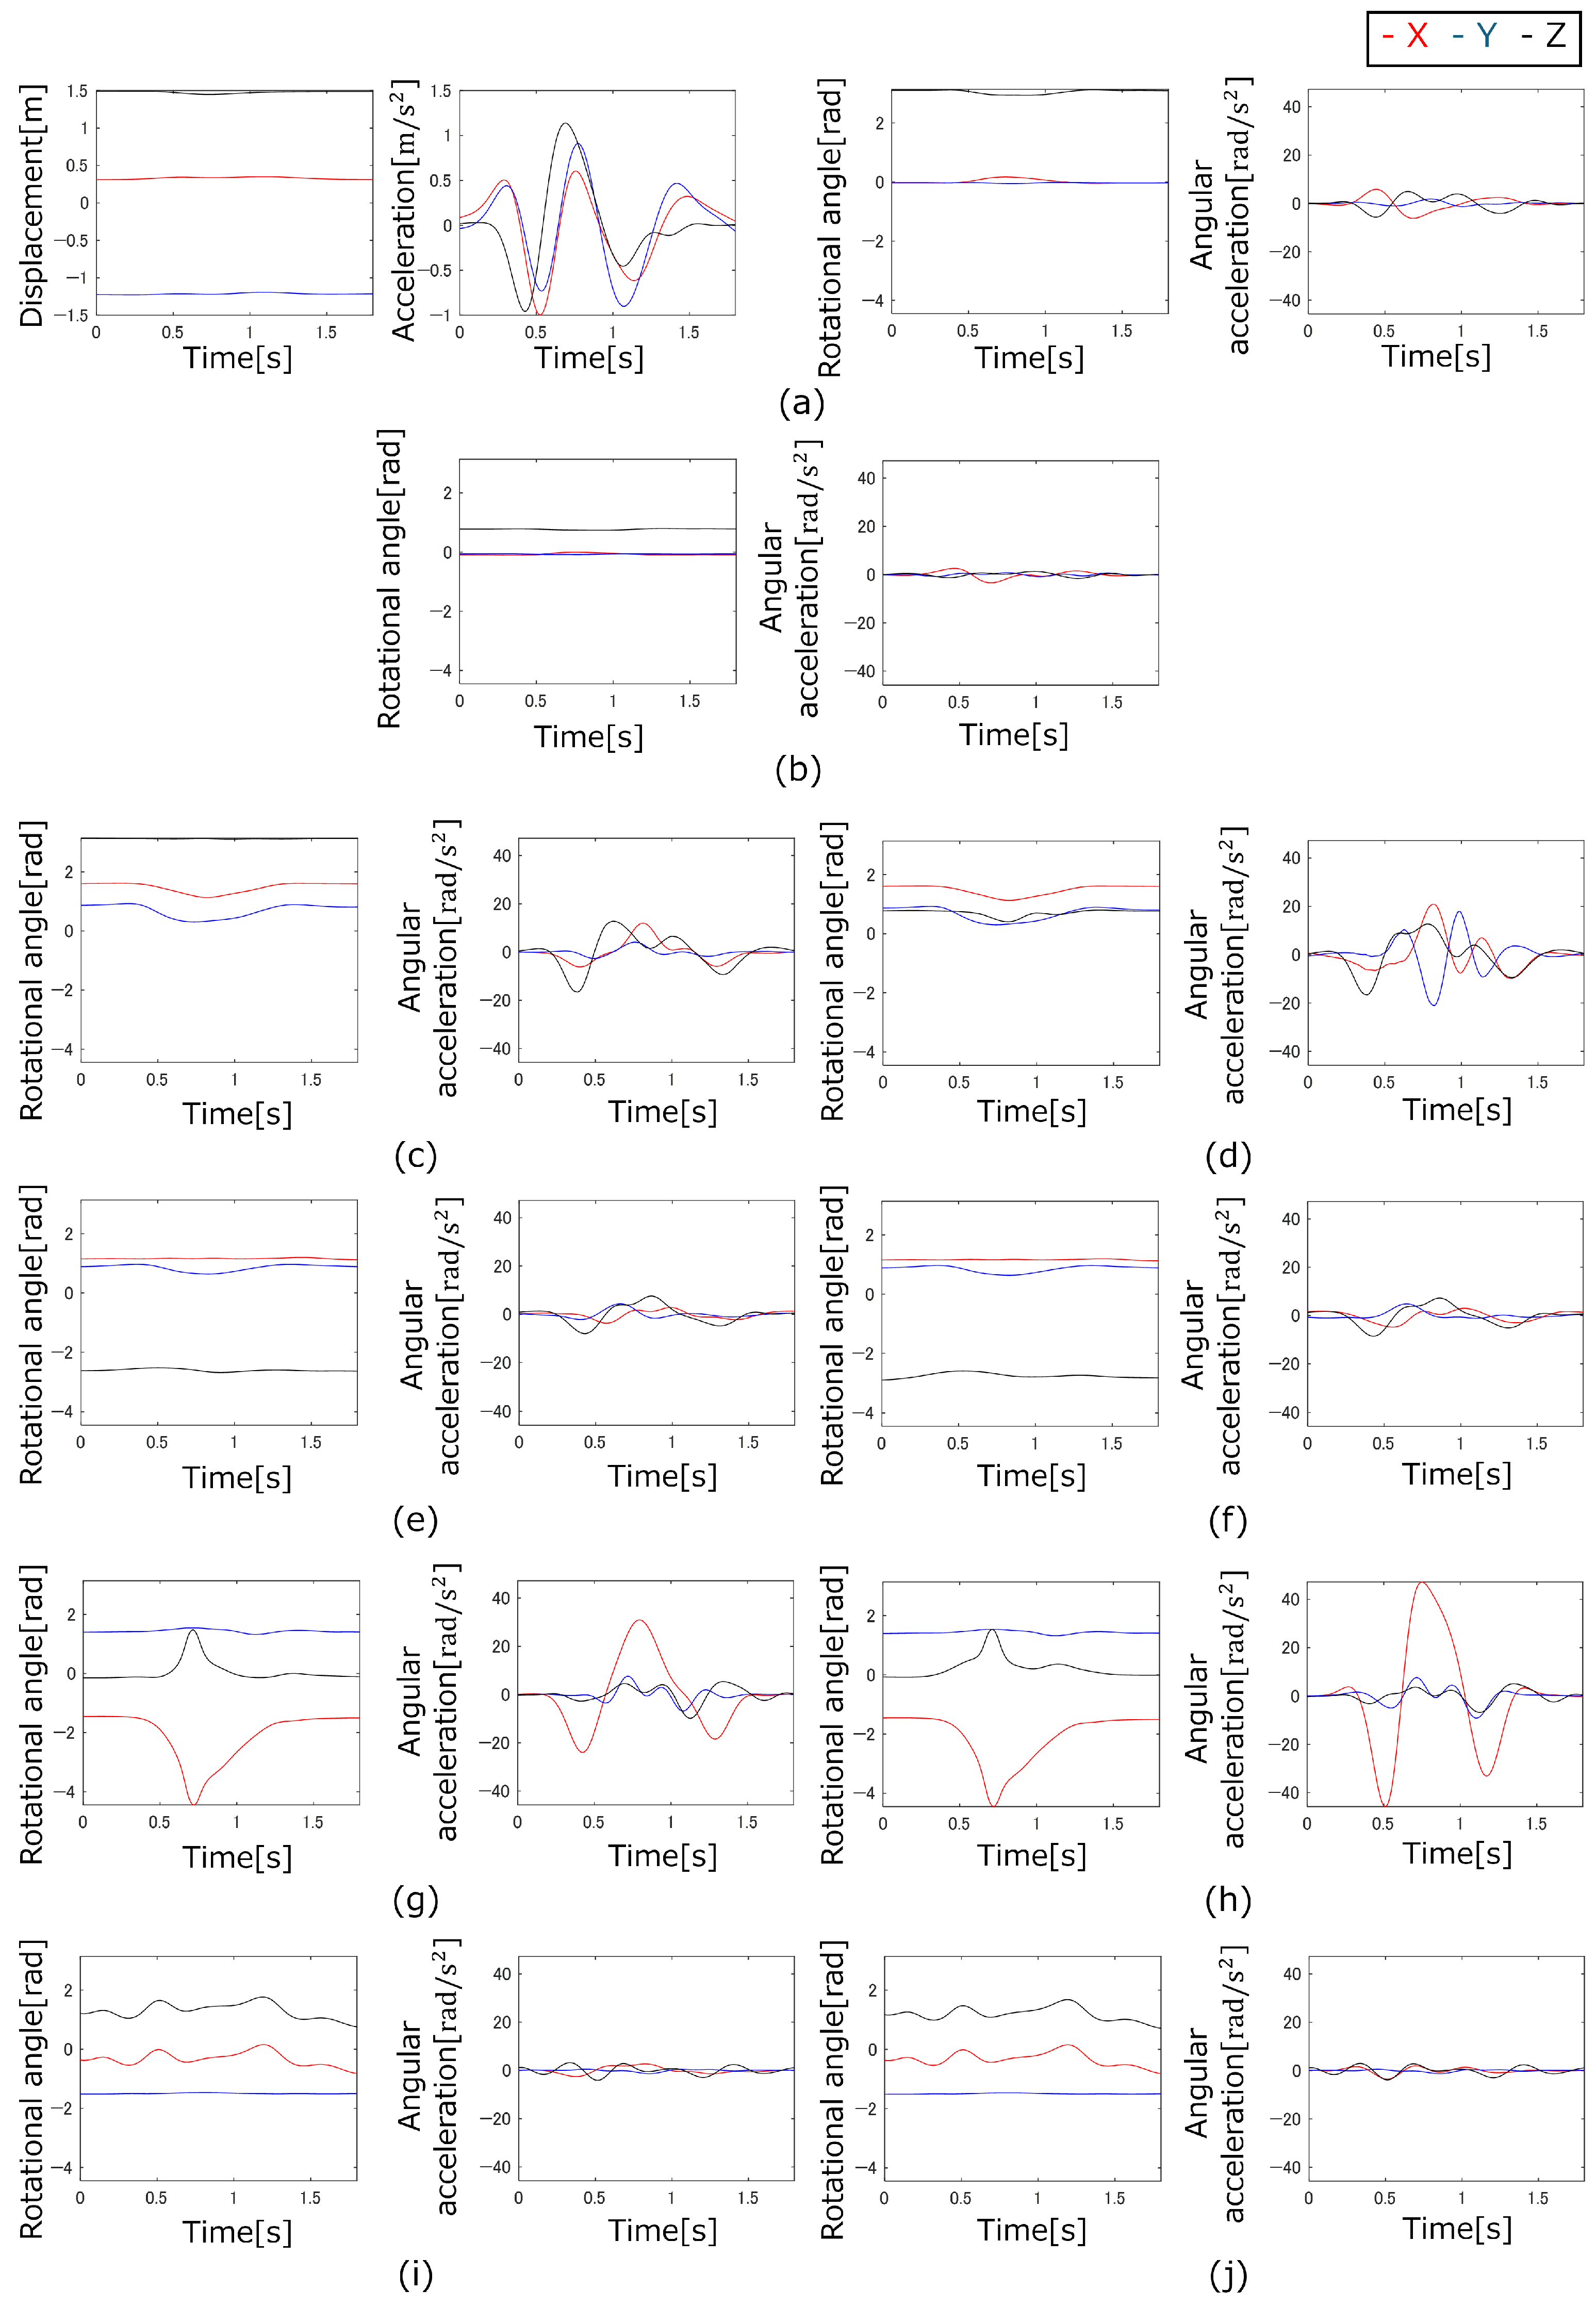
Figure 4.
Measured motion and calculated acceleration of running motion: (a) Trunk, (b) Head, (c) Right upper arm, (d) Right forearm + hand, (e) Left upper arm, (f) Left forearm + hand, (g) Right thigh, (h) Right lower leg + foot, (i) Left thigh, (j) Left lower leg + foot.
Figure 4.
Measured motion and calculated acceleration of running motion: (a) Trunk, (b) Head, (c) Right upper arm, (d) Right forearm + hand, (e) Left upper arm, (f) Left forearm + hand, (g) Right thigh, (h) Right lower leg + foot, (i) Left thigh, (j) Left lower leg + foot.
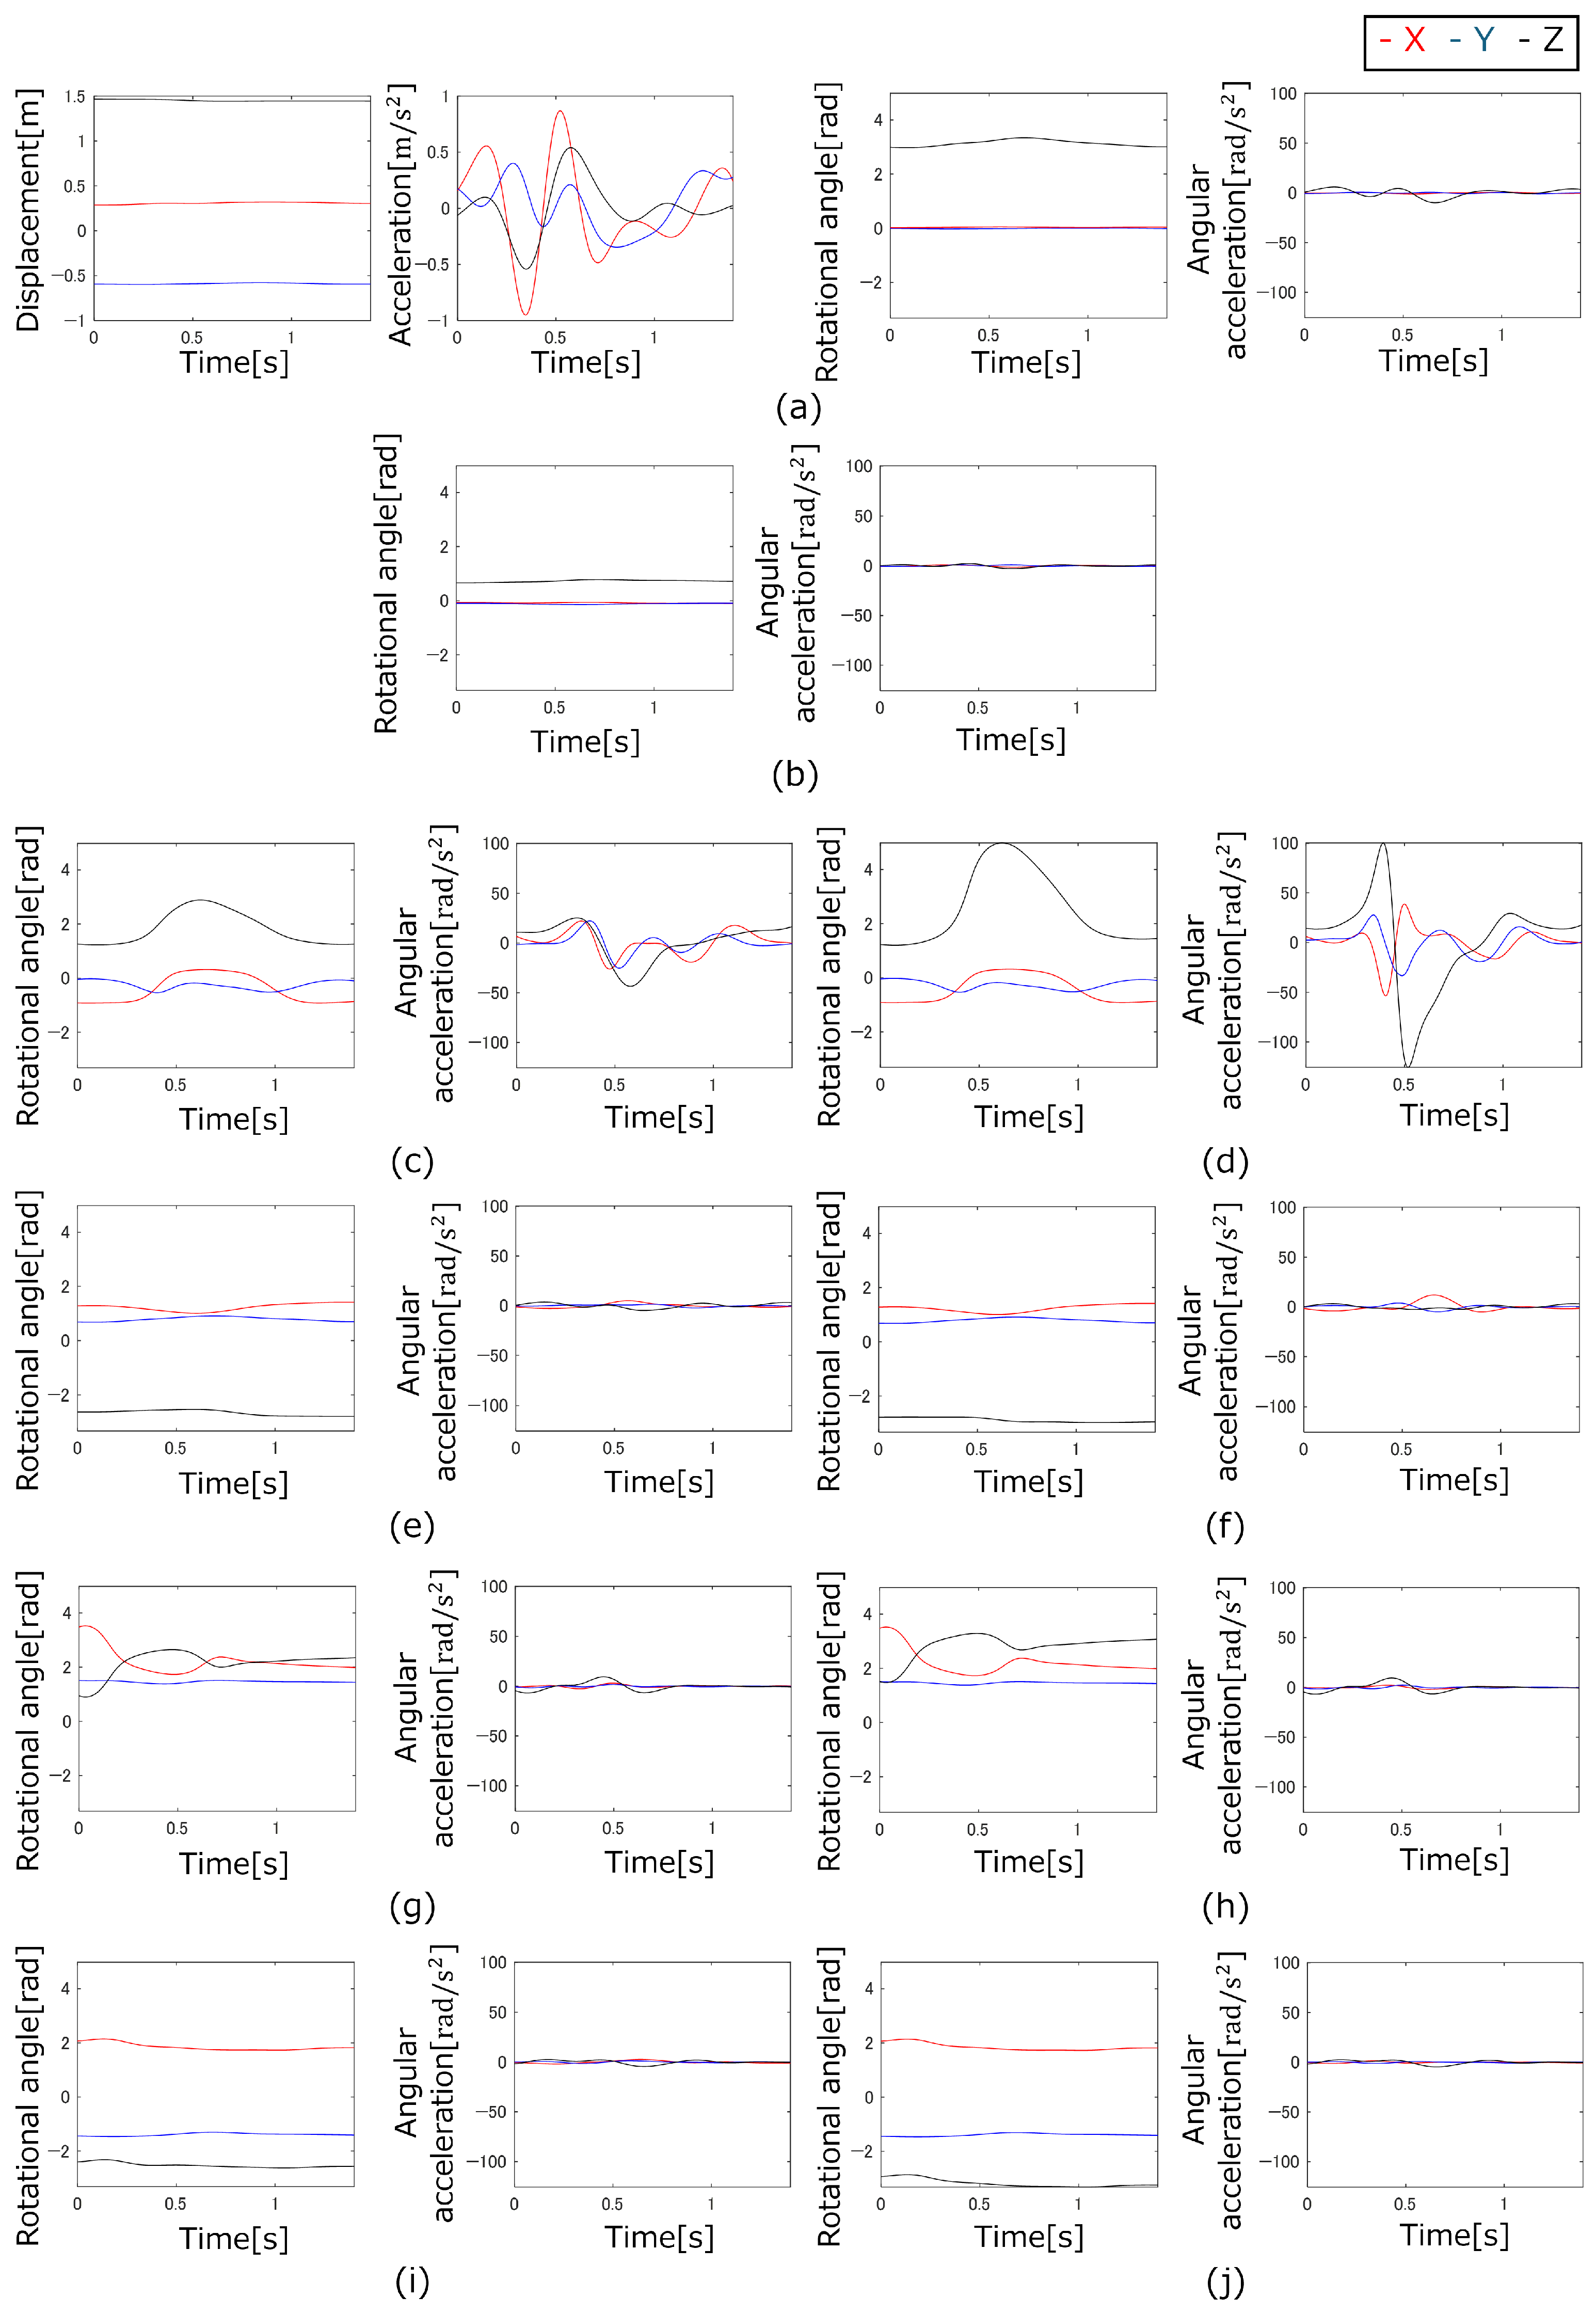
Figure 5.
Measured motion and calculated acceleration of side-cutting motion: (a) Trunk, (b) Head, (c) Right upper arm, (d) Right forearm + hand, (e) Left upper arm, (f) Left forearm + hand, (g) Right thigh, (h) Right lower leg + foot, (i) Left thigh, (j) Left lower leg + foot.
Figure 5.
Measured motion and calculated acceleration of side-cutting motion: (a) Trunk, (b) Head, (c) Right upper arm, (d) Right forearm + hand, (e) Left upper arm, (f) Left forearm + hand, (g) Right thigh, (h) Right lower leg + foot, (i) Left thigh, (j) Left lower leg + foot.
Figure 6.
Measured motion and calculated acceleration of vertical jump motion: (a) Trunk, (b) Head, (c) Right upper arm, (d) Right forearm + hand, (e) Left upper arm, (f) Left forearm + hand, (g) Right thigh, (h) Right lower leg + foot, (i) Left thigh, (j) Left lower leg + foot.
Figure 6.
Measured motion and calculated acceleration of vertical jump motion: (a) Trunk, (b) Head, (c) Right upper arm, (d) Right forearm + hand, (e) Left upper arm, (f) Left forearm + hand, (g) Right thigh, (h) Right lower leg + foot, (i) Left thigh, (j) Left lower leg + foot.
Figure 7.
Measured motion and calculated acceleration of arm swing motion: (a) Trunk, (b) Head, (c) Right upper arm, (d) Right forearm + hand, (e) Left upper arm, (f) Left forearm + hand, (g) Right thigh, (h) Right lower leg + foot, (i) Left thigh, (j) Left lower leg + foot.
Figure 7.
Measured motion and calculated acceleration of arm swing motion: (a) Trunk, (b) Head, (c) Right upper arm, (d) Right forearm + hand, (e) Left upper arm, (f) Left forearm + hand, (g) Right thigh, (h) Right lower leg + foot, (i) Left thigh, (j) Left lower leg + foot.
Figure 8.
Measured motion and calculated acceleration of leg swing motion: (a) Trunk, (b) Head, (c) Right upper arm, (d) Right forearm + hand, (e) Left upper arm, (f) Left forearm + hand, (g) Right thigh, (h) Right lower leg + foot, (i) Left thigh, (j) Left lower leg + foot.
Figure 8.
Measured motion and calculated acceleration of leg swing motion: (a) Trunk, (b) Head, (c) Right upper arm, (d) Right forearm + hand, (e) Left upper arm, (f) Left forearm + hand, (g) Right thigh, (h) Right lower leg + foot, (i) Left thigh, (j) Left lower leg + foot.
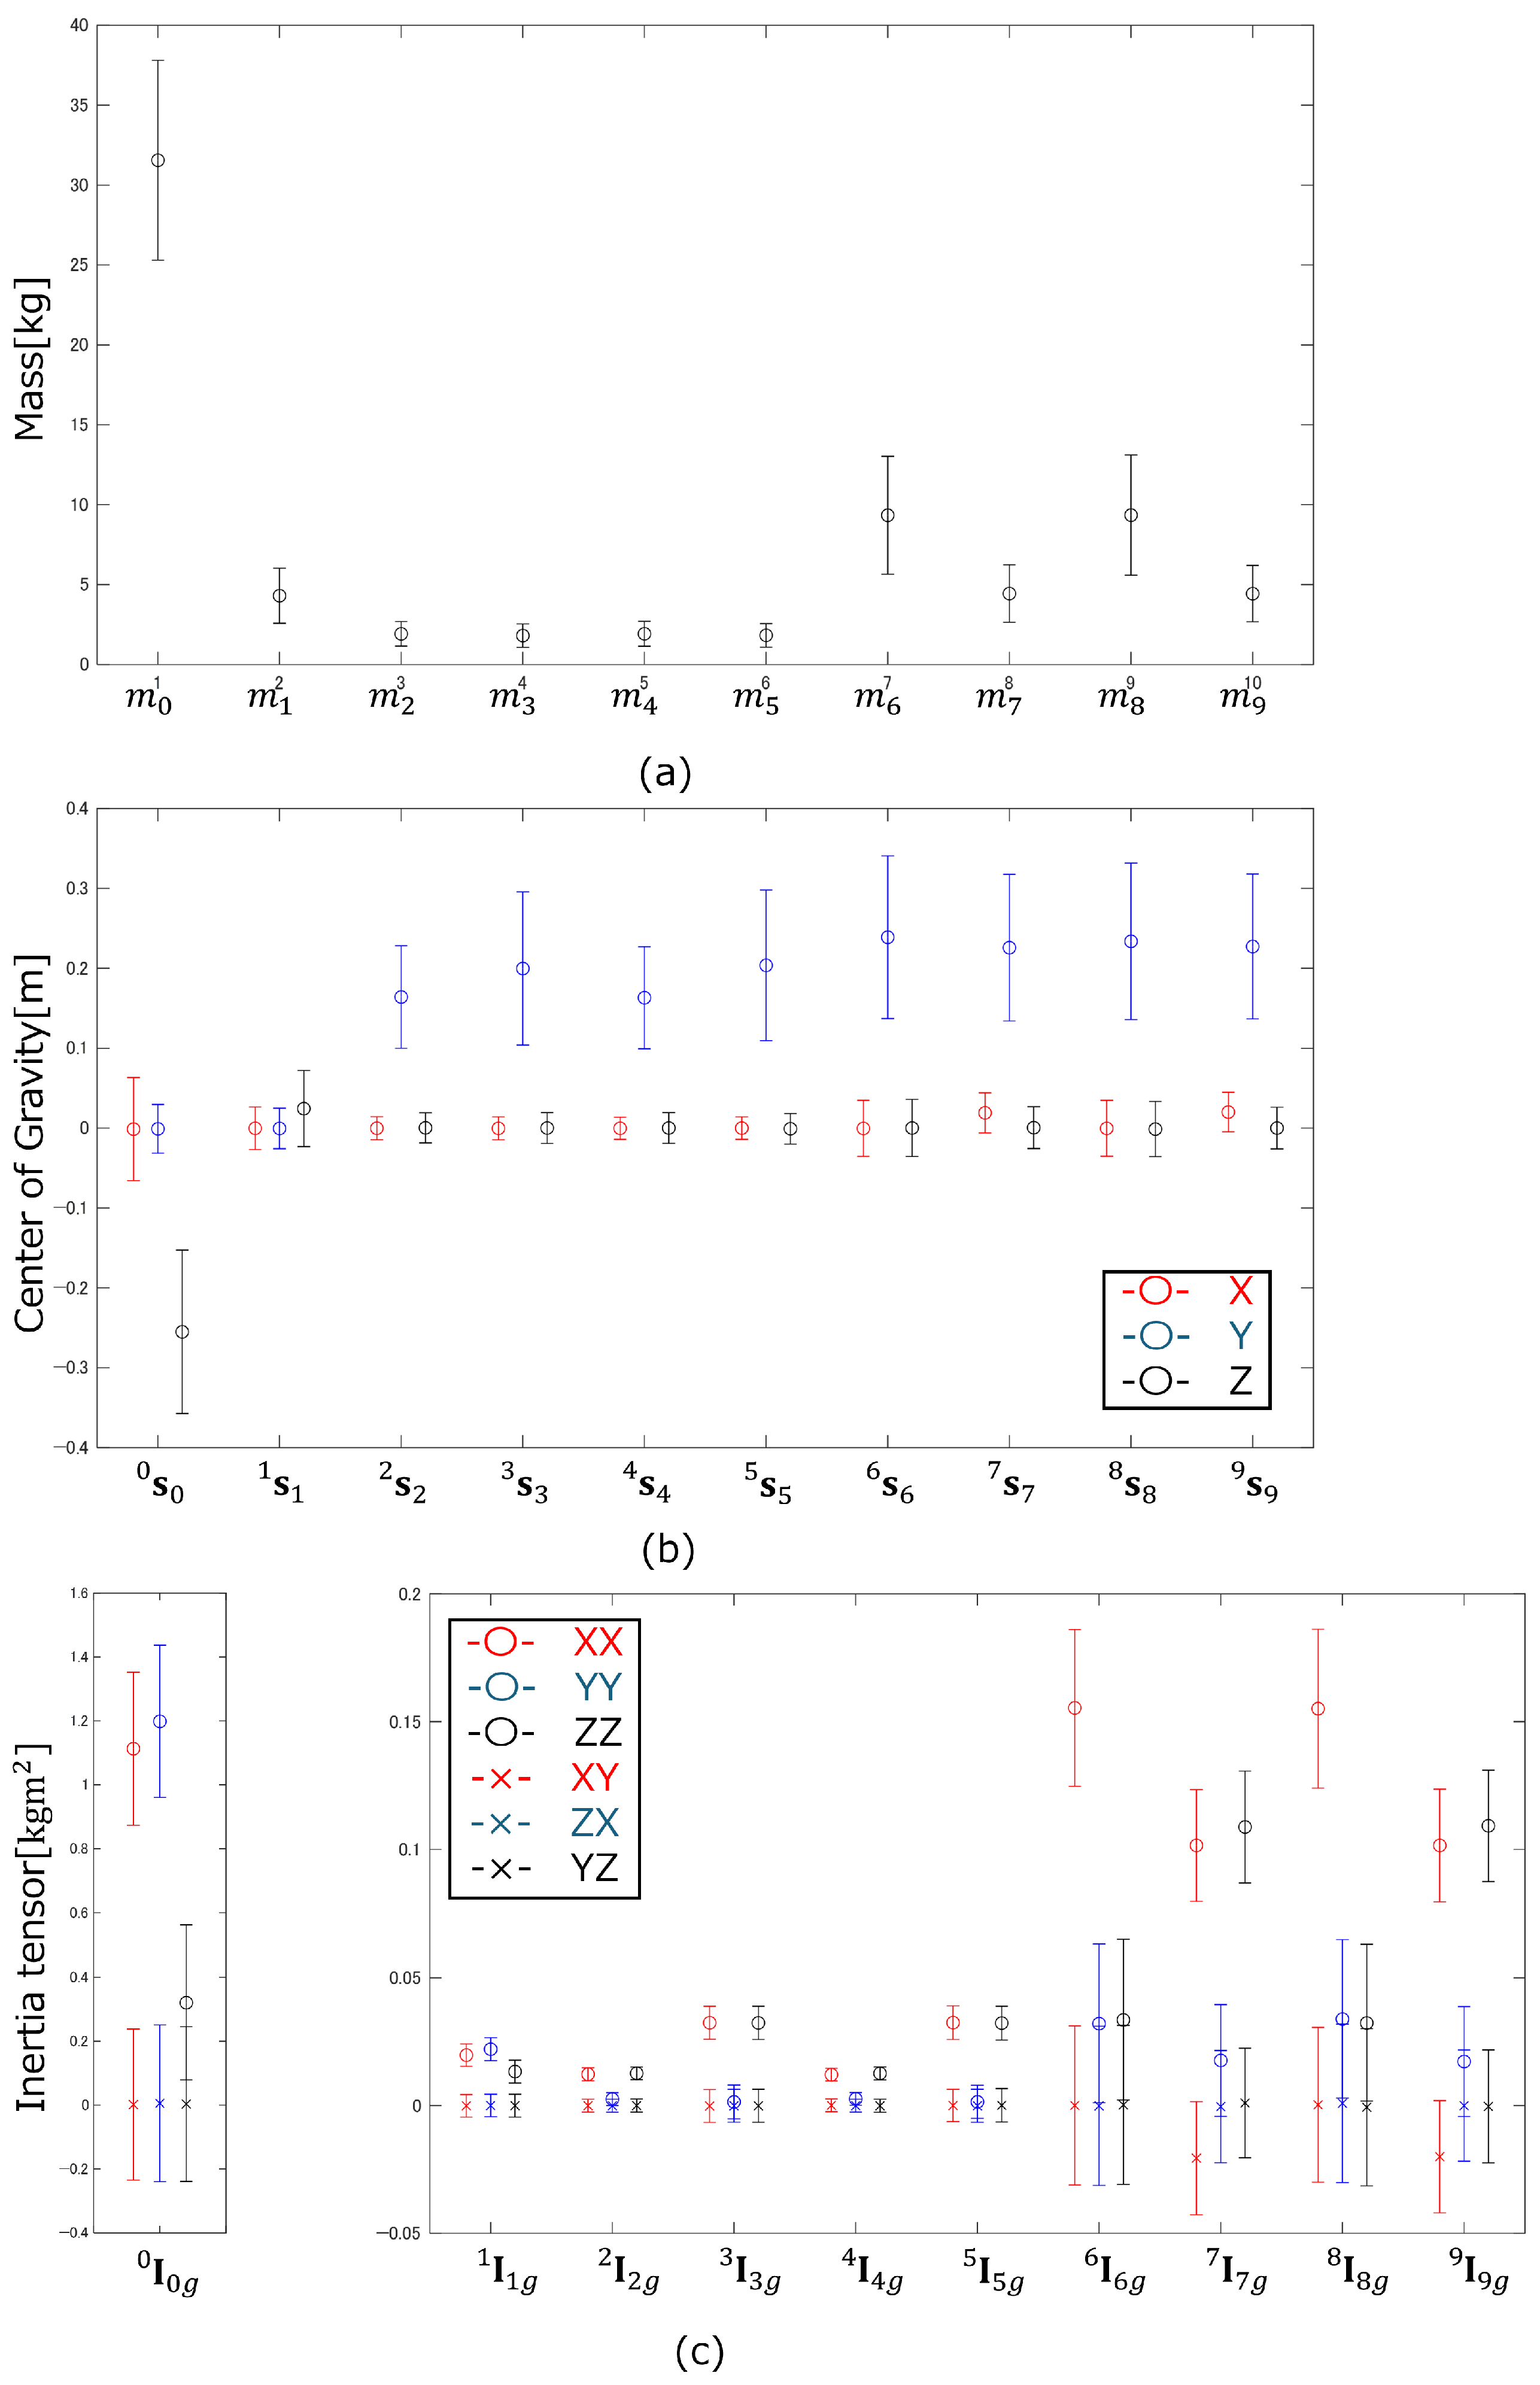
Figure 9.
Means and standard deviations of the (a) mass, (b) center of gravity and (c) inertia tensor.
Figure 9.
Means and standard deviations of the (a) mass, (b) center of gravity and (c) inertia tensor.
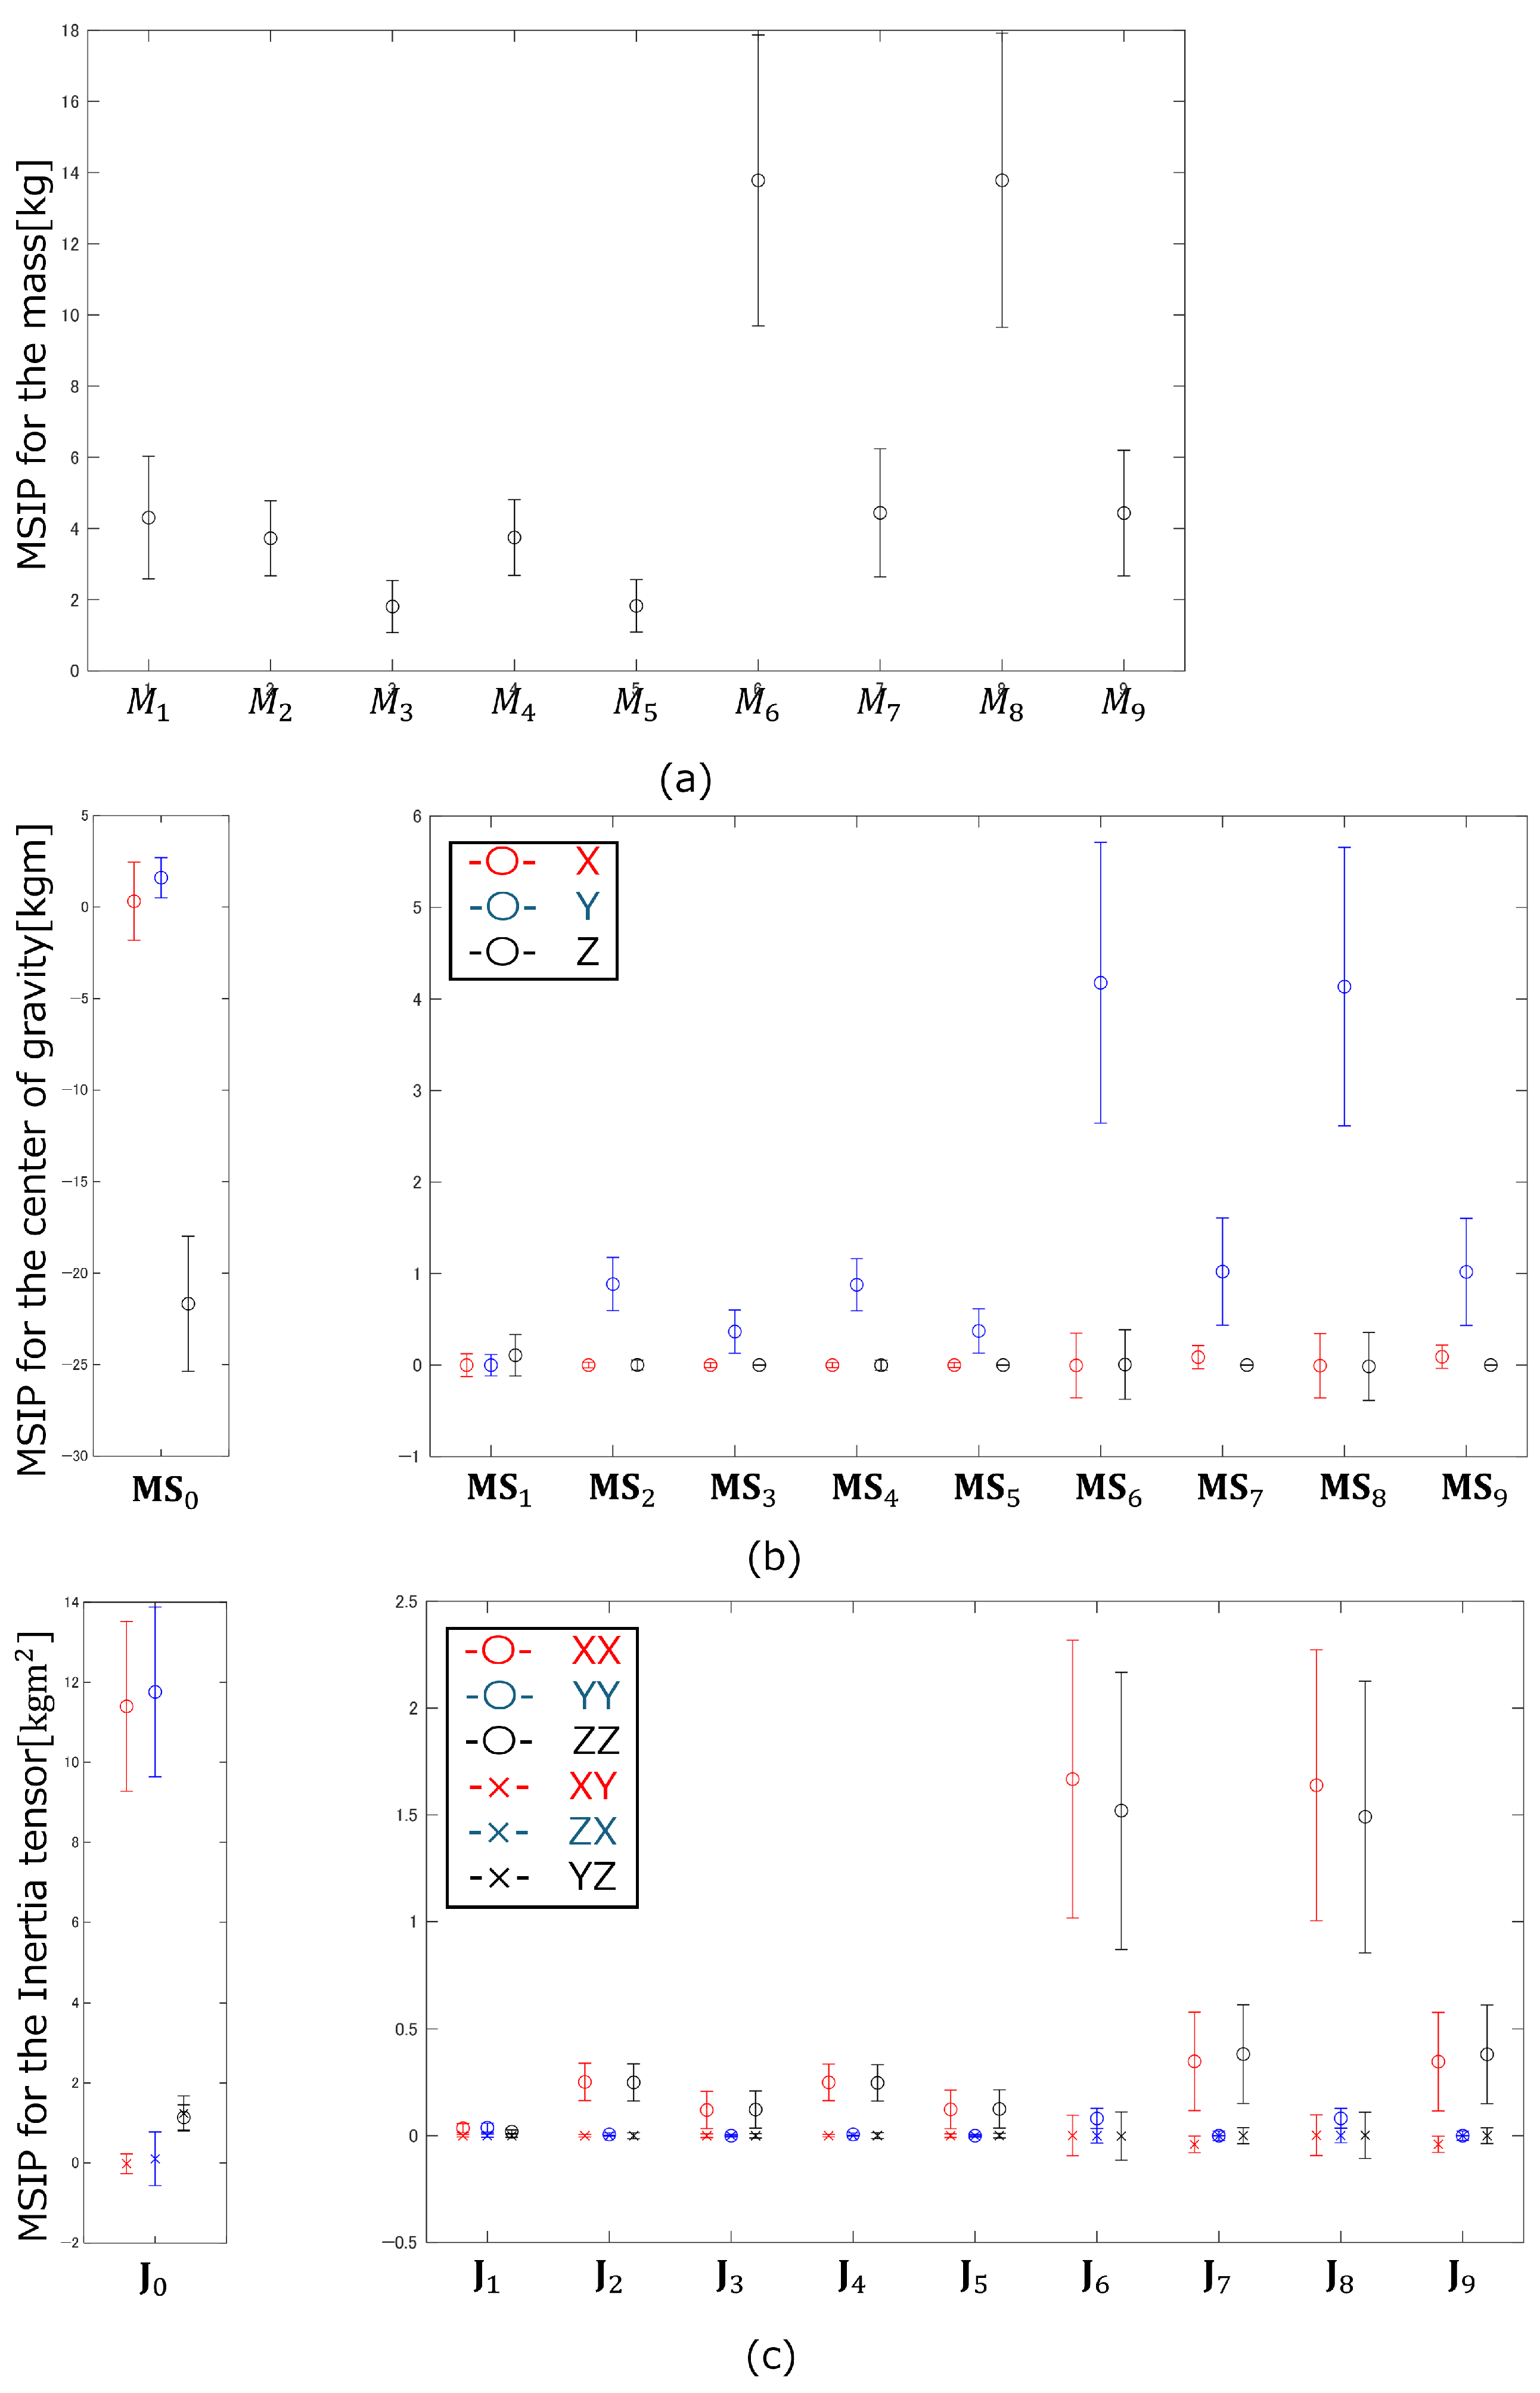
Figure 10.
Means and standard deviations of the MSIP for (a) mass, (b) center of gravity and (c) inertia tensor.
Figure 10.
Means and standard deviations of the MSIP for (a) mass, (b) center of gravity and (c) inertia tensor.
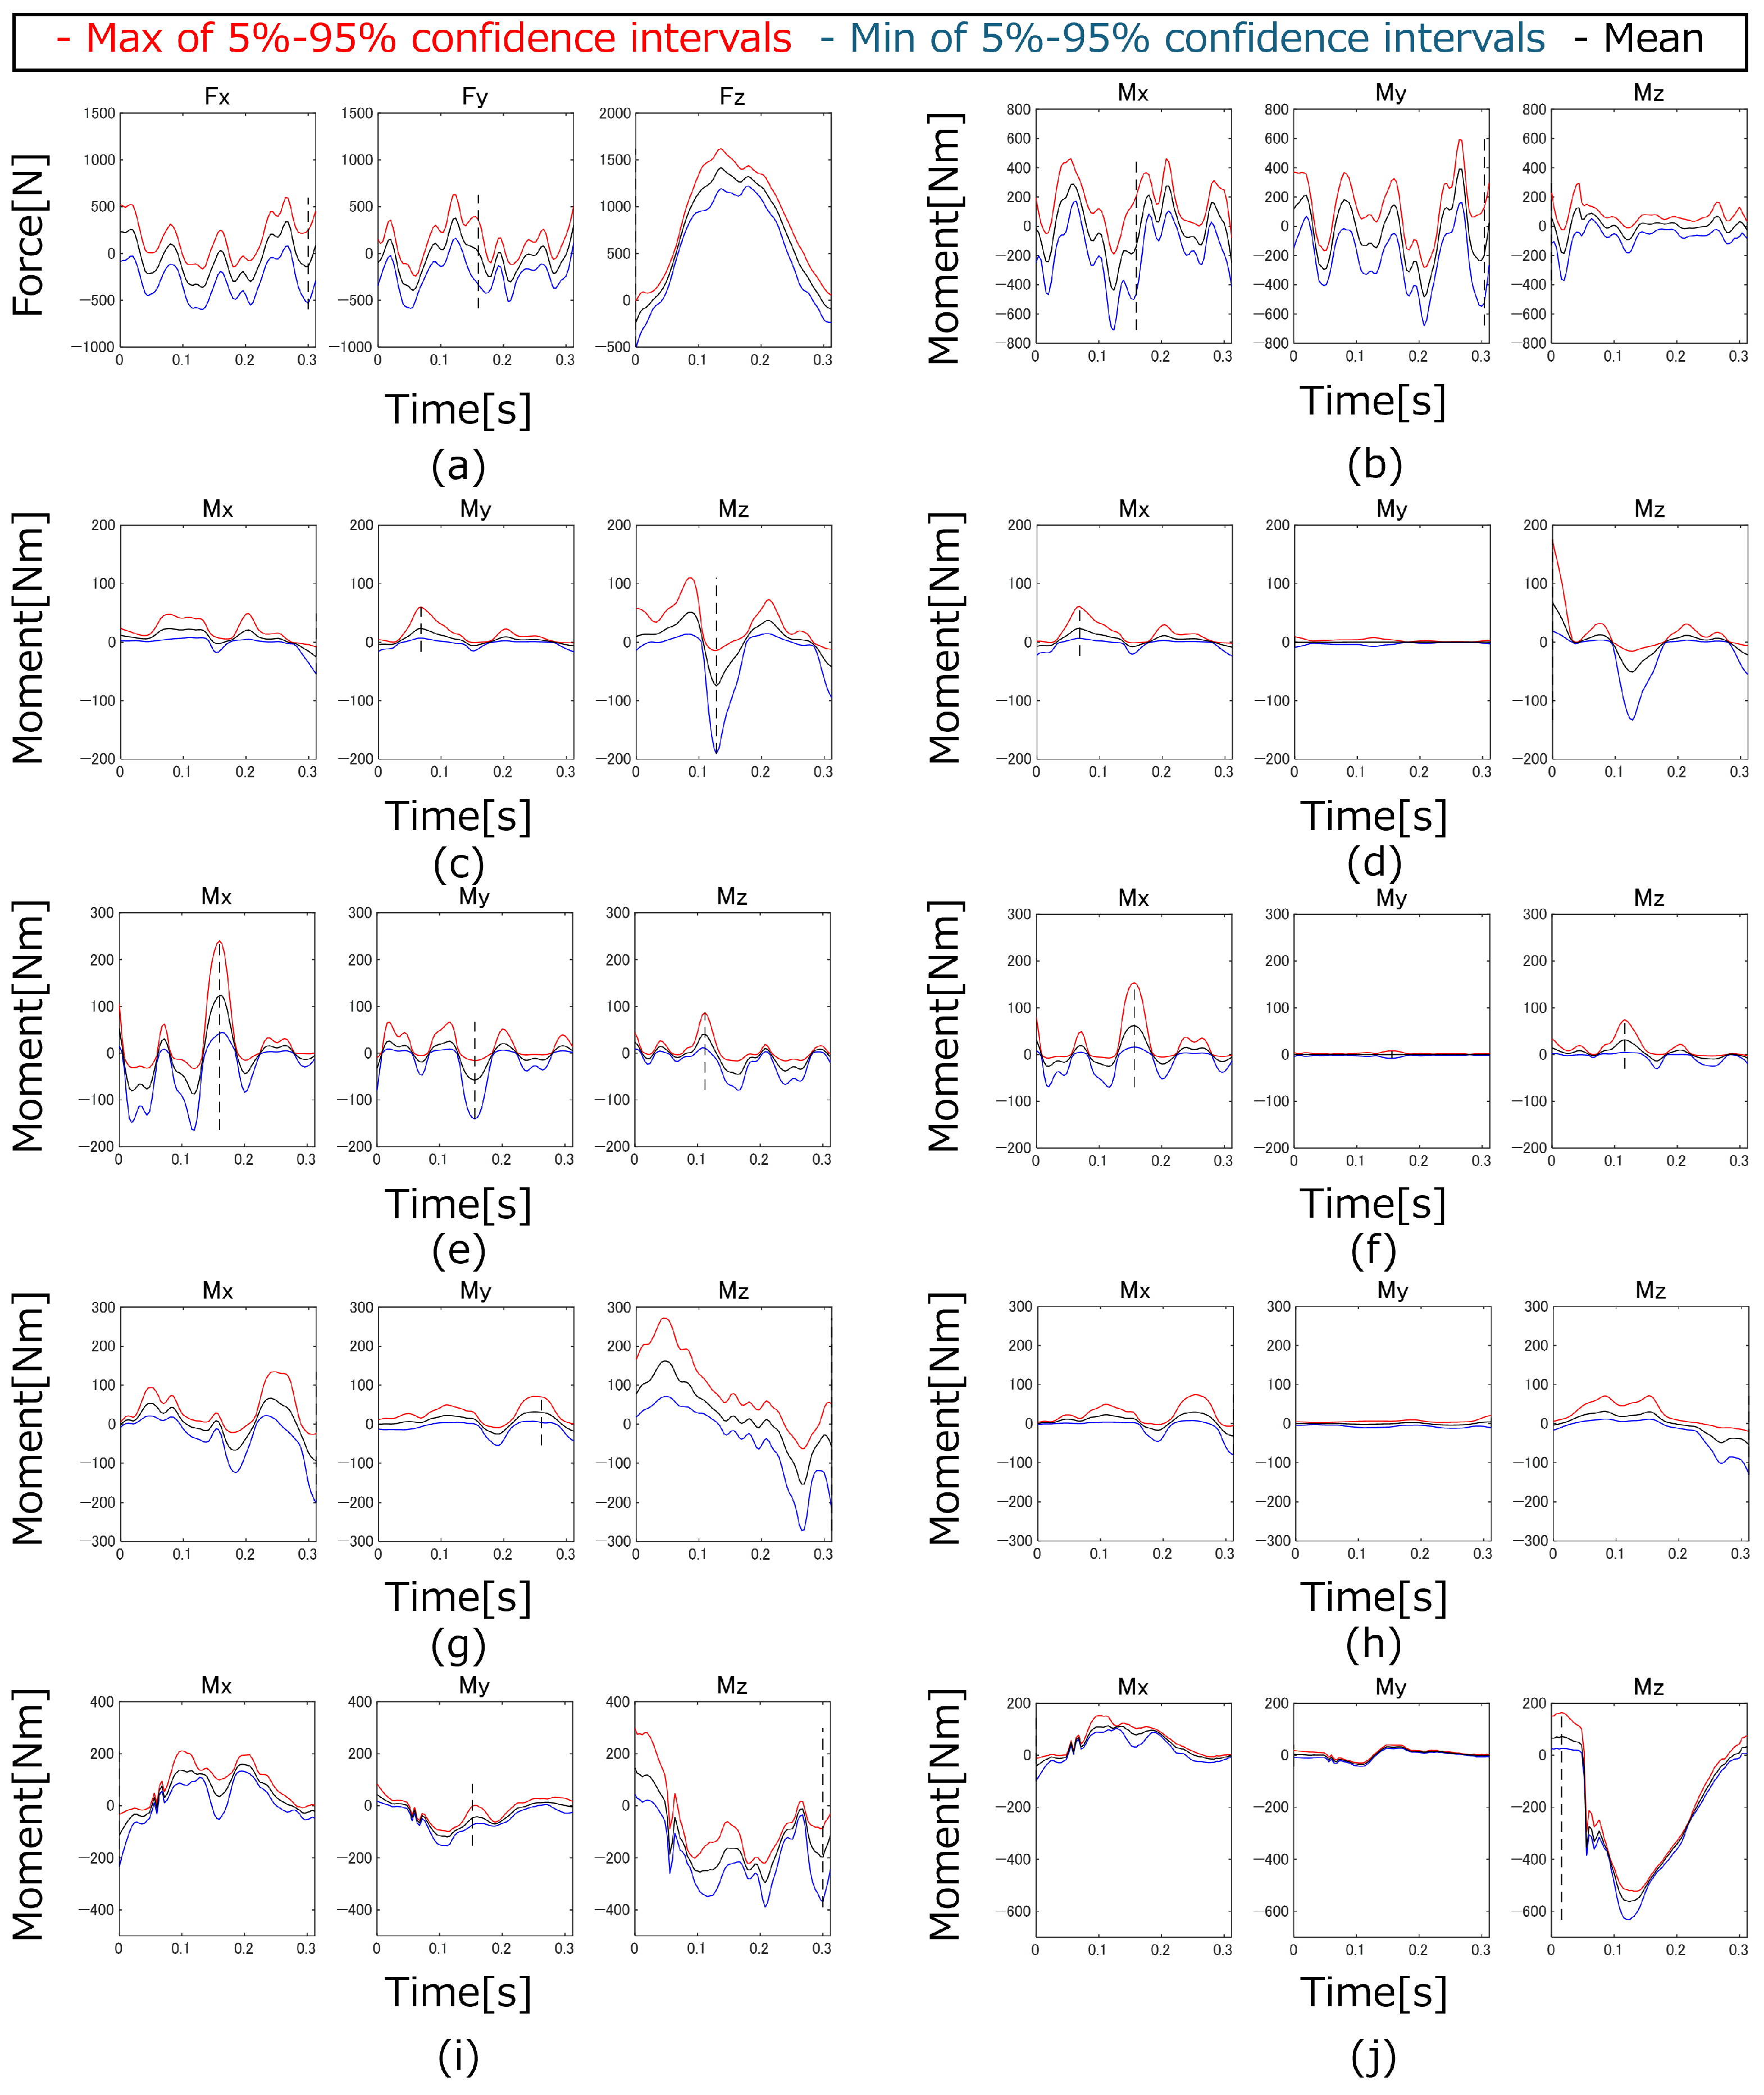
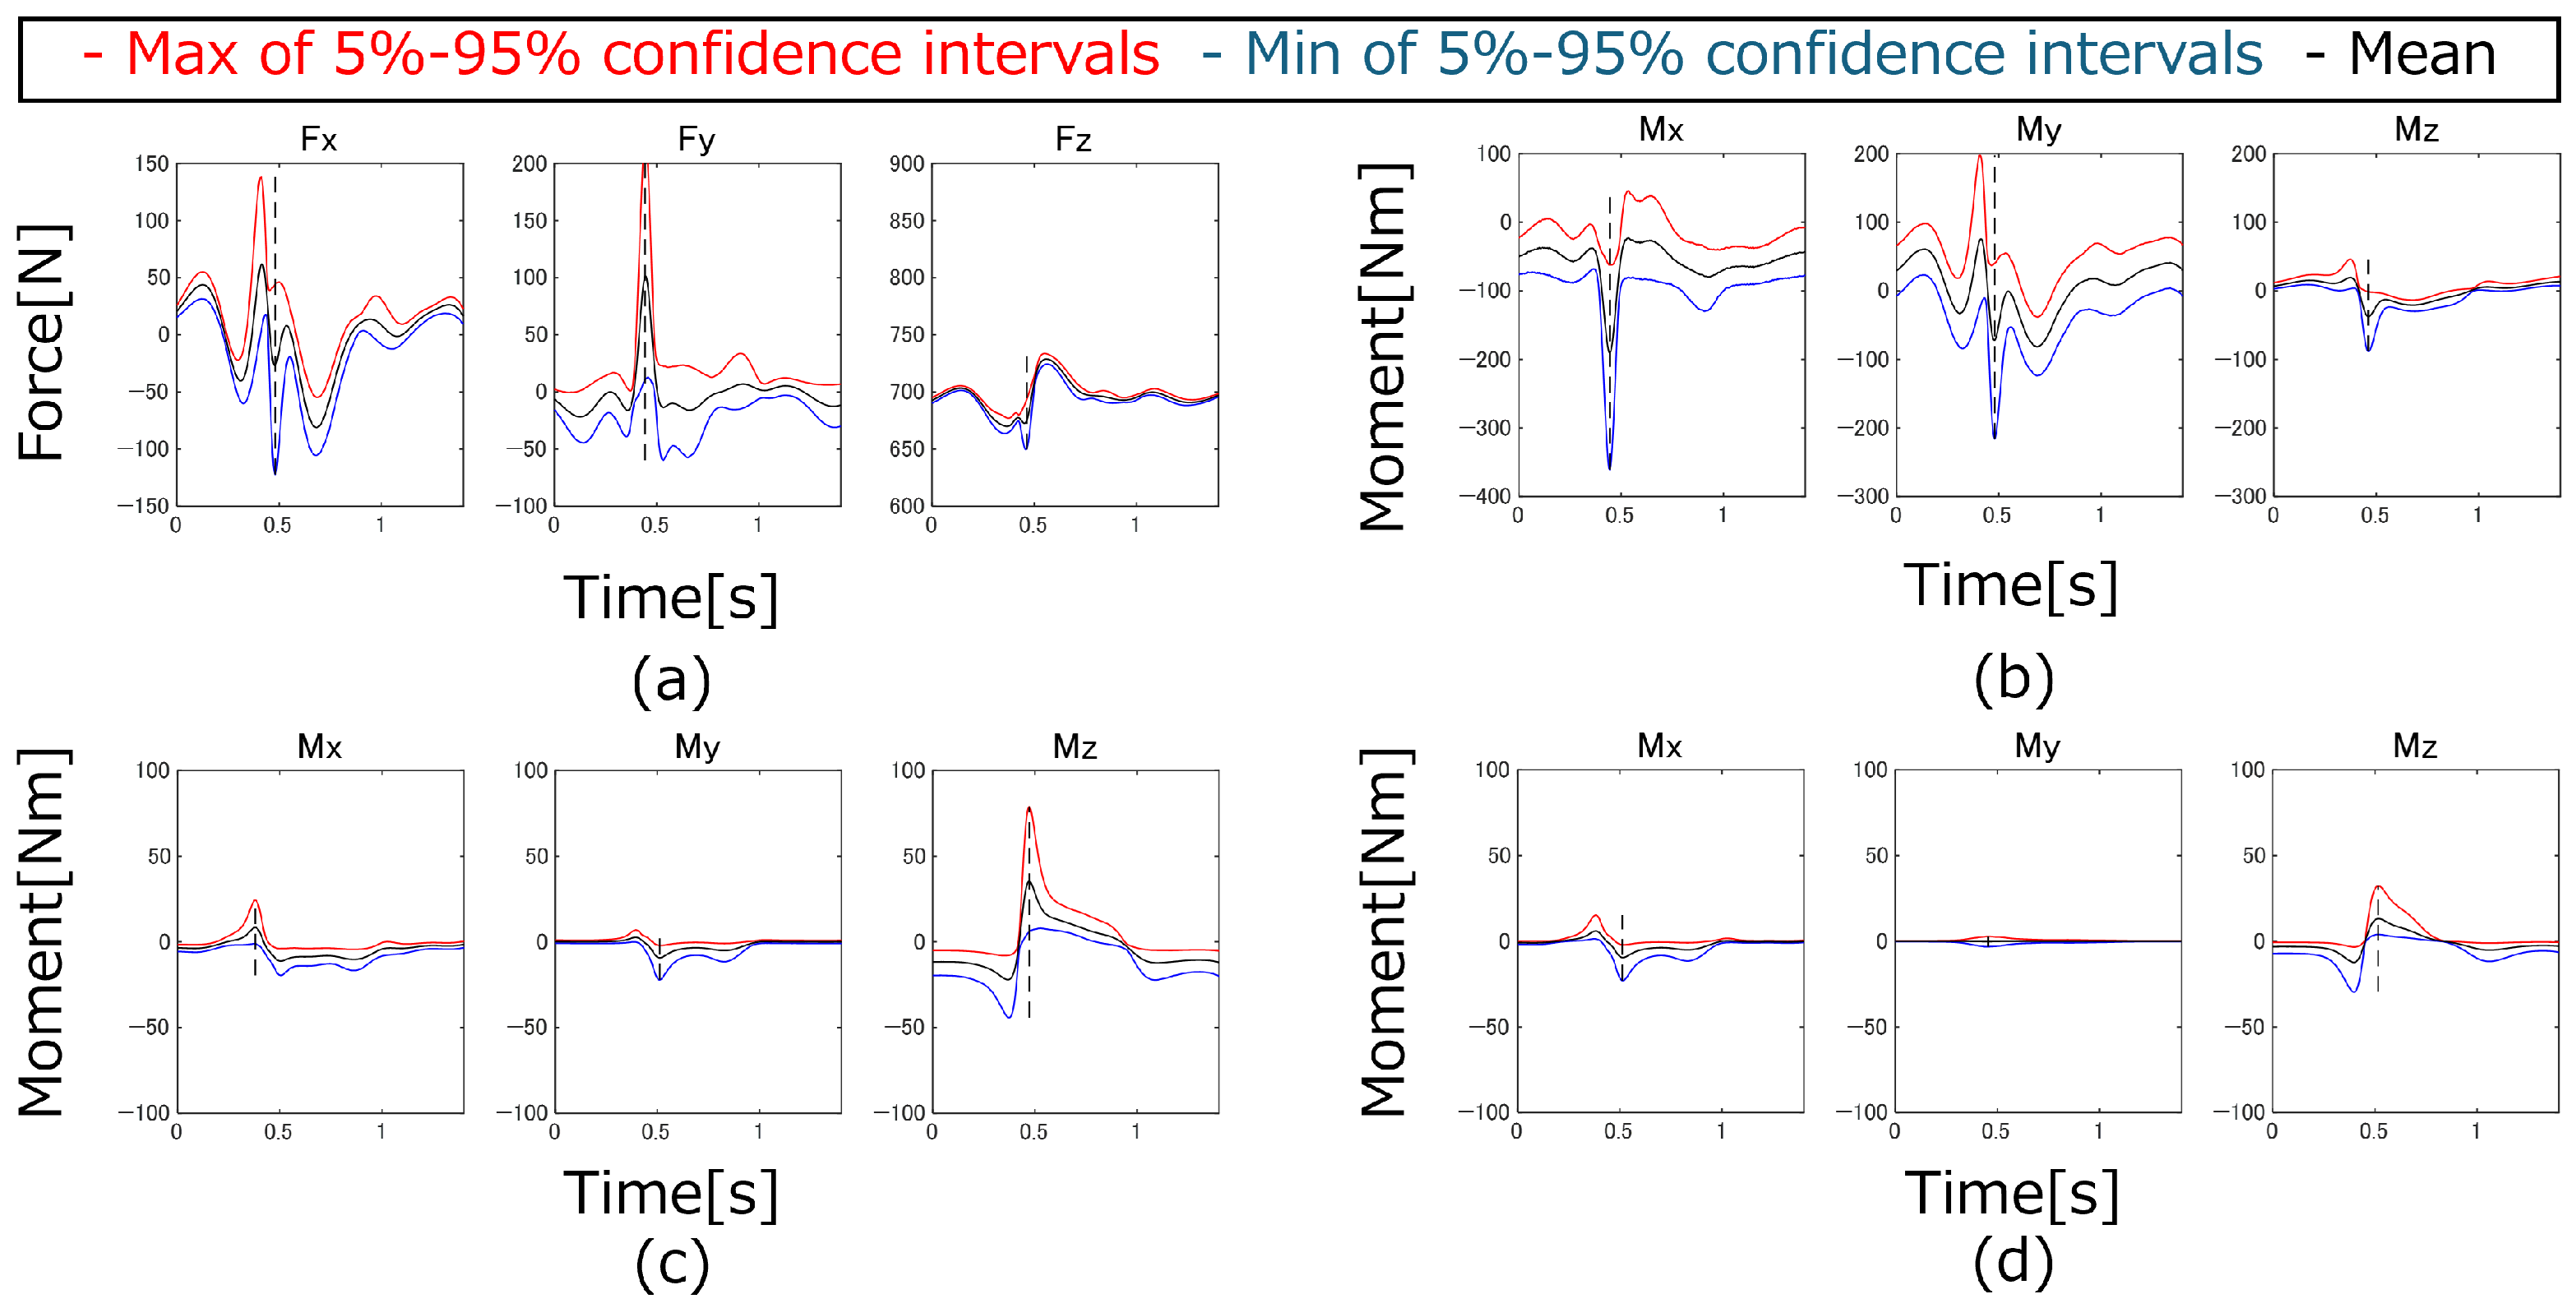
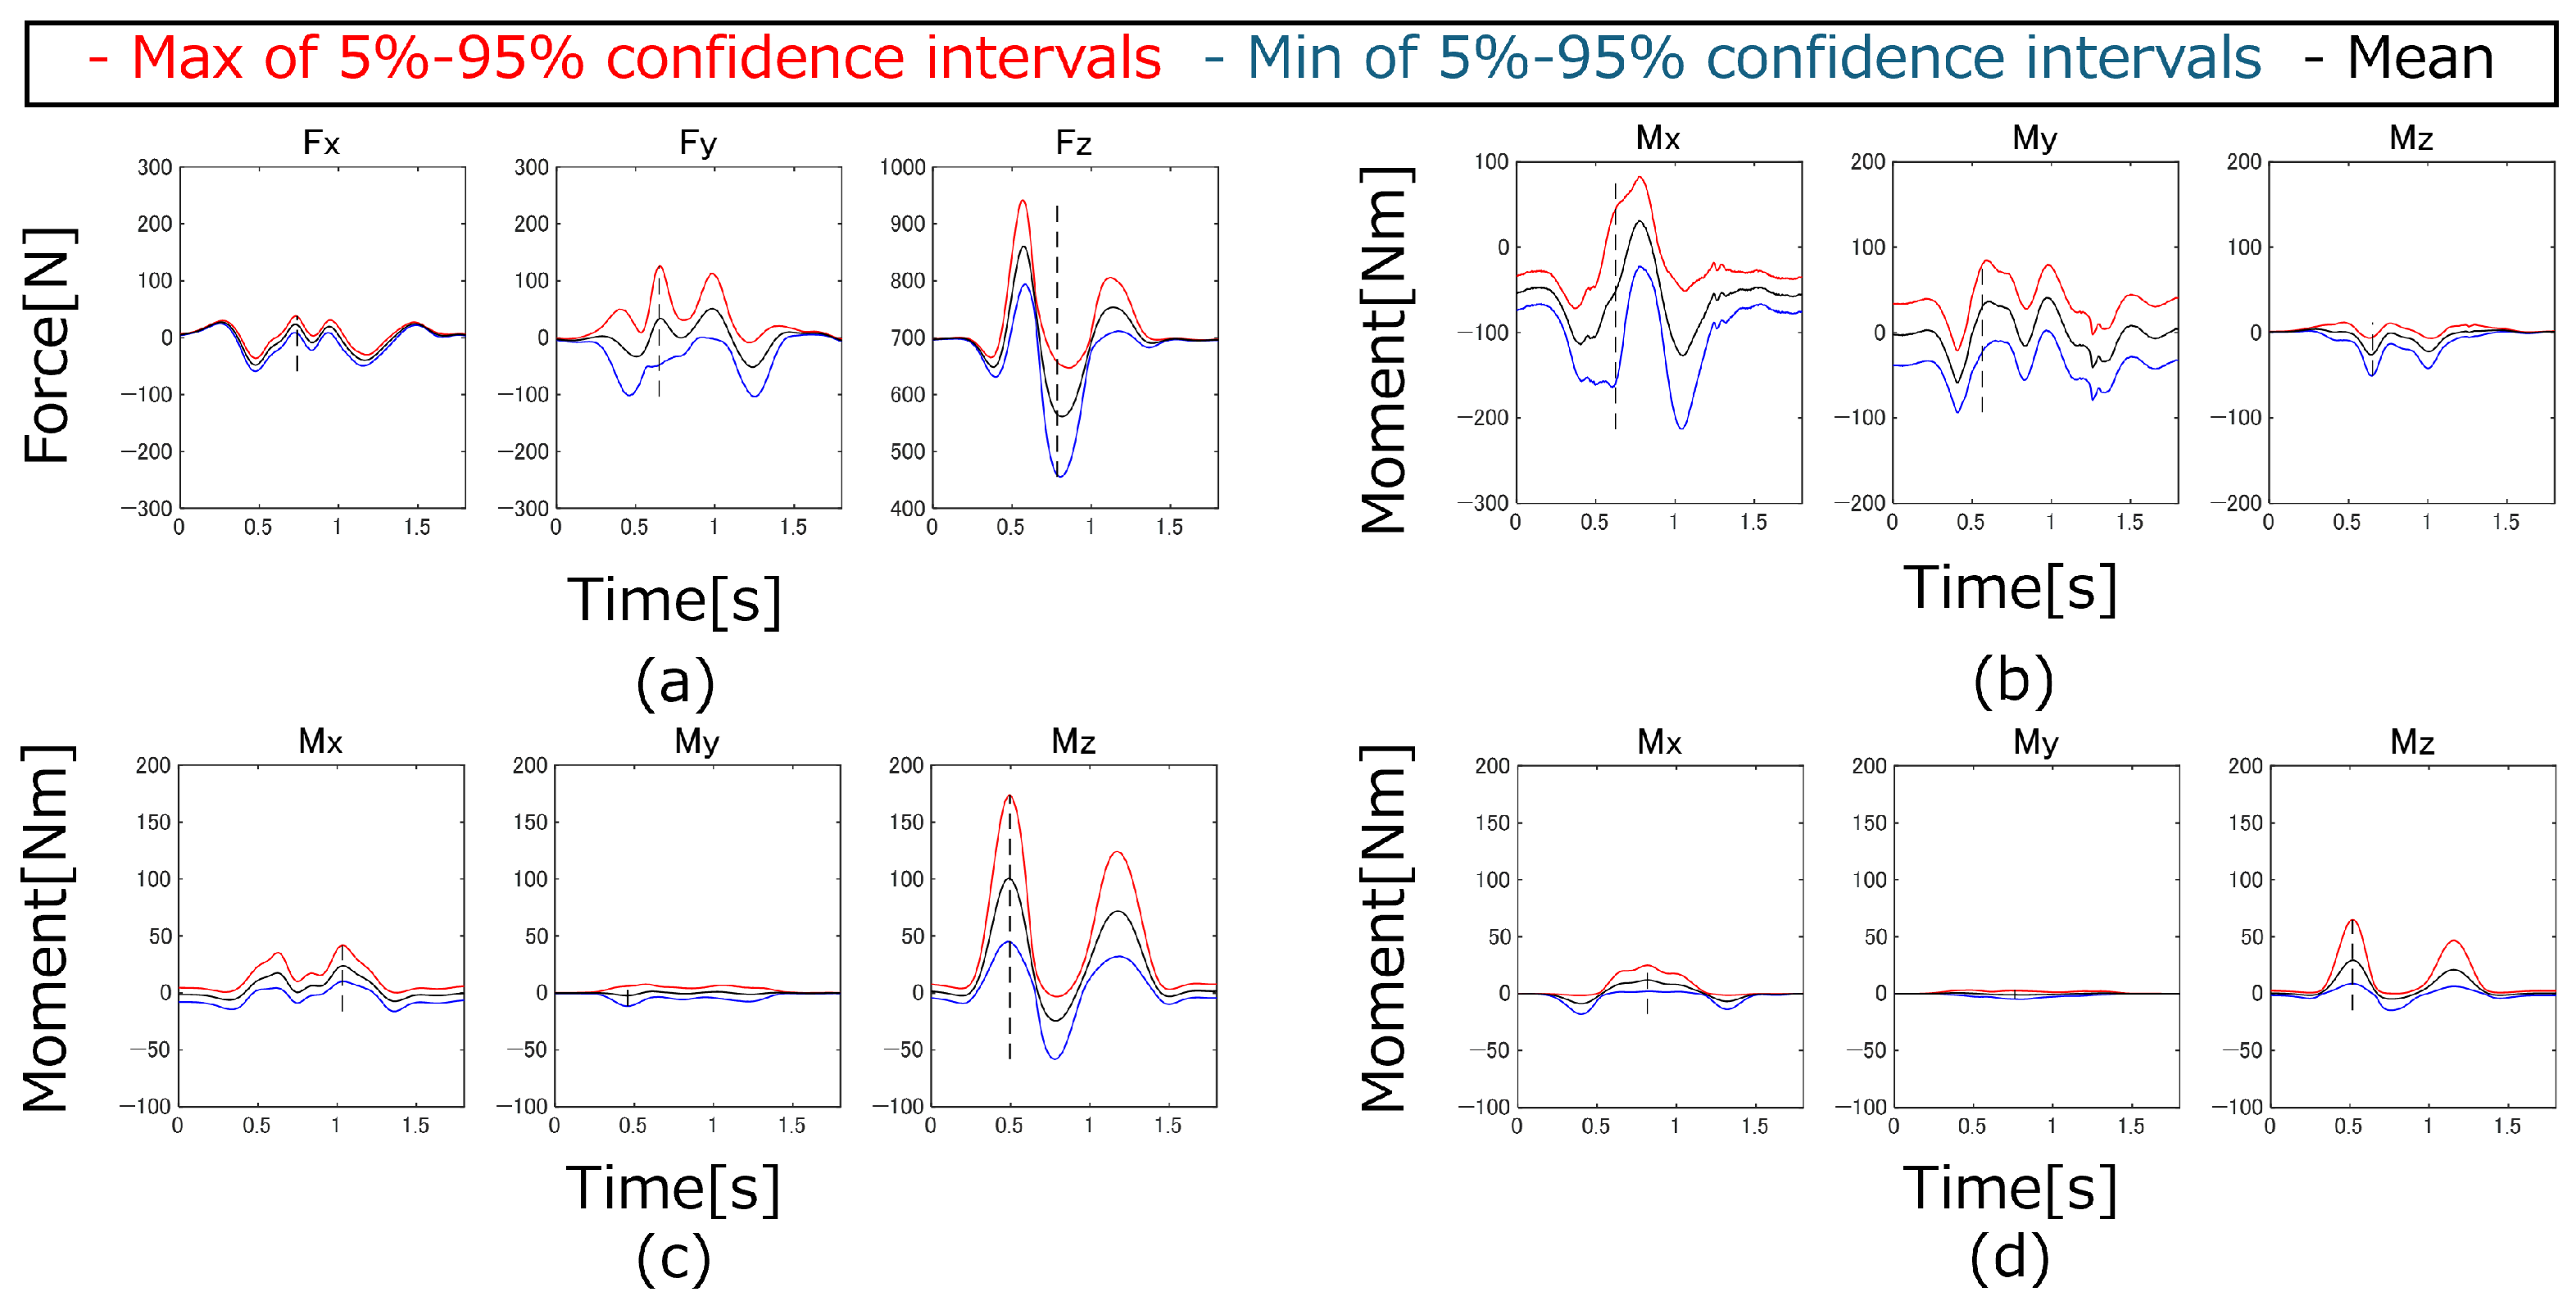
Figure 11.
The 5–95% confidence intervals of the GRFs&Ms and joint torques of the running motion: (a) GRFs, (b) GRMs, (c) Right shoulder joint, (d) Right elbow joint, (e) Left shoulder joint, (f) Left elbow joint, (g) Right hip joint, (h) Right knee joint, (i) Left hip joint, (j) Left knee joint.
Figure 11.
The 5–95% confidence intervals of the GRFs&Ms and joint torques of the running motion: (a) GRFs, (b) GRMs, (c) Right shoulder joint, (d) Right elbow joint, (e) Left shoulder joint, (f) Left elbow joint, (g) Right hip joint, (h) Right knee joint, (i) Left hip joint, (j) Left knee joint.
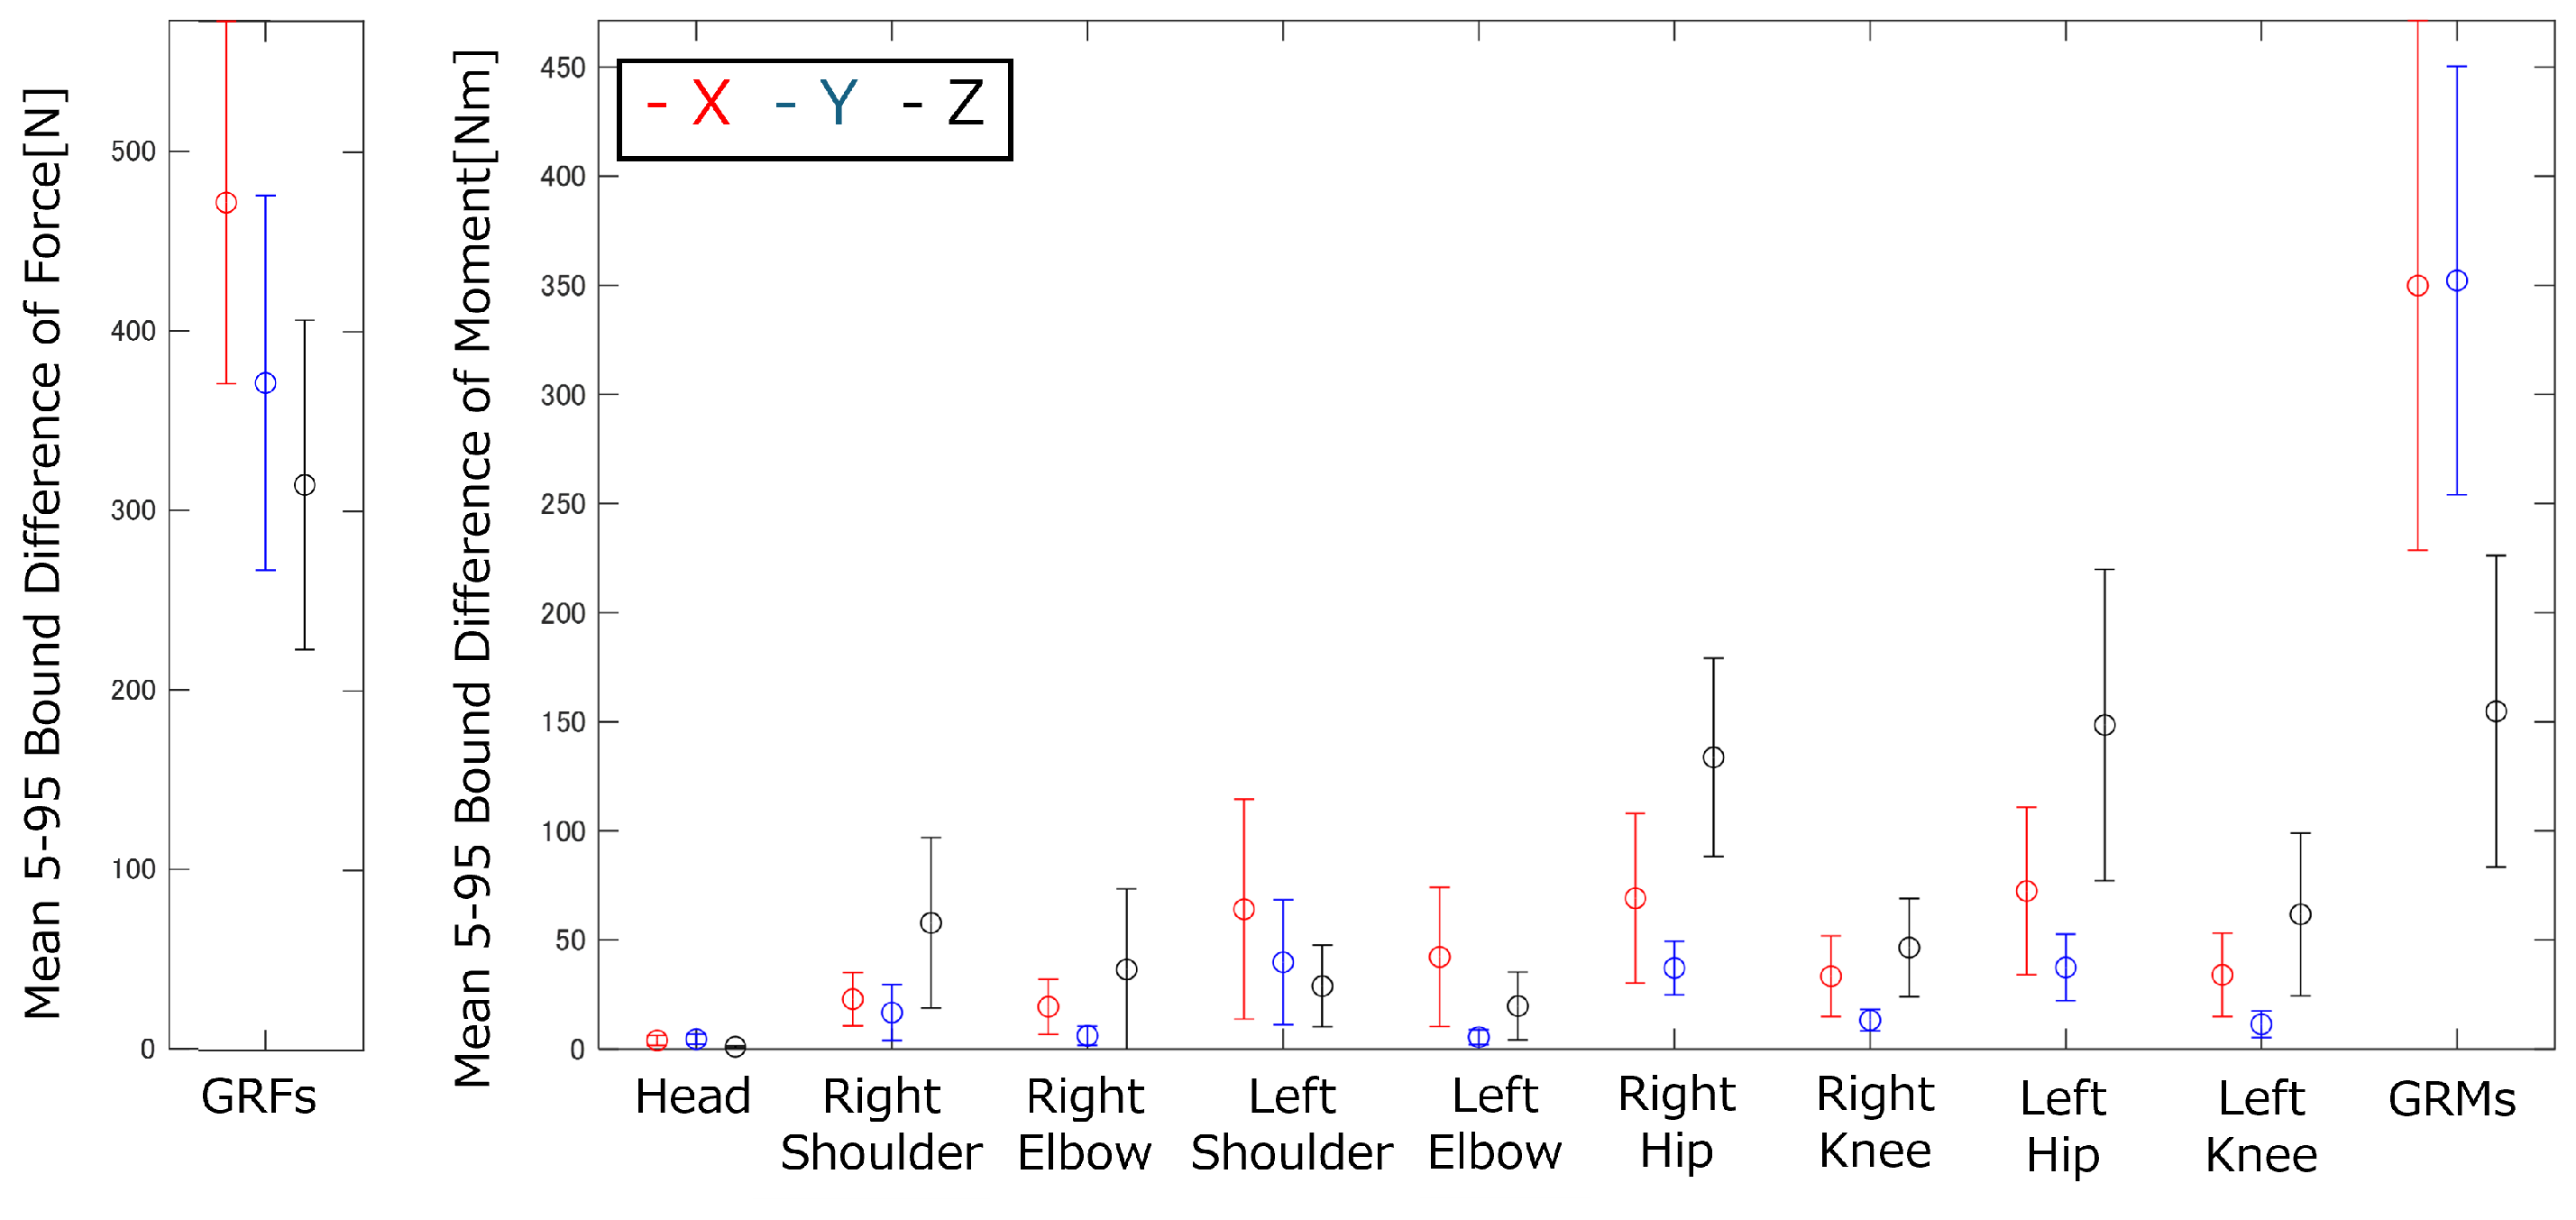
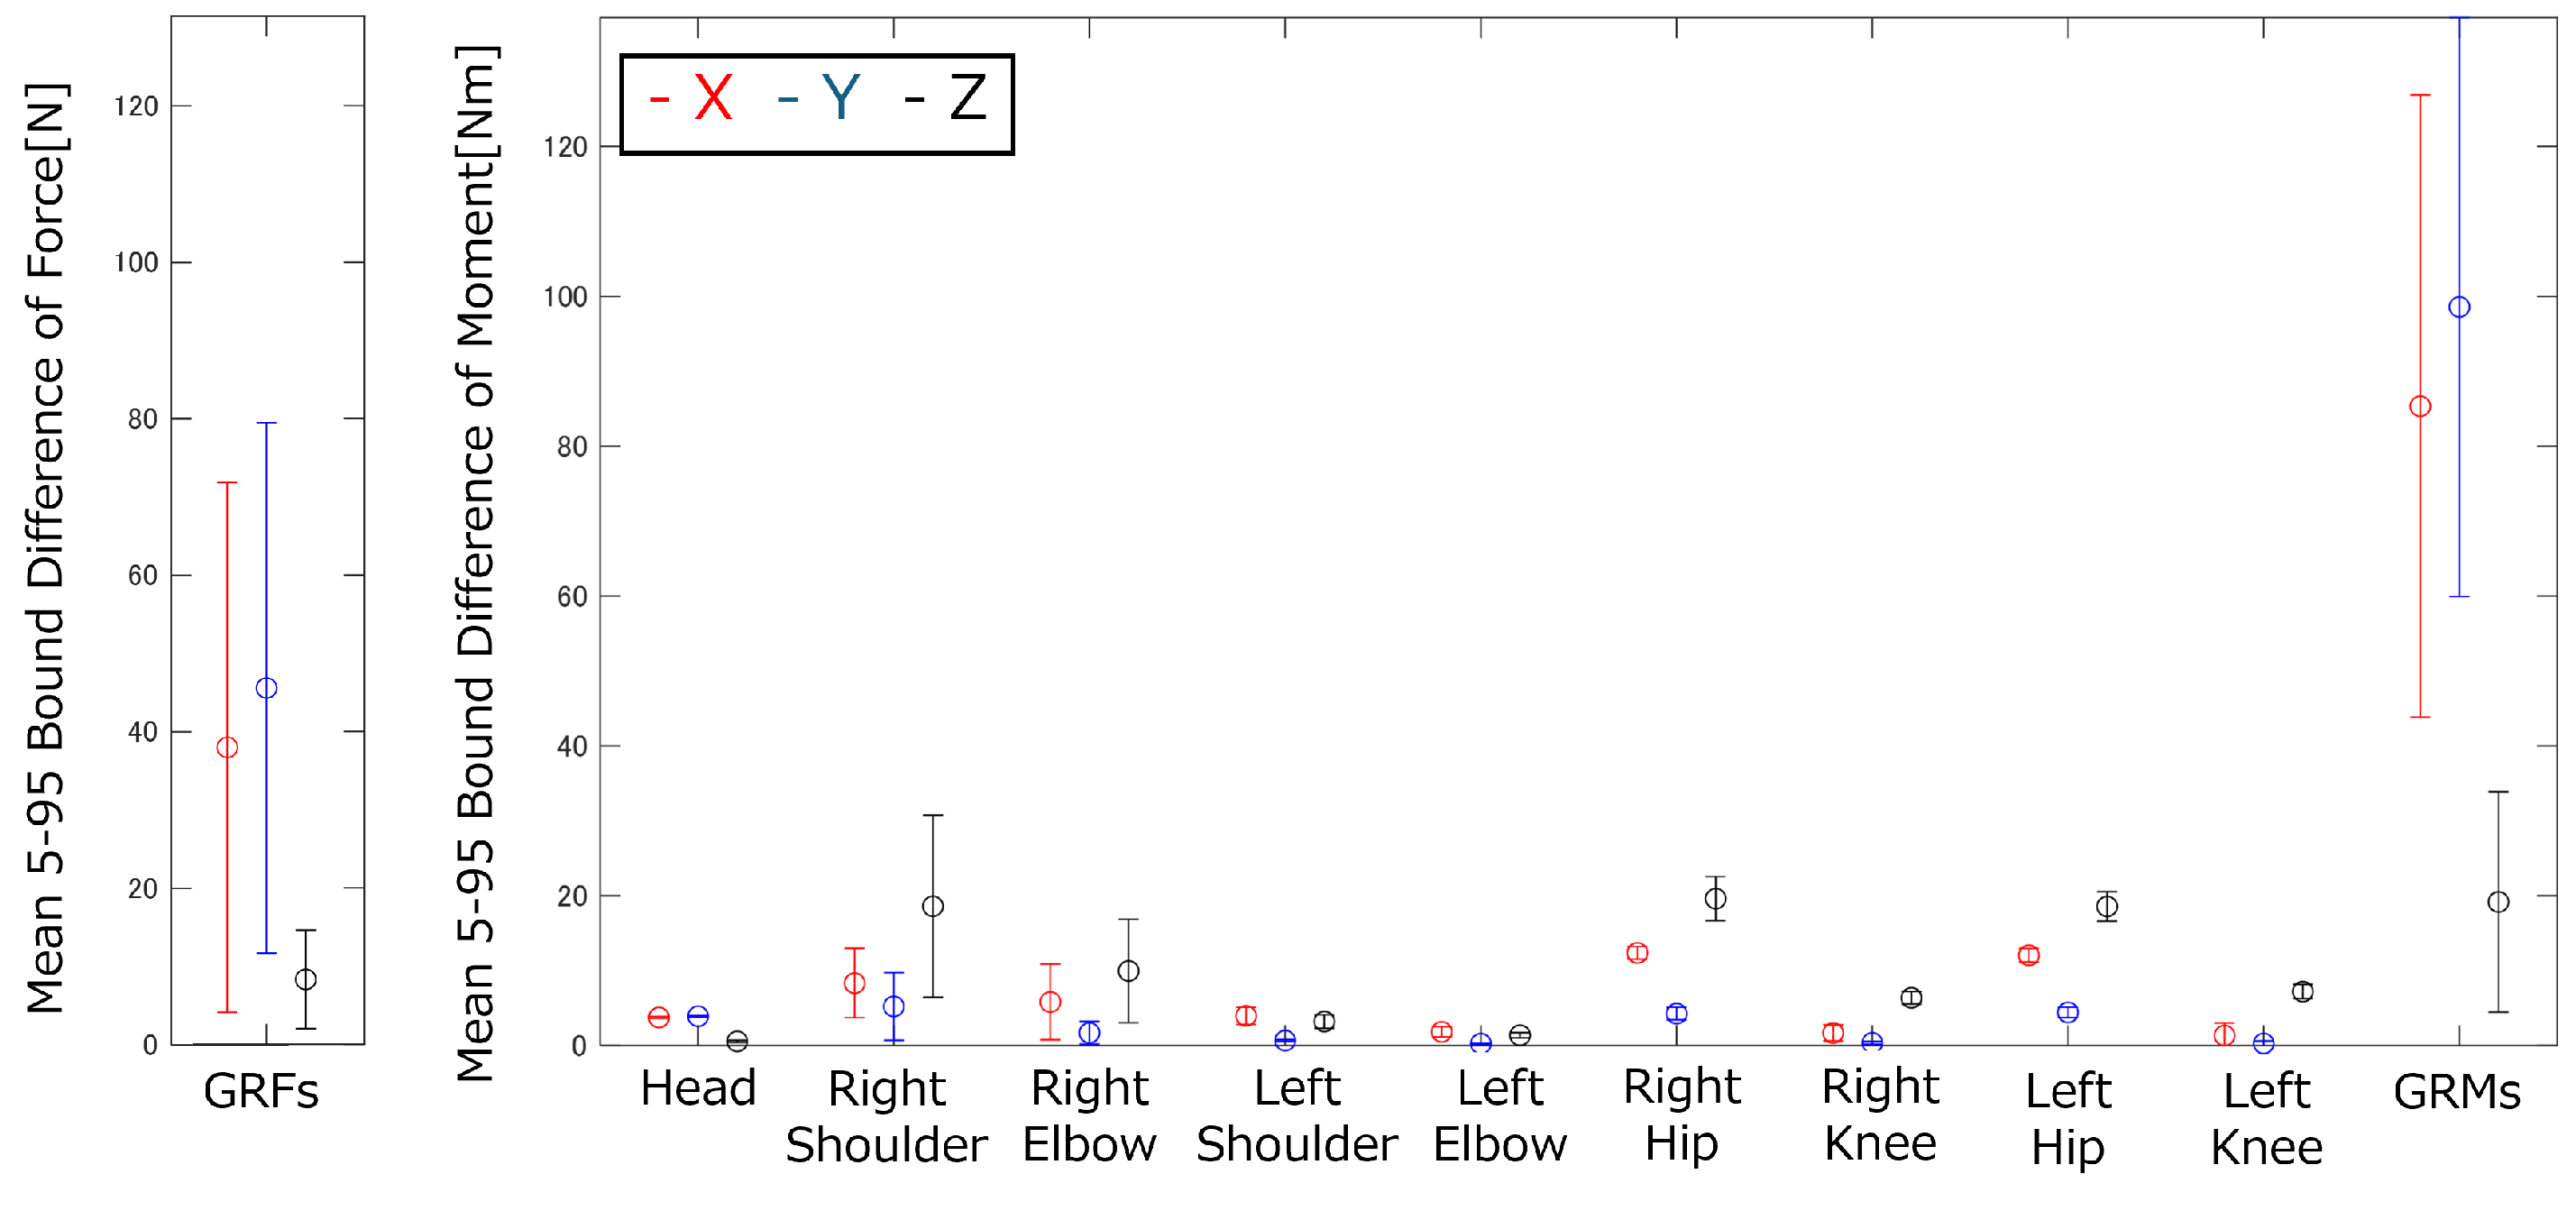
Figure 12.
Means and standard deviations of the widths of the 5–95% confidence intervals for the GRFs&Ms and joint torques of the running motion.
Figure 12.
Means and standard deviations of the widths of the 5–95% confidence intervals for the GRFs&Ms and joint torques of the running motion.
Figure 13.
The 5–95% confidence intervals of the GRFs&Ms and joint torques of the side-cutting motion: (a) GRFs, (b) GRMs, (c) Right hip joint, (d) Right knee joint, (e) Left hip joint, (f) Left knee joint.
Figure 13.
The 5–95% confidence intervals of the GRFs&Ms and joint torques of the side-cutting motion: (a) GRFs, (b) GRMs, (c) Right hip joint, (d) Right knee joint, (e) Left hip joint, (f) Left knee joint.
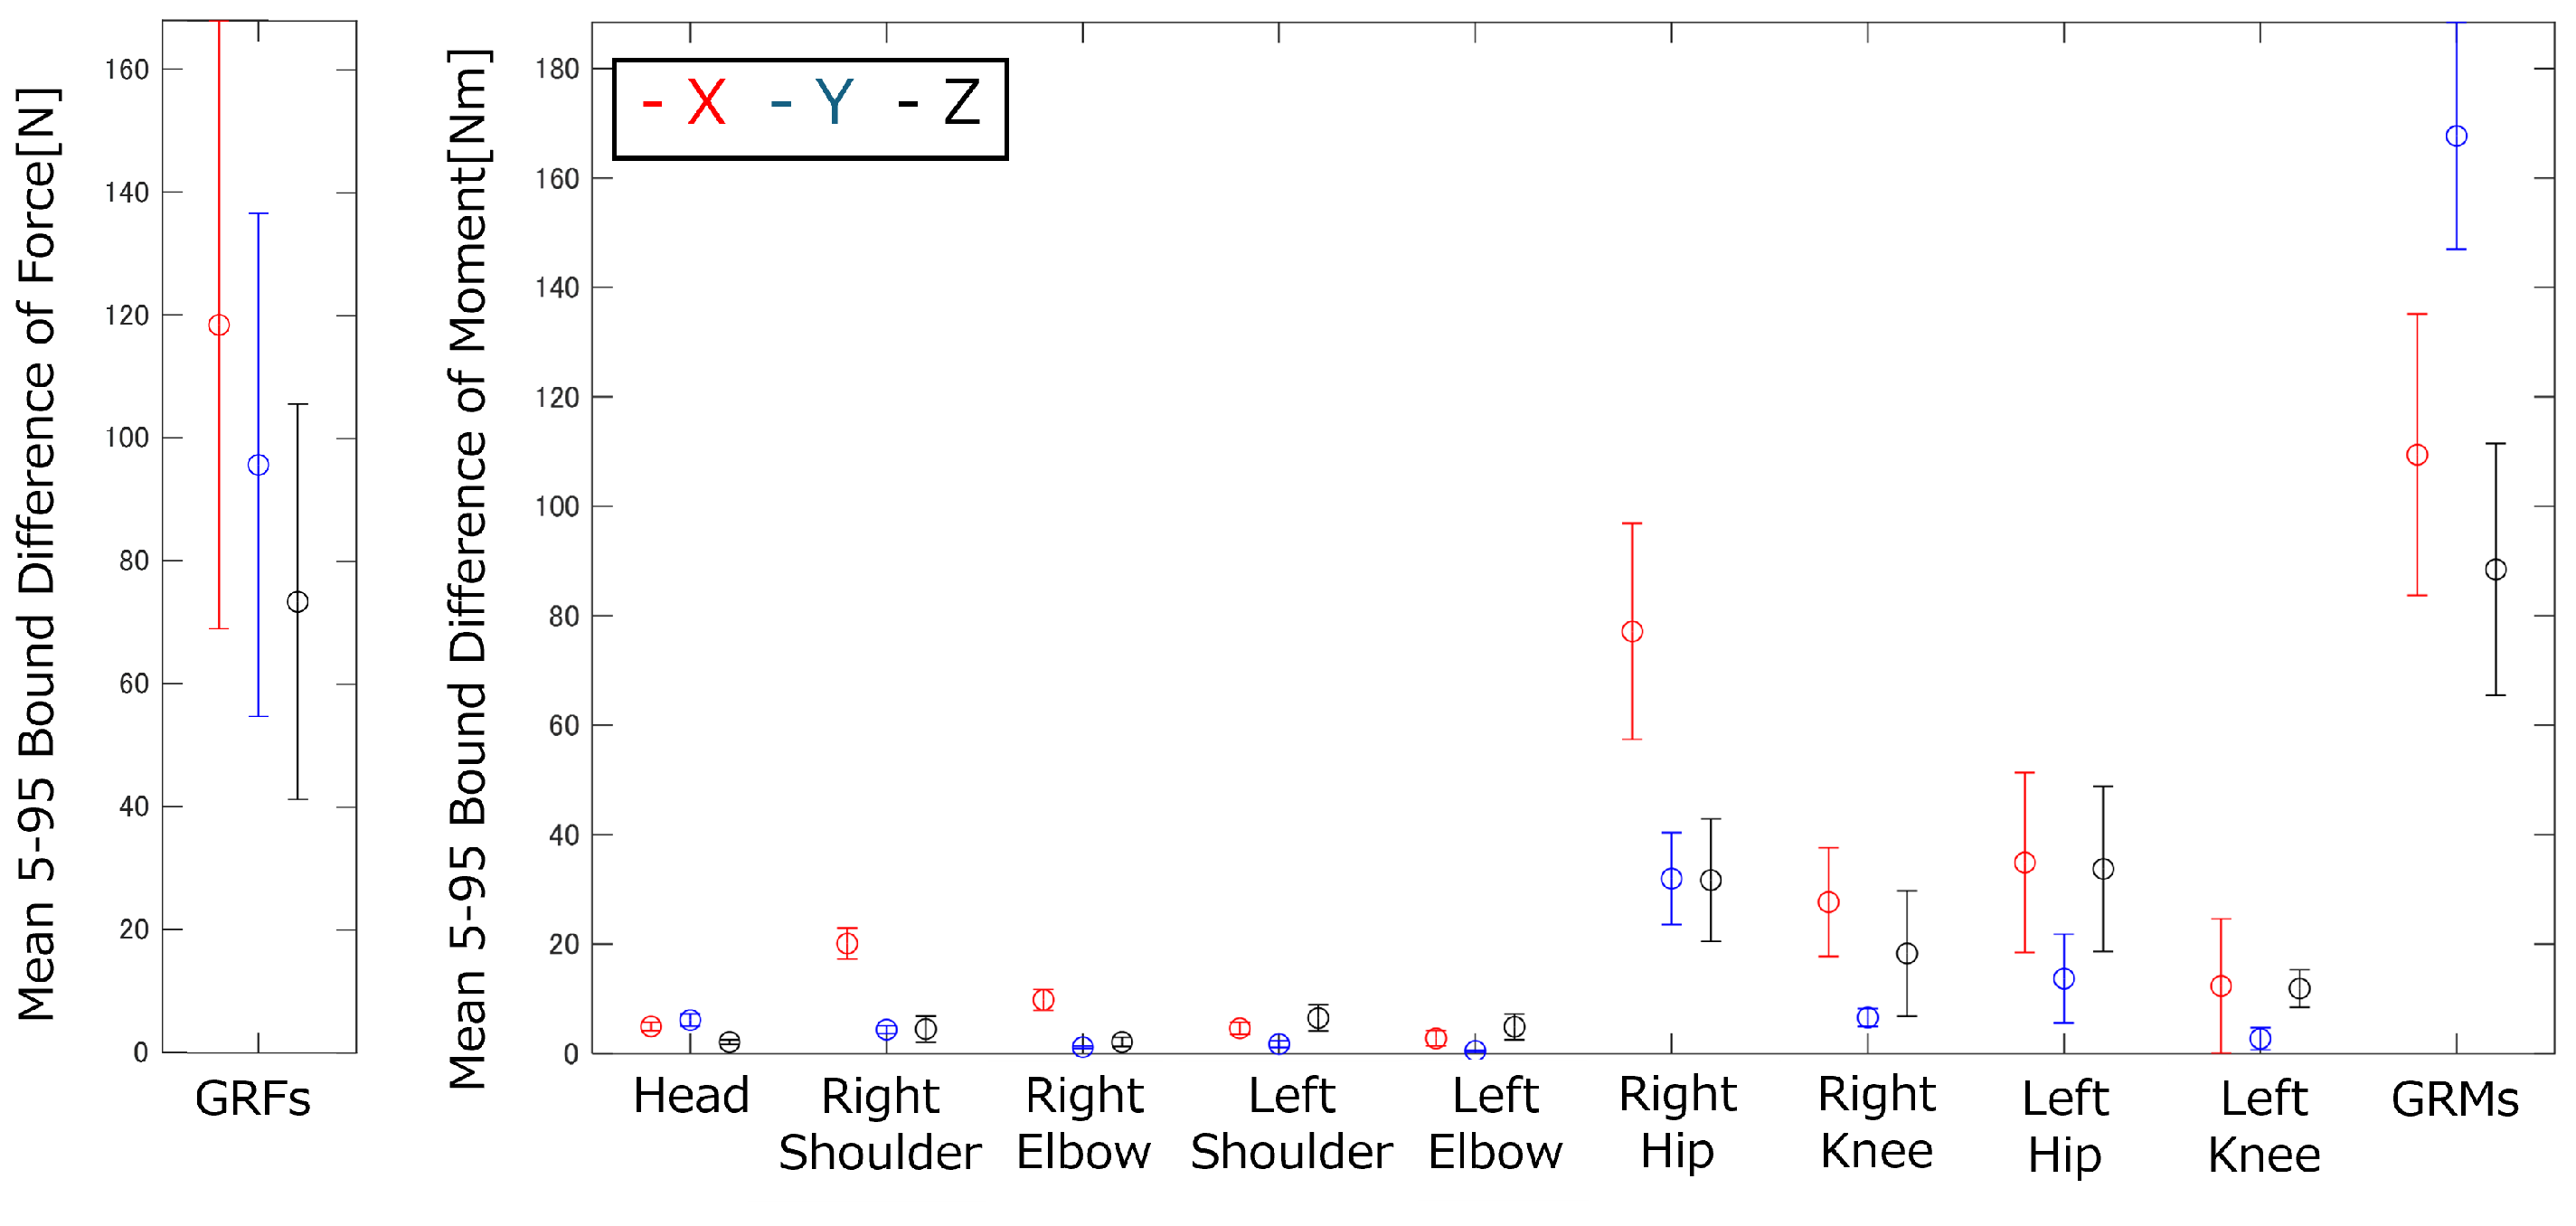
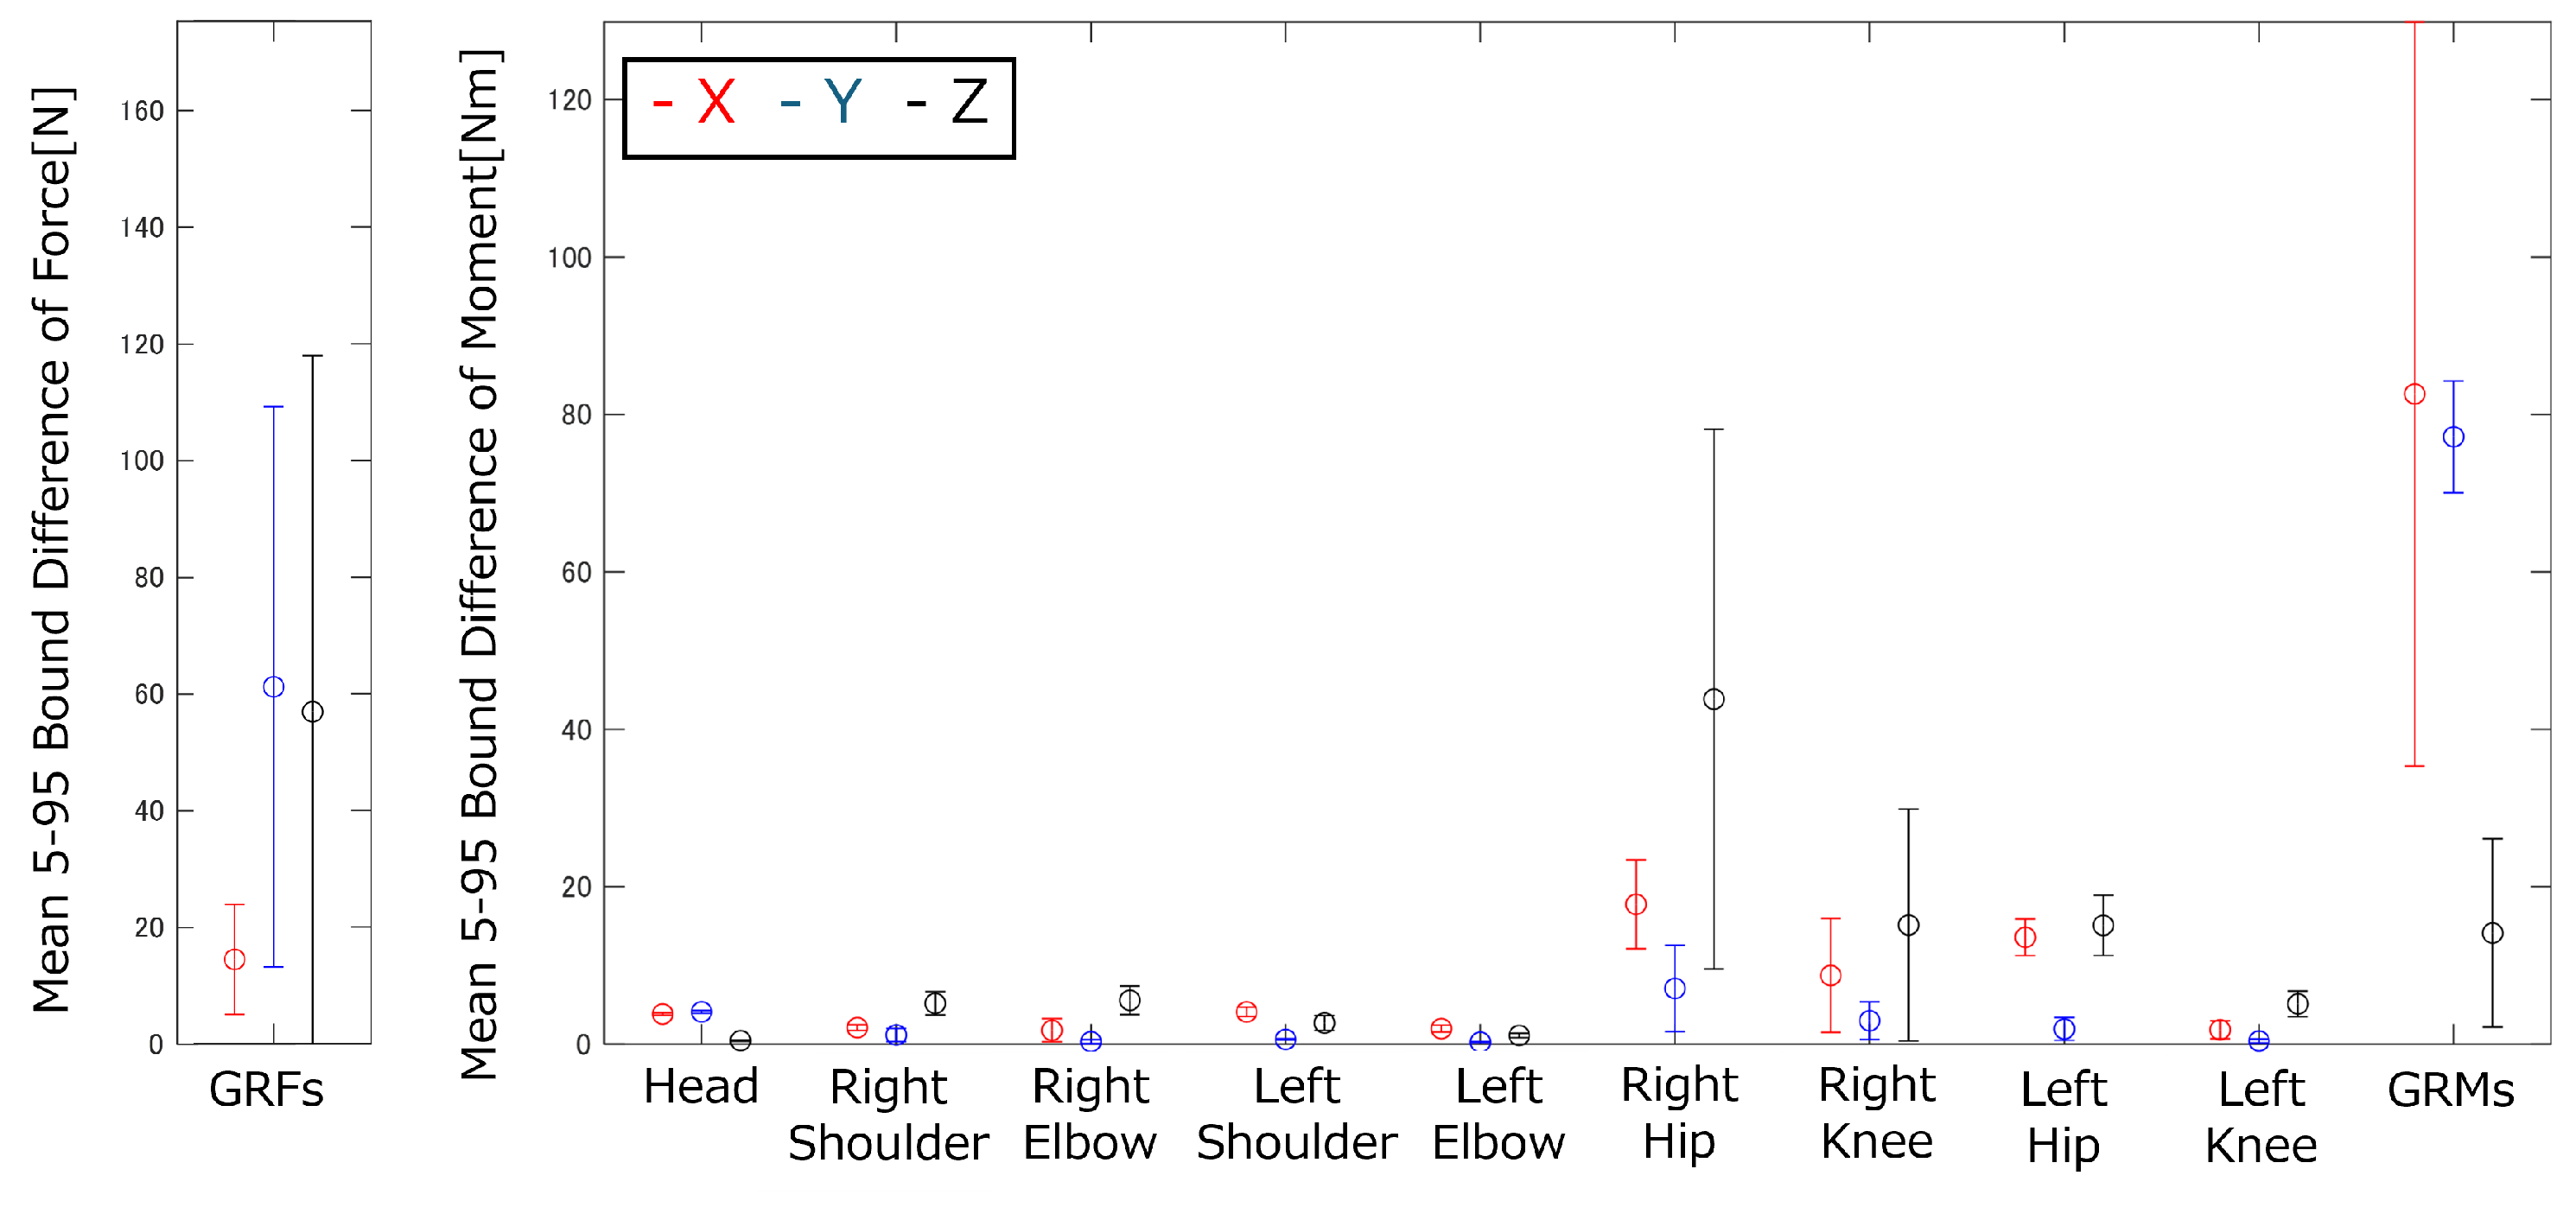
Figure 14.
Means and standard deviations of the widths of the 5–95% confidence intervals for the GRFs&Ms and joint torques of the side-cutting motion.
Figure 14.
Means and standard deviations of the widths of the 5–95% confidence intervals for the GRFs&Ms and joint torques of the side-cutting motion.
Figure 15.
The 5–95% confidence intervals of the GRFs&Ms and joint torques of the vertical jump motion: (a) GRFs, (b) GRMs, (c) Right hip joint, (d) Right knee joint, (e) Left hip joint, (f) Left knee joint.
Figure 15.
The 5–95% confidence intervals of the GRFs&Ms and joint torques of the vertical jump motion: (a) GRFs, (b) GRMs, (c) Right hip joint, (d) Right knee joint, (e) Left hip joint, (f) Left knee joint.
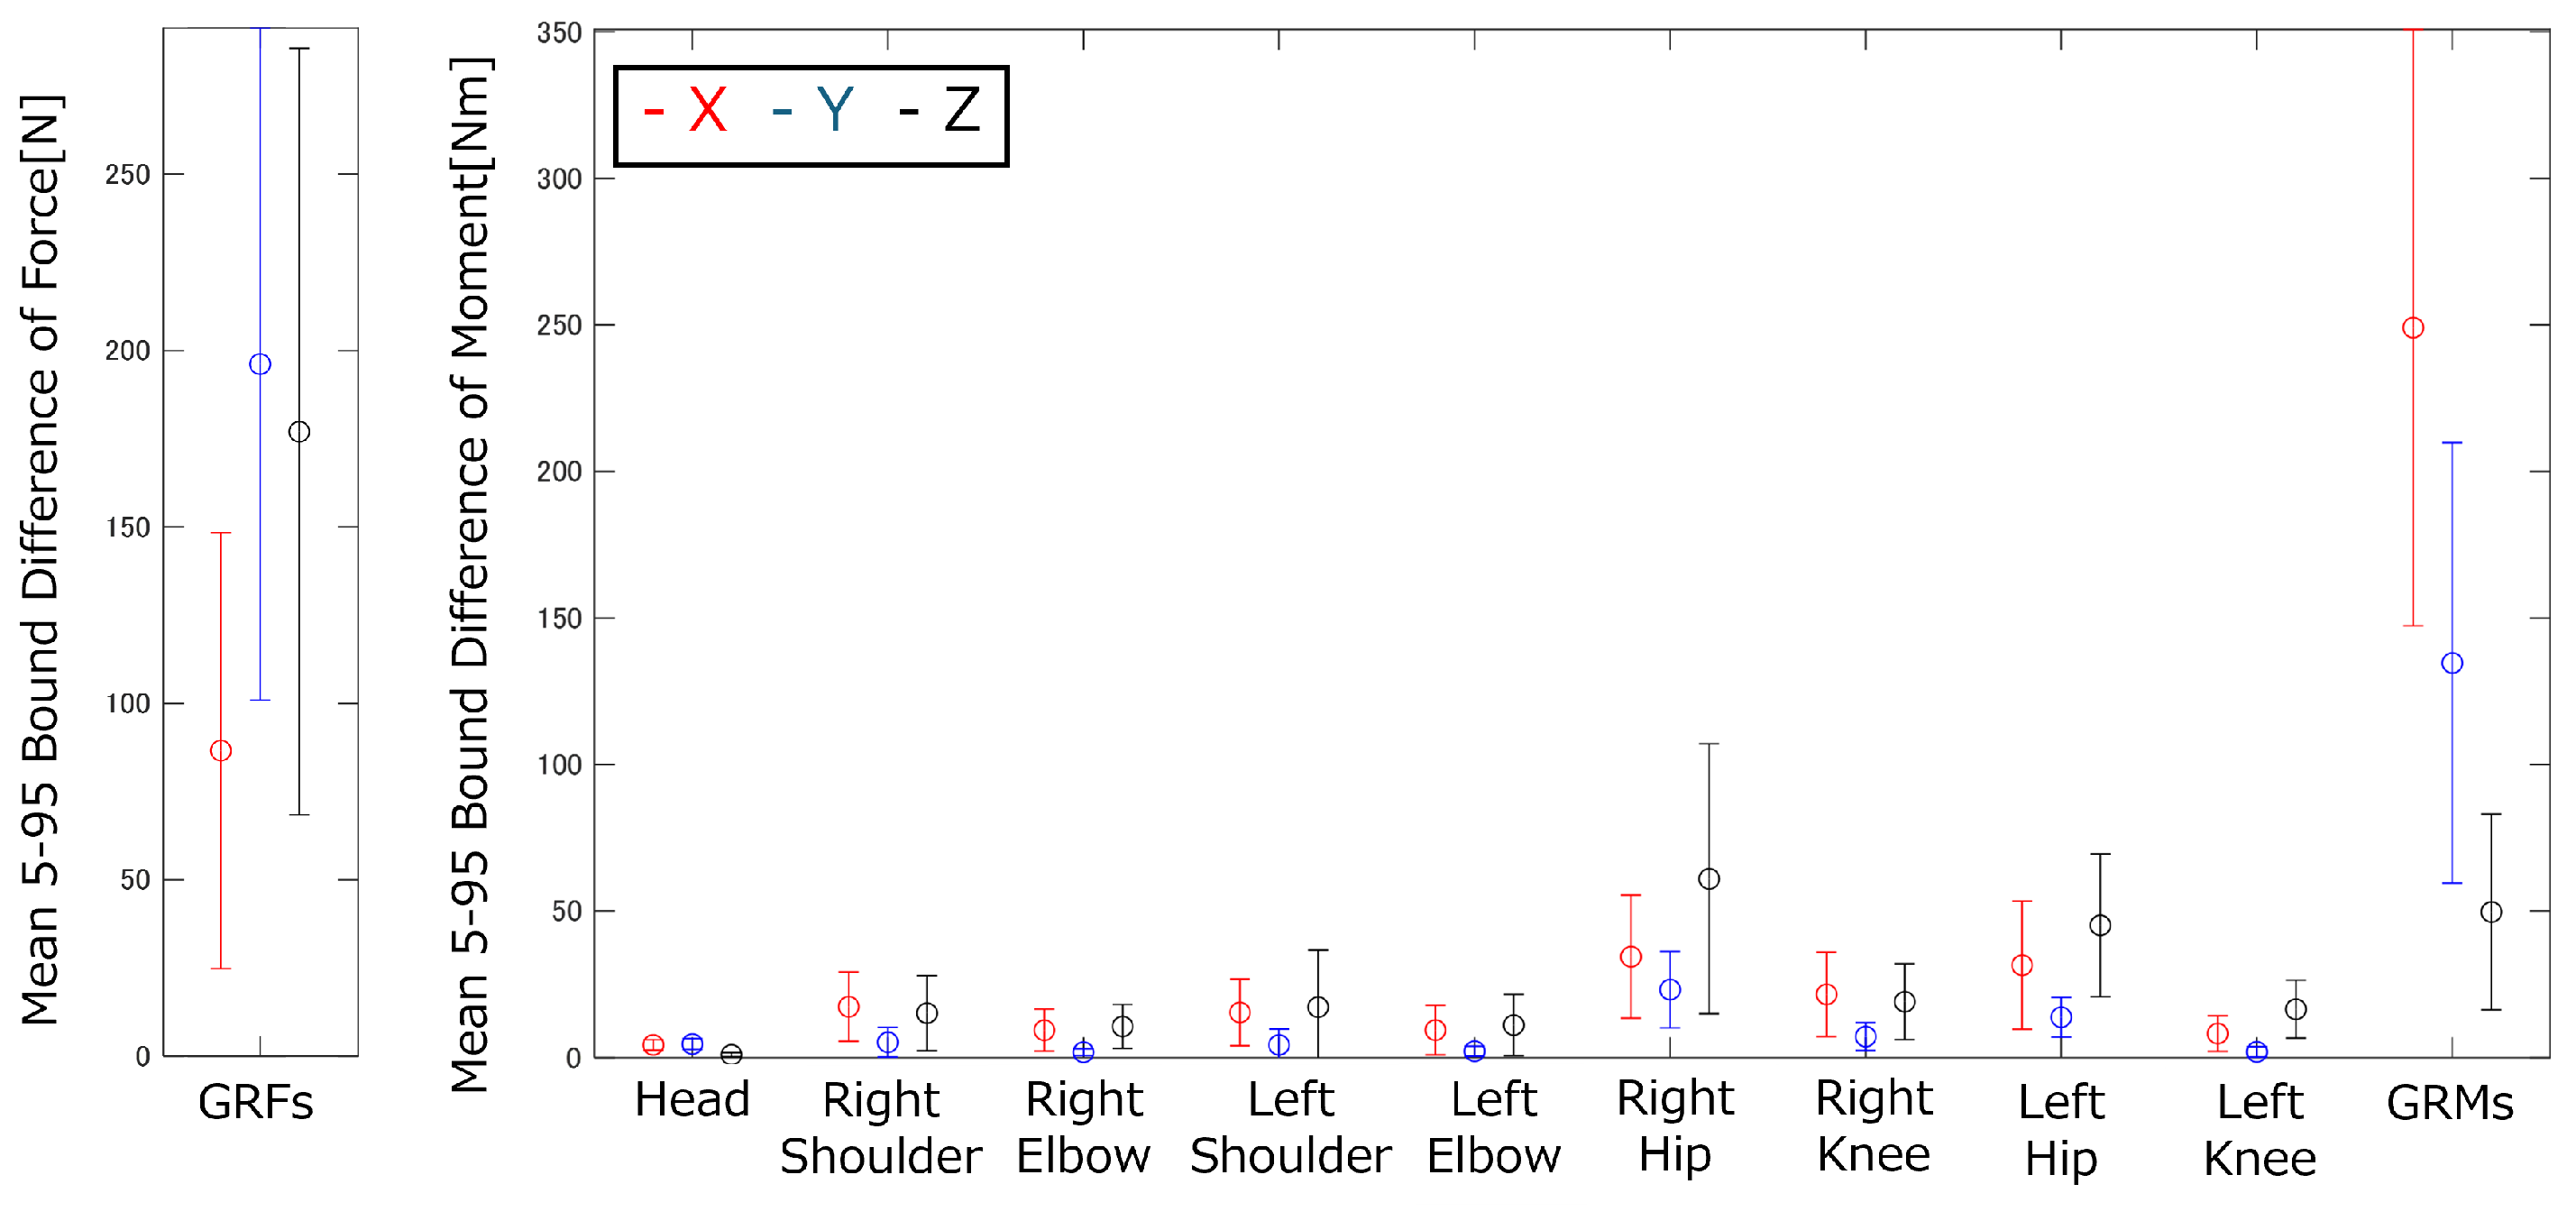
Figure 16.
Means and standard deviations of the widths of the 5–95% confidence intervals for the GRFs&Ms and joint torques of the vertical jump motion.
Figure 16.
Means and standard deviations of the widths of the 5–95% confidence intervals for the GRFs&Ms and joint torques of the vertical jump motion.
Figure 17.
The 5–95% confidence intervals of the GRFs&Ms and joint torques of the arm swing motion: (a) GRFs, (b) GRMs, (c) Right shoulder joint, (d) Right elbow joint.
Figure 17.
The 5–95% confidence intervals of the GRFs&Ms and joint torques of the arm swing motion: (a) GRFs, (b) GRMs, (c) Right shoulder joint, (d) Right elbow joint.
Figure 18.
Means and standard deviations of the widths of the 5–95% confidence intervals for the GRFs&Ms and joint torques of the arm swing motion.
Figure 18.
Means and standard deviations of the widths of the 5–95% confidence intervals for the GRFs&Ms and joint torques of the arm swing motion.
Figure 19.
The 5–95% confidence intervals of the GRFs&Ms and joint torques of the leg swing motion: (a) GRFs, (b) GRMs, (c) Right hip joint, (d) Right knee joint.
Figure 19.
The 5–95% confidence intervals of the GRFs&Ms and joint torques of the leg swing motion: (a) GRFs, (b) GRMs, (c) Right hip joint, (d) Right knee joint.
Figure 20.
Means and standard deviations of the widths of the 5–95% confidence intervals for the GRFs&Ms and joint torques of the leg swing motion.
Figure 20.
Means and standard deviations of the widths of the 5–95% confidence intervals for the GRFs&Ms and joint torques of the leg swing motion.
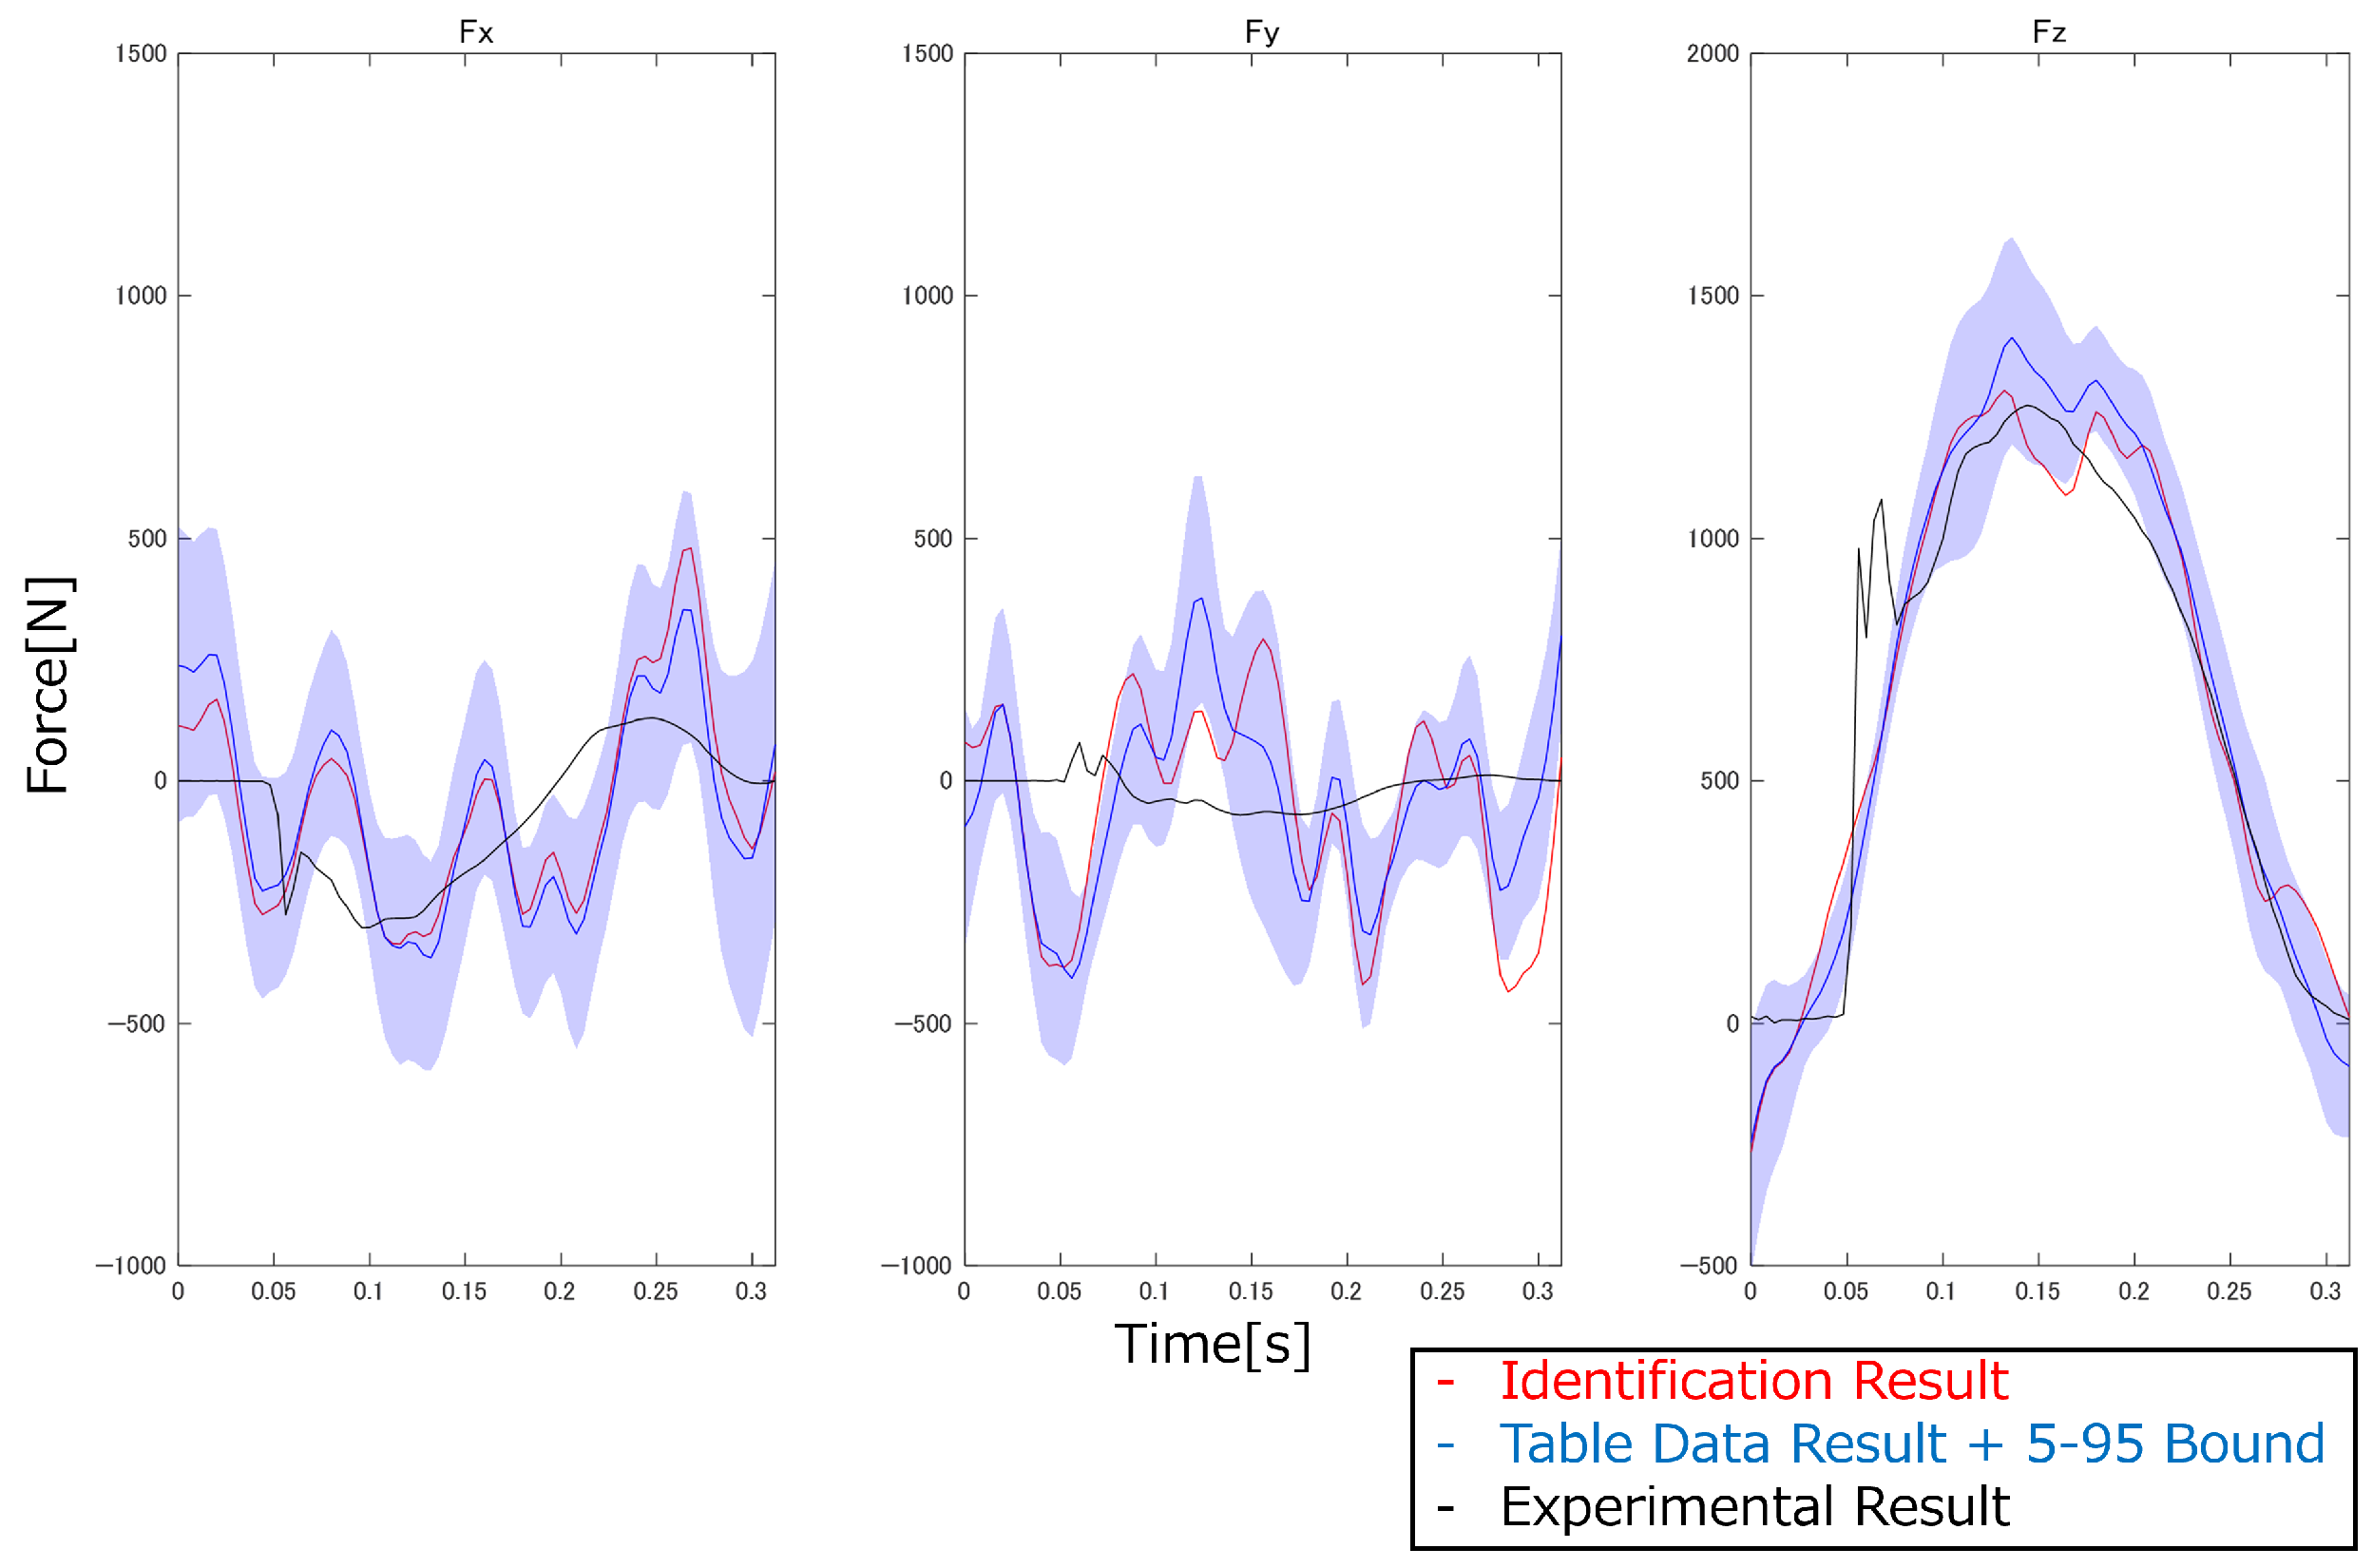
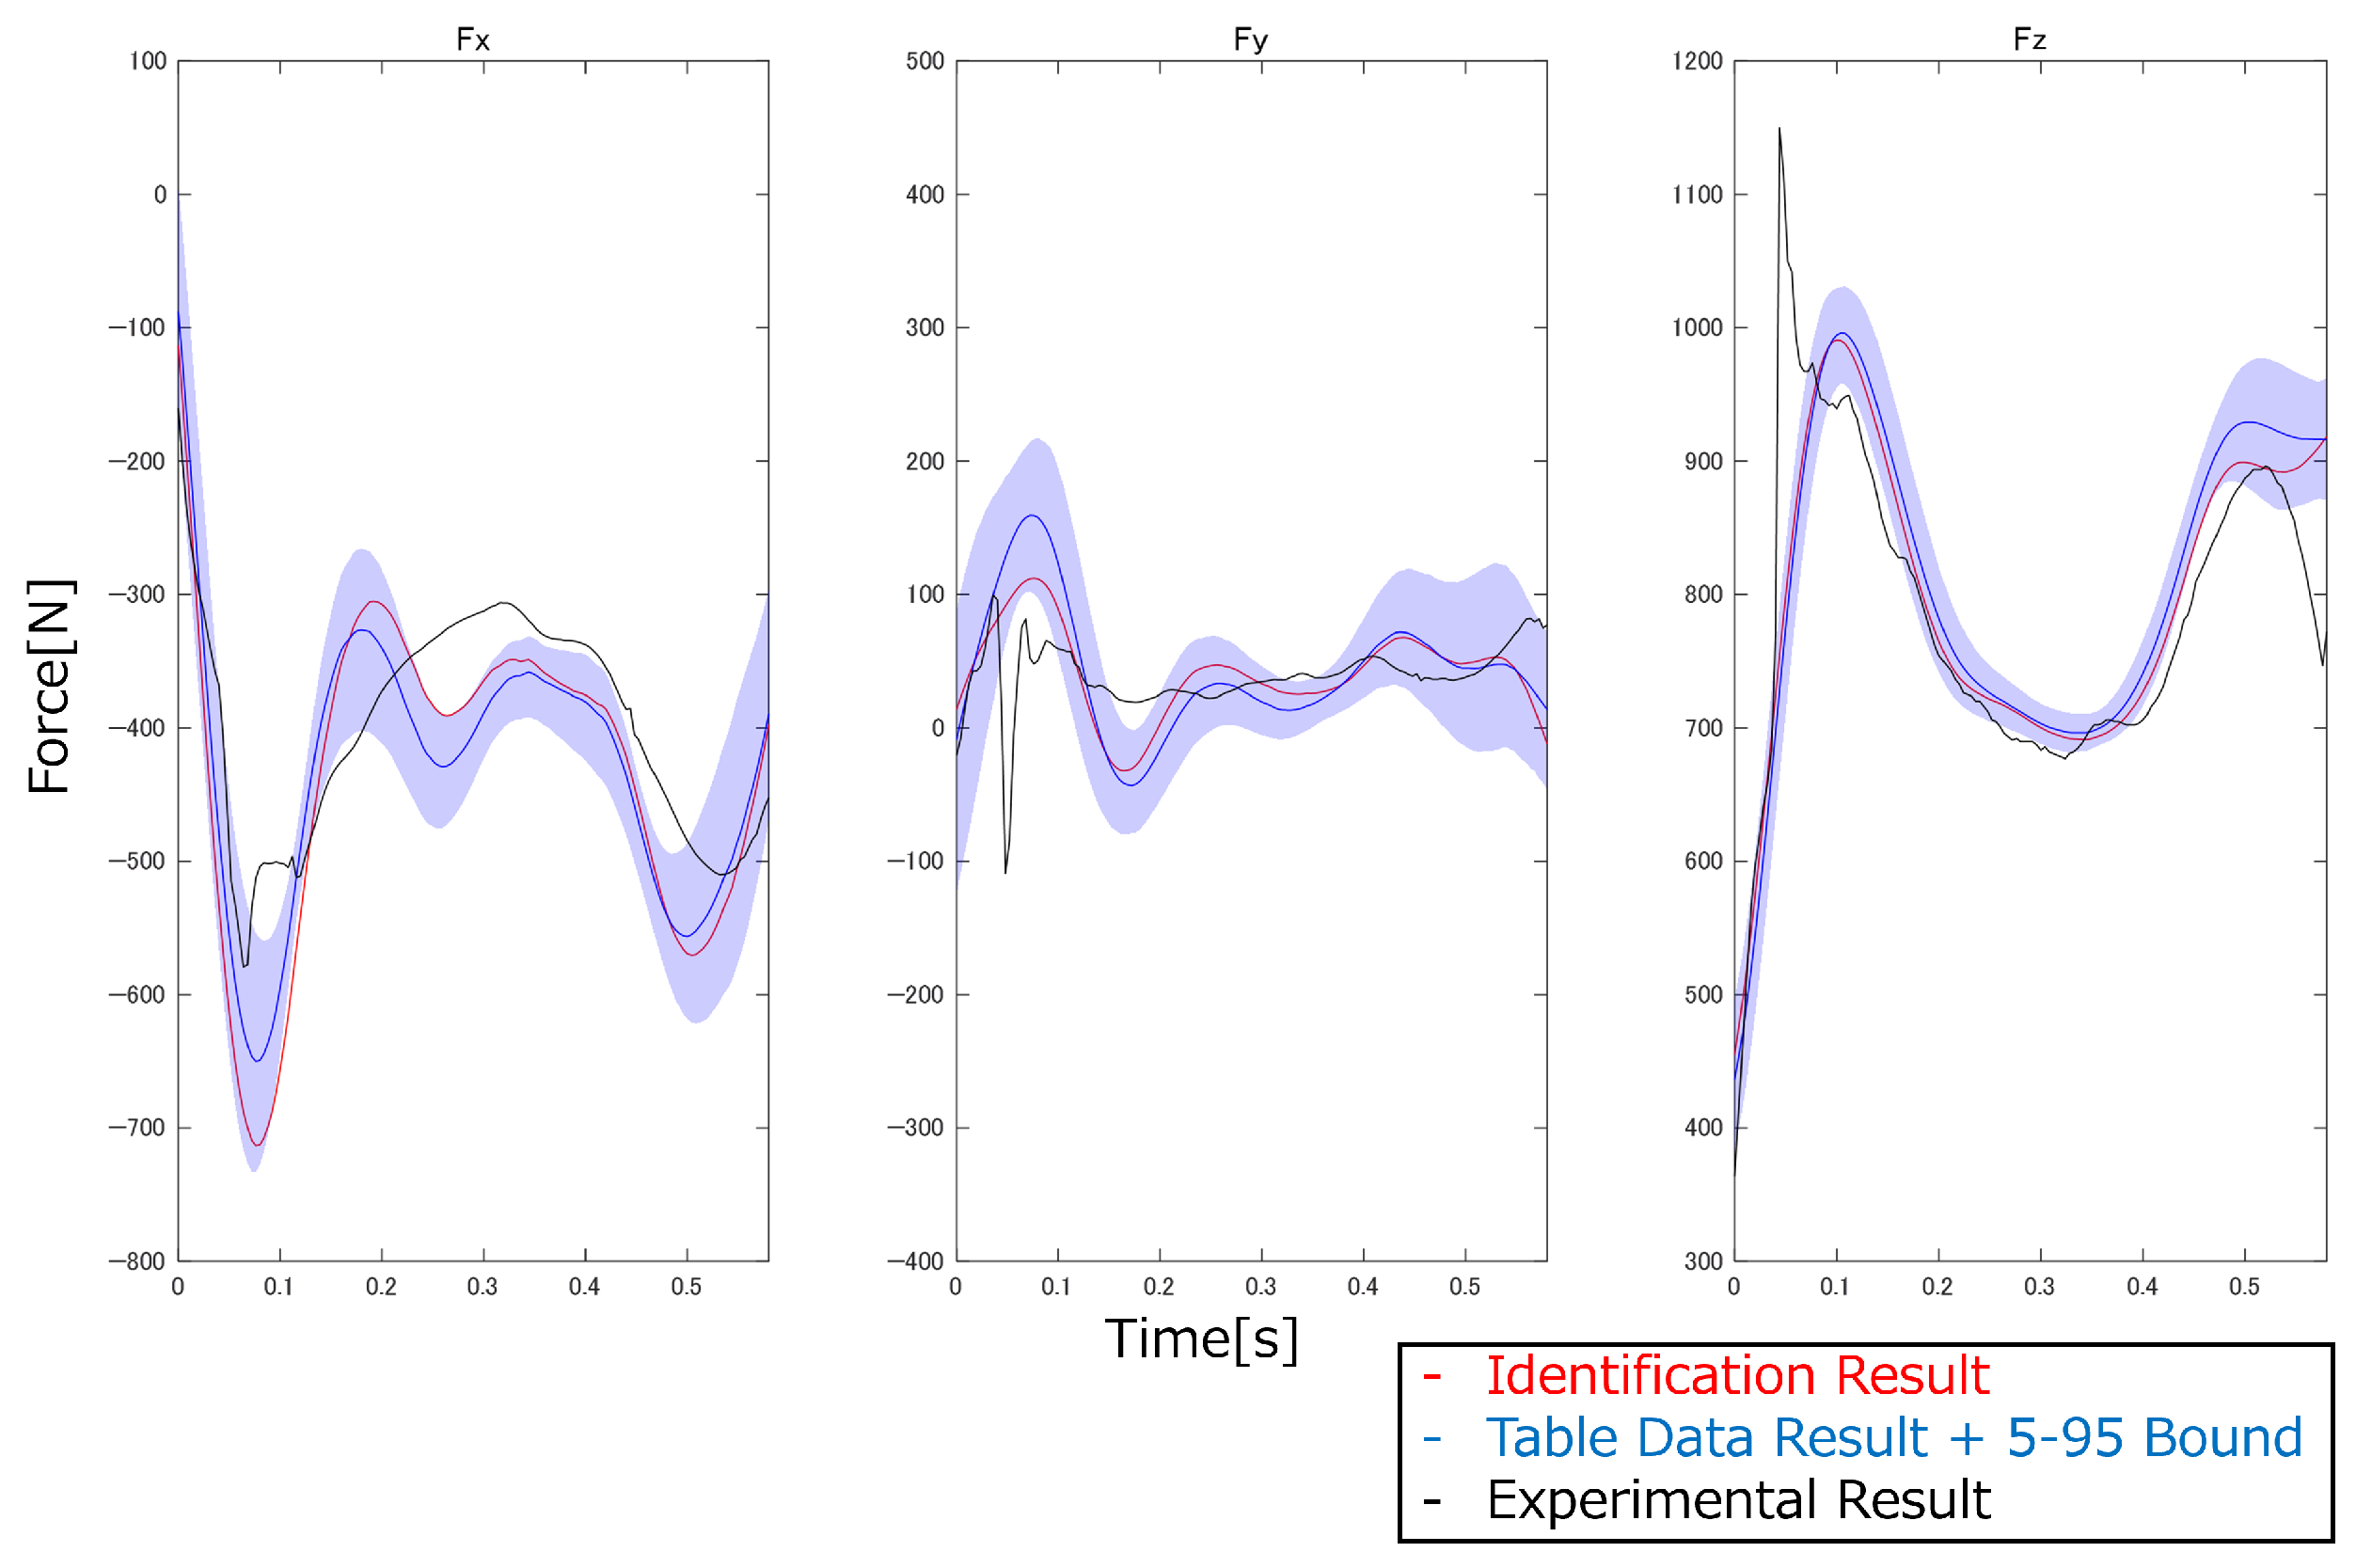
Figure 21.
Comparison of the estimated and experimental ground reaction forces (running).
Figure 21.
Comparison of the estimated and experimental ground reaction forces (running).
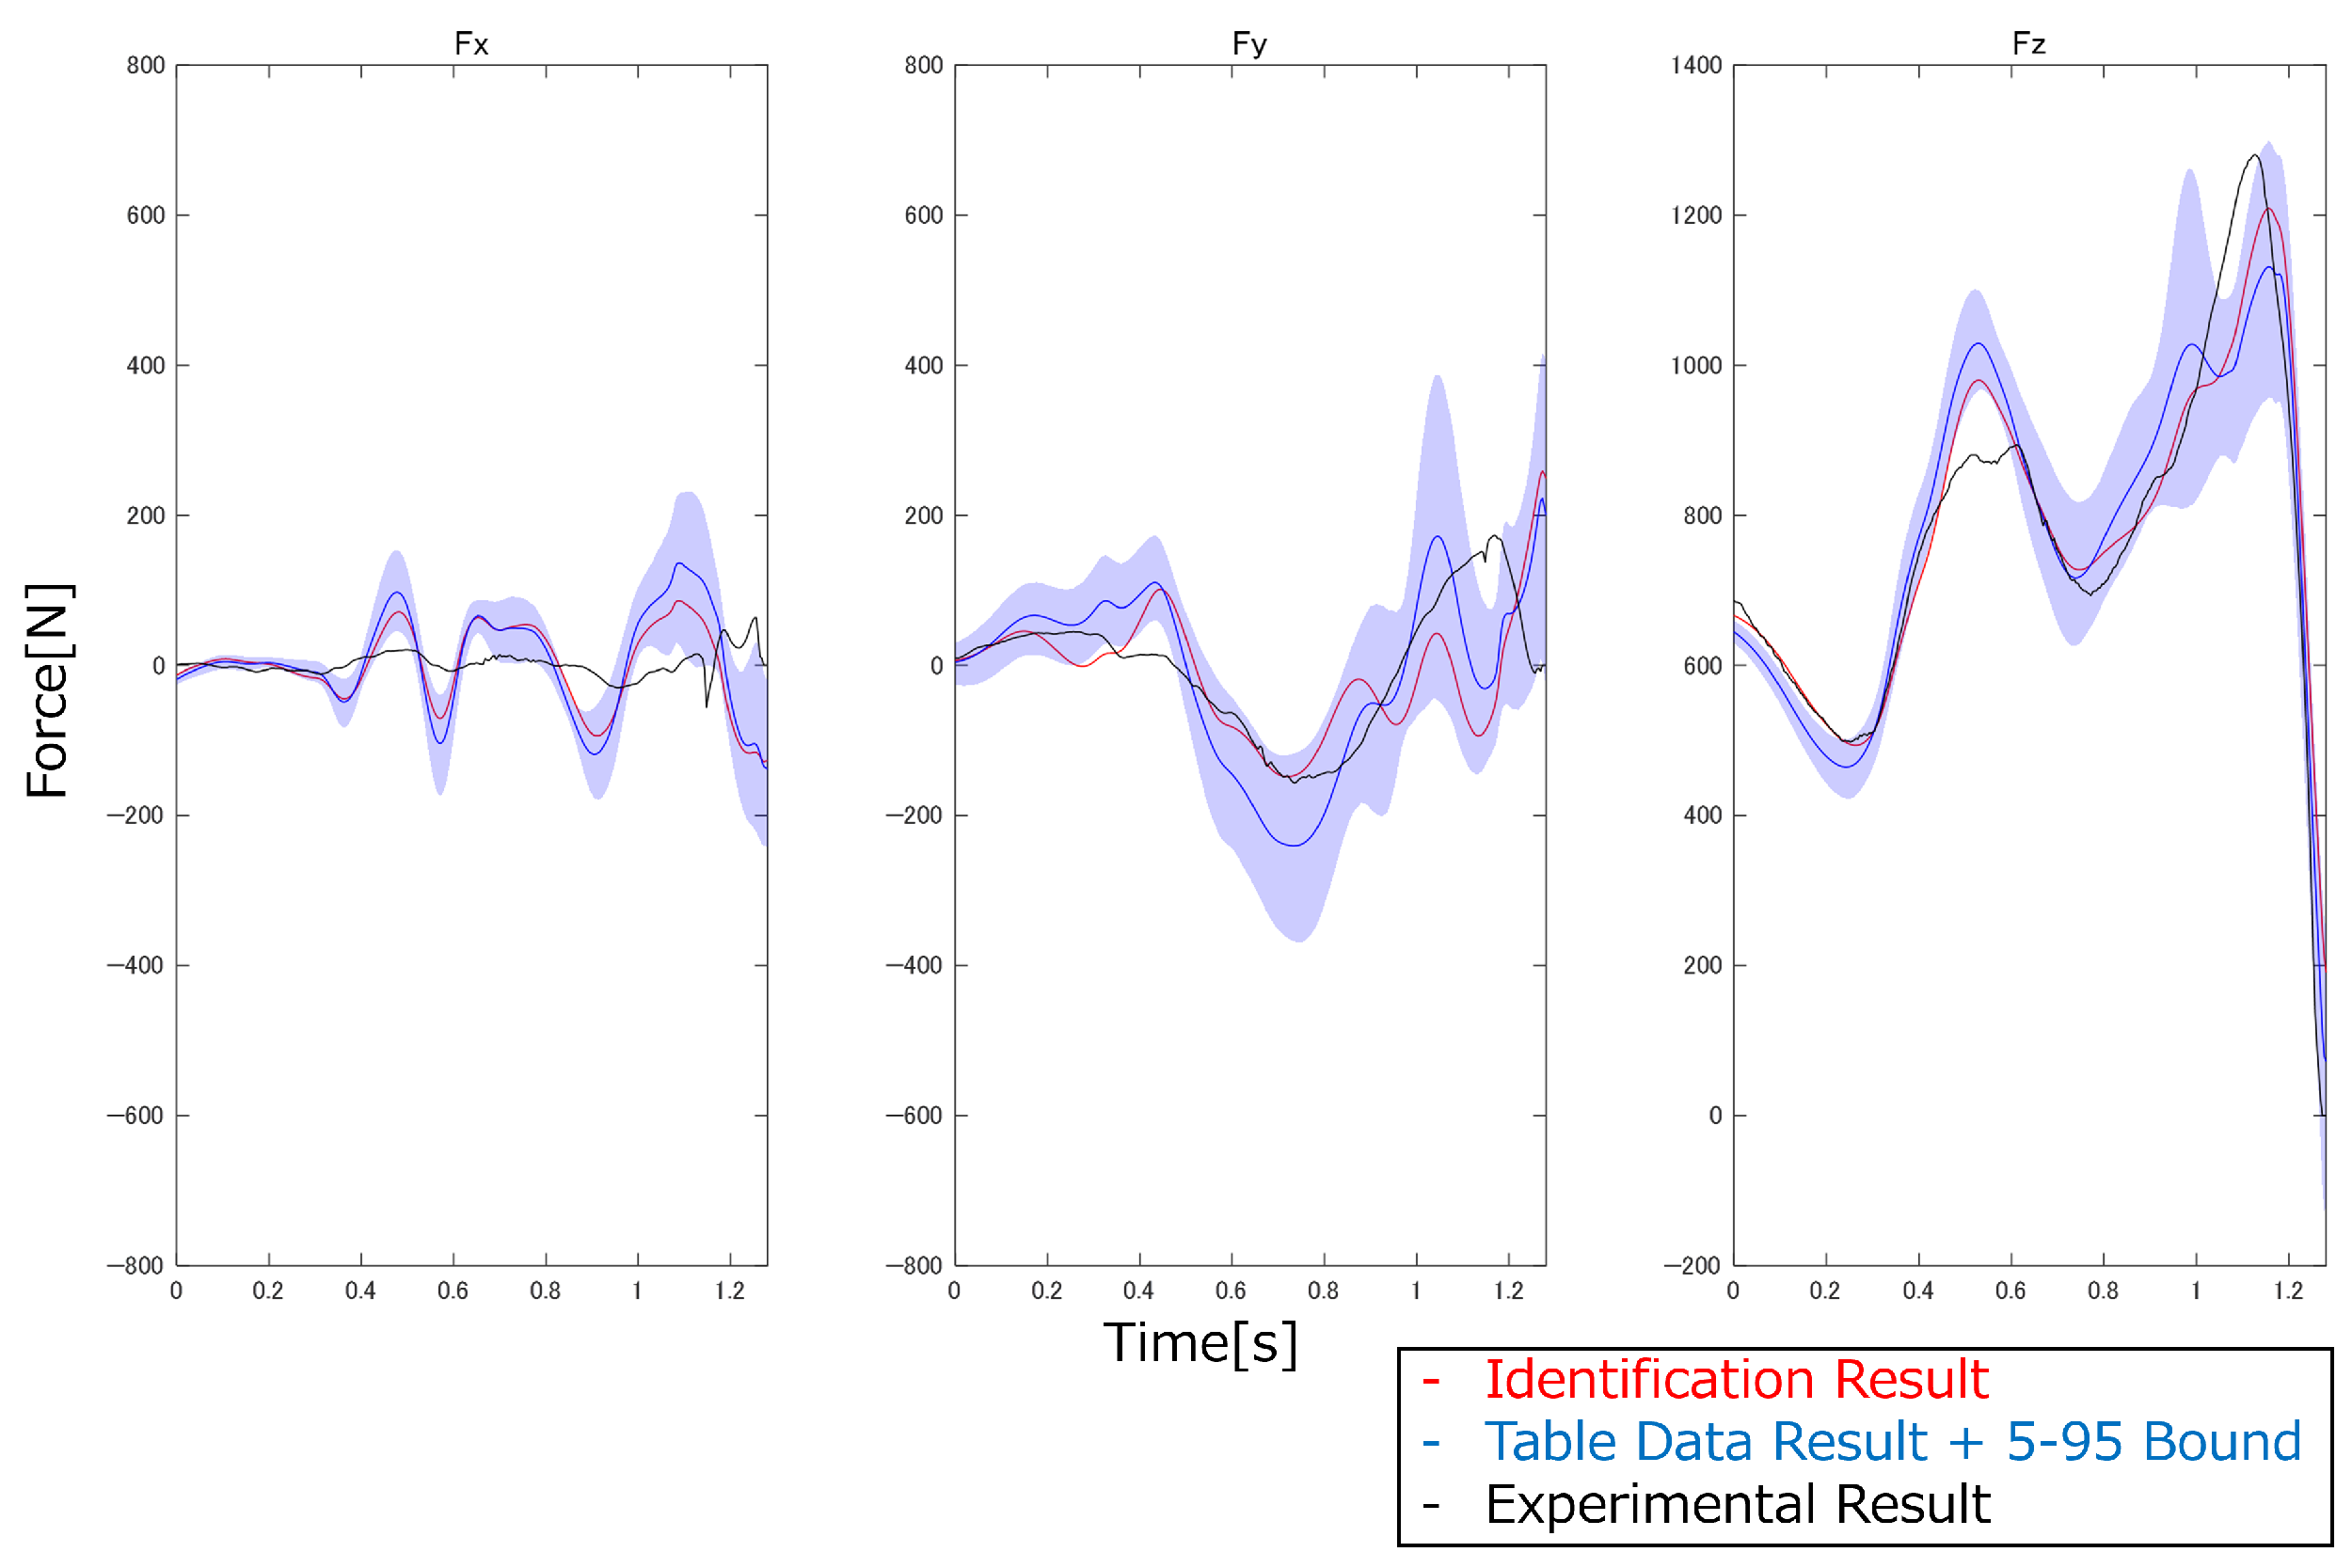
Figure 22.
Comparison of the estimated and experimental ground reaction forces (side-cutting).
Figure 22.
Comparison of the estimated and experimental ground reaction forces (side-cutting).
Figure 23.
Comparison of estimated and experimental ground reaction forces (vertical jump).
Figure 23.
Comparison of estimated and experimental ground reaction forces (vertical jump).
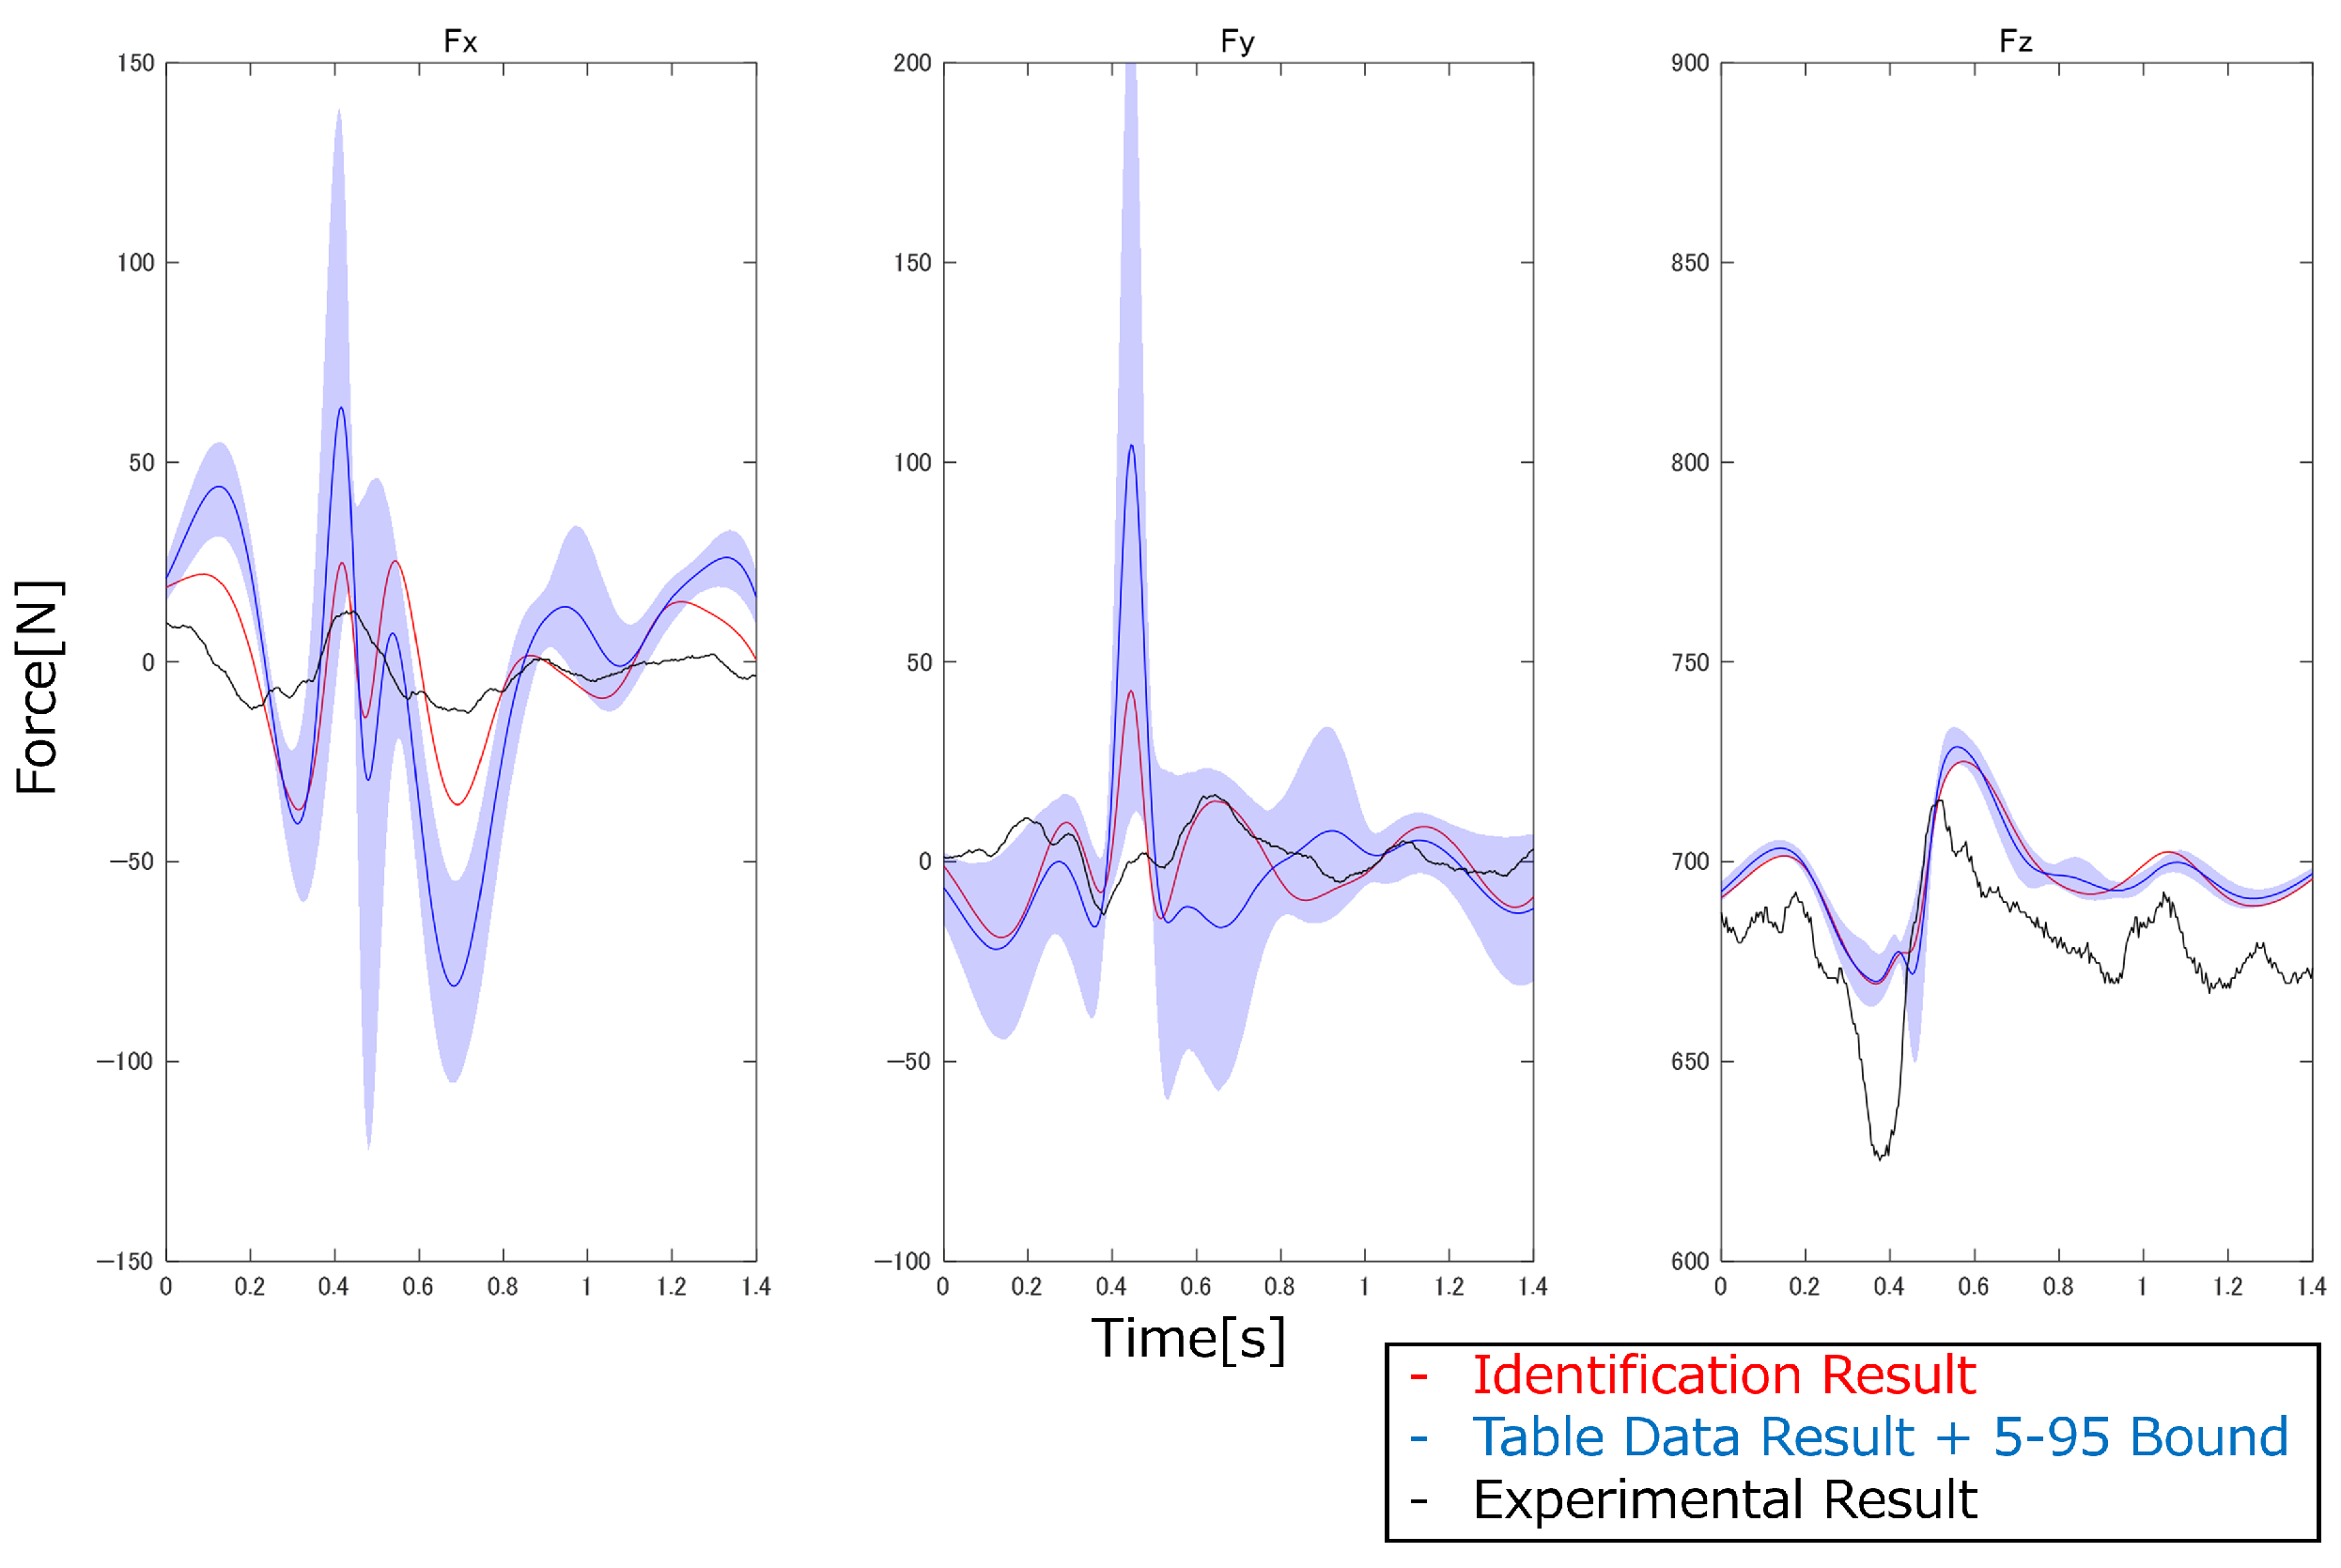
Figure 24.
Comparison of the estimated and experimental ground reaction forces (arm swing).
Figure 24.
Comparison of the estimated and experimental ground reaction forces (arm swing).
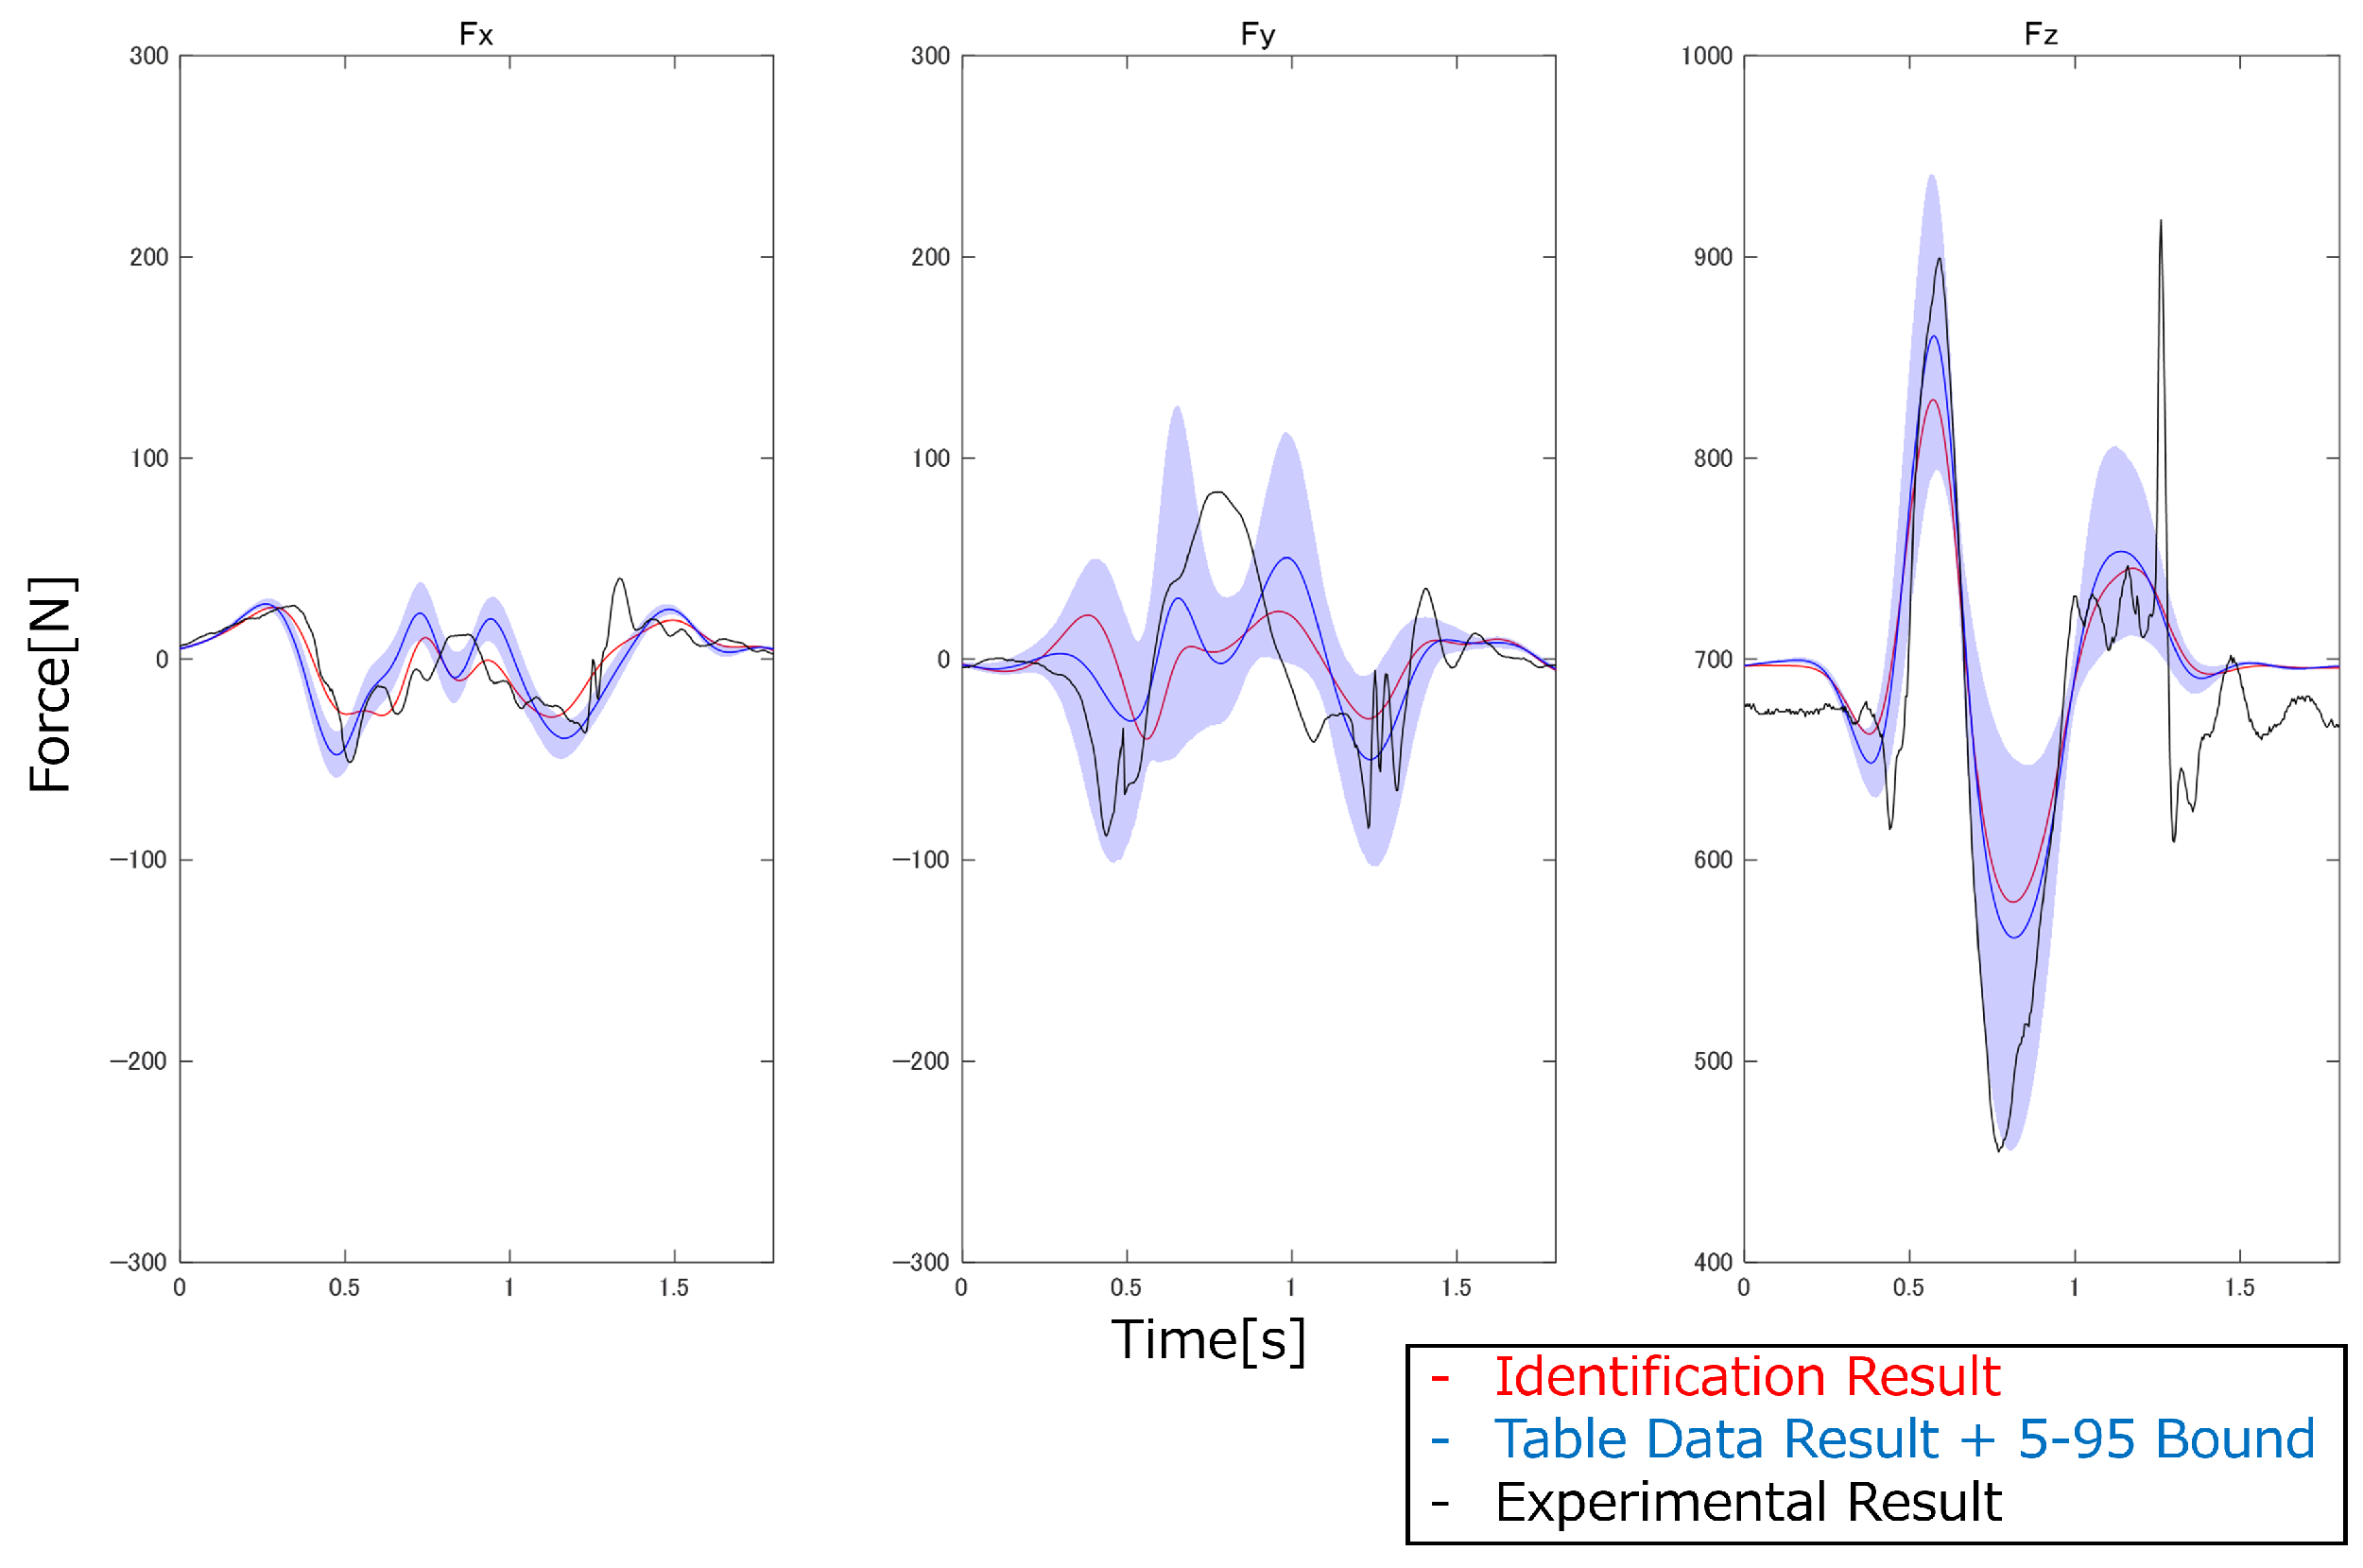
Figure 25.
Comparison of the estimated and experimental ground reaction forces (leg swing).
Figure 25.
Comparison of the estimated and experimental ground reaction forces (leg swing).
Table 1.
Identification results [
18] and calculation results using the regression equations by Ae et al. [
33] for all MSIP.
Table 1.
Identification results [
18] and calculation results using the regression equations by Ae et al. [
33] for all MSIP.
| | | | | | | |
| identification | 1.9819 | −2.463 | −22.1175 | 0.0043 | 0.0628 | 0.4461 |
| calculation | 0.3572 | −3.0746 | −22.1337 | 0 | 0 | 0.1073 |
| | | | | | | |
| identification | 0.056 | 0.701 | −0.0027 | −0.0114 | 0.2092 | 0 |
| calculation | 0 | 0.8771 | 0 | 0 | 0.3618 | 0 |
| | | | | | | |
| identification | −0.002 | 3.5006 | −0.4851 | −0.0839 | 0.8217 | 0 |
| calculation | 0 | 4.1531 | 0 | 0.0872 | 1.0034 | 0 |
| | | | | | | |
| identification | 10.6914 | 12.452 | 0.0151 | −0.4616 | 0.9305 | −0.0086 |
| calculation | 11.7848 | 11.3858 | 1.6363 | 0.0501 | 0.1127 | −0.0175 |
| | | | | | | |
| identification | 0.1477 | 0.1449 | 0.0205 | −0.0178 | 0.0486 | 0.0228 |
| calculation | 0.0225 | 0.0249 | 0.0133 | 0 | 0 | 0 |
| | | | | | | |
| identification | 0.1909 | 0.0479 | 0.2628 | 0.0441 | 0.0357 | −0.0808 |
| calculation | 0.2403 | 0.0039 | 0.2392 | 0 | 0 | 0 |
| | | | | | |
| identification | 0.0342 | 0.0342 | −0.0575 | −0.025 | −0.0164 |
| calculation | 0.1031 | 0.1045 | 0 | 0 | 0 |
| | | | | | | |
| identification | 1.1911 | 0.161 | 1.7926 | −0.01097 | 0.0878 | 0.4364 |
| calculation | 1.5404 | 0.0512 | 1.3997 | 0 | 0 | 0 |
| | | | | | |
| identification | 0.9211 | 0.2196 | 0.068 | 0.1218 | −0.0489 |
| calculation | 0.3086 | 0.3364 | 0 | 0 | −0.0395 |
Table 2.
Maximum correlation coefficients and corresponding (a) inertial property and (b) MSIP of the running motion.
Table 2.
Maximum correlation coefficients and corresponding (a) inertial property and (b) MSIP of the running motion.
| (a) | (b) |
| | | | | | | | |
| GRFs | : 0.30 | : 0.57 | : 0.43 | GRFs | : 0.25 | : 0.69 | : 0.32 |
| | | | | | | | |
| GRMs | : 0.29 | : 0.38 | : 0.28 | GRMs | : 0.14 | : 0.28 | : 0.40 |
| right shoulder | : 0.76 | : 0.80 | : 0.72 | right shoulder | : 0.95 | : 0.96 | : 0.85 |
| right elbow | : 0.80 | : 0.62 | : 0.80 | right elbow | : 0.97 | : 0.69 | : 0.99 |
| left shoulder | : 0.69 | : 0.80 | : 0.70 | left shoulder | : 0.82 | : 0.95 | : 0.77 |
| left elbow | : 0.80 | : 0.62 | : 0.77 | left elbow | : 0.97 | : 0.65 | : 0.91 |
| right hip | : 0.66 | : 0.69 | : 0.64 | right hip | : 0.58 | : 0.84 | : 0.88 |
| right knee | : 0.77 | : 0.61 | : 0.79 | right knee | : 0.95 | : 0.53 | : 0.97 |
| left hip | : 0.69 | : 0.63 | : 0.71 | left hip | : 0.85 | : 0.79 | : 0.73 |
| left knee | : 0.79 | : 0.58 | : 0.79 | left knee | : 0.97 | : 0.34 | : 1.00 |
Table 3.
Maximum correlation coefficients and corresponding (a) inertial property and (b) MSIP of the side-cutting motion.
Table 3.
Maximum correlation coefficients and corresponding (a) inertial property and (b) MSIP of the side-cutting motion.
| (a) | (b) |
| | | | | | | | |
| GRFs | : 0.43 | : 0.38 | : 0.47 | GRFs | : 0.66 | : 0.42 | : 0.39 |
| | | | | | | | |
| GRMs | : 0.17 | : 0.61 | : 0.42 | GRMs | : 0.49 | : 0.52 | : 0.43 |
| right hip | : 0.67 | : 0.68 | : 0.62 | right hip | : 0.91 | : 0.90 | : 0.83 |
| right knee | : 0.72 | : 0.25 | : 0.79 | right knee | : 0.99 | : 0.11 | : 1.00 |
| left hip | : 0.67 | : 0.54 | : 0.35 | left hip | : 0.55 | : 0.37 | : 0.39 |
| left knee | : 0.75 | : 0.63 | : 0.60 | left knee | : 0.90 | : 0.66 | : 0.82 |
Table 4.
Maximum correlation coefficients and corresponding (a) inertial properties and (b) MSIP of the vertical jump motion.
Table 4.
Maximum correlation coefficients and corresponding (a) inertial properties and (b) MSIP of the vertical jump motion.
| (a) | (b) |
| | | | | | | | |
| GRFs | : 0.31 | : 0.39 | : 0.41 | GRFs | : 0.31 | : 0.34 | : 0.08 |
| | | | | | | | |
| GRMs | : 0.46 | : 0.42 | : 0.49 | GRMs | : 0.29 | : 0.34 | : 0.43 |
| right hip | : 0.63 | : 0.71 | : 0.68 | right hip | : 0.59 | : 0.72 | : 0.97 |
| right knee | : 0.74 | : 0.31 | : 0.76 | right knee | : 0.83 | : 0.57 | : 0.94 |
| left hip | : 0.61 | : 0.54 | : 0.44 | left hip | : 0.84 | : 0.63 | : 0.49 |
| left knee | : 0.18 | : 0.66 | : 0.78 | left knee | : 0.15 | : 0.76 | : 1.00 |
Table 5.
Maximum correlation coefficients and corresponding (a) inertial properties and (b) MSIP of the arm swing motion.
Table 5.
Maximum correlation coefficients and corresponding (a) inertial properties and (b) MSIP of the arm swing motion.
| (a) | (b) |
| | | | | | | | |
| GRFs | : 0.66 | : 0.69 | : 0.58 | GRFs | : 0.98 | : 0.99 | : 0.72 |
| | | | | | | | |
| GRMs | : 0.72 | : 0.64 | : 0.75 | GRMs | : 0.85 | : 0.91 | : 0.74 |
| right shoulder | : 0.81 | : 0.68 | : 0.74 | right shoulder | : 0.63 | : 0.86 | : 0.97 |
| right elbow | : 0.77 | : 0.27 | : 0.80 | right elbow | : 0.66 | : 0.71 | : 1.00 |
Table 6.
Maximum correlation coefficients and corresponding (a) inertial properties and (b) MSIP of the leg swing motion.
Table 6.
Maximum correlation coefficients and corresponding (a) inertial properties and (b) MSIP of the leg swing motion.
| (a) | (b) |
| | | | | | | | |
| GRFs | : 0.59 | : 0.64 | : 0.71 | GRFs | : 0.62 | : 0.65 | : 0.73 |
| | | | | | | | |
| GRMs | : 0.30 | : 0.70 | : 0.39 | GRMs | : 0.32 | : 0.79 | : 0.38 |
| right hip | : 0.65 | : 0.25 | : 0.69 | right hip | : 0.64 | : 0.48 | : 0.71 |
| right knee | : 0.69 | : 0.55 | : 0.77 | right knee | : 0.99 | : 0.91 | : 0.81 |
Table 7.
Relationship between angular acceleration and means and standard deviations of the widths of the 5–95% confidence intervals.
Table 7.
Relationship between angular acceleration and means and standard deviations of the widths of the 5–95% confidence intervals.
| | Range of the arm angular acceleration fluctuation | Maximum mean 5–95 bound difference of moment | Range of the leg angular acceleration fluctuation | Maximum mean 5–95 bound difference of moment |
| running | ±400 | 65 ± 50 | ±200 | 150 ± 70 |
| side-cutting | ±25 | 15 ± 3 | ±50 | 75 ± 20 |
| vertical jump | ±100 | 20 ± 20 | ±100 | 60 ± 45 |
| arm swing | ±100 | 20 ± 10 | ±10 | 20 ± 3 |
| leg swing | ±20 | 6 ± 2 | ±50 | 45 ± 35 |
Table 8.
RMSE and Pearson’s correlation coefficients between the analysis and experimental results.
Table 8.
RMSE and Pearson’s correlation coefficients between the analysis and experimental results.
| | RMSE of Identification Result | RMSE of Table Data Result | of Identification Result | of Table Data Result |
|---|
| running | 231 | 300 | 0.95 | 0.96 |
| side-cutting | 253 | 358 | 0.86 | 0.83 |
| vertical jump | 208 | 356 | 0.95 | 0.94 |
| arm swing | 371 | 377 | 0.83 | 0.80 |
| leg swing | 367 | 370 | 0.91 | 0.91 |


