Abstract
In this work, different processing routes were investigated to evaluate the effects of hot rolling temperature, annealing before cold rolling (ABCR), and one- or two-stage cold rolling and annealing schedules to obtain more efficient electrical steels. The correlation between processing variables, microstructure, thickness, and magnetic properties was established from the analysis of 3D surface plots. It was found that the lowest core loss values (3.4 W/kg) were obtained when steel is processed by hot rolling (800 °C), ABCR (880 °C–180 min), first cold rolling (up to 0.25 mm), first annealing (850 °C–10 min), second cold rolling (up to 0.2 mm), and second annealing (850 °C–10 min). The better combination between thickness and grain size leads to the enhancement of the magnetic properties, which affects the way eddy and hysteresis losses contribute to the total core losses.
1. Introduction
In recent years, there has been a notable increase in energy consumption, which has had a significant impact on climate change. Significant efforts have been dedicated to developing improved steel grades that reduce energy losses in electrical equipment. Grain non-oriented electrical steels (GNOES) are widely used for the manufacture of cores of electric devices and thus, by improving the magnetic properties of these materials, they will have a significant impact on energy consumption [,]. This improvement can be achieved by increasing magnetic induction and magnetic permeability and reducing core loss, which are affected by the steel composition, thickness, grain size and crystallographic texture [,,,,,,,,,,]. Since the processing conditions affect microstructural characteristics and therefore, the magnetic properties [,,,,,,], attempts have been made to develop effective methods that reduce energy losses. Unconventional processing methods have been proposed to enhance the magnetic behavior of these steels, such as thermal treatments (in inert or oxidizing atmospheres) before cold rolling [,,,,,], rotation of the hot-rolled steel (90° or 45° with respect to the rolling direction) to conduct the cold rolling process [,] and two-step cold rolling with intermediate annealing treatment [,]. The effect of the hot rolling and subsequent annealing (in argon atmosphere) on the modification of hot-rolled bands have been investigated for different steel grades, such as those containing silicon amounts greater than 1% [,,], 0.5% Mn [], different Al contents [] or low-Si, ultra-low carbon contents []. More recently, it has been reported that processing hot-rolled low and ultralow-carbon Si + Sb non-oriented electrical steels from annealing before cold rolling can also improve the magnetic behavior of the final products [,]. In all cases, the changes caused by annealing before cold rolling on the final microstructure and magnetic properties were found to be highly dependent on the steel composition and microstructural characteristics of the as-received hot-rolled materials, as well as the conditions used during steel processing [,,,,,]. For instance, F. Hernández Navarro [] reported the magnetic behavior of ultra-low carbon (0.006%) steels containing 0.607% Si obtaining core loss to 1.5 T at 50 Hz (W1.5/50) and magnetic permeability (µr) values of about 6.7 W/kg and 2250.0, respectively, after processing hot-rolled electrical steels (deformed at 1200 °C) by annealing before cold rolling (ABCR = 880 °C, 180 min), cold rolling (0.25 mm thickness), and annealing (850 °C, 60 min). In other work, for similar steel composition and processing conditions, but with a hot rolling temperature of 800 °C, energy losses were reduced by up to 5.7 W/kg (W1.5/50). The reduction in core losses was related to the microstructural and texture changes produced by the reduction in temperature, where the lower volume fraction of <111>//ND components in the steel allowed for the reduction in core losses []. The effects of ABCR were also investigated by the same author in steels with different composition (0.071%C, 0.575%Si and 0.1%Sb) and processing parameters (hot rolling (1100 °C), ABCR (850 °C, 720 min), cold rolling (0.25 mm thickness) and annealing (950 °C, 8 min) []), reaching lower core loss values of about 4.3 W/kg and magnetic permeability (µr) of about 2850. H. Ortiz Rangel [] reported core loss values of about 3.0 W/kg in electrical steels (0.008%C, 0.328%Si) processed by a similar route, consisting of ABCR, cold rolling and annealing. However, although lower core loss values were obtained, processing conditions were very different; for example, ABCR was conducted at 710 °C for 72 h (4320 min), cold rolling reduction was conducted to obtain a thickness of 0.19 mm and annealing was performed at 700 °C for 3 min. These works show that the magnetic properties of electrical steel depend strongly on steel composition and processing parameters used for their fabrication. In the present investigation, hot-rolled steel samples were processed at different temperatures, subjected to an annealing before cold rolling, similar to other works, at 1200 °C and 800 °C, providing differences to the steel in terms of microstructure and texture obtained before cold rolling [,], and then subjected to different cold rolling and annealing schedules to evaluate the effect of processing history on the microstructure and magnetic properties of low-carbon Si-Sb grain non-oriented electrical steels.
2. Materials and Methods
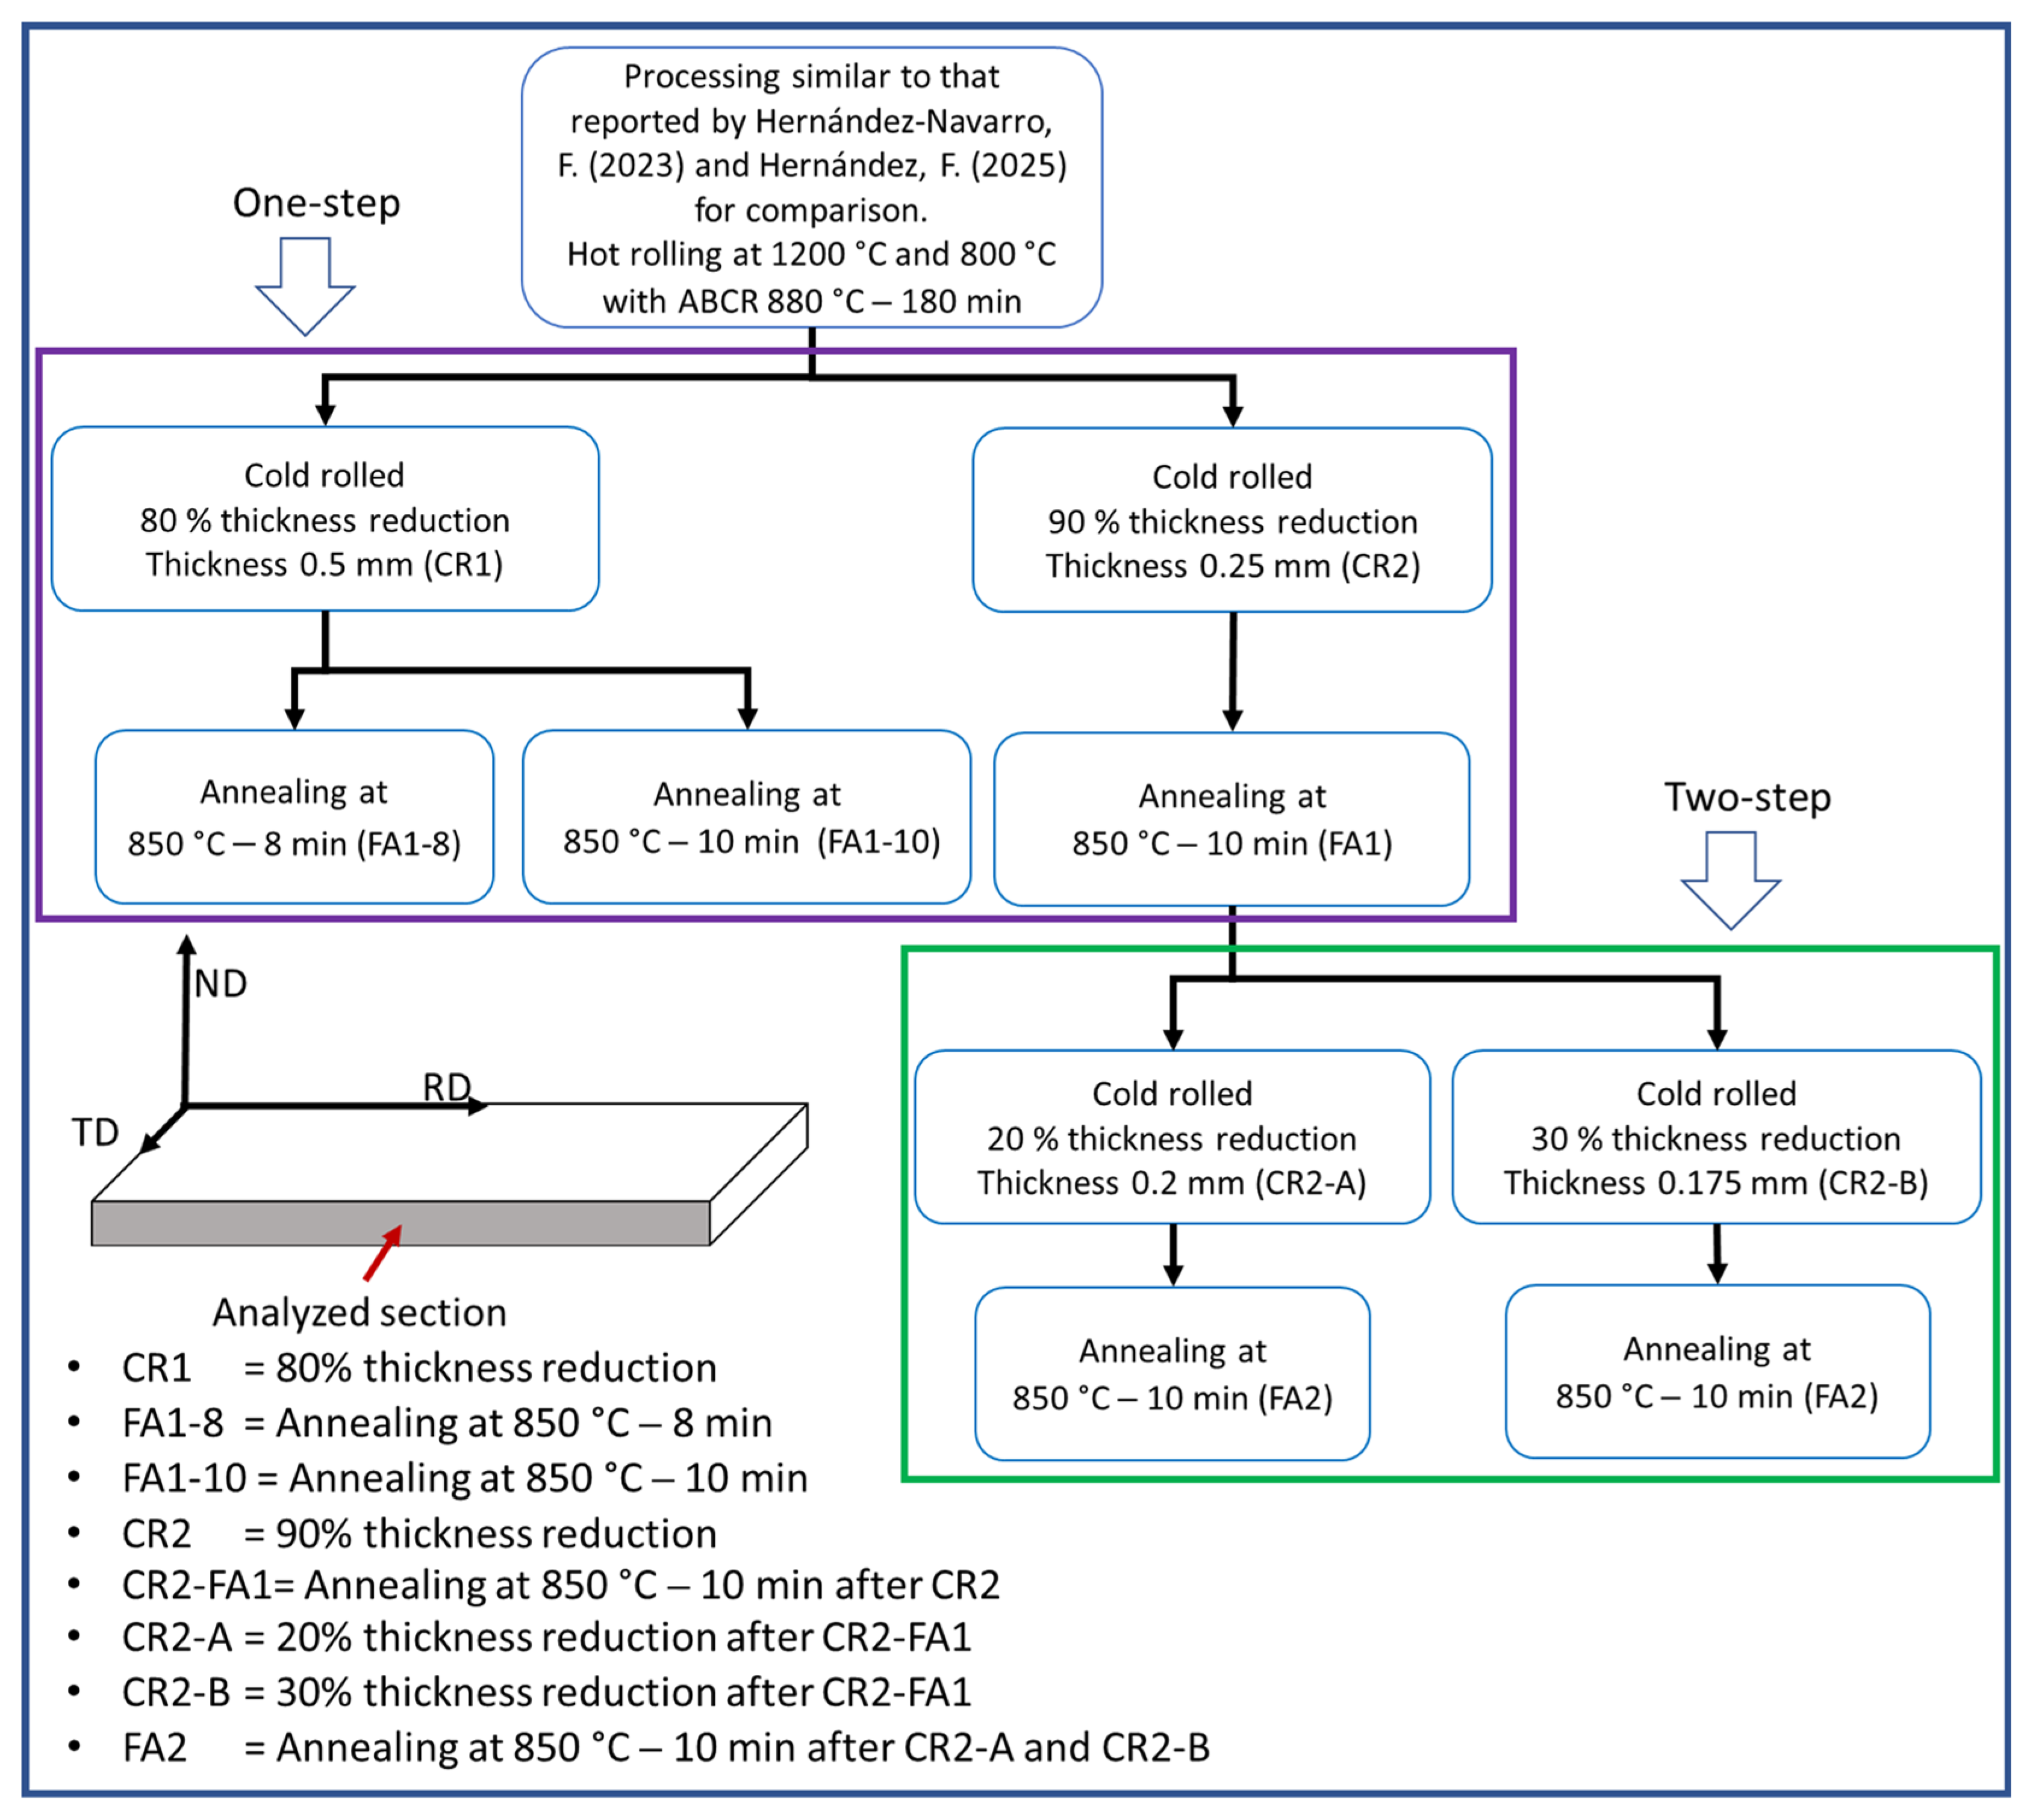
An ingot of 16 × 10 × 4 cm was manufactured by fusion and casting in metallic ingot molds, homogenized at 1200 °C (30 min) and hot-rolled up to 1 cm thickness. Smaller ingots with dimensions of 17 × 10 × 1 cm were then obtained and processed by hot rolling. To this end, one ingot was reheated at 1200 °C (15 min) and the other at 800 °C (15 min). Figure 1 illustrates a flow chart to show the processing steps used for both steels. Both ingots were hot-rolled up to 3 mm thick, reheated (15 min) at 1200 °C and 800 °C, respectively, and hot-rolled to a thickness of 2.5 mm. Steel samples 1200 °C and 800 °C are hereinafter referred to as Sb12 and Sb8, respectively. These temperatures were selected based on the results of previous works [,], which demonstrate that hot rolling at temperatures either below (800 °C) or above (1200 °C) the upper critical transformation temperature (AC3) can affect the microstructural characteristics (grain size, texture) of hot-rolled electrical steel bands, having a significant effect on the core losses of final products. However, it is important to mention that the effects of such temperatures have not been reported for steels modified by a two-stage cold rolling and annealing schedule, which is one of the processing routes used in the present work. Steel samples were pickled with a 20% HCl solution and subjected to annealing before cold rolling (ABCR) at 880 °C for 180 min and subjected to one- and two-step cold rolling and annealing schedules. In the first stage, ABCR samples were cold-rolled to a thickness of 0.5 mm (CR1 = 80% thickness reduction) and annealed at 850 °C at 8 and 10 min (FA1-8 and FA1-10). Other ABCR samples were cold-rolled to a thickness of 0.25 mm (CR2 = 90% thickness reduction) and annealed at 850 °C, 10 min (FA1), one-step cold rolling and annealing schedule (purple rectangle in Figure 1). In the second stage, samples of 0.25 mm thickness were cold-rolled to achieve an additional thickness reduction of 20% (CR2-A = 0.20 mm thickness) and 30% (CR2-B = 0.175 mm thickness), followed by a second annealing conducted at 850 °C for 10 min (FA2), two-step cold rolling and annealing schedule (green rectangle in Figure 1).
Figure 1.
Schematic diagram showing the processing of steels by hot rolling (800 °C and 1200 °C) plus annealing before cold rolling at 880 °C for 180 min [,], followed by one- and two-step cold rolling and annealing schedules.
Chemical compositions of experimental steels, determined by optical emission spectrometry (ASTM E-403) and infrared absorption spectrometry (IR-AS, ASTM E-1019), were C: 0.014%, Si: 0.607%, Al: 0.071%, Mn: 0.819%, Cu: 0.173%, Fe: balance for the steel reheated at 1200 °C (Sb12) and C: 0.016%, Si: 0.608%, Al: 0.071%, Mn: 0.812%, Cu: 0.173%, Fe: balance for the steel reheated at 800 °C (Sb8). The Sb content was 0.38% and 0.34% for steels hot-rolled at 1200 °C and 800 °C, respectively. The latter was analyzed by atomic absorption spectrometry using a Varian-spectrAA220 spectrometer (Agilent Technologies, California, United States). All the concentrations mentioned above are expressed in weight percent (wt.%). Dilatometric analyses were performed to determine the AC1 (start temperature for the austenite transformation) and AC3 (finish temperature for the austenite transformation). Samples of 10.0 mm × 4.0 mm × 2.3 mm were heated at 20 °C/s from room temperature to 1000 °C. Experiments were conducted in a LINSEIS L78 dilatometer (Linseis Thermal Analysis, Selb, Germany). AC1 was 910 °C and 861 °C for steels reheated at 1200 °C and 800 °C, respectively. AC3 temperature could not be determined in any steel, indicating that it is greater than 1000 °C. Microstructure was analyzed by optical microscopy (OM) and scanning electron microscopy (SEM) using OLYMPUS-GX51 (Olympus Corporation, Tokio, Japan) and JEOL-6610l microscopes (JEOL, Ltd., Tokio, Japan), respectively. Grain size was determined by the intercept method as recommended in ASTM E-112. The section analyzed on steel samples to observe the microstructure is also shown schematically in Figure 1.
Magnetic properties were evaluated in a direction parallel to the rolling direction after cold rolling and annealing conditions. Experiments were conducted in a Single Electrical Steel Sheet Tester DAC-BHW-6 (Soken Electric Co., Ltd., Tokio, Japan). Hysteresis loops were obtained at a magnetic induction of 1.5 T, and at frequencies of 50, 60 and 100 Hz. Remanent magnetic induction (Br), coercive field (Hc), and relative magnetic permeability (µr) were obtained from hysteresis loops. The contribution of hysteresis loss (Wh) and eddy current loss (We) to core loss or iron loss (W or Wi) was also determined at 1, 10, 50, 60 and 100 Hz. The magnetometer program provides discrimination by simultaneous Equations (1) and (2) in the multi-frequency method.
where Wc1 and Wc2 are core loss of frequency 1 (f1) and frequency 2 (f2), respectively, A is hysteresis loss coefficient, and B is eddy current loss coefficient.
Wc1 = A · f1 + B · f12,
Wc2 = A · f2 + B · f22,
3. Results
3.1. Microstructure of Hot-Rolled Sb8 and Sb12 Steels Processed by the One-Step Cold Rolling and Annealing Schedule
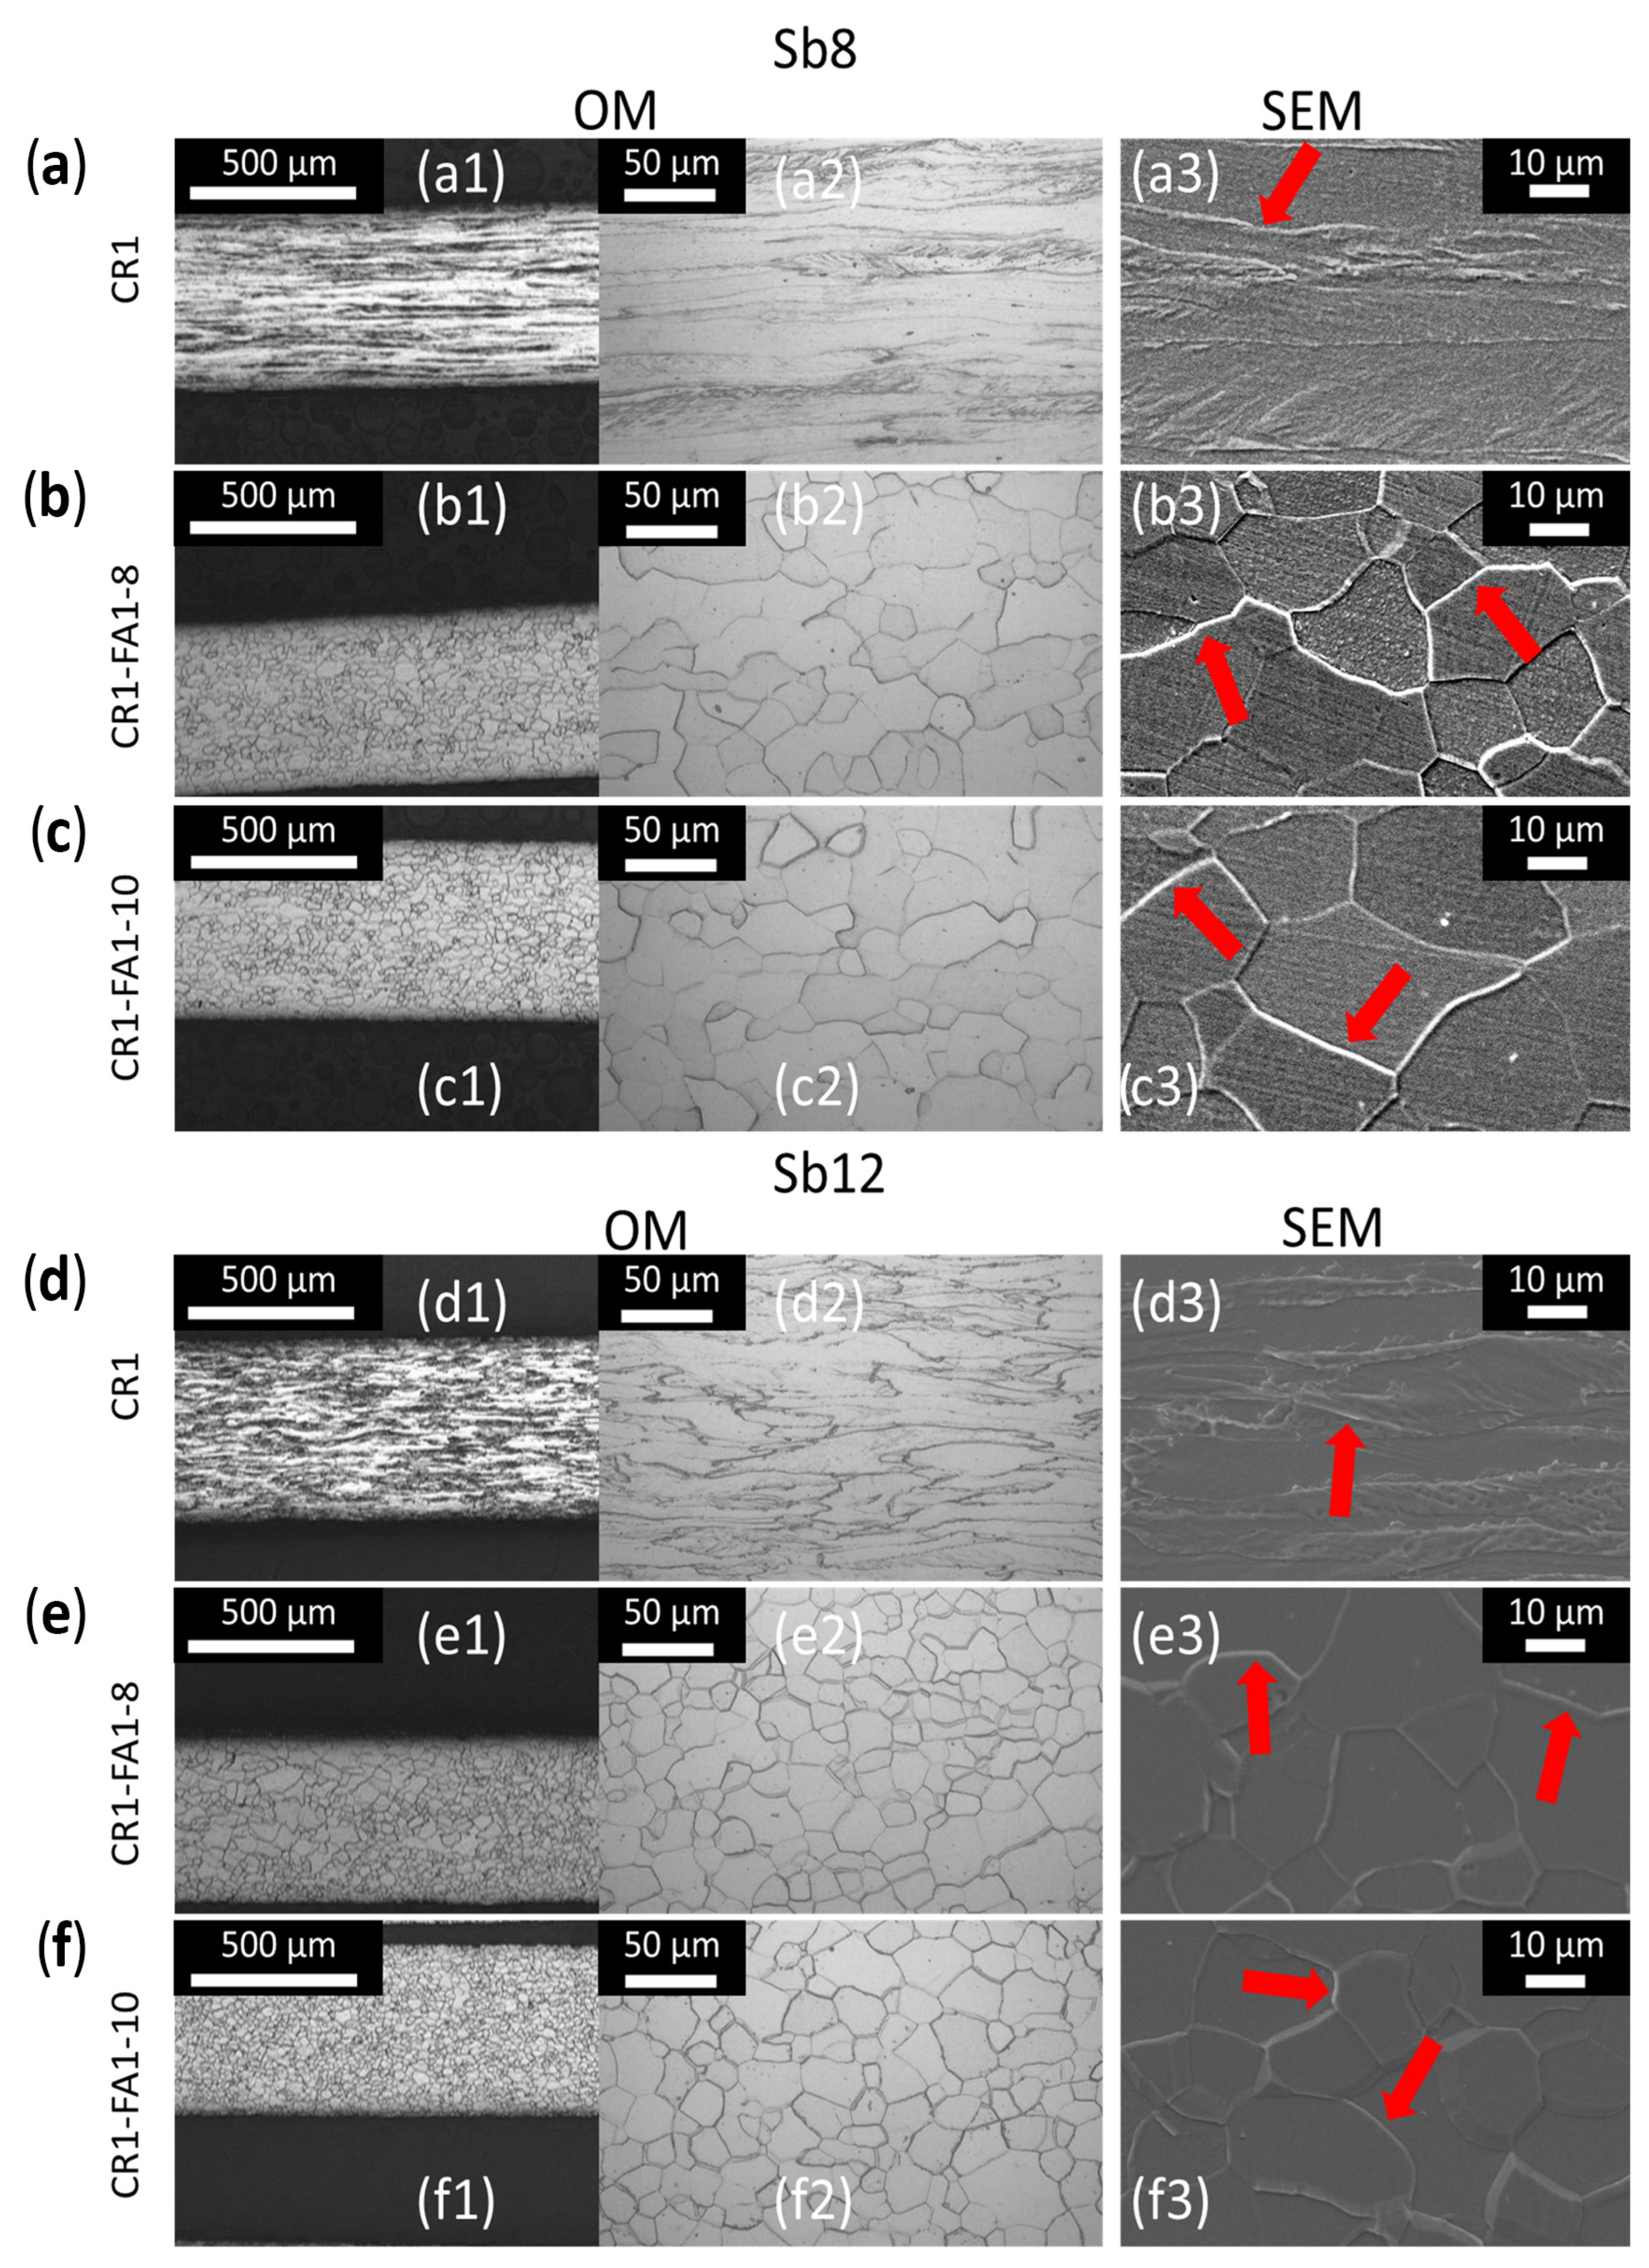
Figure 2 shows the microstructures of Sb8 and Sb12 steels (with ABCR), obtained after cold rolling (CR1 = 0.5 mm). Both steels (Sb8 and Sb12) show deformed grains elongated in the rolling direction (Figure 2(a1,d1)); however, Sb8 (hot-rolled at 800 °C) steels exhibit more deformed grains than Sb12 (hot-rolled at 1200 °C) steels, as seen at higher magnifications in Figure 2(a2,d2). After annealing at 850 °C for 8 min, both steels exhibit equiaxed grains (Figure 2(b1,b2,e1,e2)), which are commonly observed after recrystallization. Annealing at 850 °C for 10 min also produces recrystallized grains in both steels (Figure 2(c1,c2,f1,f2)), and the final microstructure obtained in both steels is very similar. SEM images show the presence of equiaxed ferrite grains (dark areas) and small amounts of carbides at ferrite grain boundaries (white areas, indicated with red arrows) in both steels, and for the three conditions, it means after cold rolling (CR1) and after annealing at 850 °C for 8 and 10 min (CR1-FA1-8 and CR1-FA1-10) (Figure 2(a3–f3)). Additional information regarding the composition of carbides and the matrix by SEM-EDS is presented in Appendix A (Figure A1 and Figure A2).
Figure 2.
Microstructure of Sb8 and Sb12 steels: (a,d) after cold rolling (0.5 mm thickness) and after final annealing at 850 °C for 8 min (b,e) and 10 min (c,f). No. 1 and 2 correspond to OM images, while No. 3 corresponds to SEM images. Red arrows indicate the presence of carbides.
Another study reported that carbon content accelerates the recrystallization process but slows down the recovery process. This increased recrystallization rate is attributed to the higher number of dislocations in steel containing carbon, due to the driving force for recrystallization, which is directly related to the number of dislocations []. Therefore, a higher carbon concentration could result in a greater number of dislocations during cold rolling, as well as a smaller grain size due to rapid recrystallization and slow recovery after annealing for high levels of deformation.
3.2. Microstructure of Hot-Rolled Sb8 and Sb12 Steels Processed by Annealing (880 °C, 180 min), Cold Rolling (0.25 mm Thickness), Annealing (850 °C, 10 min), Second Cold Rolling (0.2 mm and 0.175 mm) and Second Annealing (850 °C, 10 min)
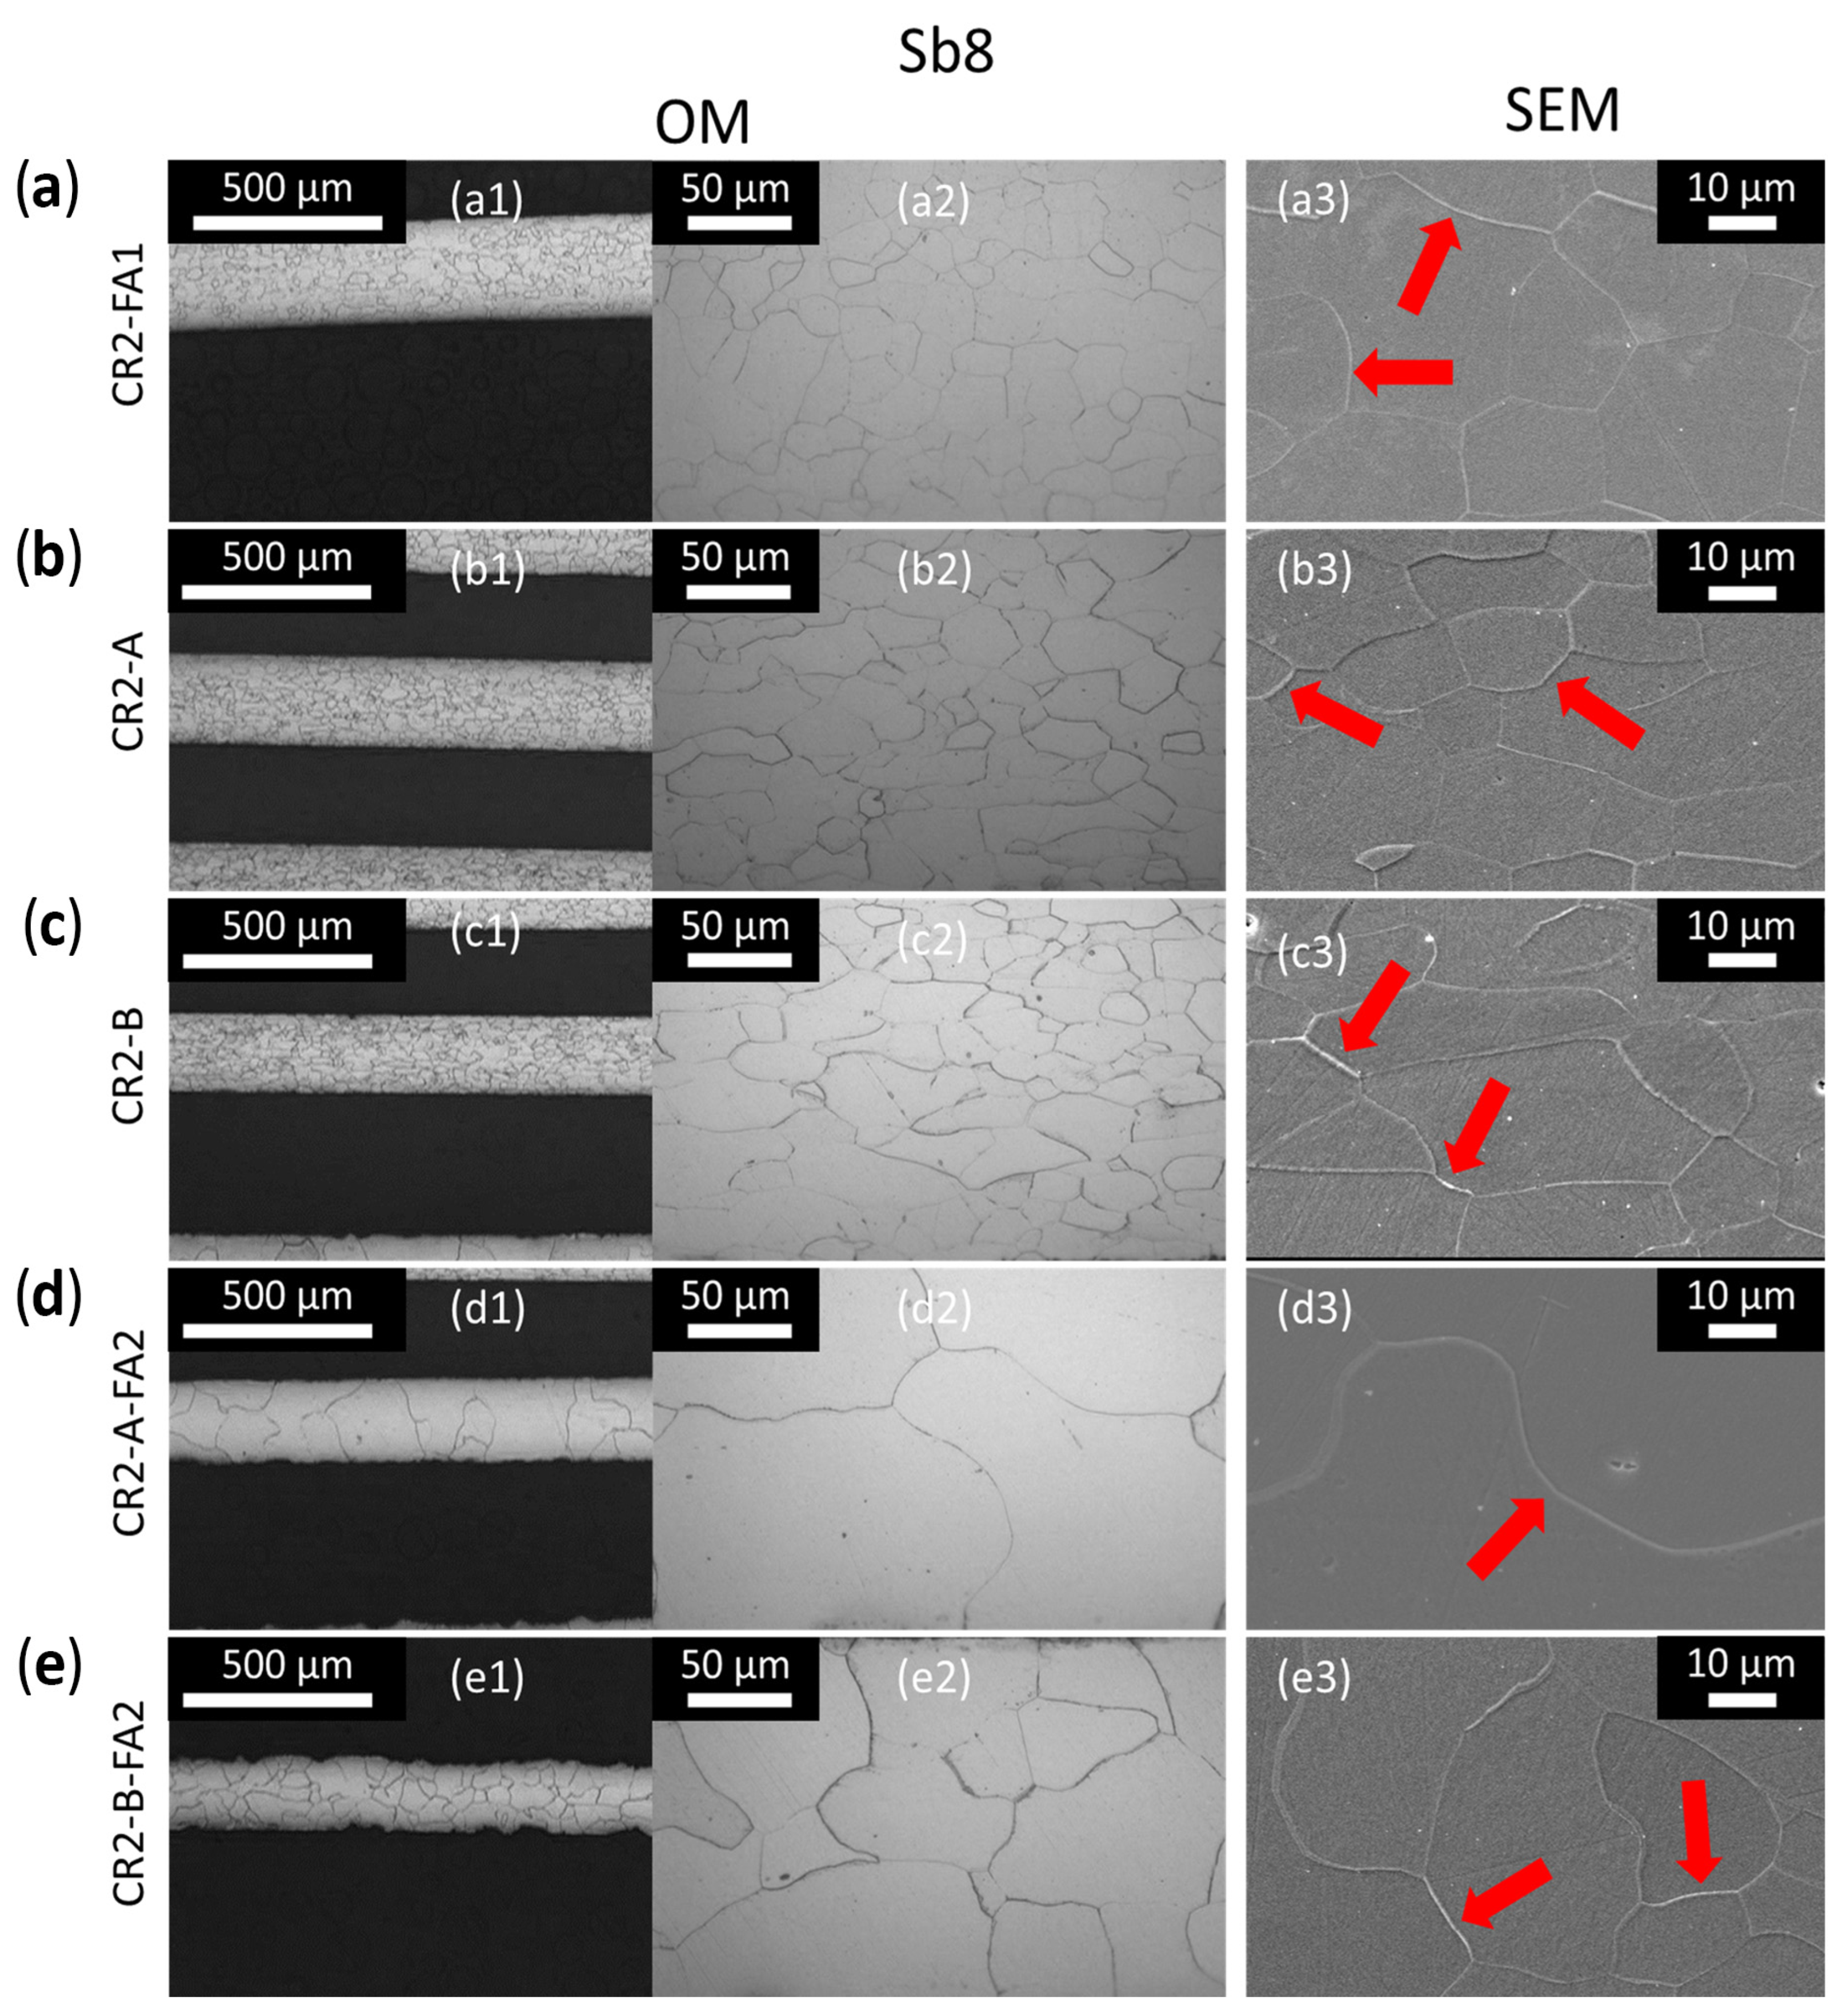
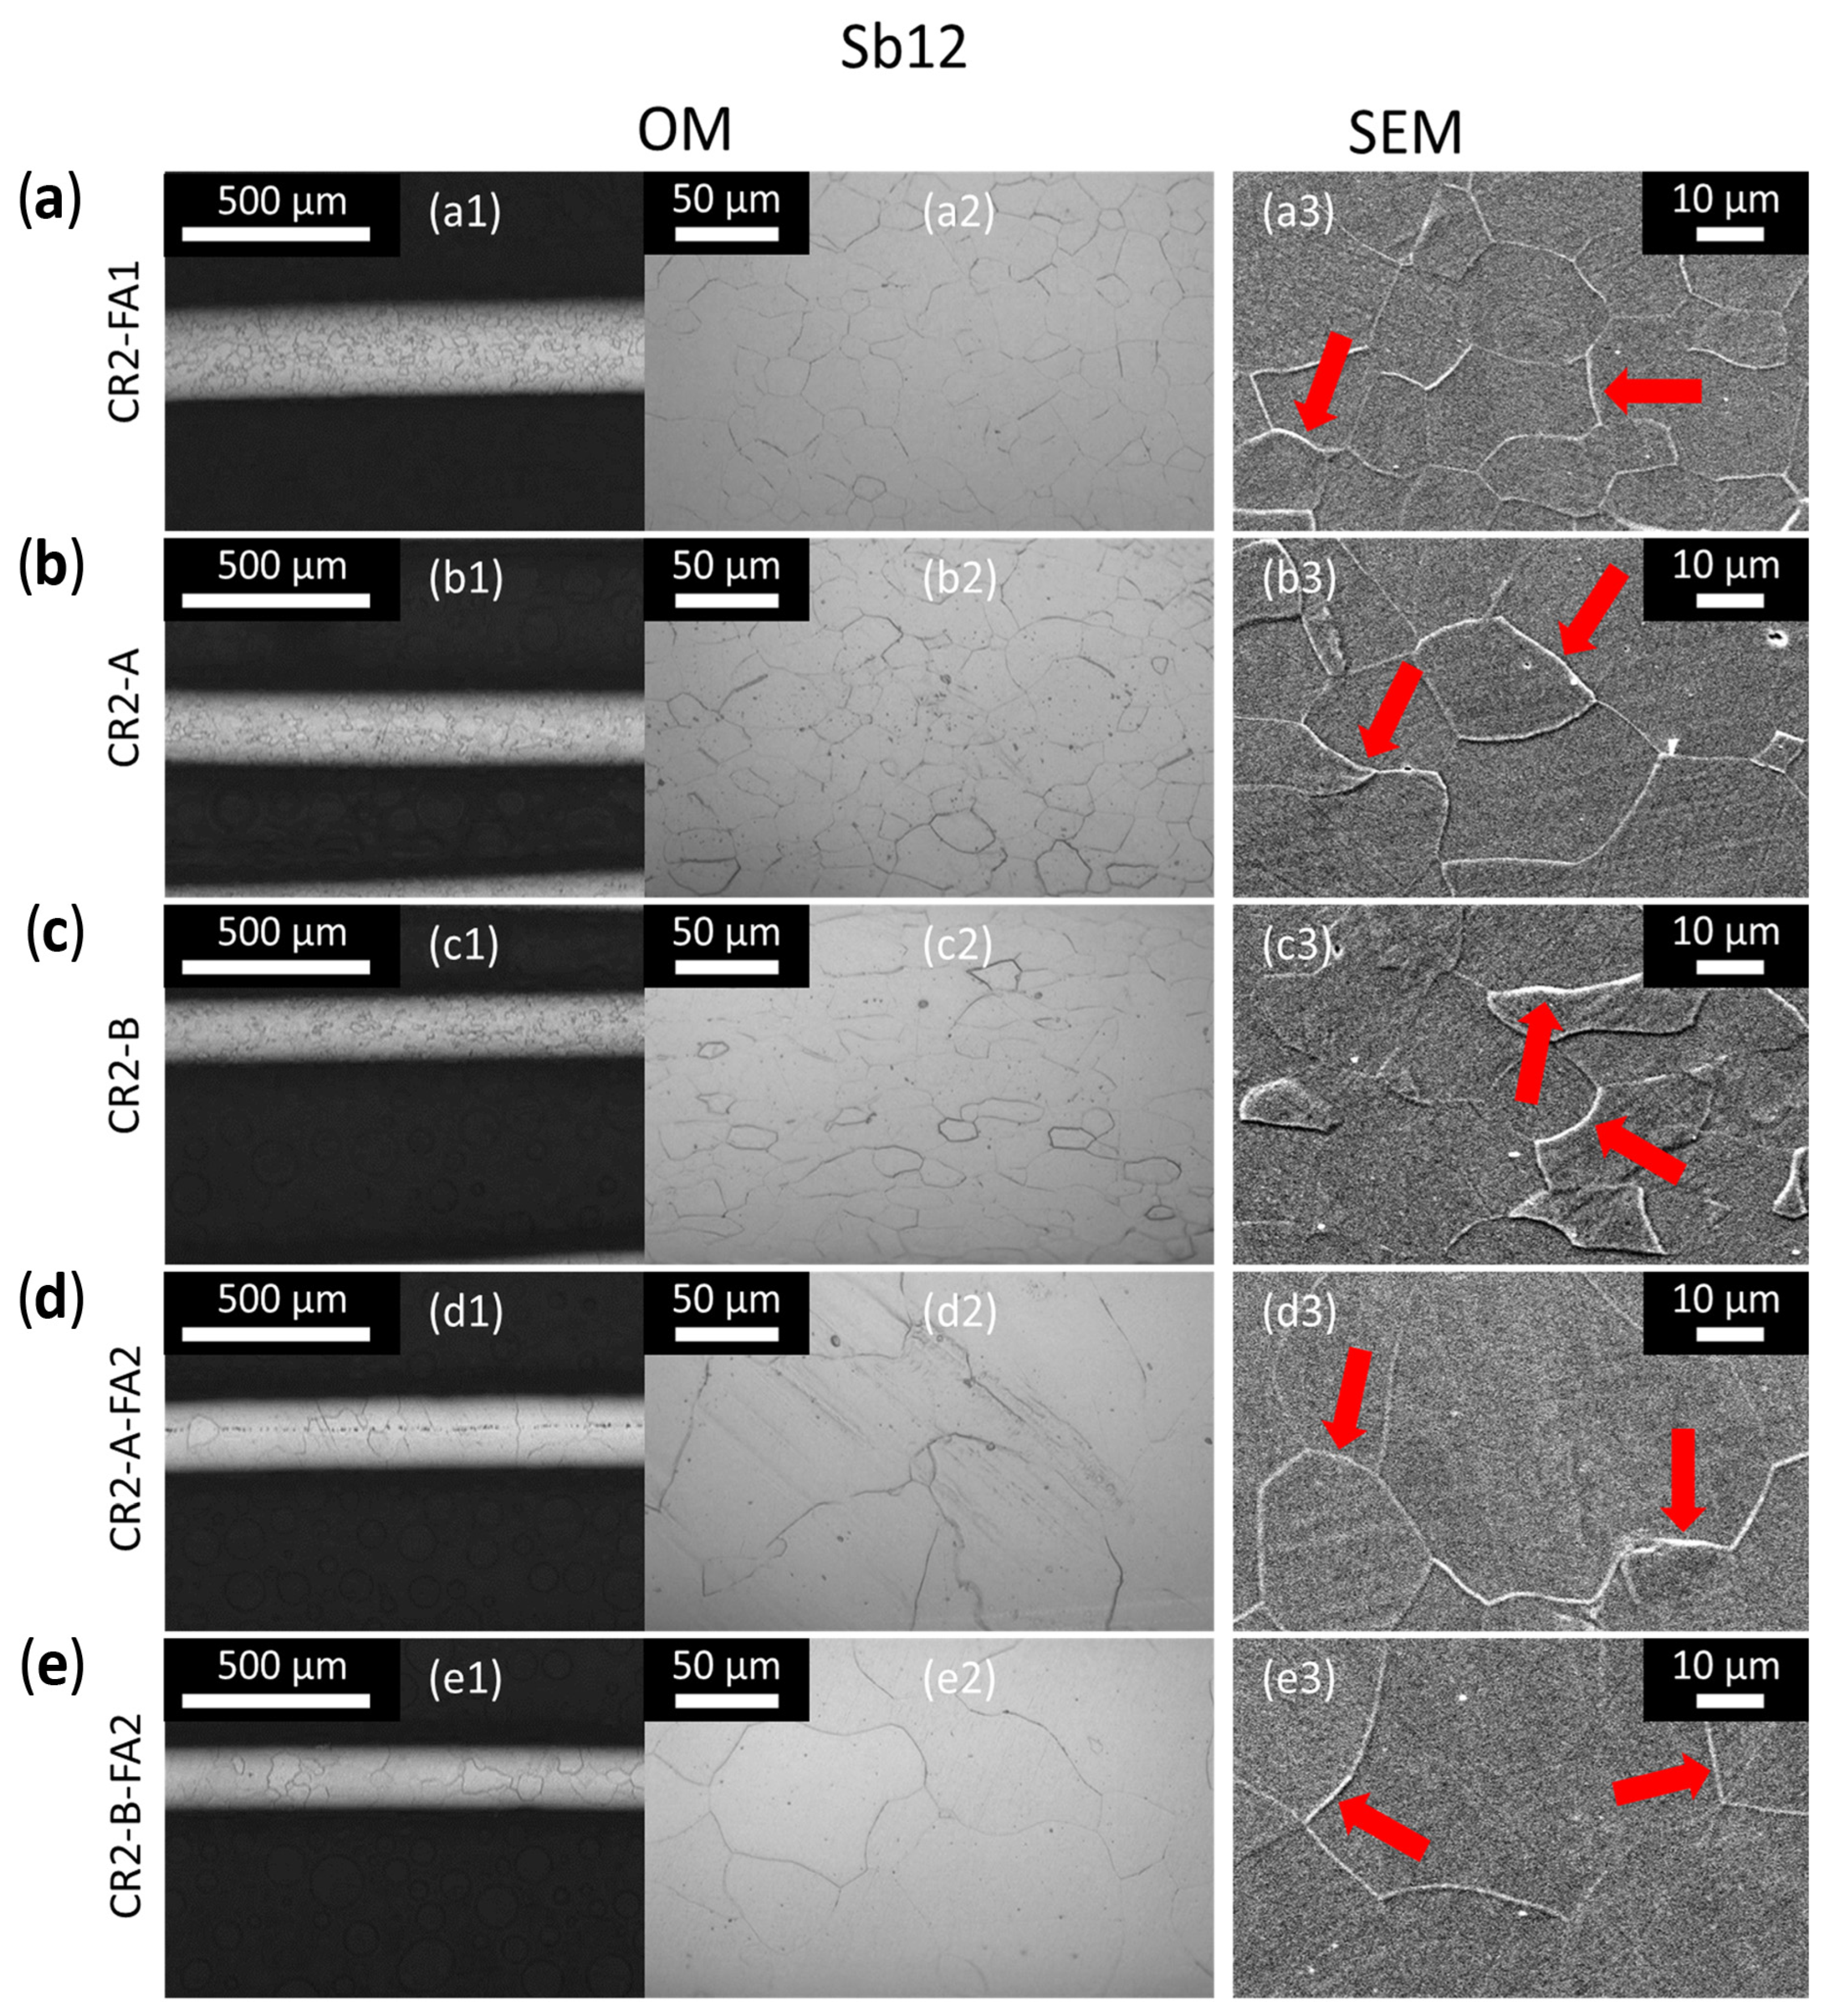
Figure 3 shows the microstructures of Sb8 and Sb12 steels (with ABCR), obtained after cold rolling (CR2 = 0.25 mm), first annealing (FA1 = 850 °C–10 min), additional thickness reduction (CR2-A = 20% and CR2-B = 30%) and second annealing (FA2 = 850 °C–10 min). The evolution of microstructure in Sb12 steel samples through the same steps is shown in Figure 4. Worthy of mention is that the cold-rolled steel samples with 0.25 mm thickness + first annealing at 850 °C–10 min, will be referred hereinafter to as “CR2-FA1-10”. Samples with additional deformations of 20% and 30% will be referred to as “CR2-A” and “CR2-B”, respectively, and after the second annealing (850 °C–10 min), they will be referred hereinafter to as “CR2-A-FA2” and “CR2-B-FA2”, respectively.
Figure 3.
Microstructure of Sb8 steel after the different cold rolling and annealing schedules: (a) cold rolling (0.25 mm) + first annealing at 850 °C for 10 min; after additional thickness reductions of 20% (b) and 30% (c); after second annealing (850 °C for 10 min) in samples previously subjected to thickness reductions of 20% (d) and (e) 30%. Optical images (numbers 1 and 2) and scanning electron microscopy images (number 3). Red arrows indicate the presence of carbides.
Figure 4.
Microstructure of Sb12 steel after the different cold rolling and annealing schedules: (a) cold rolling (0.25 mm) + first annealing at 850 °C for 10 min; after additional thickness reductions of 20% (b) and 30% (c); after second annealing (850 °C for 10 min) in samples previously subjected to thickness reductions of 20% (d) and (e) 30%. Optical images (numbers 1 and 2) and scanning electron microscopy images (number 3). Red arrows indicate the presence of carbides.
In the steels annealed at 850 °C for 10 min, a microstructure of equiaxed grains is observed in both steels (Figure 3 and Figure 4(a1,a2)). For thickness reductions of 20% (0.2 mm) and 30% (0.175 mm), equiaxed grains and elongated grains are observed as shown in Figure 3 and Figure 4(b1–c1,b2–c2). Annealing at 850 °C for 10 min of the steel with reduction of 20% produces a microstructure of equiaxed grains with a significant increase in grain size (Figure 3 and Figure 4(d1,d2)). The steel with a deformation of 30%, but with the same annealing treatment, shows a smaller grain size (Figure 3 and Figure 4(e1,e2)) compared with the steel subjected to 20% thickness reduction and a second annealing at 850 ° C for 10 min. Using scanning electron microscopy, it is observed that both steels exhibit the presence of carbides (white regions) at the ferrite grain boundaries; see Figure 3 and Figure 4(a3–e3). Microstructures of Figure 2, Figure 3 and Figure 4 without modifications are presented in the Supplementary Material.
Table 1 presents the grain size obtained through the different annealing schedules. Grain size obtained after the first annealing (FA1-8 = 850 °C–8 min) in CR1 is slightly larger for Sb8 steel with respect to Sb12 steel. Grain size of samples Sb8 (0.5 and 0.25 mm) subjected to annealing (850 °C–10 min) are, however, similar to each other compared to Sb12, which has a slightly larger grain size. After the second annealing (FA2 = 850 °C–10 min), the grain size of samples subjected to 20% thickness reduction is larger than that of samples with 30% thickness reduction. This behavior is observed in both steels Sb12 and Sb8. Furthermore, for each processing stage, the grain size of samples of Sb8 is larger, for thicknesses equal or lower than 0.5 mm, except for the CR2-B-FA2 condition.
Table 1.
Evolution of grain size for Sb12 and Sb8 steels through the different cold rolling and annealing schedules.
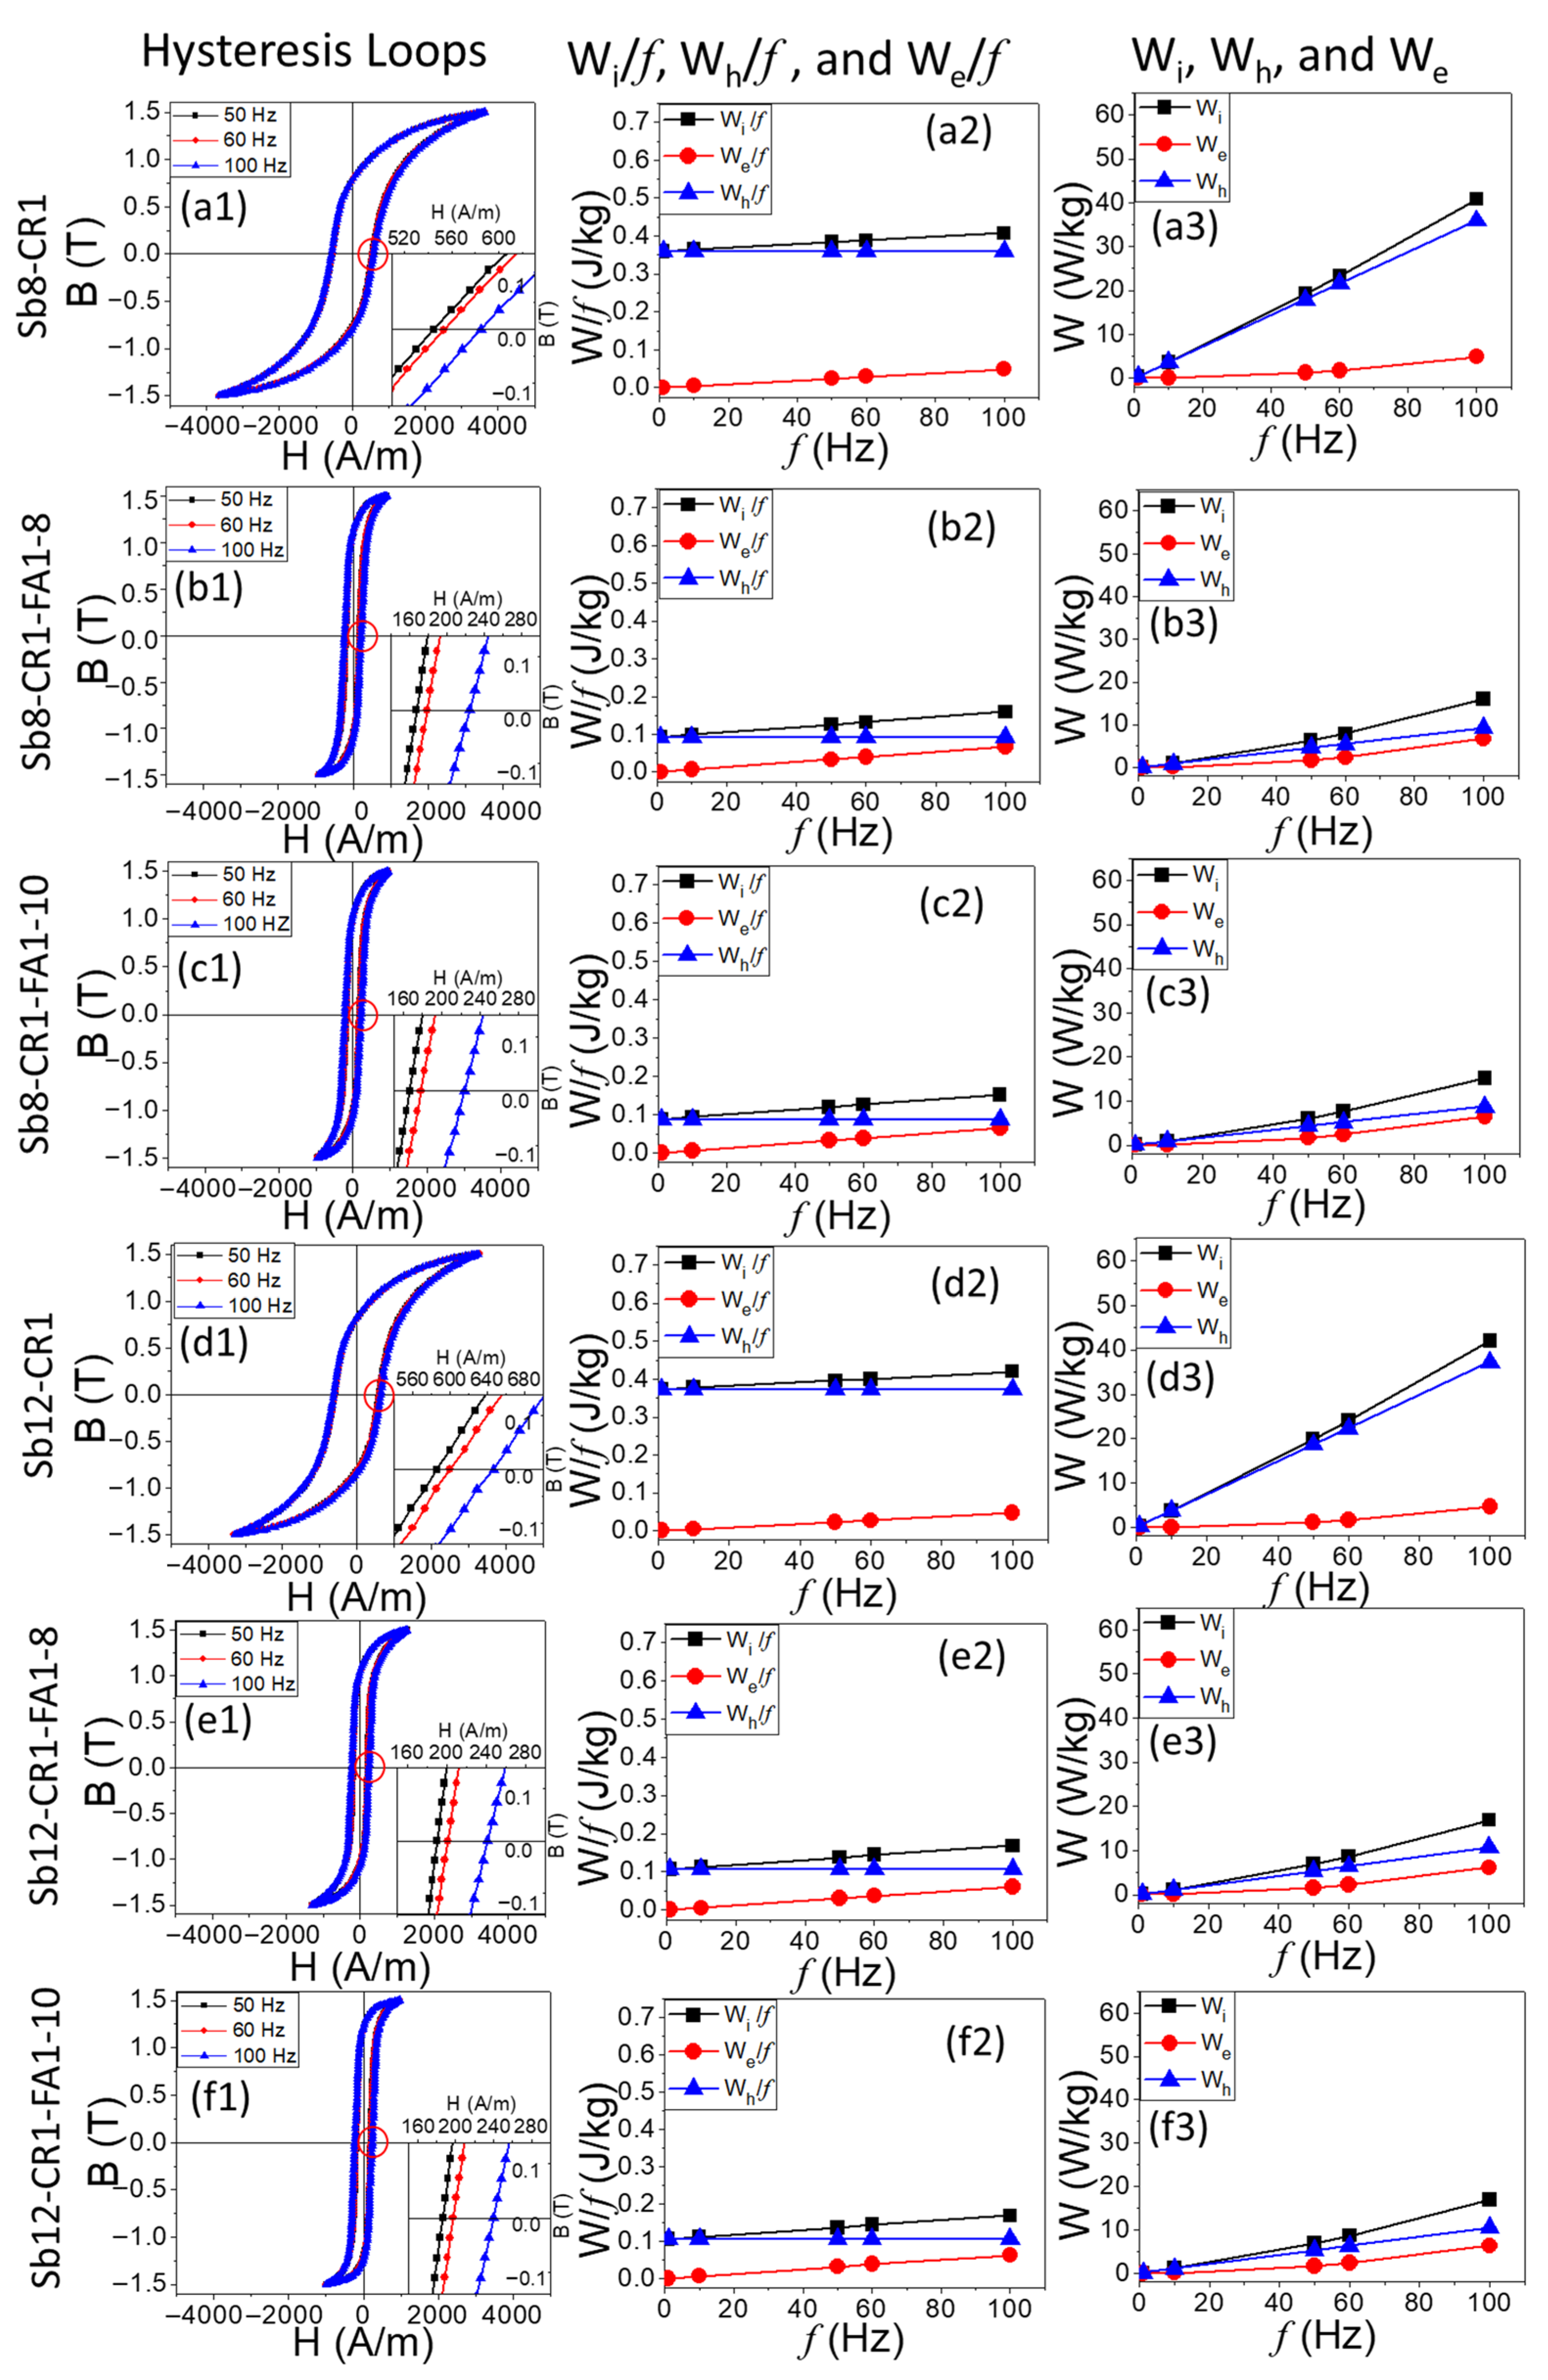
The magnetic properties of Sb8 and Sb12 steels after cold rolling to 0.5 mm and first annealing (850 °C, 8 and 10 min) are shown in Figure 5. As can be seen, in both steels, the hysteresis loops are wider after the cold-rolled condition, but after annealing, hysteresis loops become narrower. Additionally, the magnetic field required to reach the saturation magnetization (1.5 T) is also greater in steels after the cold rolling process (Figure 5(a1–f1)). As frequency increases (50, 60 and 100 Hz), the hysteresis loops become wider, in both steels, and for the different conditions, as observed in the inset of each hysteresis cycle for the area enclosed in the red circle (Figure 5(a1–f1)). The iron, hysteresis and eddy current loss coefficients as a function of frequency Wi/f, Wh/f and We/f, respectively, are shown in Figure 5(a2–f2). Variations in these coefficients indicate that, for both steels, hysteresis losses are greater than eddy current losses from 1 to 100 Hz. This effect is more significant in cold-rolled samples (Figure 5(a2,d2)). After final annealing, hysteresis losses are still greater than eddy current losses for low frequencies, but the difference among them is reduced with the increase in frequency. For 100 Hz, hysteresis losses and eddy current losses are very similar (Figure 5(b2–c2,e2–f2)), but in some cases, eddy current losses can be greater than hysteresis losses after annealing for 8 and 10 min. Considering the variation in hysteresis loss (Wh) and eddy current loss (We) with frequency, and its contribution to iron core loss (Wi = Wh + We) (Figure 5(a3–f3)), it can be observed that the contribution of Wh to Wi is much higher than the one of We in the cold-rolled condition (Figure 5(a3,d3)) and the contribution of eddy currents is even smaller after annealing (Figure 5(b3–c3,e3–f3)). In both steels, core losses at 50 Hz are smaller after final annealing at 850 °C for 10 min with 6.00 and 6.86 W/kg, for Sb8 and Sb12 steels, respectively (Figure 5(c3,f3)).
Figure 5.
Magnetic properties of Sb8 and Sb12 steels after cold rolling (0.5 mm thickness (CR1)) and further annealing at 850 °C for 8 min (CR1-FA1-8) and 10 min (CR1-FA1-10). Hysteresis cycles (a1–f1). Iron loss, hysteresis loss and eddy current loss coefficients divided by frequency (Wi/f, Wh/f and We/f) (a2–f2). Energy losses Wi (iron loss), Wh (hysteresis loss) and We (eddy current loss) (a3–f3).
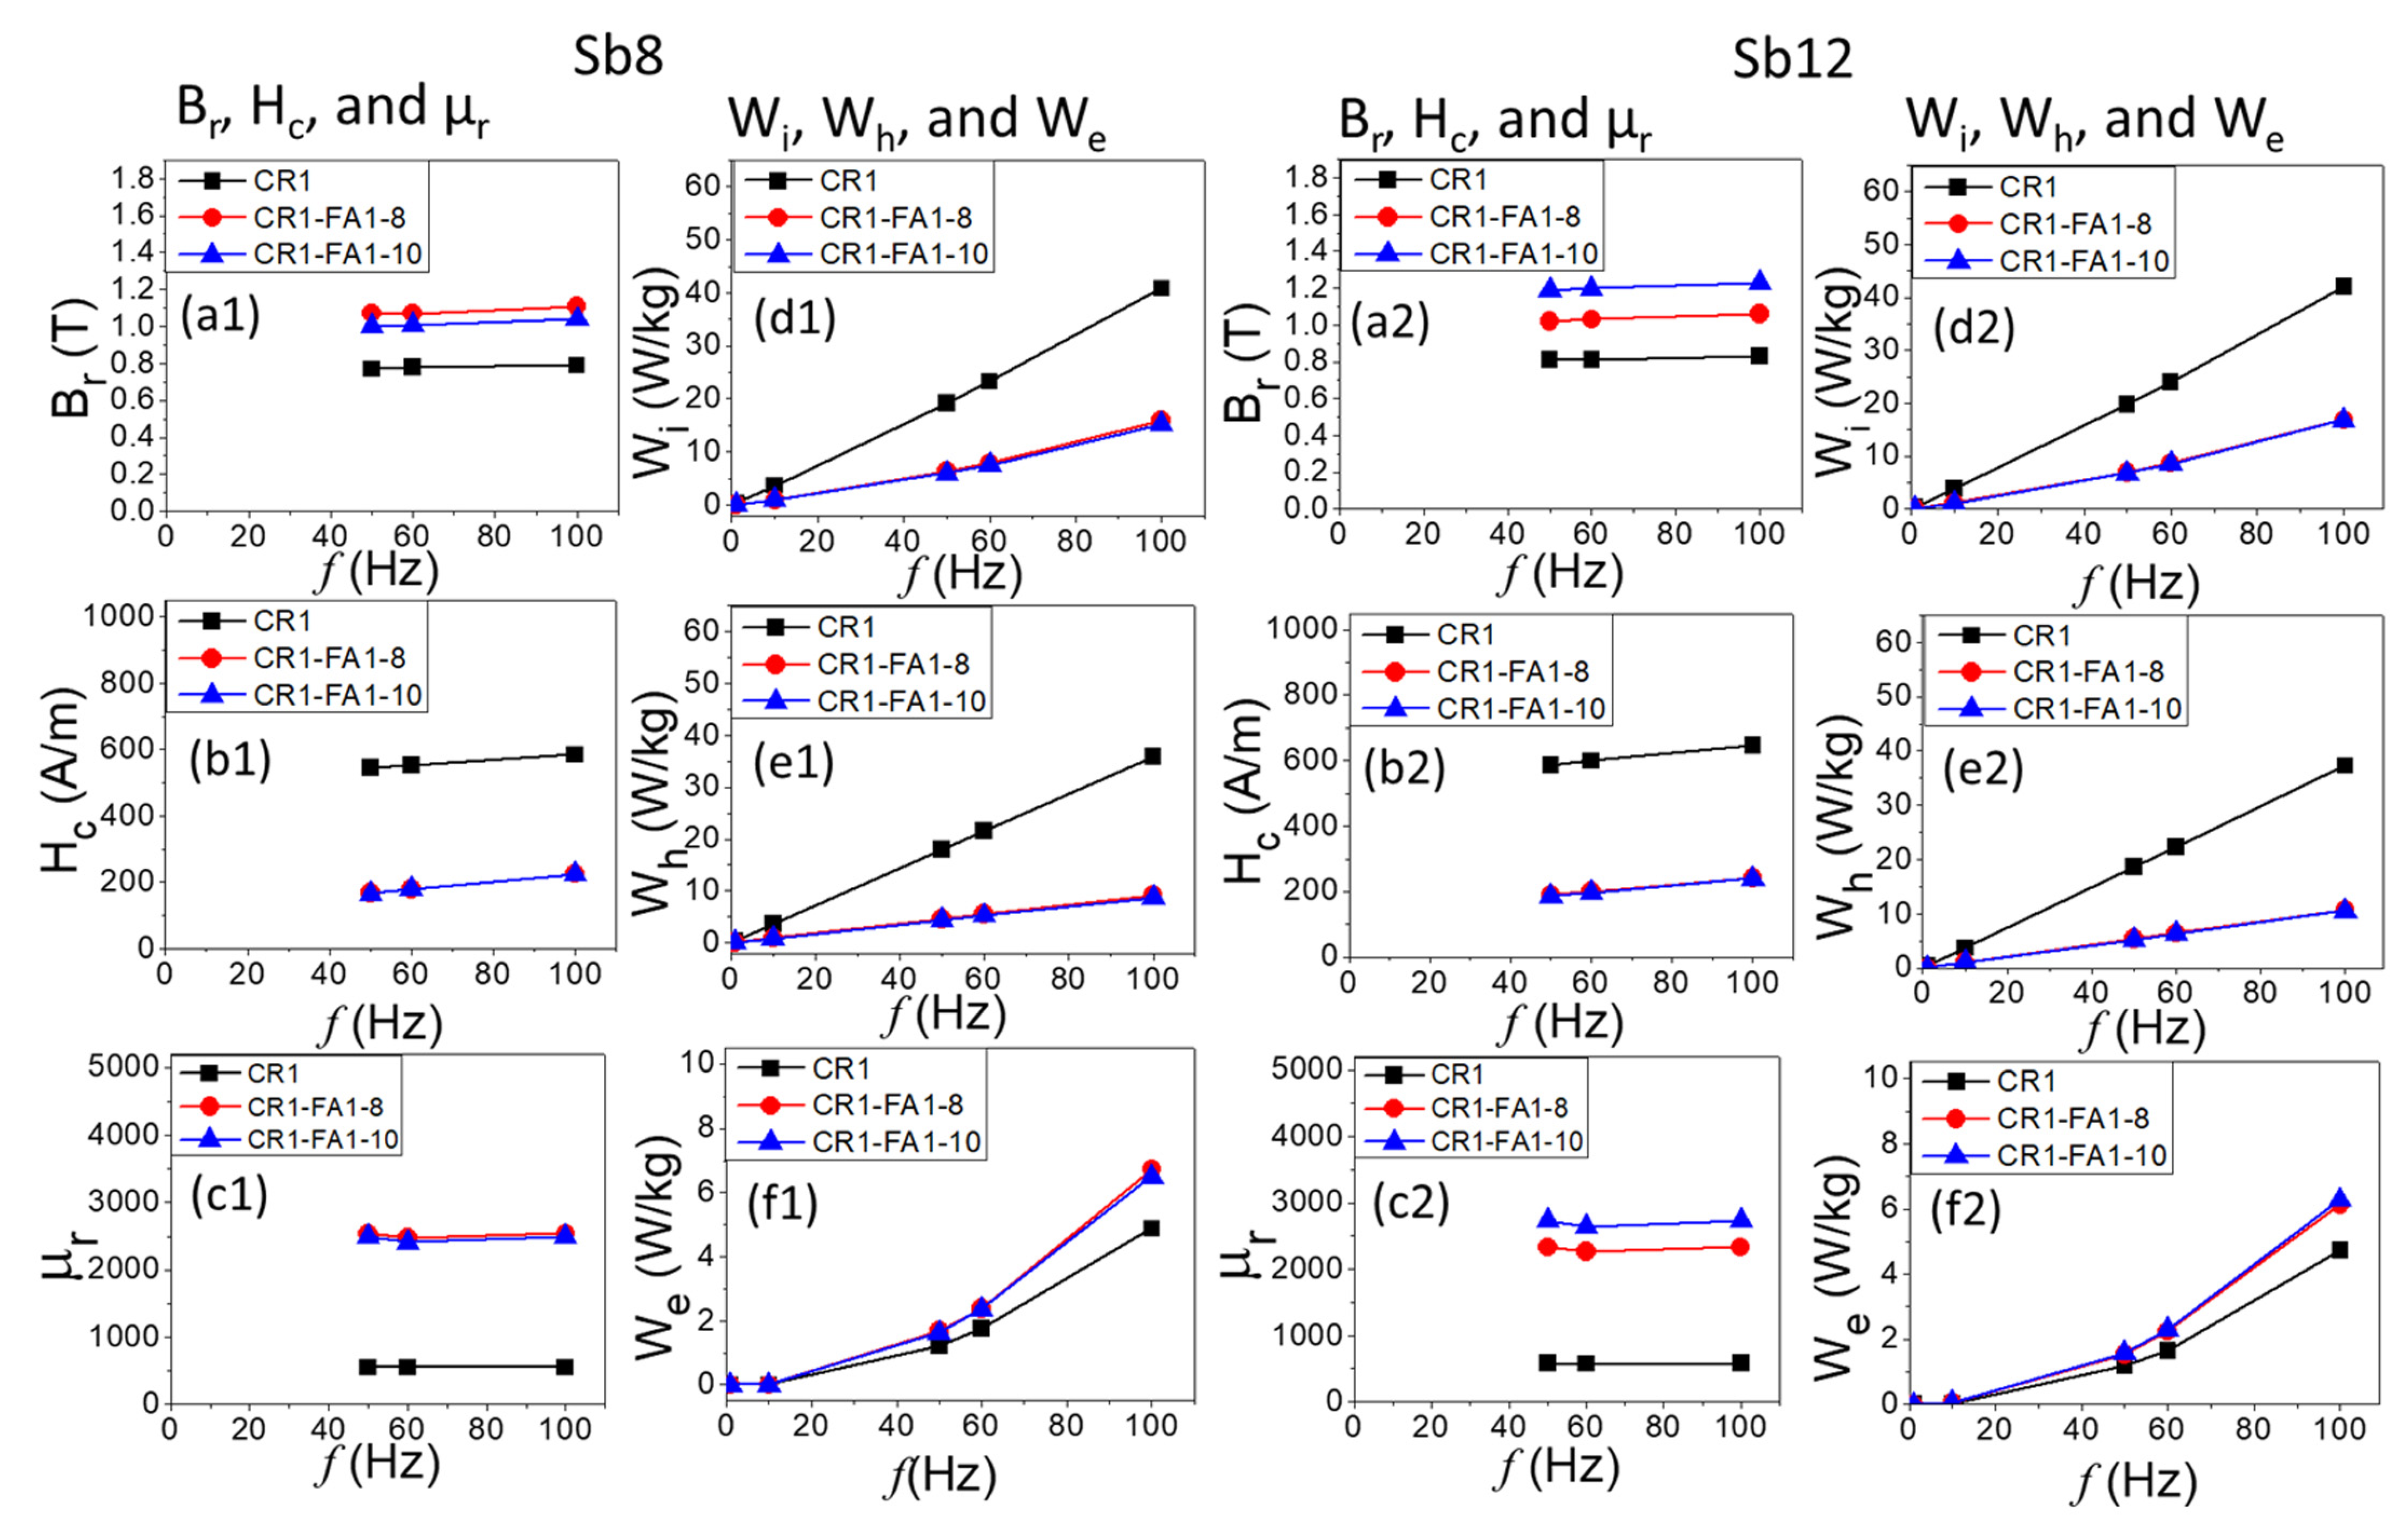
The magnetic properties (Br, Hc and µr) and losses (Wi, Wh and We) obtained from the hysteresis loops at different frequencies (50, 60 and 100 Hz) and different conditions (0.5 mm (CR1), CR1 + 850 °C–8 min (CR1-FA1-8) and CR1 + 850 °C–10 min (CR1-FA1-10)), in the Sb8 and Sb12 steels, are shown in Figure 6(a1–f1,a2–f2), respectively. In both steels (Sb8 and Sb12), a similar behavior is observed as described next: Br (Figure 6(a1,a2)) does not have a significant increase with the increase in frequency, but this property presents the lowest Br in the CR1 condition (0.8 T) in both steels. It increases after annealing in CR1-FA1-8 to Br = 1.07 T (50 Hz) for Sb8 steel, and it is even slightly higher after annealing in CR1-FA1-10 with a Br = 1.2 T (50 Hz) for Sb12 steel. Hc (Figure 6(b1,b2)) increases with the increase in frequency. The cold-rolled steel presents a high coercive field, but it is considerably less after annealing treatment at 850 °C for 8 and 10 min, being slightly lower for 10 min with Hc values of 178.4 and 186.3 A/m (at 50 Hz), for Sb8 and Sb12 steels, respectively. In the case of µr (Figure 6(c1,c2)), it does not present a significant effect as a function of frequency, but it changes with processing conditions: the lowest relative permeability values are observed under the CR1 condition of both steels, but annealing results in the highest µr. For Sb8 steel, the highest µr was 2542 (50 Hz) for the CR1-FA1-8 condition, and for Sb12 steel, the highest µr was 2736 (50 Hz) for the CR1-FA1-10 condition. Wi (Figure 6(d1,d2)) increases as frequency is increased. In both steels, Wi is higher in cold-rolled samples compared to annealed samples; in both steels, core losses are similar for 8 and 10 min of annealing (850 °C), with Wi = 6.0 W/kg (50 Hz) for the Sb8 steel, while in the Sb12 steels, Wi = 6.9 W/kg (at 50 Hz) after annealing.
Figure 6.
Magnetic properties of Sb8 and Sb12 steels subjected to ABCR (880 °C, 180 min), cold rolling up to 0.5 mm thickness and annealing at 850 °C for 8 and 10 min. Br-(a1,a2), Hc-(b1,b2), µr-(c1,c2), Wi-(d1,d2), Wh-(e1,e2) and We-(f1,f2).
3.3. Magnetic Properties of Sb8 and Sb12 Steels Subjected to Annealing (880 °C, 180 min), Cold Rolling (0.5 mm Thickness) and Annealing at 850 °C, 8 min (CR1-FA1-8) and 850 °C, 10 min (CR1-FA1-10)
In both steels, the contribution of Wh (Figure 6(e1,e2)) also exhibits an increase with the frequency and higher values for the cold-rolled steel compared to the annealed steel at 850 °C for 8 and 10 min. After annealing, Wh was similar for 8 and 10 min with Wh = 4.4 W/kg (at 50 Hz) in the Sb8 steel, while for the Sb12 steel, Wh = 5.3 W/kg (at 50 Hz). For both steels (Sb8 and Sb12), the contribution of We (Figure 6(f1,f2)) exhibits an increase with the increase in frequency, but it has a more significant increase from 60 Hz. Cold-rolled steel samples present lower We values compared to annealed steel samples. We values obtained in the Sb8 steel were 1.22, 1.68 and 1.62 W/kg (at 50 Hz) after cold rolling (CR), and subsequent annealing at 850 °C for 8 and 10 min, respectively; We values obtained for the Sb12 steel were 1.18, 1.53 and 1.57 W/kg (at 50 Hz) after CR and further annealing at 850 °C for 8 and 10 min, respectively.
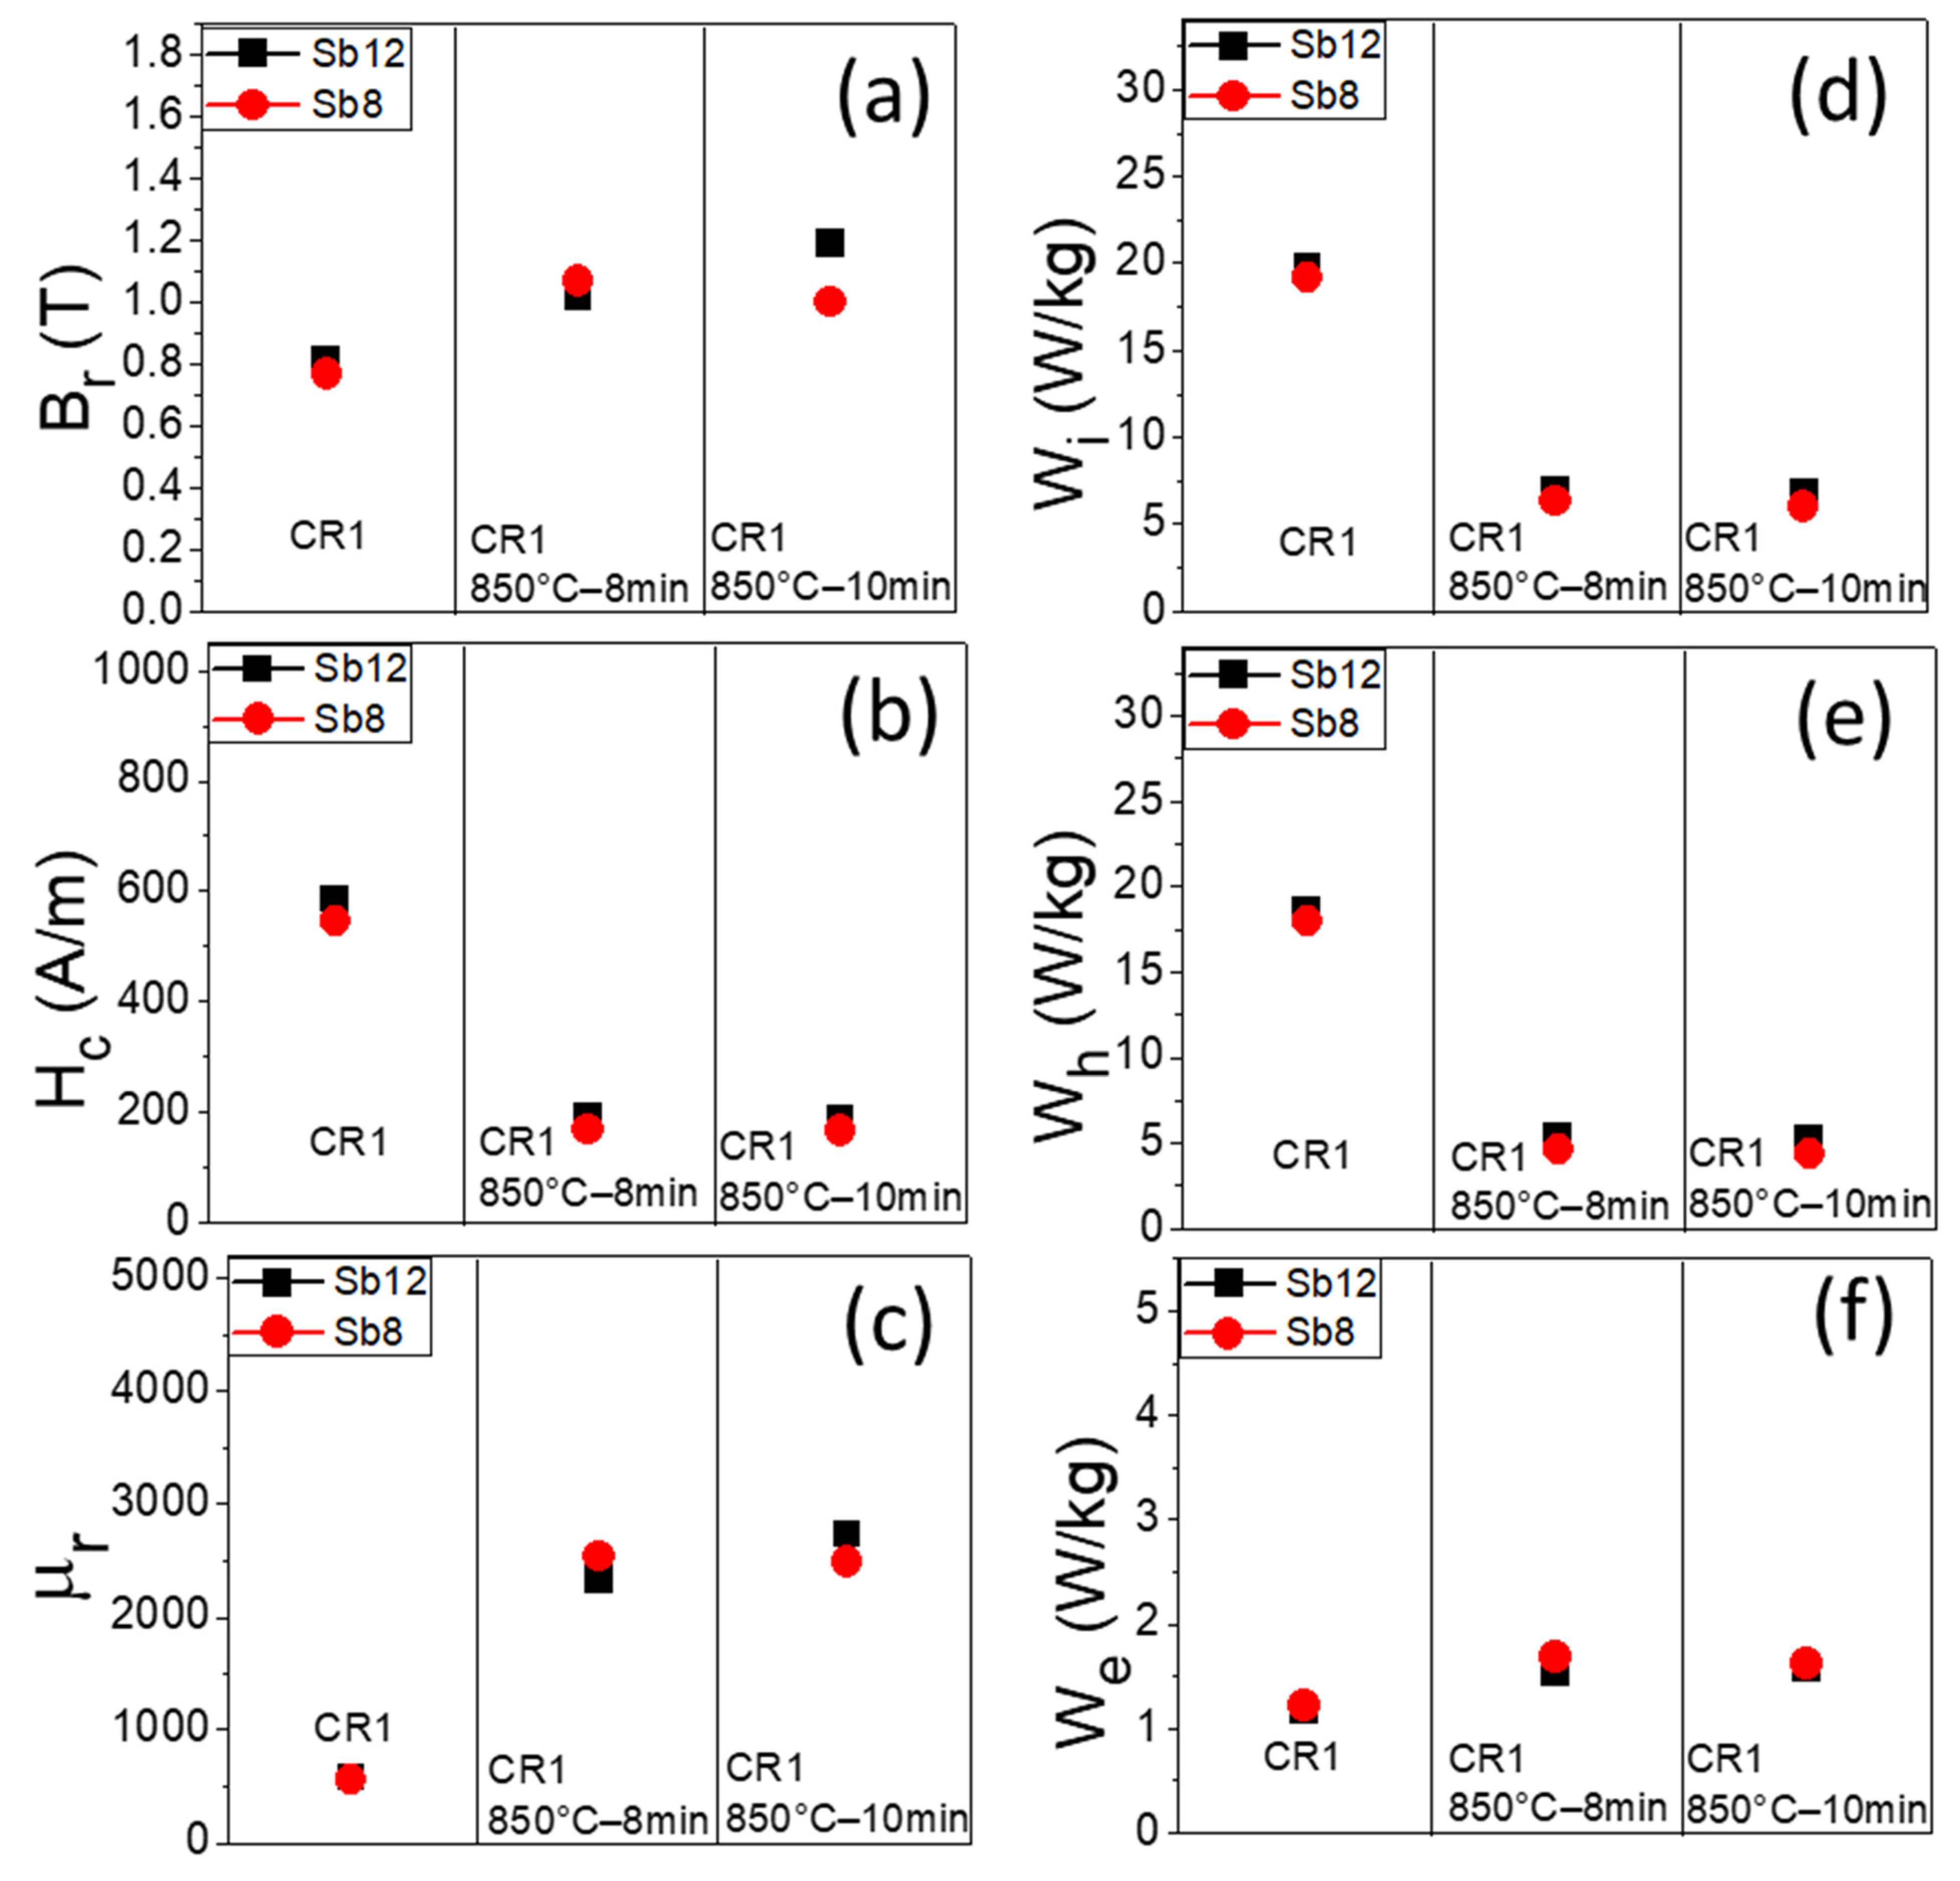
To evaluate the effect of hot rolling temperature on magnetic properties, Br, Hc, µr, Wi, Wh, and We (50 Hz) were compared in Figure 7, for Sb8 (red points) and Sb12 (black squares) steels. It is observed that, in the cold-rolled condition, Br (Figure 7a) is slightly higher for the Sb12 steel; after annealing at 850 °C for 8 min, Br is slightly higher in Sb8 steel, and at 850 °C for 10 min, Br is higher in Sb12 steel. Hc (Figure 7b) is slightly lower for Sb8 steel for all conditions. In both steels, µr is similar in the cold-rolled condition; after annealing at 850 °C for 8 min, µr is slightly higher in the Sb8 steel, and after thermal treatment at 850 °C for 10 min, µr is higher in the Sb12 steel(Figure 7c). In the three processing conditions: cold rolling, annealing at 850 °C–8 min and annealing 850 °C–10 min, the Sb8 steel presents lower Wi (Figure 7d). Wh in the Sb8 steel is also slightly lower in the three processing conditions (Figure 7e). Finally, it is observed that for these three conditions, the Sb12 steel presents lower We values (Figure 7f).
Figure 7.
Comparison between Br-(a), Hc-(b), µr-(c), Wi-(d), Wh-(e) and We-(f) for Sb8 and Sb12 steels after cold rolling up to 0.5 mm thickness and annealing at 850 °C for 8 and 10 min.
3.4. Magnetic Properties of Sb8 and Sb12 Steels Processed by the Two-Step Cold Rolling and Annealing Schedule
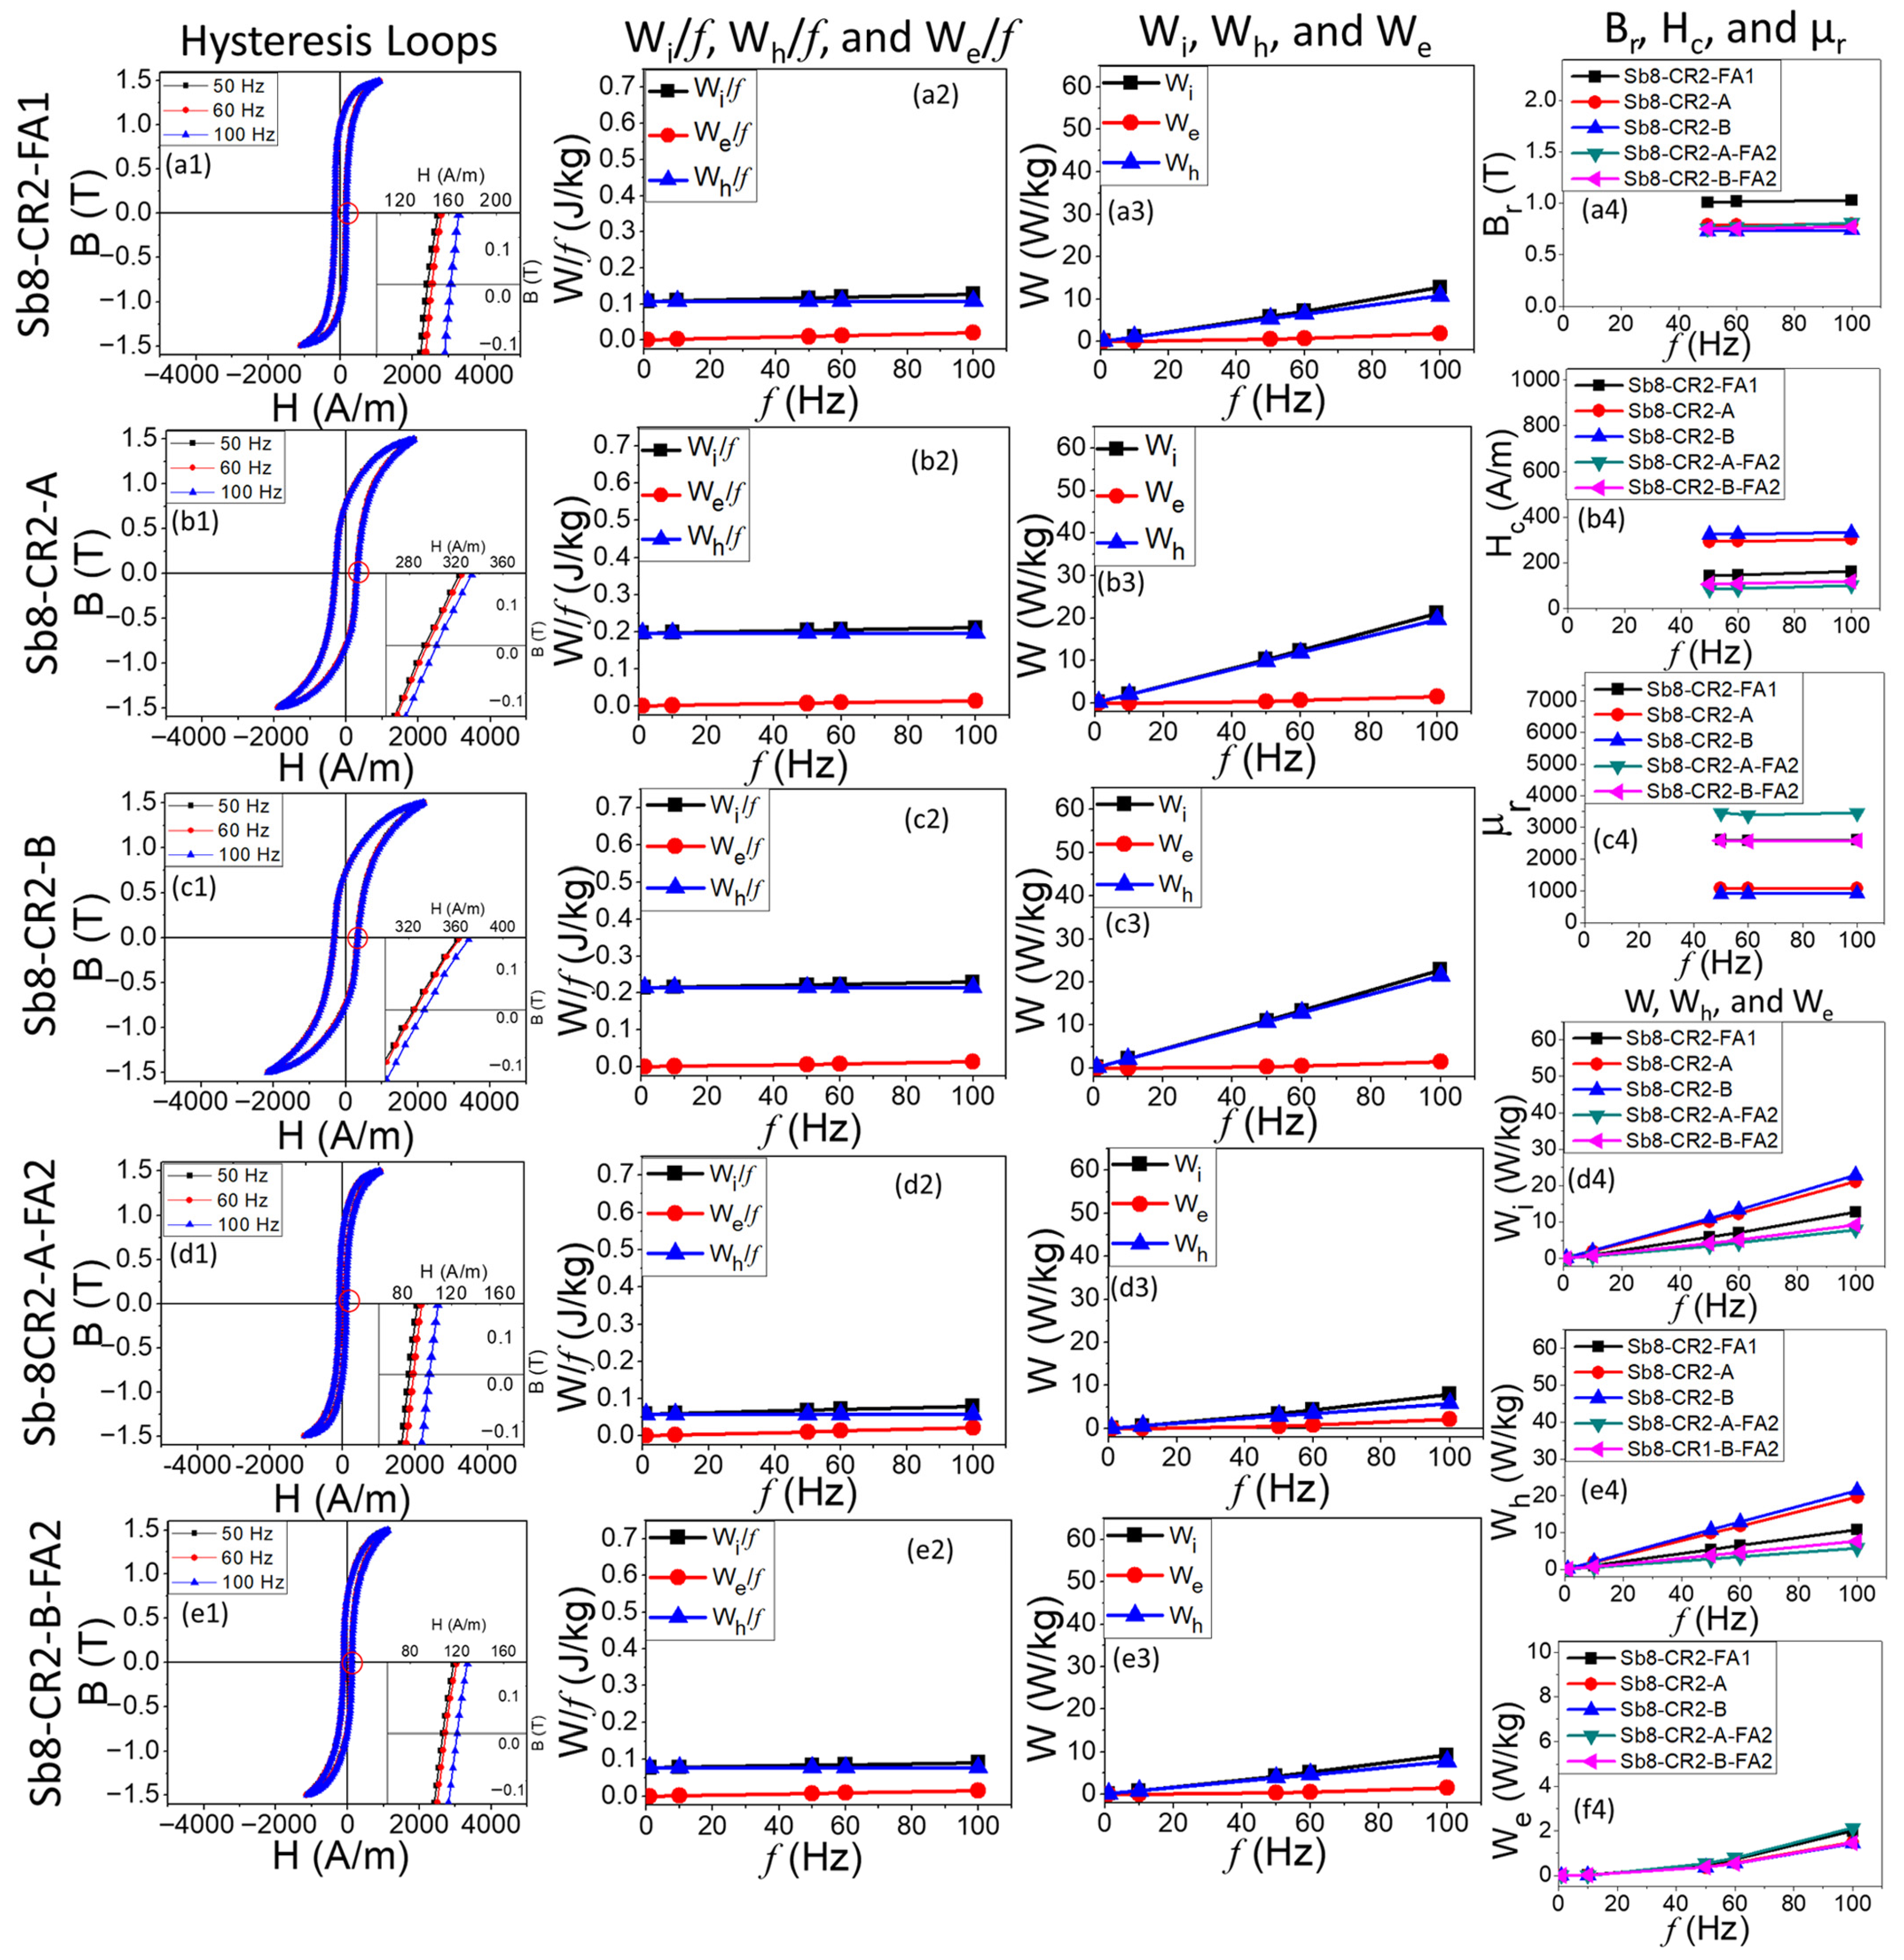
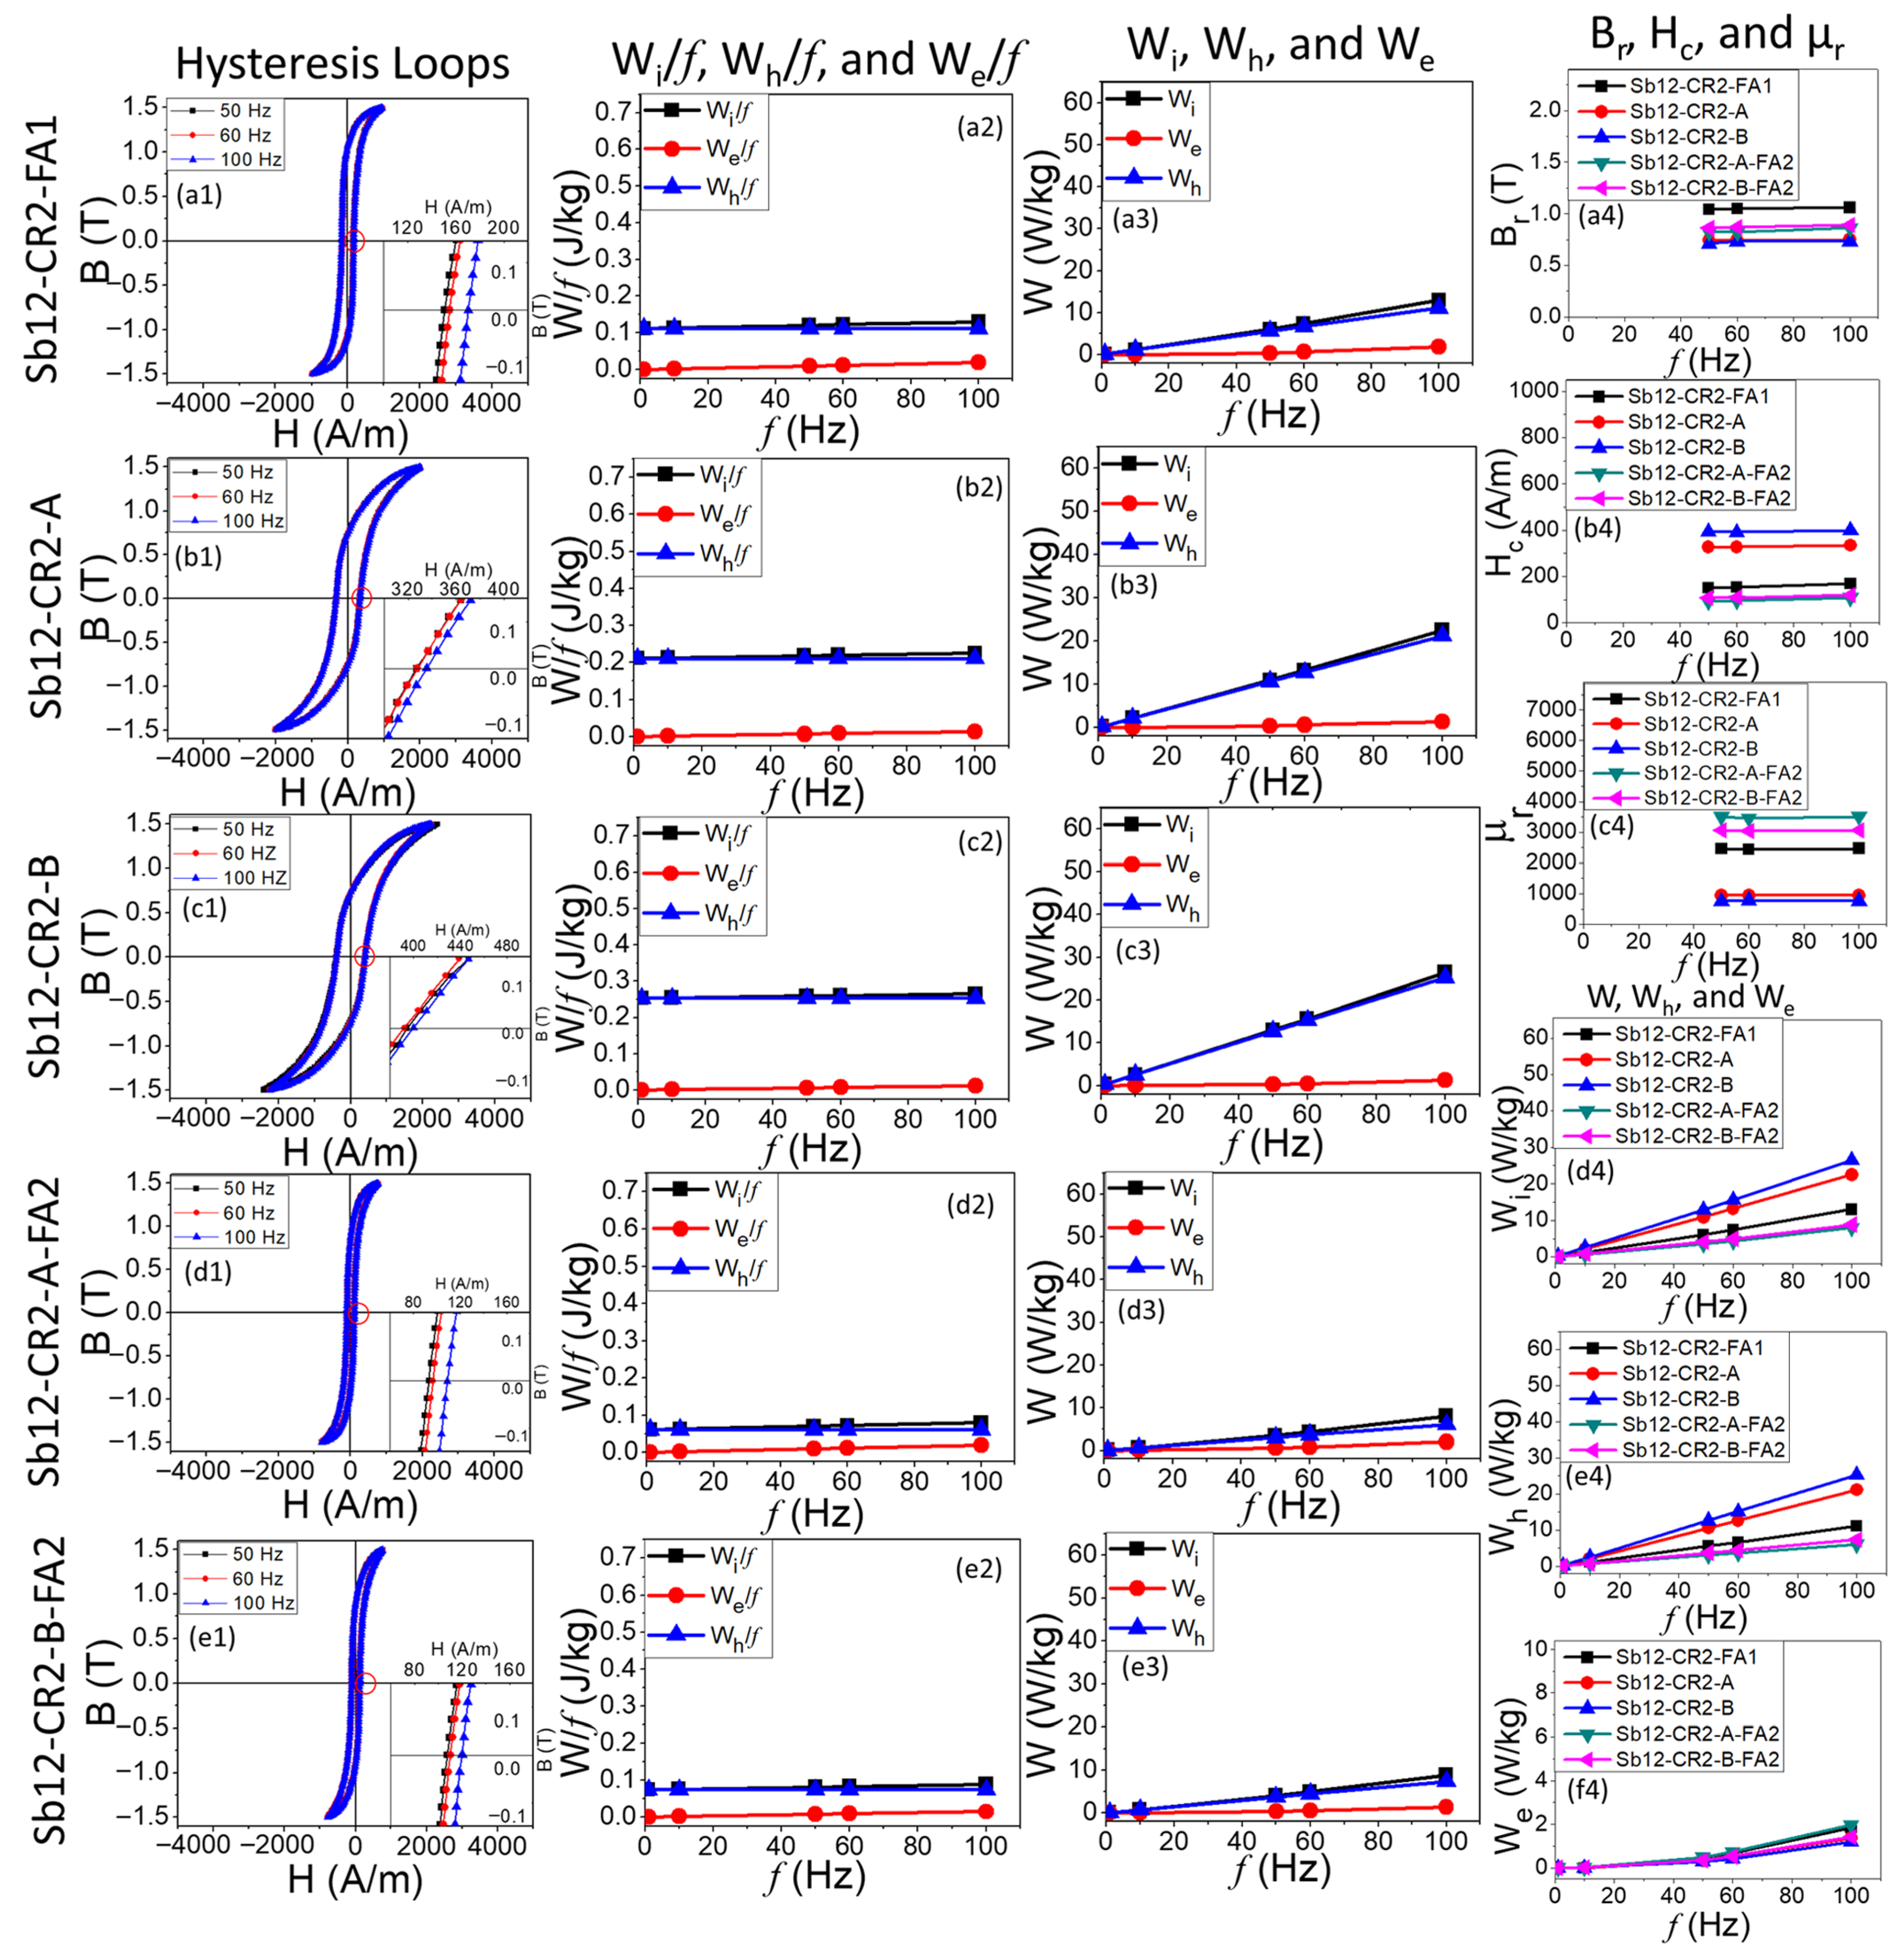
Figure 8 and Figure 9 show the magnetic properties of the Sb8 and Sb12 steels after cold rolling to 0.25 mm and subsequent annealing at 850 °C–10 min (CR2-FA1-10), second deformation of 20% (CR2-A) and 30% (CR2-B) (0.2 and 0.175 mm, respectively) and second annealing treatment conducted at 850 °C for 10 min ((CR2-A-FA2-10) and (CR2-B-FA2-10)).
Figure 8.
Magnetic properties of Sb8 steel after cold rolling (0.25 mm) with first annealing at 850 °C–10 min (CR2-FA1) (a1–a3), additional thickness reductions of 20% (CR2-A) (b1–b3) and 30% (CR2-B) (c1–c3) (0.20 mm and 0.175 mm), second annealing at 850 °C–10 min for thickness of 0.2 mm (CR2-A-FA2) (d1–d3) and 0.175 mm (CR2-B-FA2) (e1–e3); numbers 1, 2 and 3 for hysteresis loops, loss coefficients and energy losses, respectively. Br-(f1), Hc-(f2), µr-(f3), Wi-(g1), Wh-(g2), and We-(g3) for the different processing conditions.
Figure 9.
Magnetic properties of Sb12 steel after cold rolling (CR2 = 0.25 mm), first annealing at 850 °C–10 min (CR2-FA1) (a1–a3), additional thickness reductions of 20% (CR2-A) (b1–b3) and 30% (CR2-B) (c1–c3) (0.20 mm and 0.175 mm), second annealing at 850 °C–10 min for thickness of 0.2 mm (CR2-A-FA2) (d1–d3) and 0.175 mm (CR2-B-FA2) (e1–e3); numbers 1, 2 and 3 for hysteresis loops, loss coefficients and energy losses, respectively. Br-(f1), Hc-(f2), µr-(f3), Wi-(g1), Wh-(g2), and We-(g3) for the different processing conditions.
For the CR2-FA1-10 condition, the Sb8 and Sb12 steels show narrow hysteresis cycles; the applied field needed to reach a magnetic induction of 1.5 T was 1080 and 964 A/m, respectively, (Figure 8 and Figure 9(a1)). When steels are subjected to a deformation of 20 and 30%, the hysteresis loops are wider and require a larger field to reach 1.5 T: 1880 and 2000 A/m (CR2-A) (Figure 8 and Figure 9(b1)) and 2160 and 2418 A/m (CR2-B), for the Sb8 and Sb12 steels, respectively, (Figure 8 and Figure 9(c1)). The application of a second annealing leads to narrower hysteresis loops with a lower magnetic field to reach 1.5 T: 1030 and 768 A/m (CR2-A-FA2) (Figure 8 and Figure 9(d1)) and 1130 and 763 A/m (CR2-B-FA2) (Figure 8 and Figure 9(e1)). Inset figures in Figure 8 and Figure 9(a1–e1) show that hysteresis cycles are wider as frequency increases (50, 60 and 100 Hz) for both Sb8 and Sb12 steels in the annealed condition. However, in the as-deformed conditions (CR2-A and CR2-B), hysteresis cycles do not present a clear trend as a function of frequency (Figure 9(b1–c1)). In both steels (Sb8 and Sb12), changes in iron, hysteresis and eddy current loss coefficients as a function of frequency Wi/f, Wh/f and We/f, respectively (Figure 8 and Figure 9(a2–e2)), show that the loss contribution by hysteresis is greater than that of eddy current losses from 1 to 100 Hz. Furthermore, this hysteresis loss contribution is greater in deformed samples (Figure 8 and Figure 9(b2,c2)) compared to annealed samples (Figure 8 and Figure 9(a2,d2,e2)). For low frequencies, the contribution of hysteresis loss is still greater than that of eddy current losses, but these differences are reduced as the frequency increases (Figure 8 and Figure 9(a2–e2)).
In the case of core loss (iron loss (Wi), hysteresis loss (Wh), and eddy current loss (We) as a function of frequency (Figure 8 and Figure 9(a3–e3)) show that the contribution of hysteresis losses is greater than that of eddy current losses from 1 to 100 Hz. Also, according to the slope, deformed steels (20 and 30%) exhibit higher core losses with increase in frequency than annealed steels (Figure 8 and Figure 9(a3–e3)). The magnetic properties (Br, Hc and µr) at 50, 60 and 100 Hz and losses (Wi, Wh and We) at 1, 10, 50, 60 and 100 Hz under the different conditions are shown in Figure 8 and Figure 9(a4–c4,d4–f4), respectively, for Sb8 and Sb12 steels. Br (Figure 8 and Figure 9(a4)) shows only a marginal change with the increase in frequency, but this property, after second deformation (CR2-A and CR2-B) and second annealing (CR2-A-FA2 and CR2-B-FA2), is lower than the one obtained after the first annealing (CR2-FA1), where Br was about 1.0 T at 50 Hz, for both steels. Hc (Figure 8 and Figure 9(b4)) increases as the frequency is increased in all conditions. Hc increases with deformation (CR2-A and CR2-B), having higher values with respect to the previous annealing condition (CR2-FA1-10). The second annealing reduces Hc, leading to values even lower than those obtained after the first annealing (CR2-FA1). The lowest Hc is obtained in the CR2-A-FA2 condition with 85 and 93 A/m at 50 Hz for Sb8 and sb12 steels, respectively. The µr (Figure 8 and Figure 9(c4)) does not present a significant effect as a function of frequency, but it decreases as the deformation increases (CR2-A and CR2-B). Furthermore, the second annealing treatment (CR2-A-FA2 and CR2-B-FA2) produces an increase in µr, reaching a maximum value of 3450 for CR2-A-FA2 in Sb8 (Figure 8(c4)) steel and 3511 for CR2-B-FA2 in Sb12 steel (Figure 9(c4)), which is even higher than the condition with the first annealing (CR2-FA1). Wi (Figure 8 and Figure 9(d4)) shows an increase as the frequency increases for all conditions. For deformed steels, the increase in Wi with frequency (CR2-A and CR2-B) is higher than in samples subjected to first annealing (CR2-FA1), but in the steel with a second annealing (CR2-A-FA2 and CR2-B-FA2), losses are reduced with respect to its deformed condition and are even lower than for the steel with the first anneal (CR2-FA1). The lowest Wi values were obtained after the second annealing, in samples previously subjected to a second deformation of 20% (CR2-A-FA2), 3.44 (in steel Sb8) and 3.5 W/kg (in steel Sb12).
Comparing the Wi in condition CR2-FA1, with respect to conditions CR2-A-FA2 and CR2-B-FA2 in Sb8 steel, Wi is reduced by 41.2% and 27.7%, respectively, and comparing the same conditions in Sb12 steel, Wi is reduced by 41.5% and 32.7% for conditions CR2-A-FA2 and CR2-B-FA2, respectively (Figure 8 and Figure 9(d4)).
Wh (Figure 8 and Figure 9(e4)) and We (Figure 8 and Figure 9(f4)) contribute to Wi in both steels (Sb8 and Sb12); Wh presents similar behavior to Wi, but We has a faster increase from 60 Hz. By looking at the individual contributions of Wh and We, for a frequency of 50 Hz, it can be seen that the greatest contribution to Wi comes from Wh. For Sb8 steel, Wh is reduced by 46.0% and 28.1% for the CR2-A-FA2 and CR2-B-FA2 conditions, respectively, compared to Wh of CR2-FA1 condition (Figure 8e). However, We increases by 12.6% and decreases 23.2% for the CR2-A-FA2 and CR2-B-FA2 condition, respectively, compared to We of the CR2-FA1 condition (Figure 8f). For Sb12 steel, Wh is reduced by 45.6% and 33.6% for the CR2-A-FA2 and CR2-B-FA2 conditions, respectively, compared to Wh of the CR2-FA1 condition (Figure 9e). Furthermore, We increases by 8.8% and decreases by 21.1% for the CR2-A-FA2 and CR2-B-FA2 conditions, compared to We of the CR2-FA1 condition (Figure 9f).
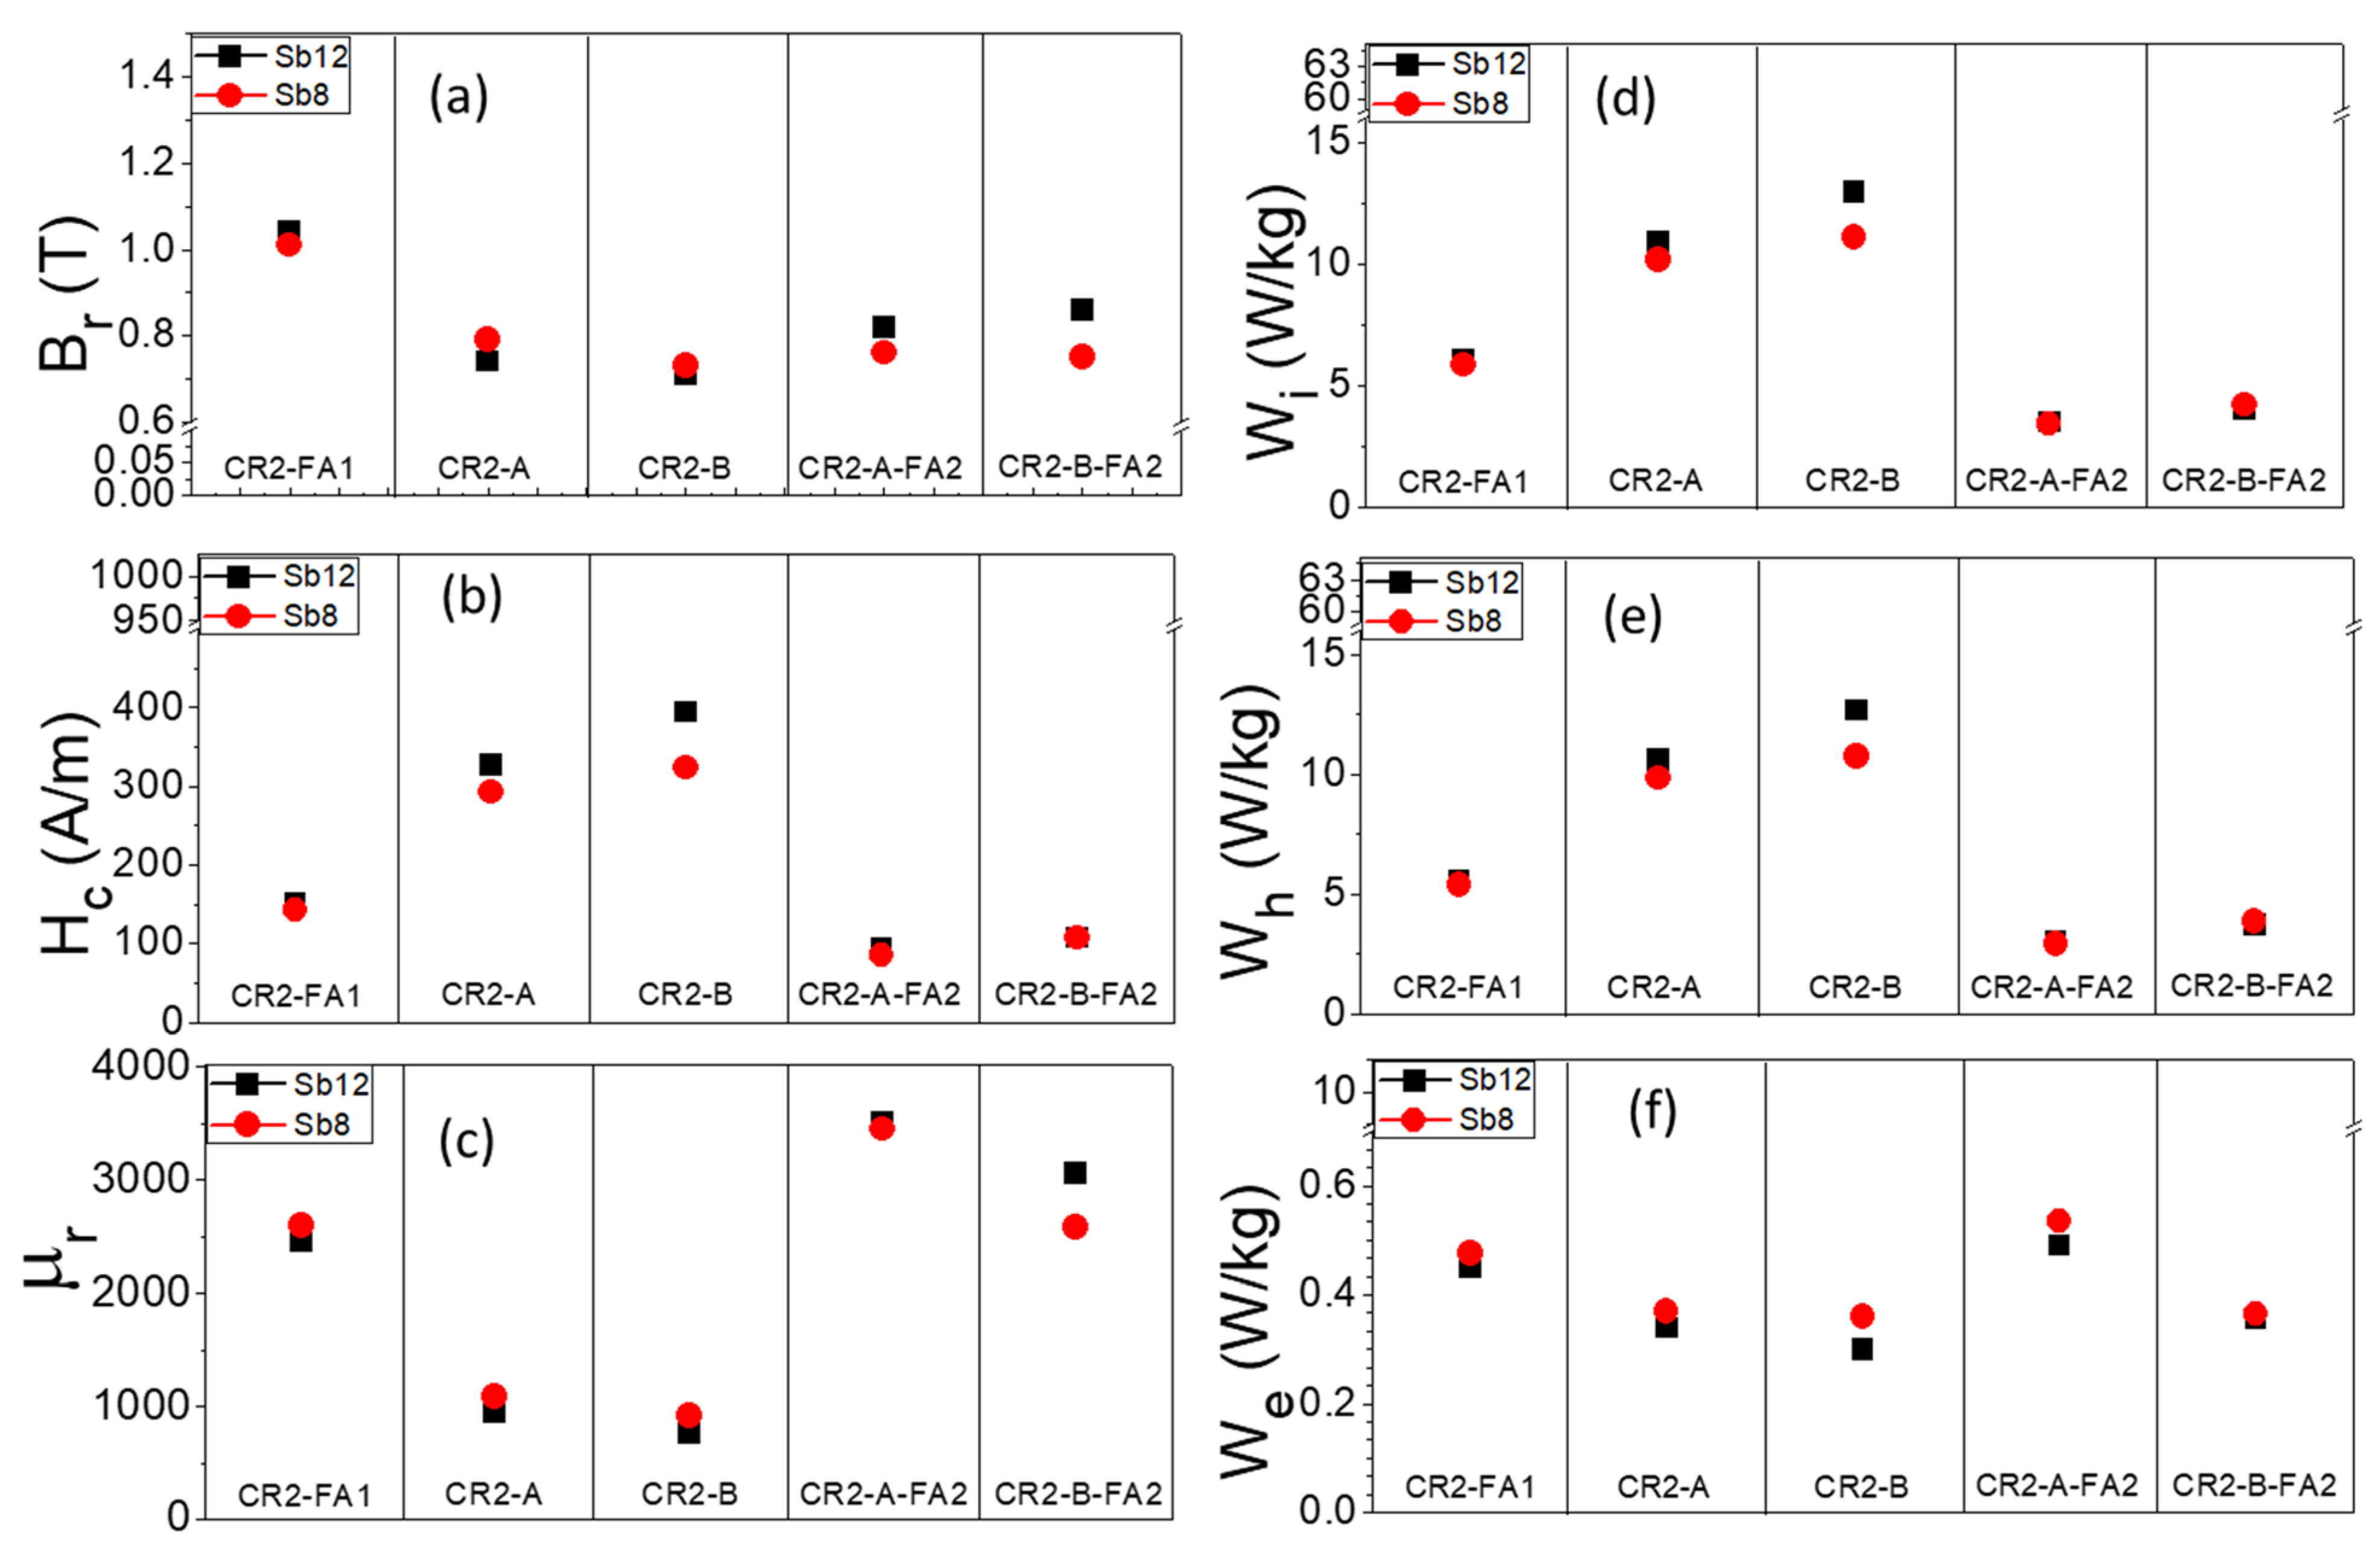
Figure 10 shows a comparison between the magnetic properties of Sb8 and Sb12 steels measured at 50 Hz (based on the results of Figure 8 and Figure 9). This shows the effect of hot rolling temperature and processing conditions. It is worth mentioning that non-oriented grain electrical steels are desired to have a high Br, low Hc, high µr, low Wi, low Wh and low We, so reference is made to the lowest or highest value. Br (Figure 10a) in the Sb12 steel has a higher value in the CR2-FA1 condition; for the deformed condition, 20 and 30% (CR2-A and CR2-B), the Sb8 steel has a higher Br, but both reduce their Br with respect to CR2-FA1. After the second annealing (CR2-A-FA2 and CR2-B-FA2), the Sb12 steel has higher Br, and in both cases, the Br is lower with respect to the CR2-FA1; however, Br in the Sb8 steel is similar for CR2-A, CR2-B, CR2-A-FA2 and CR2-B-FA2, but Br in the Sb12 steel increases in CR2-A-FA2 and CR2-B-FA2 with respect to CR2-A and CR2-B. Hc (Figure 10b) in the Sb8 steel has a lower value in the CR2-FA1 condition; after the deformation of 20% and 30% (CR2-A and CR2-B), the Sb8 steel continues to show lower values under these conditions, and both steels (Sb12 and Sb8) exhibit an increase in Hc with respect to CR2-FA1. After the second annealing (CR2-A-FA2 and CR2-B-FA2), both steels reduce their Hc with respect to the deformed condition, which are even lower than for the condition CR2-FA1. Moreover, the lower Hc is found in the condition CR2-A-FA2 for the Sb8 steel. Regarding µr (Figure 10c), it is higher in Sb8 steel compared to Sb12 steel under the conditions CR2-FA1, CR2-A and CR2-B, but for the CR2-A-FA2 and CR2-B-FA2 conditions, µr is greater in Sb12 steel compared to Sb8 steel. Furthermore, it is observed that the deformed conditions present lower values of µr, and after the second annealing, this property increases in both steels. The maximum value of µr is found in the Sb12 steel for the condition CR2-A-FA2.
Figure 10.
Comparison between magnetic properties Br-(a), Hc-(b), µr-(c), Wi-(d), Wh-(e), We-(f) for Sb8 (red) and Sb12 (black) steels after cold rolling (CR2 = 0.25 mm thickness), annealing at 850 °C–10 min (CR2-FA), second deformation of 20% (CR2-A) and 30% (CR2-B) (0.2 mm and 0.175 mm, respectively) and second annealing (CR-A-FA2) and (CR-B-FA2), respectively.
Wi (Figure 10d) increases in CR2-A and CR2-B with respect to the condition CR2-FA1. After the second final annealing (CR2-A-FA2 and CR2-B-FA2), Wi is lower than in deformed conditions (CR2-A and CR2-B) and even lower than for condition CR2-FA1. In all conditions, Sb8 steel presents lower Wi values with respect to Sb12 steel, except for CR2-B-FA2. The lowest core loss value is observed in the CR2-A-FA2 condition. In all conditions, Wh (Figure 10e) has a similar behavior to Wi (Figure 10d). Finally, We (Figure 10f) is slightly lower in Sb12 steel for all conditions.
Furthermore, We decreases in conditions CR2-A and CR2-B compared to condition CR2-FA1 in both steels. However, after the second final annealing, on the one hand, We is higher in CR2-A-FA2 compared to CR2-A and it is even higher than in condition CR2-FA1, and on the other hand, in CR2-B-FA2, We is similar to CR2-B, but lower than in CR2-FA1. In all conditions, the Sb12 steel has a lower We compared to the Sb8 steel. The lowest We is observed in condition CR2-B.
3.5. Effects of Deformation Level, Thickness, and Grain Size on the Magnetic Properties of Sb8 and Sb12 Steels with 3D Surface Analysis
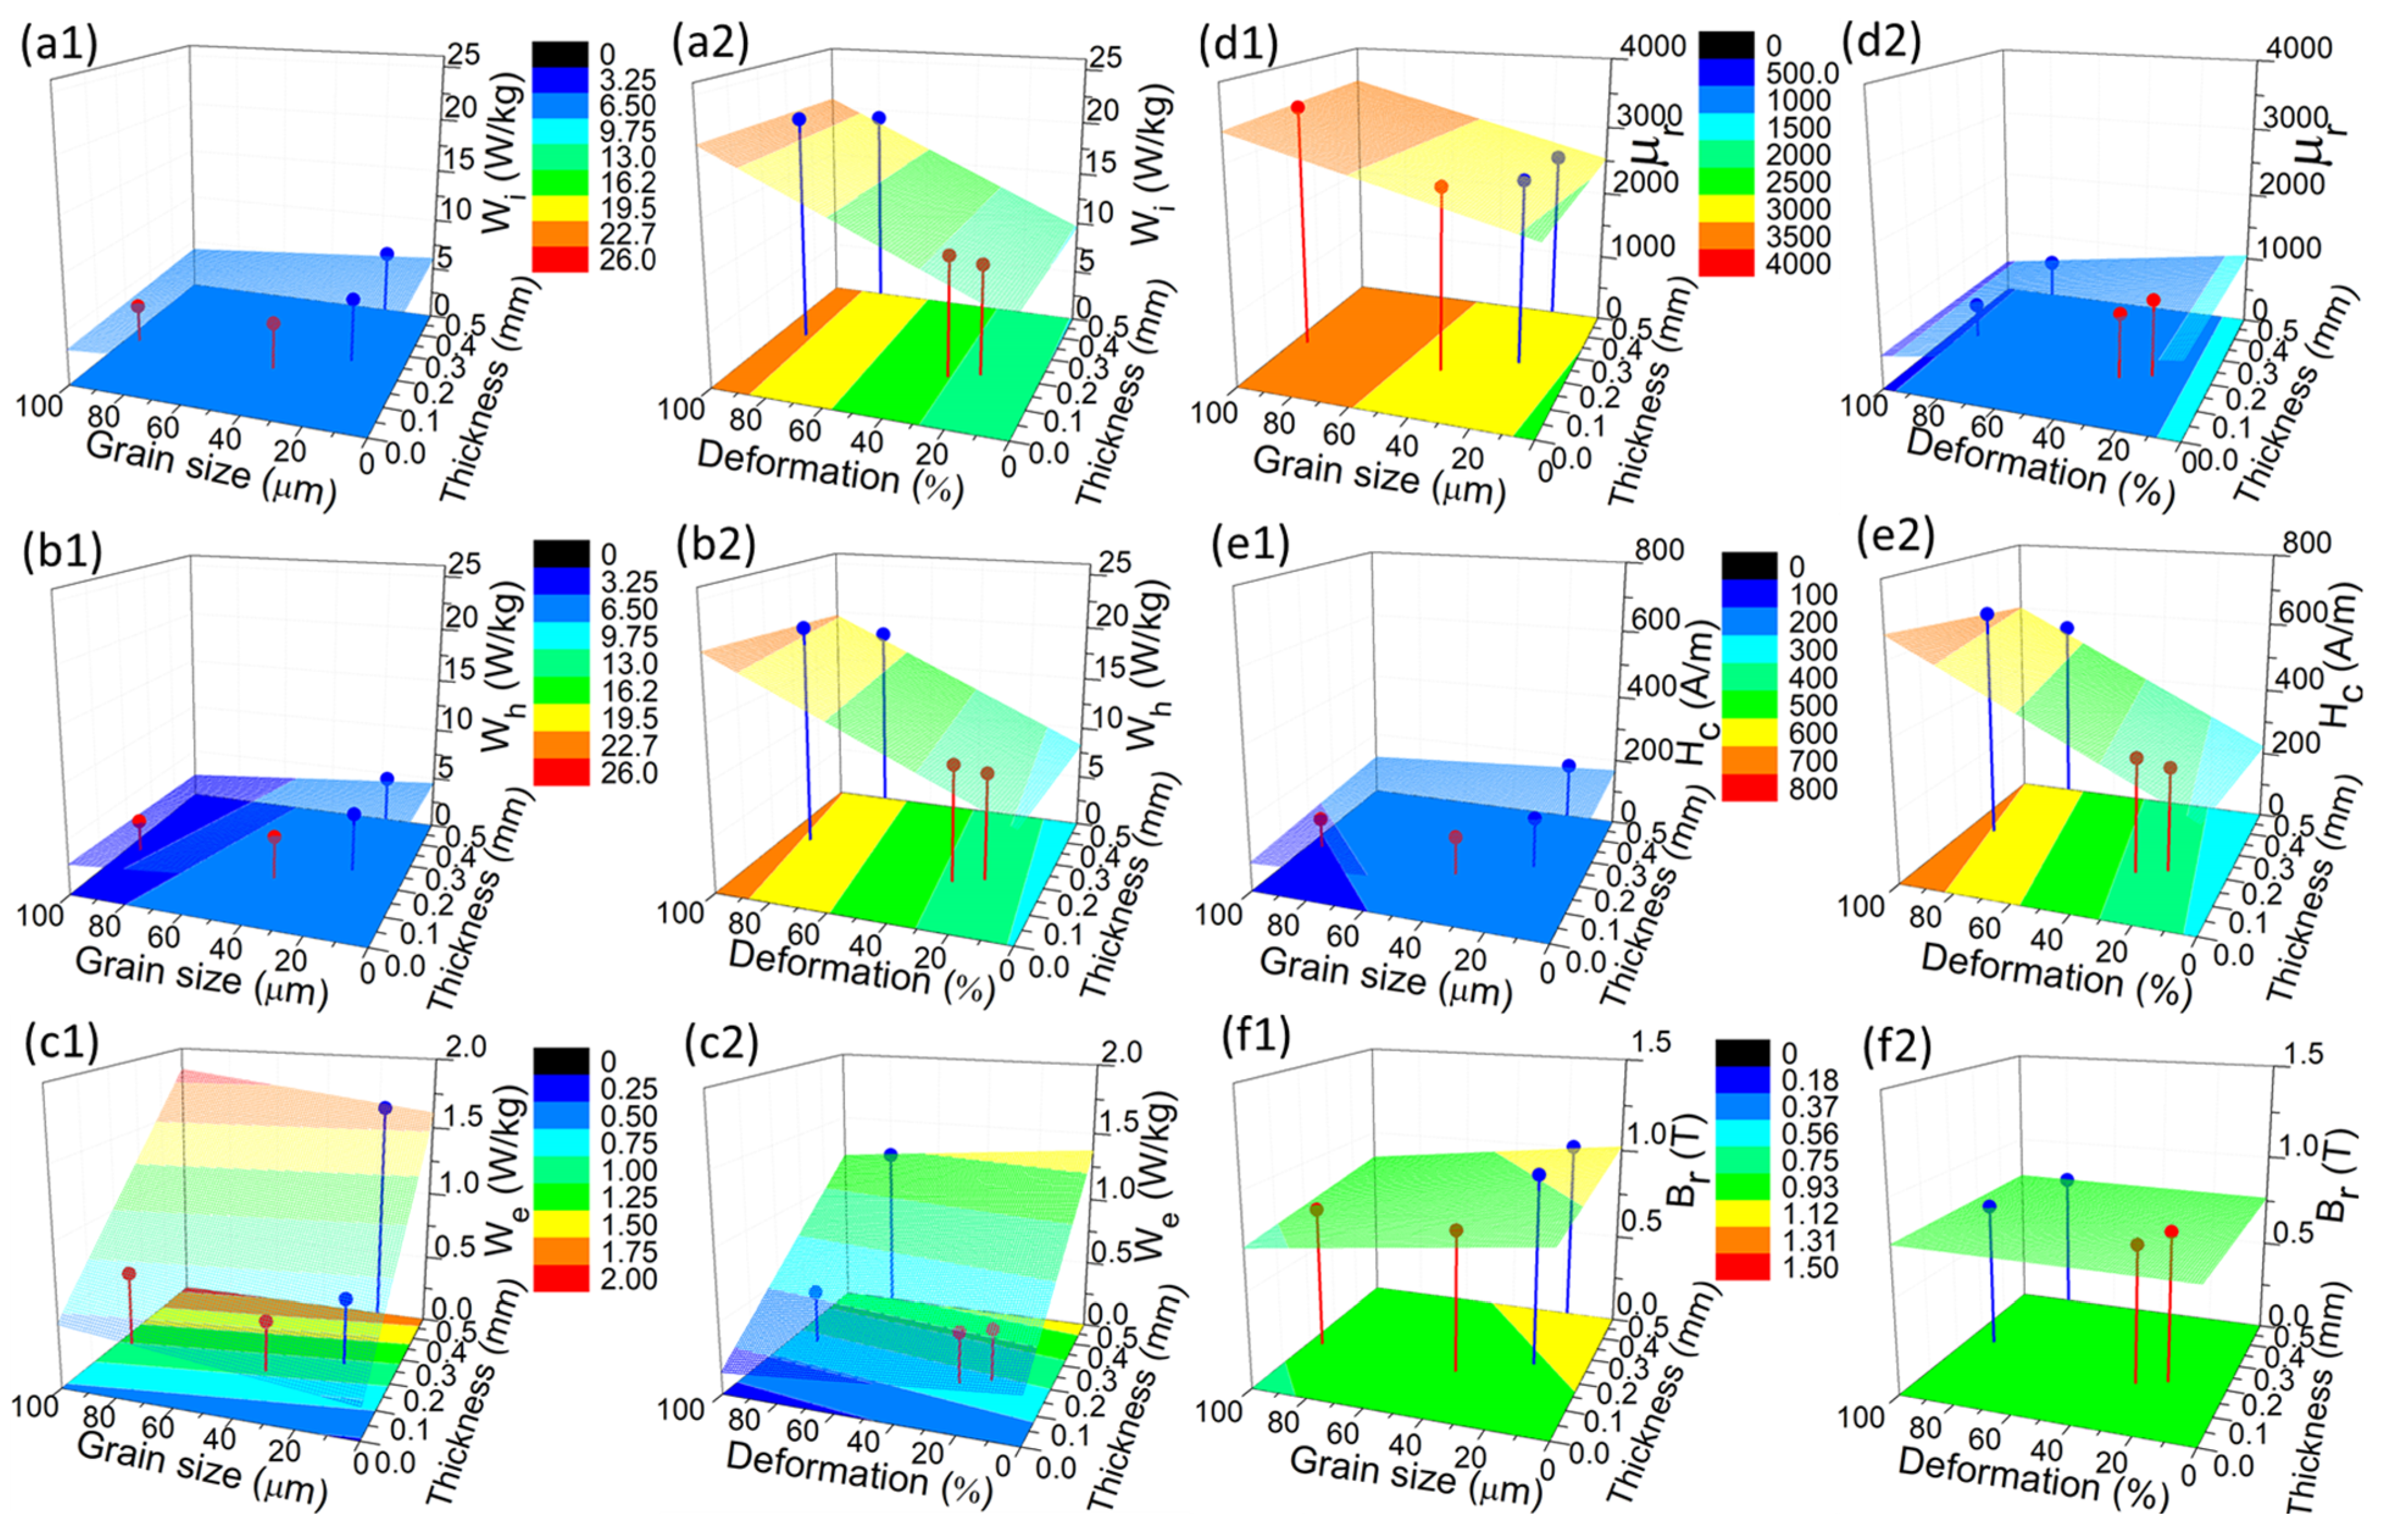
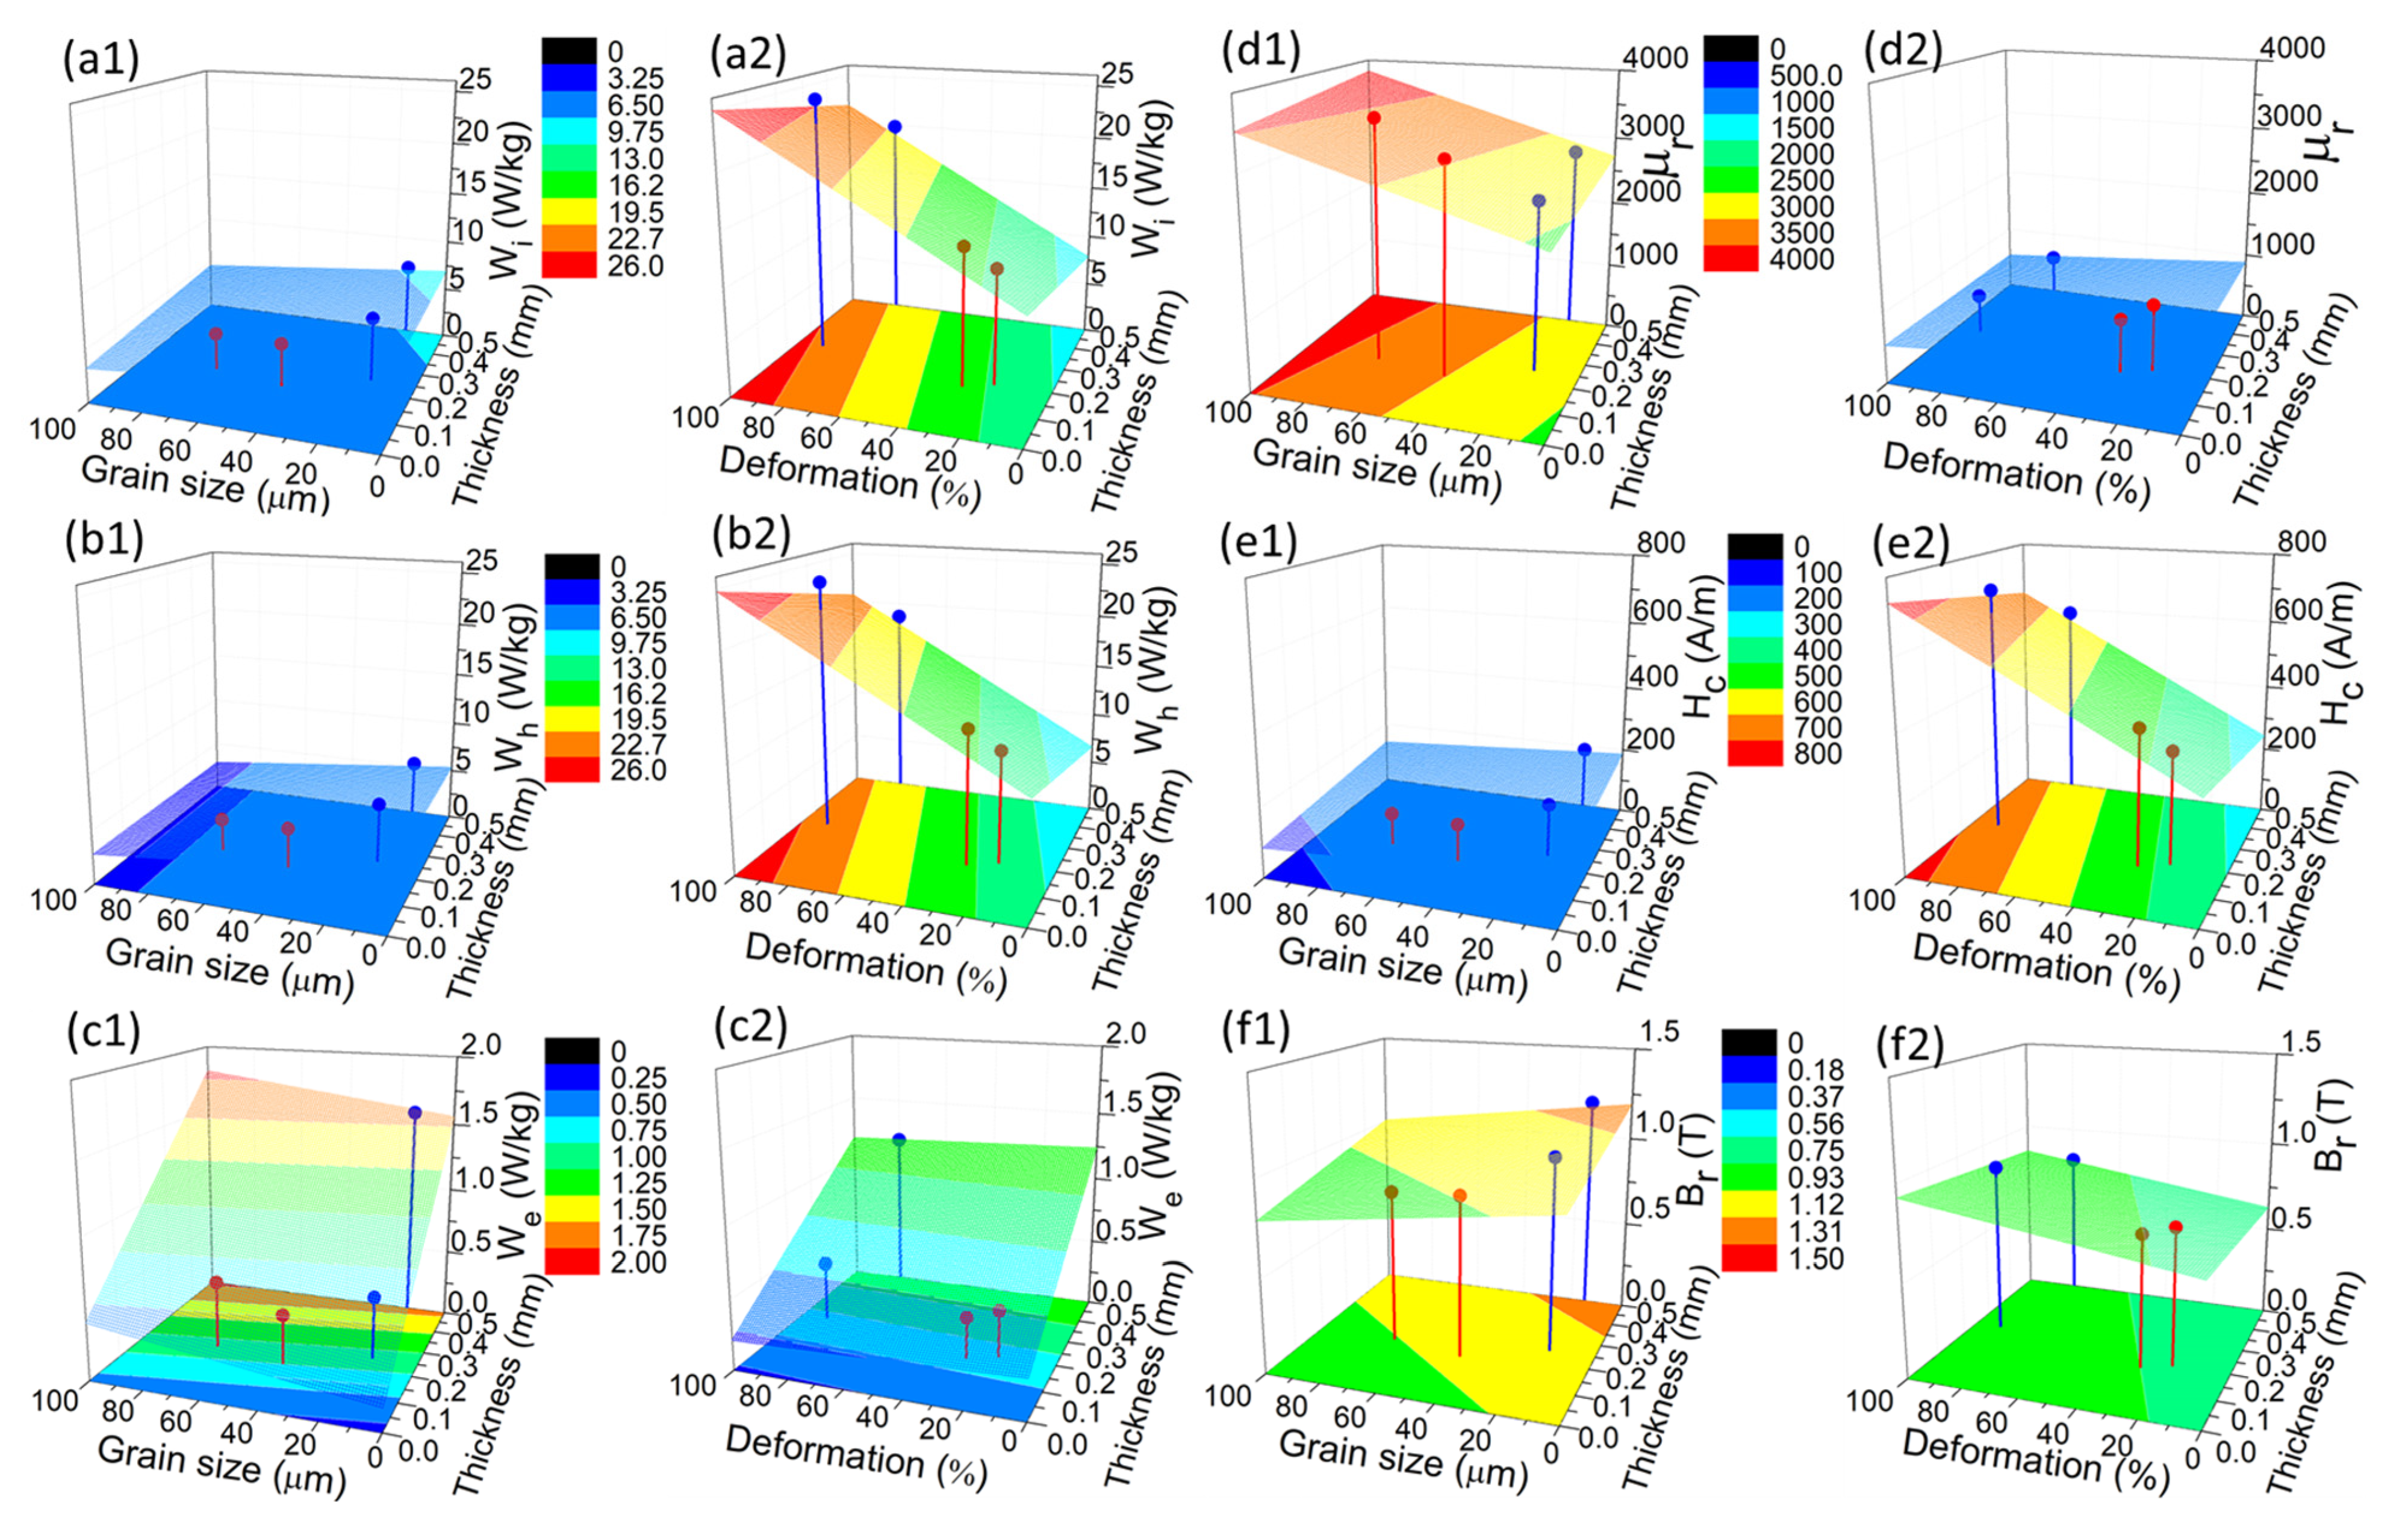
Figure 11 and Figure 12 show the effects of deformation degree, thickness and grain size on the magnetic properties (Br, Hc and µr) and losses components (Wi, Wh and We) of Sb8 and Sb12 steels, respectively, for the different cold rolling and annealing schedules.
Figure 11.
Surface graphs for Sb8 steel showing the effect of thickness as a function of grain size (1) and deformation (2) on the magnetic properties: Wi (a1,a2), Wh (b1,b2), We (c1,c2), µr (d1,d2), Hc (e1,e2) and Br (f1,f2) at 50 Hz.
Figure 12.
Surface graphs for Sb12 steel showing the effect of thickness and grain size (1) and deformation (2) on the magnetic properties: Wi (a1,a2), Wh (b1,b2), We (c1,c2), µr (d1,d2), Hc (e1,e2) and Br (f1,f2) at 50 Hz.
In these figures, the results of samples with thicknesses of 0.5 mm and 0.25 mm (deformation of 80 and 90%) subjected to one-step cold rolling and annealing are represented with blue circles, while those of samples with thicknesses of 0.2 mm and 0.175 mm (deformation of 20 and 30%) subjected to two-step cold rolling and annealing are indicated with red circles. In the case of the 3D surface graphs where the effect of the degree of deformation as a function of the thickness is shown, it is important to make it clear that the material annealed at 880 °C for 180 min was subjected to deformations of 80 and 90%, and the latter was subsequently subjected to annealing at 850 °C for 10 min and deformations of 20 and 30%. This was to evaluate the effect of deformation (indirectly, the number of defects) and thickness on magnetic properties. In the case of 3D surface plots showing the effect of grain size as a function of thickness, it is important to remember that both samples obtained after the first (80, 90%) or second (20, 30%) deformation (thicknesses of 0.5, 0.25, 0.20 and 0.175 mm, respectively), were subjected to one- or two-step cold rolling and annealing schedules. This was to promote recrystallization and grain growth and enable evaluation of the effect of grain size and thickness on the magnetic properties. Wi in Sb8 and Sb12 steels decreases with the increase in grain size and the reduction in thickness (Figure 11 and Figure 12(a1)); and this property decreases with the reduction in the percentage of deformation and with the reduction in thickness in Sb8 steel (Figure 11(a2)), but in Sb12 steel, this property decreases with the reduction in the percentage of deformation and with the increase in thickness (Figure 11(a2)). Values of Wi in the annealed steel (Figure 11 and Figure 12(a1)) are considerably lower than in the deformed steel (Figure 11 and Figure 12(a2)).
In the case of the contribution of the hysteresis loss (Wh), it is observed that Wh in both steels decreases as the grain size increases and as the thickness increases, the effect of thickness is more significant in Sb8 steel (Figure 11 and Figure 12(b1)). This property decreases with the reduction in deformation percentage and the increase in thickness in both steels (Figure 11 and Figure 12(b2)). Wh in the annealed steel (Figure 11 and Figure 12(b1)) is considerably lower than in the deformed steel (Figure 11 and Figure 12(b2)).
Values of We decrease as the grain size and thickness are reduced, and the effect of thickness is more significant in both steels (Figure 11 and Figure 12(c1)). This property decreases with the increase in deformation and the decrease in thickness, being more significant with the effect of the deformation in Sb8 steel (Figure 11 and Figure 12(c2)). Values of We in the deformed steel (Figure 11 and Figure 12(c2)) are slightly lower than in the annealed steel (Figure 11 and Figure 12(c1)).
µr increases with the increase in grain size and the increase in thickness in both steels (Figure 11 and Figure 12(d1)), but the effect of the thickness is more significant in the Sb12 steel (Figure 12(d1)). This property increases with the reduction in deformation percentage and increases slightly with the reduction in thickness in both steels (Figure 11 and Figure 12(d2)), but the effect of the percentage of deformation is more significant in the Sb8 steel (Figure 11(d2)). Values of µr in the annealed steel (Figure 11 and Figure 12(d1)) are considerably higher than in the deformed steel (Figure 11 and Figure 12(d2)).
Hc decreases with the increase in grain size and the reduction in thickness in both steels (Figure 11 and Figure 12(e1)); and this property increases with the increase of deformation percentage and the reduction in thickness (Figure 11 and Figure 12(e2)). Values of Hc in the annealed steel (Figure 11 and Figure 12(e1)) are considerably lower than in the deformed steel (Figure 11 and Figure 12(e2)).
Br increases with the reduction in grain size and the increase of thickness in both steels, but Br is higher in the Sb12 steel compared to Sb8 steel (Figure 11 and Figure 12(f1)). This property increases with the increase in the percentage of deformation and the reduction in thickness (Figure 11 and Figure 12(f2)), being more significant in the effect of deformation in the Sb12 steel (Figure 12(f2)). Values of Br in the annealed steel (Figure 11 and Figure 12(f1)) are higher than in the deformed steel (Figure 11 and Figure 12(f2)).
4. Discussion
As shown in Figure 2, after cold rolling, both steels (Sb8 and Sb12) show a microstructure constituting deformed grains, which are elongated in a direction parallel to the rolling direction (Figure 2). For a thickness reduction of 80% (0.5 mm), the Sb8 steel shows the presence of grains more elongated than in the Sb12 steel. In other works, it has been reported that the size of the deformed bands is affected by the size and shape of the grains before cold rolling at 0.5 mm [,,,,,,,,]. After annealing at 850 °C (8 and 10 min), both steels show a microstructure of equiaxed grains, which is similar to the findings reported in other works [,,,,,,,]. When steels were cold-rolled to 0.25 mm and annealed at 850 °C for 10 min, the microstructure was very similar in both steels (Sb8 and Sb12), and it was also characterized by the presence of recrystallized grains (Figure 3 and Figure 4, respectively).
When Sb8 and Sb12 steels are subjected to a second deformation (20% and 30%) and annealing at 850 °C for 10 min, the microstructure is characterized by the presence of elongated grains in the rolling direction, which is more noticeable for a higher deformation. Similar behavior has been reported in other works [,,,].
After the two-step cold rolling and annealing schedule for both steels (Sb8 and Sb12), grain size is larger than the one obtained by the one-step cold rolling and annealing schedule. The grain size of samples subjected to 20% deformation is larger than that of samples with 30% (Table 1). Similar behavior was reported in other work, where samples subjected to 20% deformation and annealing (850 °C) resulted in larger grain size than samples with higher deformations near 20% []. These works reported the grain growth by the mechanism of strain-induced boundary migration (SIBM), where grains with low internal strain growth by the mobility of the grain boundaries reducing the stored energy. Some authors reported the effect of temperature of first annealing (900 °C, 1000 °C and 1100 °C for 6 min), second deformation (about 60%) and second annealing (1000 °C for 6 min) []. They found that the high deformation degree applied before thermal treatment (60%), making it difficult for the occurrence of grain growth during final annealing. It was explained that the amount of dislocation cells, dislocation walls, or microbands, which represent nucleation sites for recrystallization, depends on the degree of deformation. Therefore, higher deformation levels produce a larger number of defects and result in higher stored energy. The higher the stored energy, the faster the recrystallization process and the smaller the recrystallized grain size. In the present work, it is observed that the grain size of final products is strongly affected by the deformation degree, being larger for the lower deformation (20%). It suggests that for larger deformation levels, the amount of lattice defects is more significant, favoring the nucleation process and thus affecting grain growth for a deformation of 30%. This behavior is similar to one reported in other works, where reductions higher than 30% promoted a fast recrystallization []. Variations in grain size after one-step or two-step cold rolling and annealing schedules (Table 1), are attributed due to the combined effects of the hot rolling temperature and cold rolling reduction, which affect both nucleation and grain growth during annealing [,,,].
Magnetic properties of both steels (Sb8 and Sb12) after cold rolling (0.25 mm thickness), annealing (850 °C–10 min), second deformation (20% and 30%) and second annealing (850 °C–10 min) are presented in Figure 8 and Figure 9. As can be seen, hysteresis cycles of deformed samples (20% and 30%) are wider than those of annealed samples. The larger area observed in cold-rolled samples is also related to the dislocation density, which makes the magnetization process difficult [,,,]. In both steels (Sb8 and Sb12) and for the two thicknesses (0.5 mm and 0.25 mm), similar behavior in the losses and coefficient losses (W/f) curves is observed, and core loss (Wi) is greater after deformation and is reduced after annealing; the main contribution comes from hysteresis losses (Figure 5, Figure 6, Figure 7, Figure 8, Figure 9 and Figure 10). The contribution of eddy current losses is less significant in all cases, regardless of processing condition (less than 0.6 W/kg at 50 Hz when the thickness is less than 0.25 mm), as observed in Figure 8, Figure 9 and Figure 10.
Table 2 shows a comparison between the lowest core loss values obtained in the present work and the ones reported in the literature for other electrical steel grades with similar thicknesses. After cold rolling (0.5 mm and 0.25 mm thickness) and annealing (850 °C for 10 min), core losses of Sb8 steel are 6.0 W/kg and 5.85 W /kg, respectively. In Sb12 steel, core loss values are 6.8 W/kg and 6.0 W/kg, respectively. In both steels, a lower core loss was obtained for a thickness of 0.25 mm. Therefore, regardless of the hot rolling temperature, steel processing by annealing at 880 °C for 180 min, a total thickness reduction of 80% or 90%, and final annealing at 850 °C for 10 min produces lower loss core values for a smaller thickness. In both steels, the lowest core loss values are observed after a total thickness reduction of 90%, annealing at 850 °C for 10 min, 20% deformation and second annealing at 850 °C for 10 min. Core loss values obtained as a function of hot rolling temperature are 3.44 W/kg and 3.52 W/kg for steel Sb8 (800 °C) and Sb12 (1200 °C), respectively (Figure 10). Such difference is mainly attributed to variations in grain size, which is consistent with those reported in other works, where a larger grain size reduces core loss []. In this work, the thickness with the best magnetic properties was 0.20 mm. The smaller thickness contributed to reducing eddy current losses and the larger grain size contributed to reducing hysteresis losses, leading to lower energy losses for this thickness. Some works have reported core loss values (near 3.0 W/kg [,]) slightly lower than the ones obtained in the Sb8 and Sb12 steels (3.44 W/kg and 3.52 W/kg). However, in one case, this has been reported in steels with higher silicon content, in which a reduction in thickness was also applied in two stages, although the thickness was greater with respect to the steel of this work. The influence of the Si content allowed for obtaining lower energy losses []. In another case, the steel underwent a long annealing period before cold rolling (ABCR = 710 °C, 72 h) [], and although the thickness reduction occurred in one stage, the final thickness was similar to the one used in this work. Therefore, steel processing by the two-step cold rolling and annealing schedule allows for a reduction in annealing time before cold rolling, but also to produce similar core losses. Another advantage of the two-step cold rolling and annealing schedule is observed when the results are compared with other work, where steel processing is performed in a one-step cold rolling and annealing schedule with an annealing conduced at a temperature of 850 °C for 60 min []. Although the time used in that work was larger than the one of this work (60 vs. 10 min), grains size was larger, and core losses were lower in the two-step cold rolling and annealing process. It seems that the combined effects of plastic deformation and annealing are more important than the increase in the annealing time.
Table 2.
Comparison between processing conditions and magnetic properties of this work with the ones reported in the literature for other electrical steel grades.
Other authors have reported lower core loss values (2.02-2.92 W/kg) than the ones obtained in the present work (3.44 W/kg), but they were obtained in electrical steels containing higher Si contents (1.6–3.45%) [,]. However, cold rolling in such works was conducted in one stage, and heat treatments were conducted at higher temperatures. Despite the beneficial effects on increasing grain size and lowering core losses, the higher silicon contents and higher annealing temperatures represent a higher processing cost. In addition, increasing the Si content did not always result in lower energy losses, as we can see for the steel with Si content of 3% (Table 2) []. The higher core loss values compared to the ones obtained in this work are related to a larger thickness and a smaller grain size in the steel with 3%Si. Worthy of mention is that the lowest core loss values obtained in the present investigation (3.44 W/kg) are lower than those (4.4 W/kg) reported for other low Si-Sb steels that used longer ABCR times (850 °C-720 min) [] or than those obtained (3.95 W/kg) in high-silicon (3.0%) steels []. These results suggest that the two-step cold rolling and annealing schedule enhances the magnetic properties of these materials with a significant reduction in processing time (Table 2).
The surface plots shown in Figure 11 and Figure 12 present the magnetic properties obtained in Sb8 and Sb12 steels as a function of grain size and deformation. The effect of dislocation density is indirectly observed in these figures since it is well-known that the dislocation density in deformed steels is greater than that in annealed steels [,,,,,]. As mentioned above, the main objective of the present work is to evaluate the effect of processing history on the magnetic properties of ultra-low-carbon Si-Sb electrical steels. In general, it is observed that lower core loss values are obtained for a larger grain size and a smaller thickness (Figure 11 and Figure 12 and Table 2). The two-step cold rolling and annealing schedule allows for obtaining a larger grain size in the final product than the one-step cold rolling and annealing route, and it is affected by the temperature used for the hot rolling process. In most cases, samples processed from hot rolling at 800 °C (Sb8) exhibit a larger grain size after final annealing at 850 °C (Figure 11 and Figure 12). It has been reported in another work that, for a 0.6 mm thick steel with additional deformations of 5, 10 and 20% and subsequent annealing at 850 °C for 60 min, a larger grain size is obtained as the deformation is increased []. In the present work, the steel with 0.25 mm thickness with additional deformation of 20% and subsequent annealing at 850 °C for 10 min shows the largest grain size. Larger deformation levels (30%) result in smaller grain size (Table 1, Figure 3 and Figure 4) with a detrimental effect on the magnetic properties of final products (Figure 11 and Figure 12). In both steels (Sb8 and Sb12), processing by the two-step cold rolling and annealing schedule allows a core loss reduction of approximately 41%, compared to steel processed by the one-step cold rolling and annealing schedule; this is for samples with a second deformation of 20%. In the case of samples with 30% deformation prior to the second annealing, reductions in core loss were about 32.7% and 27.7% for Sb12 and Sb8 steels, respectively.
These results show that, for the experimental steels, the use of a second cold deformation of 20% plus a second annealing stage (850 °C–10 min) favors grain growth and leads to a more significant reduction in core losses. This is compared to samples subjected to a second deformation of 30%, or with samples processed by one-step cold rolling and annealing schedule.
In general, Figure 11 and Figure 12 show that steel thickness will affect the magnetic properties (Wi, Wh, We, µr, Hc, Br) differently when you have either a deformed steel or annealed steel, but even with these differences, the magnetic properties are better in annealed steel compared to deformed steel. However, in samples annealed at 850 °C for 10 min, which resulted in equiaxed microstructures, there is a combined effect of thickness and grain size on the magnetic properties. First, the increase in grain size improves some magnetic properties by reducing Wi, Wh, Br, Hc and increasing µr, but this increase in grain size has a detrimental effect on We, which increases. Second, the reduction in thickness improves some magnetic properties by reducing Wi, We, and Hc, but has a detrimental effect by reducing µr and increasing Wh and Br.
Changes in magnetic properties can be explained in terms of the movement of the magnetic domain walls after applying a magnetic field []. Other authors mention that an increase in grain size and decrease in the area of the domain wall make the magnetization process easier [,,,,,]. Moreover, the pining effect of the domain wall is present in dislocations, second phases or grain boundaries; in this sense, in this work, the magnetic domain wall motion is mainly affected by grain boundaries []. However, this effect in Figure 11 and Figure 12 is only observed for the coercive field and relative magnetic permeability properties, where increasing grain size reduces the amount of grain boundaries, which reduces the coercive field, increases the magnetic permeability, and reduces the hysteresis loss, allowing easy movement of the domain walls after applying the magnetic field. Other authors mention that increasing grain size decreases the magnetic domain wall area but increases the magnetic domain size. In relation to this, hysteresis losses decrease with the reduction in magnetic domain wall area, and eddy current losses decrease with the reduction in magnetic domain size []. This is consistent with what is observed in Figure 11 and Figure 12, where hysteresis losses decrease and eddy current losses increase with increasing grain size.
Moreover, We can be explained by the classical eddy current theory. For this purpose, other authors use an equation where these losses are directly proportional to the square of pi, the thickness of the sheet, the frequency and the maximum peak of the magnetic induction, and inversely proportional to six times the resistivity [,], and in some cases, also inversely proportional to the density []. Other authors have reported that an increase in grain size will increase local eddy currents [,,,,,,], contributing to the increase in total core losses. This information is consistent with the results of this work, where an increase in frequency increases energy losses due to eddy currents as observed in Figure 5, Figure 6, Figure 8 and Figure 9, for the different microstructural characteristics obtained through the processing routes.
The reduction in thickness reduces eddy currents contributing to the reduction in energy losses. This can be observed when comparing the results of the different thicknesses in the deformed condition (Figure 11 and Figure 12). However, subsequent annealing produces an increase in eddy current losses. In annealed samples, the lowest eddy current losses were obtained for the smallest thickness and the smallest grain size. In deformed samples, the greatest reduction was obtained for the lowest thickness with greater deformation (compare Figure 11 and Figure 12(c1) with Figure 11 and Figure 12(c2)).
These results suggest that final products must have an optimal grain size-to-thickness ratio to obtain high-efficiency electrical steels with enhanced magnetic properties. Finally, the hot rolling temperature has a significant effect on the characteristics and properties of final products obtained through the processing routes investigated. As shown in Figure 7 and Figure 10, samples hot-rolled at a temperature of 800 °C show, in general, lower core losses than samples hot-rolled at 1200 °C; this is after deformation and after annealing of the one- or two-step cold rolling and annealing schedules. The reduction in core losses is consistent with the larger grain size observed in these samples (Table 1). The only processing condition where samples hot-rolled at 1200 °C exhibited lower core losses (Figure 10) compared to samples hot-rolled at 800 °C, is after the second annealing of the two-step processing (CR2-B-FA2), which was also consistent with the larger grain size observed in such samples (Table 1).
The effects of hot rolling temperature (800 °C and 1200 °C) on the crystallographic texture of samples processed by a one-step cold rolling (0.25 mm) and annealing (850 °C, 60 min) schedule was recently reported. It was found that the recrystallization texture of samples hot-rolled at 800 °C, exhibited a higher ratio than samples hot-rolled at 1200 °C, which improved the magnetic performance of the former. In the present work, samples hot-rolled at 800 °C, exhibited, in general, a better magnetic performance than samples hot-rolled at 1200 °C. Therefore, the enhancement in the magnetic properties could be associated, apart from thickness and grain size, with possible variations in texture. In the present work, the samples hot-rolled at 800 °C, subjected to annealing before cold rolling, and further processed by the two-step cold rolling and annealing route, exhibited the lowest core losses for a thickness reduction of 20% (after second annealing). Other works regarding the effects of a two-step cold rolling and annealing schedule, but without annealing prior to cold rolling, have reported that thickness reductions of 15% (first stage) produce a weak γ-fiber; however, increasing the thickness reduction to 30% leads to a significant increase in the γ-fiber []. Therefore, there exists the possibility that increasing the thickness reduction from 20 to 30%, could increase the volume fraction of γ-fiber, as reported elsewhere []. The possible increase in the γ-fiber, along with the effects of thickness and grain size mentioned above, could explain the detrimental effect in samples with 30% thickness reduction compared to those with 30% thickness reduction. The evolution of crystallographic texture in electrical steels processed by the two-step cold rolling and annealing schedule, and its effect on the magnetic properties of the final products, has not yet been reported. However, this could be considered in future work.
5. Conclusions
The two-step cold rolling and annealing schedule proposed in this work allows enhancement of the magnetic properties of electrical steel. In general, samples hot-rolled at a temperature of 800 °C show lower core losses than samples rolled at 1200 °C. The thickness reduction lowers eddy current losses, while the increase in grain size increases eddy current losses and reduces hysteresis losses. The contribution of these components to the total core losses depends on the combined effects of thickness and grain size. Hysteresis and eddy current losses increase with the increase in frequency, with eddy current losses being mostly affected at frequencies equal to or higher than 50 Hz.
Core losses of samples processed by the two-step processing were reduced by 41% with respect to the steel processed in the one-step cold rolling and annealing schedule. The optimum processing route that leads to the lowest core losses (3.4 W/kg) involves the following steps: hot rolling (800 °C), annealing prior to cold rolling (880 °C, 180 min), cold rolling (90% thickness reduction), annealing (850 °C, 10 min), second cold rolling (20% thickness reduction) and second annealing (850 °C, 10 min). The two-step cold rolling and annealing schedule allows for obtaining lower core loss values than those recently reported for steels with similar compositions, representing an attractive alternative route for the fabrication of high-efficiency electrical steels, with significant reduction in the processing time.
Supplementary Materials
Author Contributions
Conceptualization, E.J.G.-C.; formal analysis, A.S.-R.; investigation, F.H.-N.; methodology, F.H.-N.; project administration, E.J.G.-C.; resources, L.G.-F. and J.G.-G.; supervision, R.D.-L., F.R.C.-P. and V.E.S.-M.; validation, M.d.J.S.-A.; writing—original draft, J.A.-C.; writing—review and editing, I.A.R.-D. All authors have read and agreed to the published version of the manuscript.
Funding
Fernando Hernández-Navarro thanks SECIHTI for the financial support through the postdoctoral fellowship under grant No. 559743.
Data Availability Statement
The data will be available upon request.
Acknowledgments
Emmanuel J. Gutiérrez-Castañeda would like to thank SECIHTI for being commissioned to the Institute of Metallurgy of the Autonomous University of San Luis Potosí (IM-UASLP). Facilities at the IM-UASLP and the technical assistance from Rosa Lina Tovar, Lorena Hernández Hernández and Izanami López Acosta are duly recognized.
Conflicts of Interest
The authors declare no conflicts of interest.
Appendix A
Appendix A.1. Material to Support the Presence of Carbides at Grain Boundaries
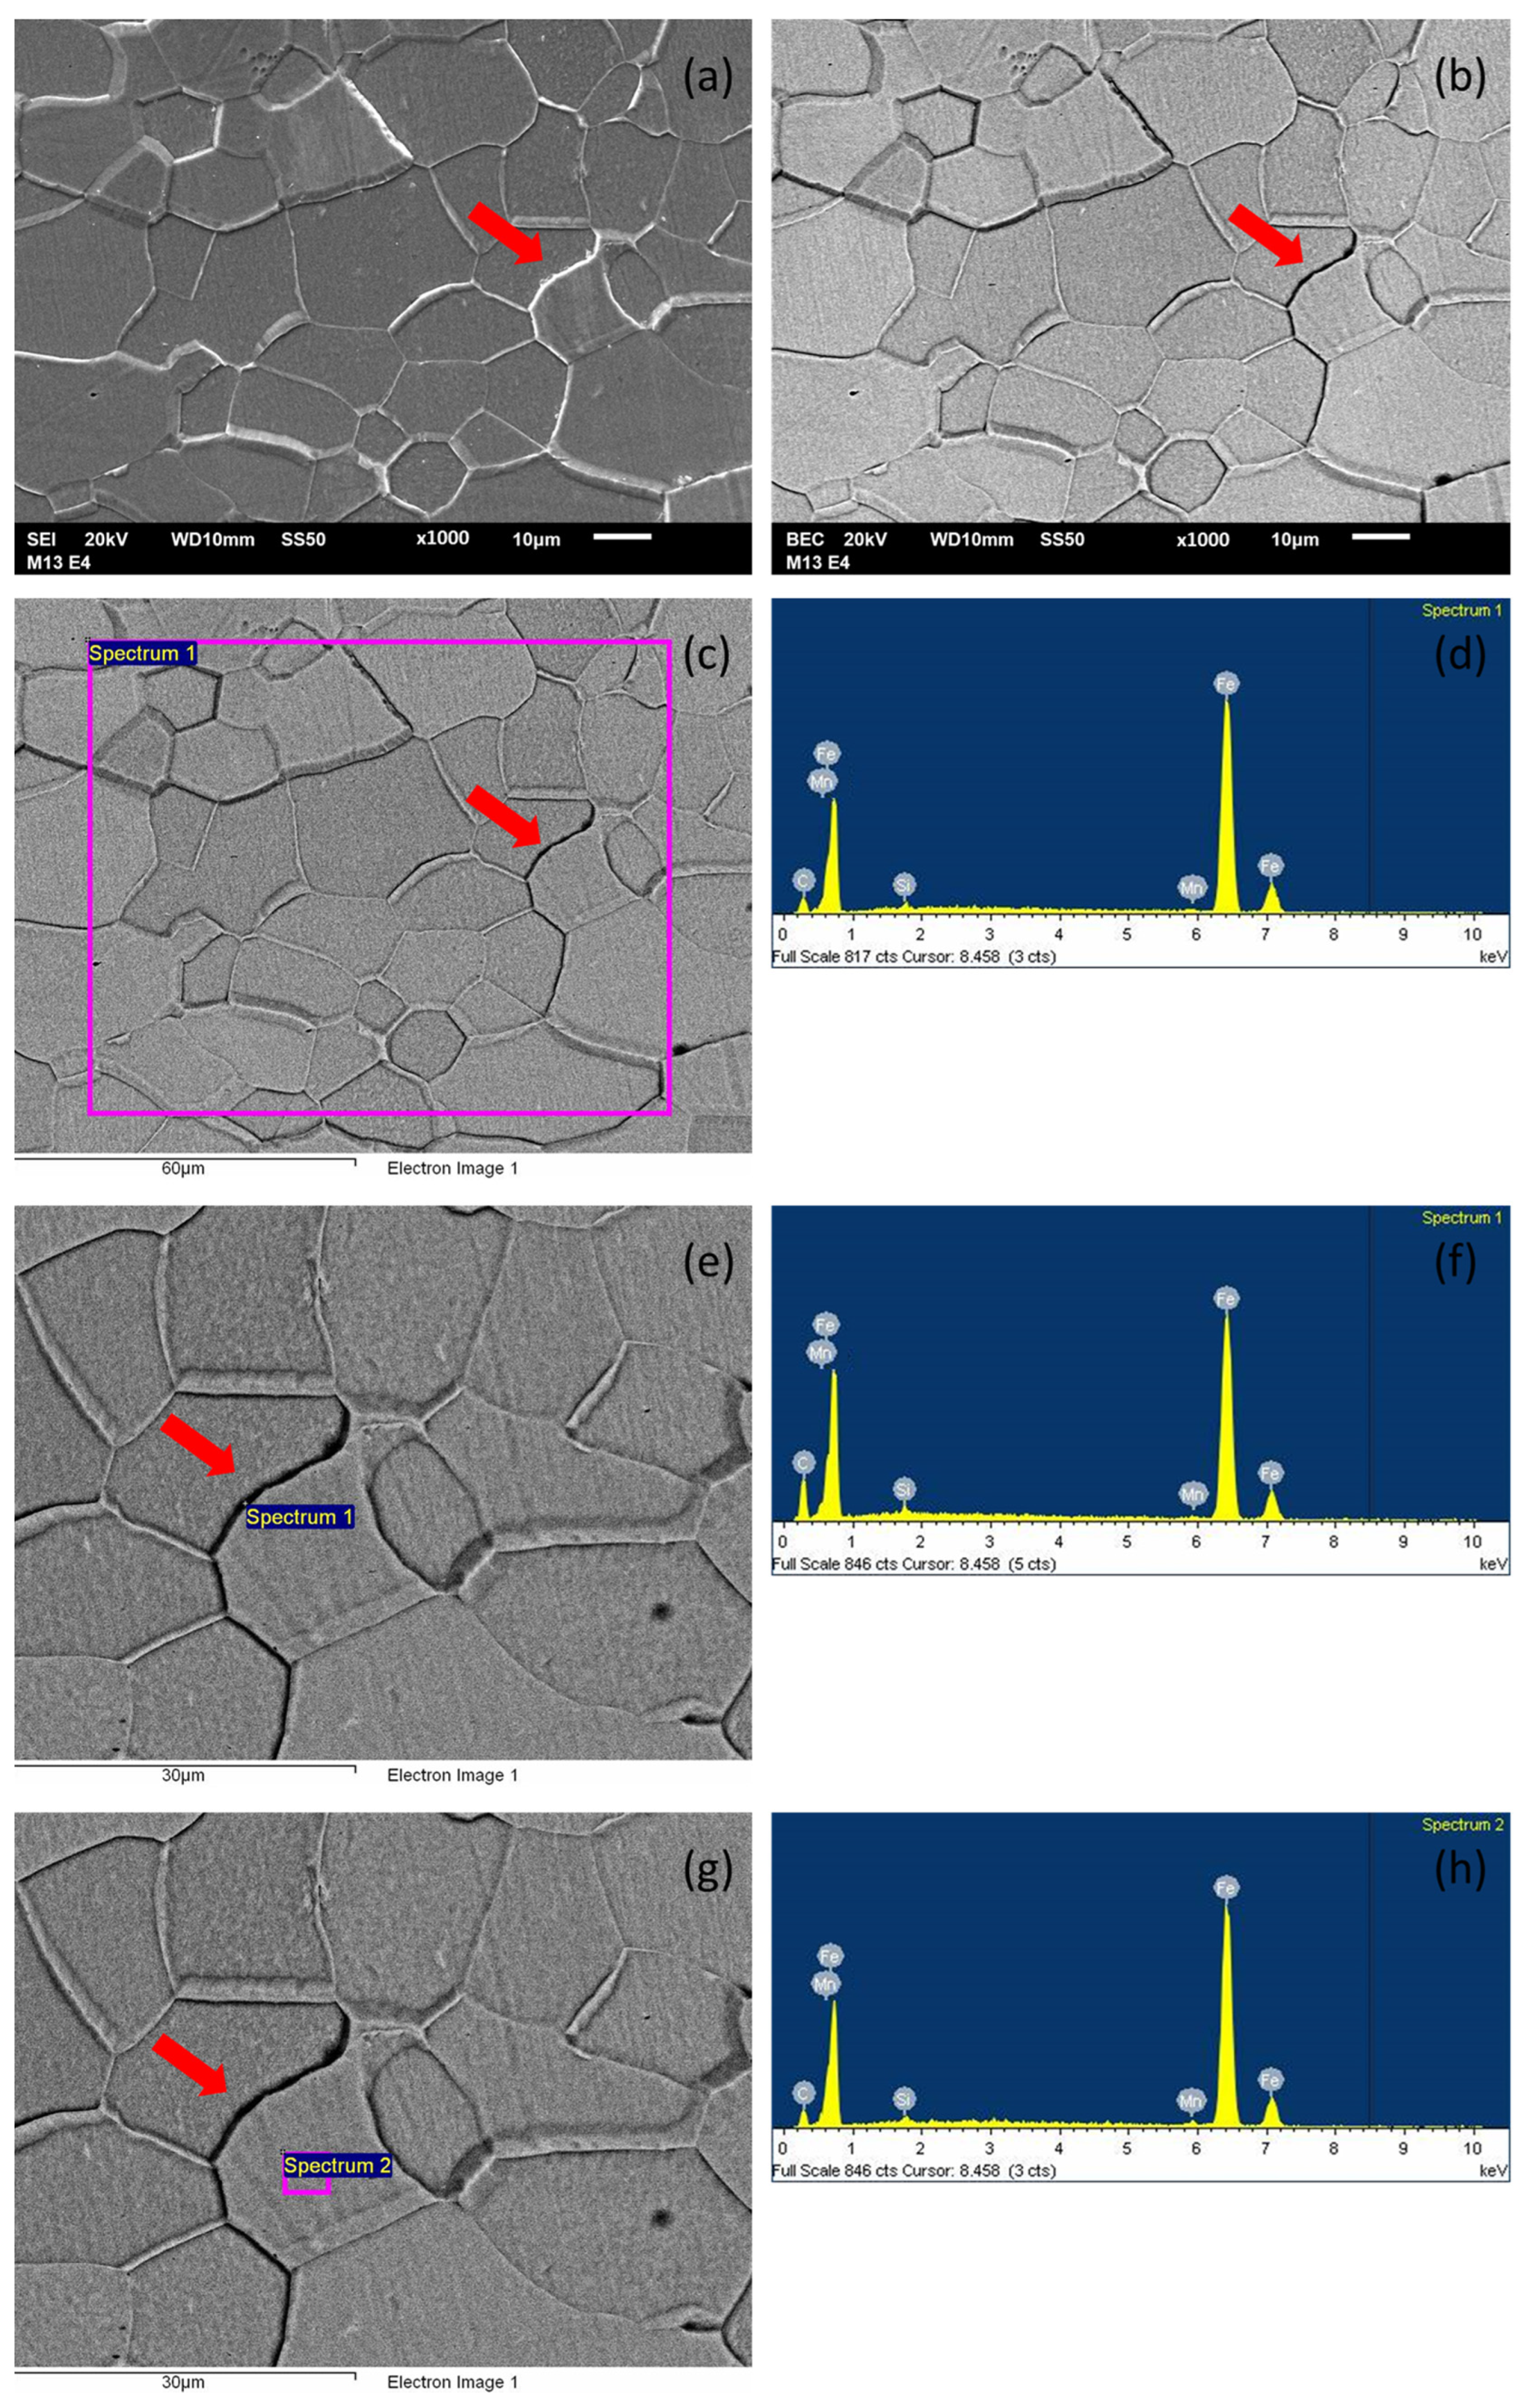
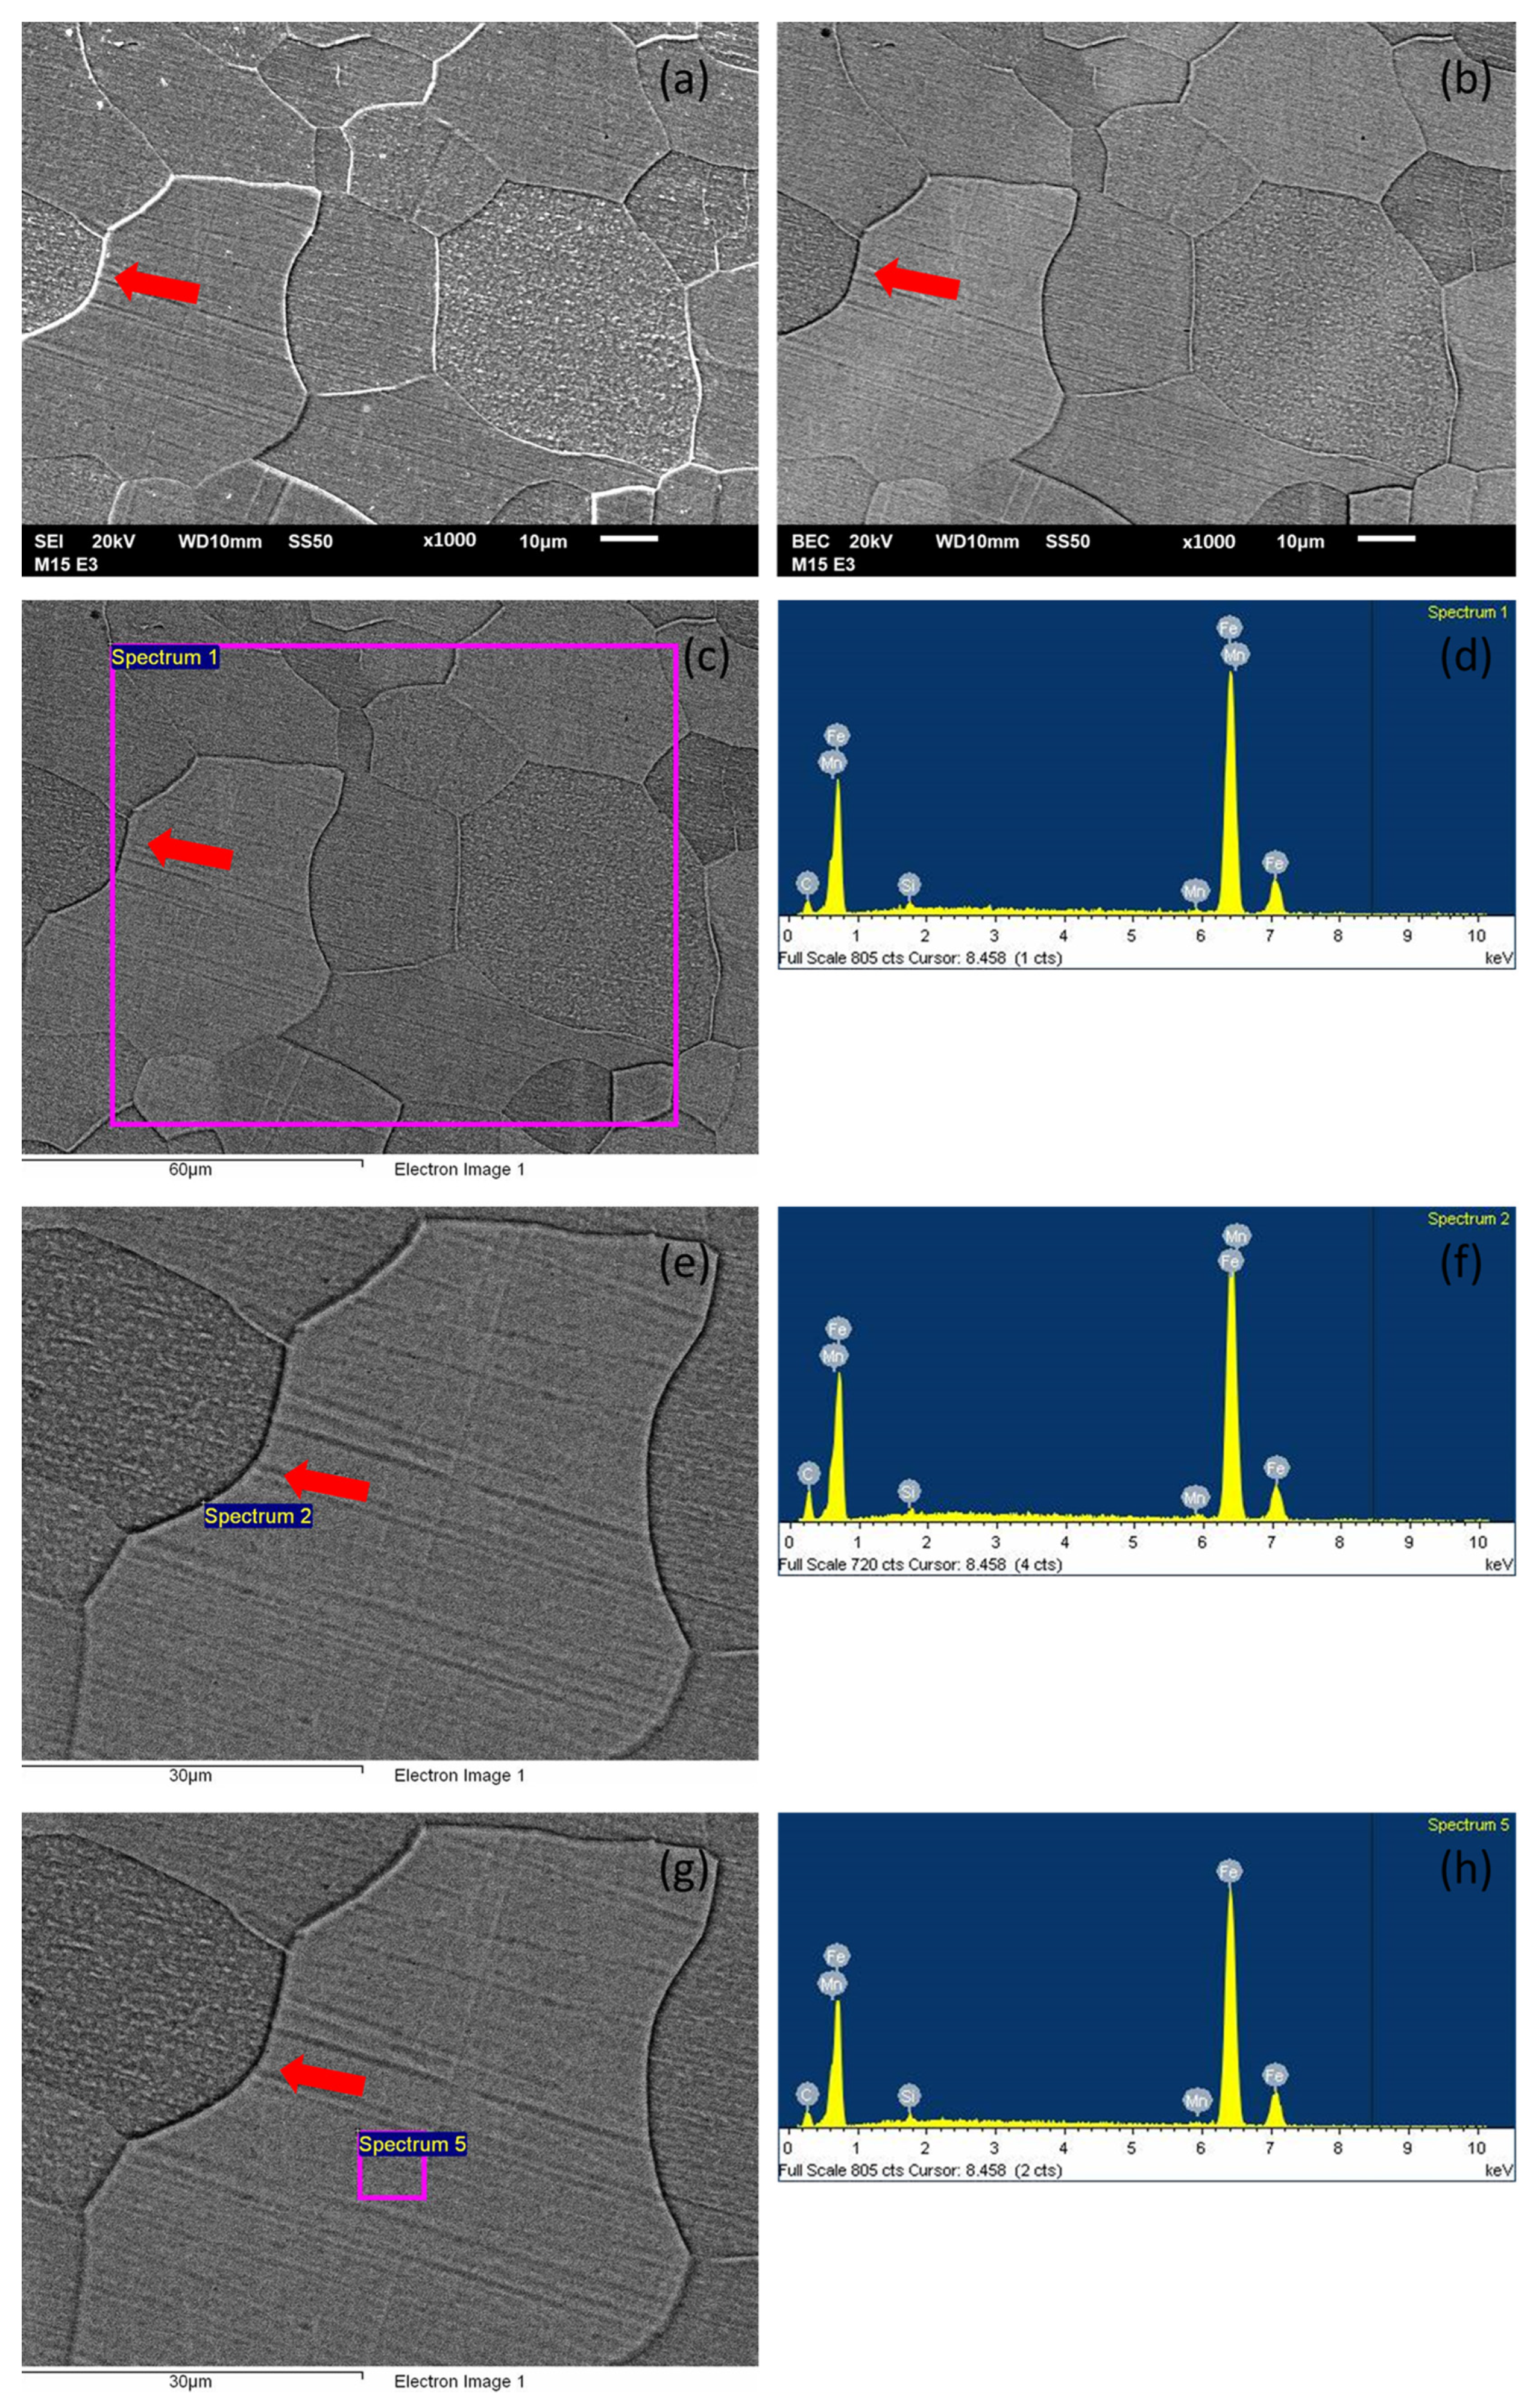
Figure A1 and Figure A2 show the analysis of carbides using scanning electron microscopy. After annealing, both steels presented equiaxed grains and carbides at the grain boundaries. With secondary electron micrography (Figure A1 and Figure A2a), the information regarding the topography of the sample is presented with white and bright areas having a greater height with respect to dark areas (lower height). Since carbides are more resistant when the microstructure is revealed, they remain higher and therefore are observed as brighter white areas. By using backscattered electrons (Figure A1 and Figure A2b), the information is about the chemical composition of the sample. Bright white areas correspond to chemical elements with higher molecular weight, and darker, less bright areas correspond to chemical elements with lower molecular weight. Carbon-rich phases will be then darker compared to Fe-rich phases such as ferrite. To confirm this, three chemical analyses were performed using energy-dispersive X-ray spectroscopy. The first covered a larger area (Figure A1 and Figure A2c), the second focused on the grain boundary (Figures S4 and S5e), and the third covered a small area within a grain (Figure A1 and Figure A2g). Furthermore, Figure A1 and Figure A2d,f,h show their respective spectrum obtained from the EDS analysis of the three zones. The first-largest area shows a carbon content in the steel (Figure A1 and Figure A2d) of 10.64 and 14.11 wt.% for Sb8 and Sb12 steel, respectively. However, when performing the analysis at the grain boundary (Figure A1 and Figure A2f), the carbon content increases, presenting a value of 17.89 and 27.92 wt.% for Sb8 and Sb12 steel, respectively. Finally, for the analysis within the ferrite grain (Figure A1 and Figure A2h), the carbon content decreases, presenting a value of 13.29 and 15.69 wt.% for Sb8 and Sb12 steel, respectively. These differences in carbon content confirm the presence of carbides at the grain boundaries. It should be noted that EDS analysis is not the best quantitative technique for analyzing carbon content, since the initial carbon concentration in both steels is close to 0.01 wt.%, as determined by spark emission spectroscopy. The carbides analyzed were shown with red arrows in Figure A1 and Figure A2 of the Appendix A, and according to the characteristics, they were shown in the same way as in Figure 2, Figure 3 and Figure 4 of the manuscript.
Figure A1.
Microstructure of equiaxed grains and carbides in Sb8 steel obtained by scanning electron microscopy (SEM). Secondary (a) and backscattered (b) electron micrographs. Micrographs with the Energy-Dispersive X-ray Spectroscopy (EDS) analysis zone (c,e,g); and their respective EDS analysis (d,f,h). Red arrows indicate the presence of carbides.
Figure A2.
Microstructure of equiaxed grains and carbides in Sb12 steel obtained by scanning electron microscopy (SEM). Secondary (a) and backscattered (b) electron micrographs. Micrographs with the Energy-Dispersive X-ray Spectroscopy (EDS) analysis zone (c,e,g); and their respective EDS analysis (d,f,h). Red arrows indicate the presence of carbides.
References
- Elgamli, E.; Anayi, F. Advancements in electrical steels: A comprehensive review of microstructure, loss analysis, magnetic properties, alloying elements, and the influence of coatings. Appl. Sci. 2023, 13, 10283. [Google Scholar] [CrossRef]
- De Almeida, A.T.; Ferreira, F.J.T.E.; Fong, J. Perspectives on electric motor market transformation for a net zero carbon economy. Energies 2023, 16, 1248. [Google Scholar] [CrossRef]
- Ma, D.; Sun, C.; Li, Y.; Tian, B.; Wang, L.; Pei, R. Study of magnetic properties of electrical steels with different Si content considering the effect of temperature. AIP Adv. 2023, 13, 025044. [Google Scholar] [CrossRef]
- Babapour, A.; Hosseinipour, S.J.; Jamaati, R.; Abbasi, M. Effect of antimony addition and asymmetric cold rolling on the texture and magnetic properties of a 1.2% Si steel. J. Magn. Magn. Mater. 2022, 554, 169258. [Google Scholar] [CrossRef]
- Chen, D.M.; Wang, G.D.; Liu, H.T. The significance of hot-rolled microstructure controlled by fine-tuning Al content to texture evolution and magnetic properties of low silicon non-oriented electrical steels. J. Magn. Magn. Mater. 2021, 528, 167740. [Google Scholar] [CrossRef]
- Zhou, M.; Zhang, X. Regulating the recrystallized grain to induce strong cube texture in oriented silicon steel. J. Mater. Sci. Technol. 2022, 96, 126–139. [Google Scholar] [CrossRef]
- He, Y.; Hilinski, E.J. Skew rolling and its effect on the deformation textures of non-oriented electrical steels. J. Mater. Process. Technol. 2017, 242, 182–195. [Google Scholar] [CrossRef]
- An, L.Z.; Wang, Y.P.; Wang, G.D.; Liu, H.T. Comparative study on microstructure and texture evolution of low silicon non-oriented electrical steels along one-stage and two-stage cold rolling processes. J. Magn. Magn. Mater. 2023, 567, 170358. [Google Scholar] [CrossRef]
- Hernández Navarro, F.; Gutiérrez Castañeda, E.; Salazar Muñoz, V.E.; Bedolla Jacuinde, A.; Deaquino Lara, R.; Salinas Rodríguez, A.; Zambrano Robledo, P. Influence of chemical composition and processing conditions on the microstructure and magnetic properties of low-carbon Si-Al-Sb electrical steel sheets. J. Magn. Magn. Mater. 2023, 569, 170431. [Google Scholar] [CrossRef]
- Jiao, H.; Xie, X.; Hu, X.; Zhao, L.; Misra, R.D.K.; Liu, D.; Tang, Y.; Hu, Y. Role of hot rolling in microstructure and texture development of strip cast non-oriented electrical steel. Metals 2022, 12, 354. [Google Scholar] [CrossRef]
- Hernández, M.G.; Hernández, F.; Salinas, A.; Deaquino, R.; Palomares, S.A.; Cruz, P.; Aragón, A.; González, J.A.; Reyes, I.A.; Aguilar, J.; et al. The combined effects of plastic deformation and two-phase annealing, applied to hot-rolled bands, on the final microstructure and magnetic properties of non-oriented electrical steel sheets. Metall. Mater. Trans. A 2024, 55, 198–208. [Google Scholar] [CrossRef]
- Jiao, H.; Xu, Y.; Zhao, L.; Misra, R.D.K.; Tang, Y.; Liu, D.; Hu, Y.; Zhao, M.; Shen, M. Texture evolution in twin-roll strip cast non-oriented electrical steel with strong cube and goss texture. Acta Mater. 2020, 199, 311–325. [Google Scholar] [CrossRef]
- Hawezy, D.; Birosca, S. Disparity in recrystallization of α- & γ-fibers and its impact on cube texture formation in non-oriented electrical steel. Acta Mater. 2021, 216, 117141. [Google Scholar] [CrossRef]
- Xu, Y.; Jiao, H.; Qiu, W.; Kumaru-Misra, R.D.; Li, J. Effect of cold rolling process on microstructure, texture and properties of strip cast Fe-2.6%Si steel. Materials 2018, 11, 1161. [Google Scholar] [CrossRef]
- Chen, D.M.; An, Z.Z.; Wang, G.D.; Liu, H.T. Effects of hot rolling and coiling temperatures on microstructure, texture and magnetic properties of 1.6 wt% Si non-oriented silicon steel. Mater. Today Commun. 2022, 31, 103807. [Google Scholar] [CrossRef]
- An, L.Z.; Wang, Y.P.; Wang, G.D.; Liu, H.T. Fabrication of high-performance low silicon non-oriented electrical steels by a new method: Low-finishing-temperature hot rolling combined with batch annealing. J. Magn. Magn. Mater. 2022, 546, 168907. [Google Scholar] [CrossRef]
- Wu, X.; Yang, P.; Gu, X.; Pei, W.; Leng, Y. The influence of normalization temperatures on different texture components and magnetic properties of nonoriented electrical steels. Steel Res. Int. 2020, 92, 2000361. [Google Scholar] [CrossRef]
- Xie, L.; Liu, S.; He, M.; Wang, J.; Wang, J.; Lu, Y.; Xu, W.; Yao, C. Growth and strain behavior of columnar grains in Fe-0.5%Mn alloy by hot-rolling. J. Alloys Compd. 2021, 877, 160257. [Google Scholar] [CrossRef]
- Ortiz Rangel, H.; Salinas Rodríguez, A.; García Rincón, O. Effect of annealing prior to cold rolling on the microstructure evolution and energy losses of low-Si, ultra-low-C hot-rolled electrical steel. Metals 2020, 10, 957. [Google Scholar] [CrossRef]
- Hernández-Navarro, F.; Gutiérrez-Castañeda, E.; Torres-Castillo, A.; Bedolla-Jacuinde, A.; Deaquino-Lara, R.; Salinas-Rodríguez, A.; Rodríguez-Reyna, S.; Reyes-Domínguez, I. Effect of annealing treatment prior to cold rolling on the final microstructure and magnetic properties of an ultra-low carbon non-oriented Si–Sb electrical steel. MRS Adv. 2023, 8, 1123–1128. [Google Scholar] [CrossRef]
- Hernández, F.; Torres, A.; Hernández, L.; Bedolla, A.; Deaquino, R.; Salinas, A.; Altamirano, G.; Gutiérrez, E. Microstructure, texture and magnetic properties of Si-Sb ultra-low carbon electrical steels, hot-rolled at temperatures below AC1 and subjected to annealing before to cold rolling. Mater. Lett. 2025, 385, 138191. [Google Scholar] [CrossRef]
- Horiuchi, K.; Ogawa, T.; Wang, Z.; Adachi, Y. Three-Dimensional Analysis of Ferrite Grains Recrystallized in Low-Carbon Steel during Annealing. Materials 2021, 14, 4154. [Google Scholar] [CrossRef]
- López-Granados, N.M.; Gutiérrez-Castañeda, E.J.; Salinas-Rodríguez, A. Effect of cold rolling prior to annealing on the grain size-energy losses relationship in a low carbon grain non-oriented semi-processed electrical steel. Metals 2022, 12, 1211. [Google Scholar] [CrossRef]
- Ouyang, Y.; Liu, J.; Qiu, Y.; Cheng, Z. The effect of temper rolling and final annealing on microstructure, texture and magnetic properties of non-oriented electrical steels. J. Mater. Res. Technol. 2022, 20, 3136–3145. [Google Scholar] [CrossRef]
- Landgraf, F.J.G.; Emura, M.; Teixeira, J.C.; De Campos, M.F. Effect of grain size, deformation, aging and anisotropy on hysteresis loss of electrical steels. J. Magn. Magn. Mater. 2000, 215–216, 97–99. [Google Scholar] [CrossRef]
- Wang, S.J.; Li, M.; Wang, H.X.; Xu, C.X.; Lin, Y.; Wei, H.; Zhang, W.K.; Qiu, S.Y.; Wang, Y.D. Effect of grain size before cold rolling on microstructure, texture and magnetic properties of ultra-thin low-Si non-oriented silicon steel. JOM 2023, 75, 1824–1838. [Google Scholar] [CrossRef]
- Du, Y.; O’Malley, R.J.; Buchely, M.F.; Kelly, P. Effect of annealing time on texture evolution of Fe–3.4 wt% Si nonoriented electrical steel. Steel Res. Int. 2023, 94, 2300218. [Google Scholar] [CrossRef]
- Jiao, H.; Xu, Y.; Qiu, W.; Xu, H.; Misra, R.D.K.; Du, Y.; Li, J.; Wang, G. Significant effect of as-cast microstructure on texture evolution and magnetic properties of strip cast non-oriented silicon steel. J. Mater. Sci. Technol. 2018, 34, 2472–2479. [Google Scholar] [CrossRef]
- Buttle, D.; Cruby, C. Residual stresses: Measurement using magnetoelastic effects. In Encyclopedia of Materials: Science and Technology, 2nd ed.; Elsevier: Amsterdam, The Netherlands, 2001; pp. 8173–8180. [Google Scholar] [CrossRef]
Disclaimer/Publisher’s Note: The statements, opinions and data contained in all publications are solely those of the individual author(s) and contributor(s) and not of MDPI and/or the editor(s). MDPI and/or the editor(s) disclaim responsibility for any injury to people or property resulting from any ideas, methods, instructions or products referred to in the content. |
© 2025 by the authors. Licensee MDPI, Basel, Switzerland. This article is an open access article distributed under the terms and conditions of the Creative Commons Attribution (CC BY) license (https://creativecommons.org/licenses/by/4.0/).