Abstract
Fires in underground mines pose significant risks to worker safety. In this study, a digital twin of an underground mine was created, and the heat, gas distribution, and airflow dynamics were investigated during and after the fire using computational fluid dynamics (CFDs) methods at three different locations. While traditional methods did not indicate any problems, the results from the CFDs analyses revealed some important findings. One of the key findings of the study was the change in airflow direction caused by the changing thermodynamic conditions caused by the fire. The digital twin allows us to demonstrate how a fire at any point within the mine can affect the entire mine under these changing thermodynamic conditions. The digital twin enables the real-time monitoring of underground events. Additionally, it facilitates strategic planning to anticipate potential incidents during a fire in an underground mine, allowing for necessary precautions to be implemented.
1. Introduction
Ventilation infrastructure and planning are one of the most crucial aspects of mine planning. Grozdanovic et al. [] highlighted in their study that effective ventilation planning is vital for information communication and occupational health and safety (OHS) in mining operations. Additionally, Nyaaba et al. [] explored the algorithm that should be implemented for ventilation planning in underground mines. Underground ventilation systems are crucial for providing fresh air flow and removing contaminated air. McPherson [] emphasized that airflow, temperature, and humidity variations are fundamental factors in designing underground ventilation systems and demonstrated that these variables can be improved through modeling. CFDs techniques offer powerful tools for optimizing these systems and evaluating their performance.
CFDs is a powerful tool for conducting numerical experiments that can help determine difficult or impossible indices to obtain through laboratory or full-scale experiments. These numerical experiments can assist in interpreting physical experiments and provide a deeper understanding of the phenomena observed during those physical tests [].
CFDs analyses are significant, provided that suitable modeling procedures are adopted and modern computational techniques are utilized. CFDs can be employed not only to perform virtual experiments but also to enhance the design of physical experiments and improve overall efficiency []. CFDs deals with the numerical solution of the differential equations that govern fluid flow physics and the fluid’s interaction with solid bodies [].
CFDs modeling has become an essential research and design tool in various mining industry. It aids in understanding and analyzing fluid and gas flow mechanisms while enhancing efficiency, safety, and health [,,,,,,,].
Studying spontaneous combustion in the gob area can be both costly and hazardous. However, CFDs has facilitated critical research on spontaneous combustion within the mining sector [,,,,,,,,,,]. Moreover, CFDs has been employed in various studies, including methane flow, landfill gas flow, and inertization. For instance, Bandopadhyay and Zhang [] examined heat and mass transfer underground through parametric analysis. These studies have become significantly safer and more manageable thanks to CFDs technology.
Mine fires present significant risks to safety in underground environments. The presence of toxic gases and reduced visibility due to these fires creates a hazardous atmosphere for miners. They may suffer serious injuries from inhaling harmful products of combustion. Trevits et al. [] studied the characteristics of heat using CFDs. Similarly, Edwards and Hwang [,] conducted a series of CFDs studies to understand the propagation of mine fire and smoke. Kumar et al. [] examined turbulent flow conditions using CFDs. Many experimental results and reports have been published to describe fire in a CFDs model [,,,,,,].
Aksoy [] conducted insightful CFDs analyses on a model derived from experimental data to thoroughly explore the impacts of the evolving fire during the 2014 Soma mine disaster.
Aksoy et al. [] published a study following the Soma mine disaster, revealing that gases such as CO and CO2, HCN, Cl2, and H2S, which are lethal at low concentrations, were released during a conveyor belt fire. Another significant finding was that underground mine thermodynamic conditions could change completely quickly depending on the fire’s magnitude.
A comparison of CFDs applications in mining industry research is given in Table 1 [].

Table 1.
Comparison of CFDs applications in mining industry (edited from Yi et al. []).
This study integrated an underground mine into a full-scale CFDs model. It was investigated how the planned fire in three different regions affected the air flow in the mine and how the gases followed a path. The most important outcome of the research was the determination of significant change trends in the air flow trend as the fire’s heat changed the mine’s thermodynamic conditions. This critical change causes air to flow in the opposite direction, undermining expectations and jeopardizing rescue plans detailed in emergency action protocols. Air outlets transform into air inlets, and air inlets become outlets. Furthermore, a more powerful fire can significantly escalate the danger, intensifying the precarious situation.
The main objective of this research is to create a digital twin of an underground mine and use CFDs analyses on this twin to minimize disruption in the event of a fire. The findings presented in this article represent the first phase of this study. As a novel feature, the consequences of a fire occurring at different locations and sizes were examined on the digital twin. Based on these results, the requirements of the underground mine in the event of a fire were determined using CFDs analysis. The created twin underground mine is identical in all its elements to its real twin. Numerous geometric objects, such as fans, fan tubes, airways, air gates, galleries, and ramp dimensions, were captured as point clouds and included in the analysis. The boundary and initial conditions for the twin creation phase were determined from field measurements taken on the real twin and integrated into the model. In other words, all geometric dimensions and airflow data at any location within the underground mine were obtained from real measurements.
2. Materials and Methods
In this study, mesh optimization was initially conducted to assess the accuracy of the CFDs model. Subsequently, the second and third methods mentioned above were employed to calibrate the model. Literature sources [,,] were utilized to define the fire energy in the model, while measurements and experiments carried out in the mine were used to evaluate the accuracy of the airflow within the mine (Table 2). The values given in Table 2 are the values obtained from air measurements performed in the real twin (underground mine) and the digital air quantities measured at the same points in the digital twin. On the other hand, to determine whether the digital twin had the same environment as the real twin, airflow gates on different production floors were closed at different levels, and air velocity, air volume, and temperature measurements were taken at different points in the underground operation. The results were found to be sufficiently accurate for such a study. A precision of 5% for temperature and 2% for air volume and velocity are considered sufficient for such an investigation. In the studies conducted, the similarity between the digital twin and the real twin remained within these limits. The data used, based on previous studies [,,], are also those used in previous publications. References [,] present data from previous studies and actual measurement data. References [,] consist of sensor data obtained from the underground mine during the actual fire, as well as real-time tests and test results from a created underground gallery, conducted during a 2.5-year study following the Soma Mine Accident.
Table 2.
Airflow rate measurements taken in the mine and the CFDs model.
2.1. Underground Mine, Ventilation Infrastructure, Equipment, and Placement
The main access to the underground mine, where the research is conducted, is provided via a helical road. Every 15 m down this main ramp, which is inclined at 14 degrees, there is a flat production floor. Two parallel-connected fans provide the mine’s primary ventilation, each providing 180 kW of energy. Additionally, there are auxiliary fans, each of 55 kW, located at the entrance to each production floor. These fans draw fresh air from the main ramp and supply it to the production areas. Figure 1a illustrates the 3D model of the underground mine. Figure 1b depicts the intermediate floors where production occurs, showcasing the ventilation infrastructure, including the gallery, fans, and air doors. Figure 1c details the placement of auxiliary fans and fan tubes in the floor galleries, while Figure 1d shows the positioning of air doors and open air doors within the mine’s layout. The visual below, i.e., Figure 1, also shows the air volumes measured from the outlet of the fan tubes, both on the main ramp and by floor, as given in Table 1.
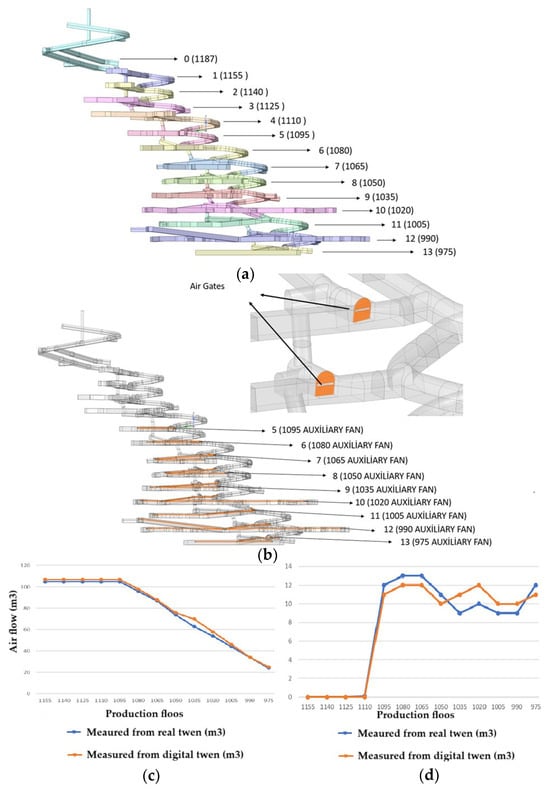
Figure 1.
Three-Dimensional mine geometry including (a) geometry; (b) names of intermediate floors where production is carried out; (c) placement of auxiliary fans and fan ducts on floor geometries; (d) placement of air gates and open air gates on mine geometry.
2.2. CFDs Analyses in the Underground Mine
In-depth analyses were conducted using advanced CFDs techniques as a crucial component of the metal mine ventilation study. These analyses were specifically designed to rigorously evaluate the conditions within the mine, assess the effectiveness of the existing ventilation infrastructure, and analyze the system’s performance in the event of fire scenarios. This comprehensive approach ensures that we not only understand current ventilation capabilities but also enhance safety and operational efficiency in the mine.
CFDs is a vital engineering discipline that delves into the intricate movement of fluids and the physical processes accompanying them through advanced numerical methods. At the core of this field are the Navier–Stokes equations, which intricately define crucial parameters such as velocity, pressure, and temperature over time and space. CFDs effectively solves these complex equations by employing sophisticated numerical techniques, including finite differences, finite volumes, and finite elements. CFDs is an indispensable tool for tackling a wide array of challenges in engineering, such as heat transfer, turbulence, chemical reactions, and multiphase flows. With the right meshing strategies and boundary conditions, CFDs simulations can deliver highly detailed insights and predictions, often at a fraction of the cost of traditional experimental testing.
CFDs, which requires solving differential equations based on the finite volume method, involves transforming the conservation equations into a general transport equation form:
This represents a system of algebraic equations [,,]. Here, denotes the dependent variable, is the diffusion coefficient, and is the source term. The sets of equations are derived by specifying these variables appropriately [,].
In the equation, and ; the conservation of mass for compressible flows is obtained as follows:
For , where is the velocity vector of the flow field and with the viscous diffusion of momentum modeled by the stress tensor , the conservation of momentum equation becomes
where is the temperature scalar; and are the thermal conductivity; is the heat generation and other additional energy sources; and , , and yield energy conservation.
Finally, for species transport, is the mass fraction of species (i), is the mass diffusion coefficient of species (i) in the mixture, and is the additional species generation, and the transport equation for chemical species can be expressed as follows:
In each computational cell of the flow domain, these equations are solved by applying integration and interpolation operations to obtain the numerical solution.
The computational mesh was generated using a Cartesian cut-cell mesh method, with the maximum element size increased up to 1 m. Around explicitly added air gates and fan regions, the mesh was locally refined to as small as 0.02 m to accurately capture geometric details. Near-wall viscous effects were resolved using 5 layers of prismatic elements with reduced thickness. A smooth transition between elements of different sizes was achieved with a growth rate of 1.3, resulting in approximately 5 million cells with a minimum orthogonal quality of 0.1. Figure 2 presents the entire computational mesh, along with detailed close-up views of critical geometric regions.
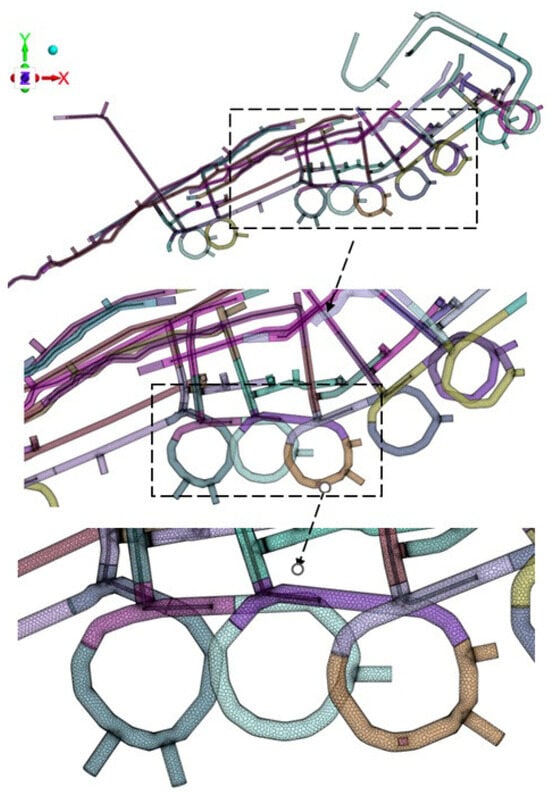
Figure 2.
Mesh structure of underground mine and close-up views.
According to the coordinate system shown in Figure 1, Figure 2 and Figure 3, gravity acts in the negative z-direction. The fire’s smoke in the roadway is greatly influenced by air buoyancy. Therefore, buoyancy effects were incorporated into the simulations by defining the species in the mine as compressible ideal gases and activating the gravity vector as indicated in the conservation equations above. Non-reaction modeling was performed in this study; the behavior of the species was analyzed using the species transport theory. The thermal properties of the species were determined based on the ideal gas mixing law and the kinetic theory of mass diffusivity [,].
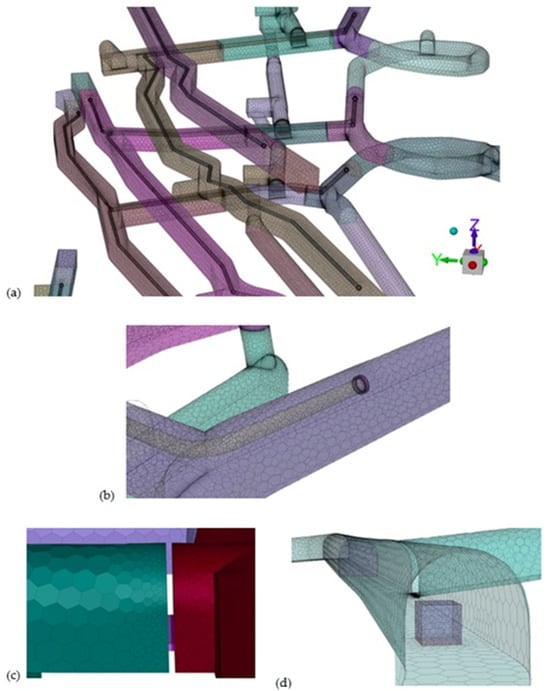
Figure 3.
Sample mesh structure. (a) present close-up views of the mesh on the fan duct and (b) auxiliary fan surfaces, (c) the air gates between levels, (d) cubic cell zones.
The air intake, representing the opening through which fresh air enters the mine, was defined as a Dirichlet boundary condition, with the atmospheric pressure applied as follows:
The exhaust fan boundary condition, representing the region where gases exit the mine, was implemented using a Robin-type boundary condition that accounts for the fan performance curve, expressed as follows:
where () denotes the average velocity at the fan zone. Auxiliary fans located at the fan duct inlets were modeled using the same boundary condition type, where represents the pressure immediately upstream of the fan. As seen in the equation, the fan-generated head and flow rate characteristics were represented by a second-order polynomial, with the coefficients , , and adjusted to account for choke and stall conditions. Figure 3a,b present close-up views of the mesh on the fan duct and auxiliary fan surfaces, respectively.
The air gates between levels, shown in Figure 3c, were explicitly included in the computational mesh using geometric modeling that reflects their actual opening dimensions in the real application.
The heat release and gas generation during the fire were introduced into the conservation equations as source terms [], represented by and . For this purpose, cubic cell zones were defined at the corresponding fire locations within the computational domain, as illustrated in Figure 3d.
Fire Scenarios and Results in Underground Mines
Fire scenarios were planned at three different points of the mine. First of all, the correct operation of the model was ensured by analyzing the currently operating system. At this stage, air flow rates and air speeds at different locations in the mine were taken as the base. As mentioned above, information from the literature was used in CFDs analyses. A loader was assumed to be burning for the fire scenario in the mine. According to the internationally recognized study by Hansen [,], a fire with a power output of 25 MW occurs after a loader burns. This fire reaches its maximum temperature in the 10th minute and is extinguished in the 20th minute. Hansen [,] analyzed four different methodologies to calculate the ignition of various components of a mining vehicle in a mine and compared the results with two full-scale fire experiments carried out on mining vehicles. As a result, he proposed the graph given in Figure 4, which can be used for fire identification in a mine.
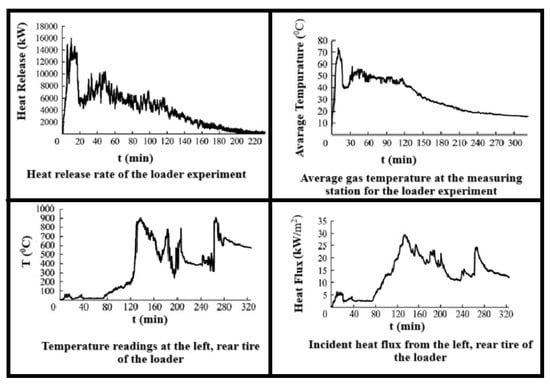
Figure 4.
Results of full-scale experiments carried out in the mine with loader (adapted from Hansen [,,].
Figure 5 shows the planned fire locations in the underground mine. The first fire location was selected near the mine entrance, the second in the middle sections, and the third in the depths of the mine. All three fire scenarios were planned on the air intake path.
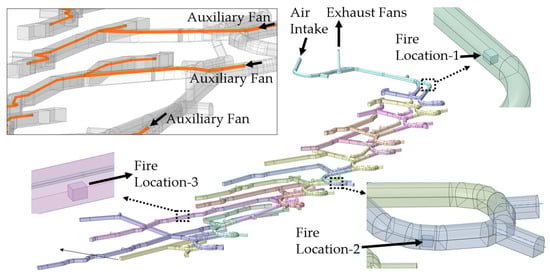
Figure 5.
Fire scenario locations.
3. Results of Fire Scenarios in Underground Mines
In the first fire scenario, the mine entrance was selected. The main objective was to thoroughly understand how the fire affected the thermodynamics of the mine. It was also aimed to track the trajectory of the toxic gases released during the event and to analyze their concentration levels over time. Figure 6 shows the time-dependent changes and paths followed by changes in heat and gas concentrations resulting from the fire. The time-dependent toxic gas concentrations in the fire zone and on the 990th production floor are given in Figure 7 and Figure 8, respectively.
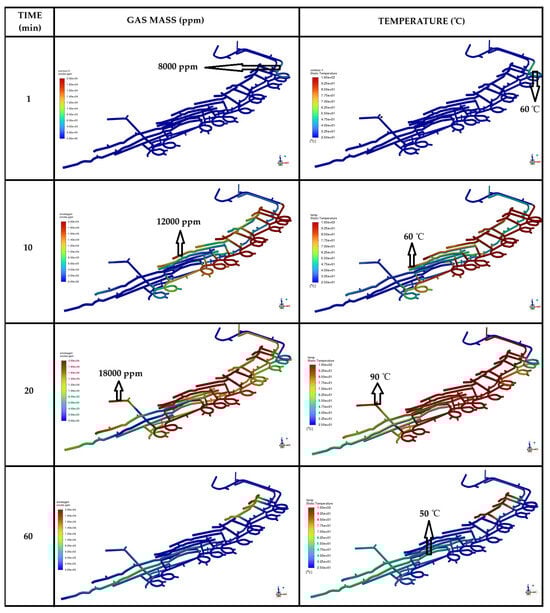
Figure 6.
Time-dependent gas and heat transfer contours for a fire scenario at the mine entrance.
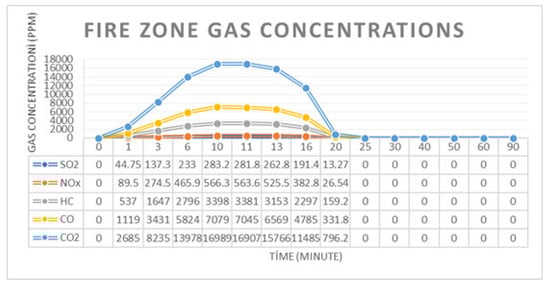
Figure 7.
Gas concentration changes over time in fire zone 1.
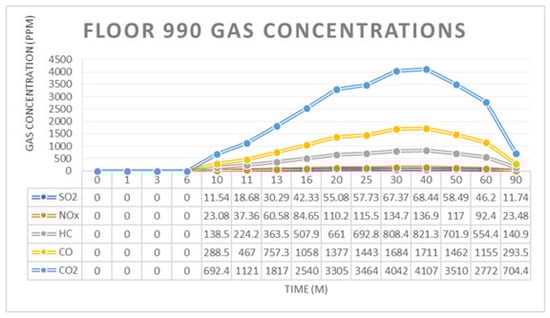
Figure 8.
Gas concentration changes over time on floor 990.
In the first minute, a rapid increase in CO2 and CO smoke concentrations is observed, reaching an astonishing 8000 ppm. The temperature in the fire zone increases significantly and reaches over 70 °C. It is remarkable to see how hot air visibly flows from the main gallery and temperatures rise to around 60 °C in the main gallery. In the sixth minute, the situation intensifies, with gas concentrations reaching 25,000 ppm and temperatures exceeding 200 °C. Furthermore, fresh air mixes in as the hot air continues through the main gallery. By the 10th minute, the total gas concentration in the main gallery reaches over 30,000 ppm, while temperatures reach around 160 °C. This polluted and hot air from the main ramp starts to enter the production galleries thanks to the auxiliary fans. The fire is extinguished by the 20th minute, and in the 25th minute, fresh air begins to increase in the main gallery, reducing the concentration of toxic gases to 10,000 ppm. By the 30th minute, fresh air begins to flow into the lower levels. By the 90th minute, fresh air appears to have dominated the mine. However, some gas remains in the lower galleries, with slower air movement. Here, the gas concentration remains at 2000 ppm in the lower parts, reaching 9000 ppm on the upper floor. In the fire zone, toxic gases rose by the 10th minute, reaching a near significant peak by the 20th minute. Meanwhile, on the 990th floor, the presence of auxiliary fans facilitated gas transport, leading to maximum gas concentrations at 40th minute, followed by a gradual decline until 90th minute. The rapid clearance of the fire zone, supported by the strong airflow on the main ramp, contrasts sharply with the prolonged clearance due to the weaker airflow on the 990th floor. In this fire scenario, the air flow direction tends to change slightly.
In the second fire scenario, the middle section of the mine was chosen. The primary objective was to observe the air and gas flows, especially the thermodynamic conditions that change with the fire, over time. Figure 9 shows the changes in heat and gas concentrations over time. The toxic gas concentrations in the fire zone and on the 990th production floor are presented in Figure 10 and Figure 11, respectively.
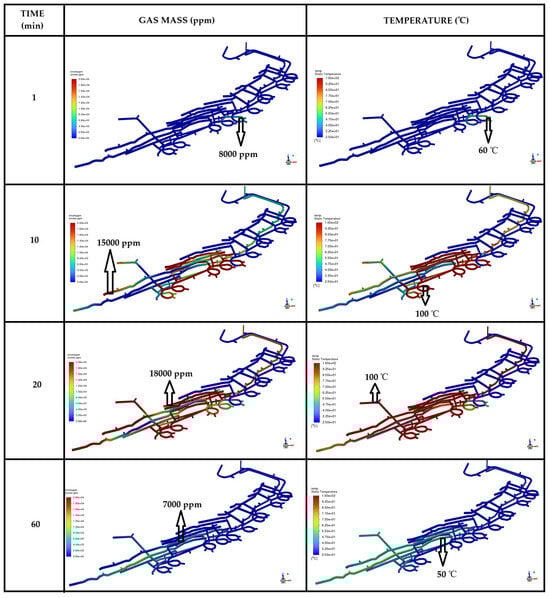
Figure 9.
Time-dependent gas and heat transfer contours for a fire scenario in the center of the mine.
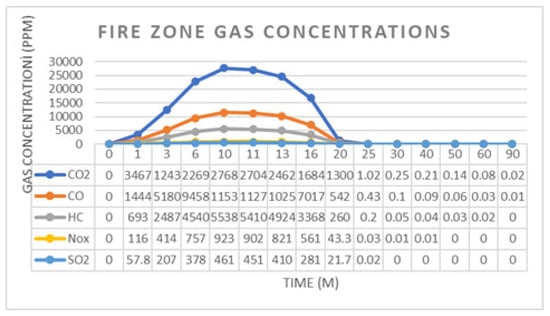
Figure 10.
Gas concentration changes over time in fire zone 2.
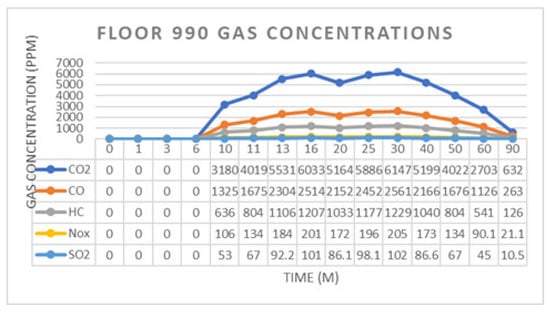
Figure 11.
Gas concentration changes over time on the 990th production floor.
Toxic gas concentration at the fire zone rapidly increases to 8000 ppm, and the temperatures exceed 60 °C within the 1st minute. The gas continues to spread along the main ramp and reaches 20,000 ppm levels at the 6th minute. The concentration of gases reaching the inner galleries through the auxiliary fans exceeds 5000 ppm. While the temperature on the main ramp exceeds 75 °C, the temperatures transmitted to the galleries through the auxiliary fans reach 90 °C. At 10th minute, the gas and the related temperature increase reach the lowest galleries. Due to the auxiliary fans, the gas concentration in the inner galleries reaches 20,000 ppm. As the density of the heated air in these galleries decreases, gas accumulations are observed near the ceilings of the galleries. Temperatures increase to 200 °C on the main ramp and to 100 °C in the inner galleries. Fresh air begins to reach the lower levels via the main ramp at the 25th minute. Temperature drops are observed at the ends of the inner galleries due to the fresh air provided by the auxiliary fans. After the 90th minute, the mine is free from the effects of the fire. Time-dependent gas concentrations were meticulously monitored both in the fire zone and on the 990th floor gallery. In the fire zone, gas levels were observed to rise dramatically, peaking at the 10th minute and dropping to almost zero ppm at the 20th minute. Meanwhile, on the 990th floor, auxiliary fans effectively transported the gas, causing the gas concentrations to reach a maximum in the 30th minute and then drop significantly to almost zero in the 90th minute. In this fire scenario, the air flow direction also tended to change.
The location of the third fire scenario is very important, as it represents one of the last points where clean air enters after passing through the mine entrance. The primary objective was to observe whether there would be a change in the direction of air flow due to the change in thermodynamic conditions of the mine. If the contaminated air tends to move in the direction of the air inlet, it could create serious safety hazards in the mine. This means that a higher energy fire could overcome the incoming air pressure and move in the direction of the air inlet. Figure 12 shows how the heat and gas concentrations due to the fire change over time. The toxic gas levels in the fire area are presented in Figure 13, while Figure 14 shows the concentrations found on the 990th production floor.
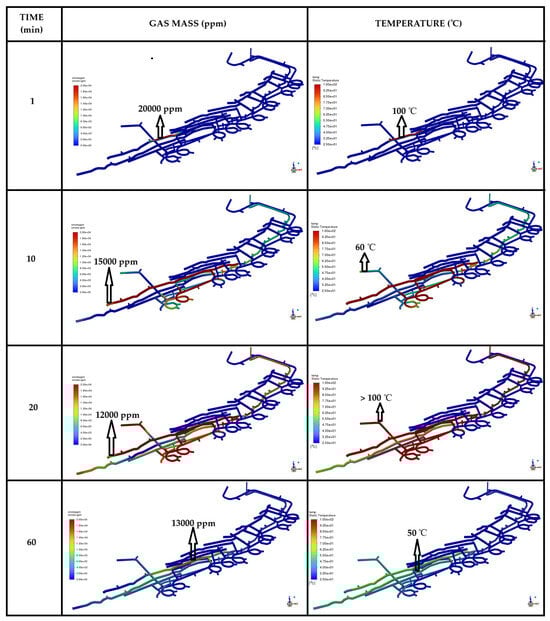
Figure 12.
Time-dependent gas and heat transfer contours for a fire scenario at the lowest point of the mine.
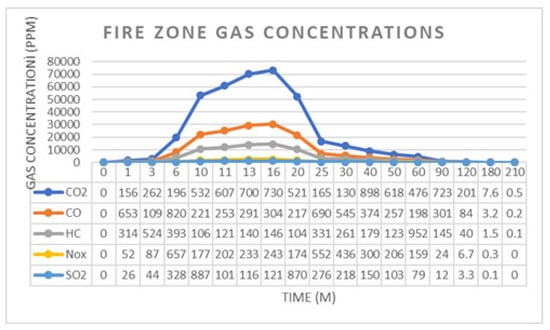
Figure 13.
Gas concentration changes over time in fire zone 3.
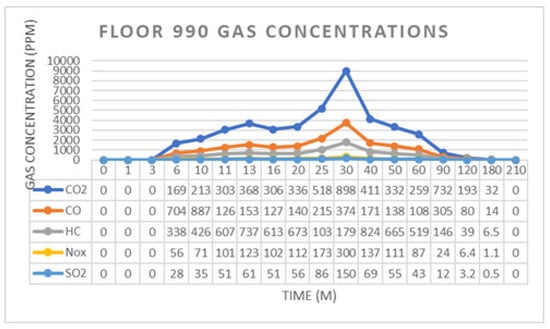
Figure 14.
Gas concentration changes over time on the 990th production floor.
The gas concentration rapidly increased to 20,000 ppm. Similarly, the temperature due to the fire rapidly reached 100 °C. At 6th minute, the gas spread down the main ramp to the galleries. It was observed that the gas concentration reached 2500 ppm at the lower levels of the main ramp. In the opposite gallery of the fire zone, accumulations of 10,000 ppm are observed. While the temperature in the lower galleries rapidly increases to 110 °C, temperatures of 100 °C are recorded in the opposite gallery of the fire zone. In the 10th minute, the effect of the fire in the lower galleries reaches 15,000 ppm due to auxiliary fans. At the same time, it is observed that the gases leaking from the fire zone to the main ramp tend to rise to the upper gallery via the main ramp. The gas concentration in the fire zone increases to 30,000 ppm and the temperature in this area reaches 200 °C. In addition, the smoke carried to the lower galleries by auxiliary fans causes temperatures of 60 °C at the gallery ends. In the 90th minute, it was observed that the fire-related elements were almost completely cleared from the mine.
Gas concentration levels were documented over time both in the fire zone and in the 990th floor cross-section gallery. In the fire zone, gas levels increase until 16th minute, peak at that time, and then drop to nearly 0 ppm at 90th minute. On floor 990, the use of auxiliary fans carries the smoke and causes gas concentrations to reach a maximum at 30th minute, then drop to nearly zero at 120th minute. In this scenario, it was observed that the changing thermodynamic conditions after the fire tended to change the air flow. When the fire scenarios were examined, it was seen that everything could change in a longer and stronger fire. To test this, a fire simulation that was twice as strong was examined at the fire location in scenario 1. Changes over time will not be given here. However, it can be seen in Figure 15 how easily a strong fire changes the air flow direction.
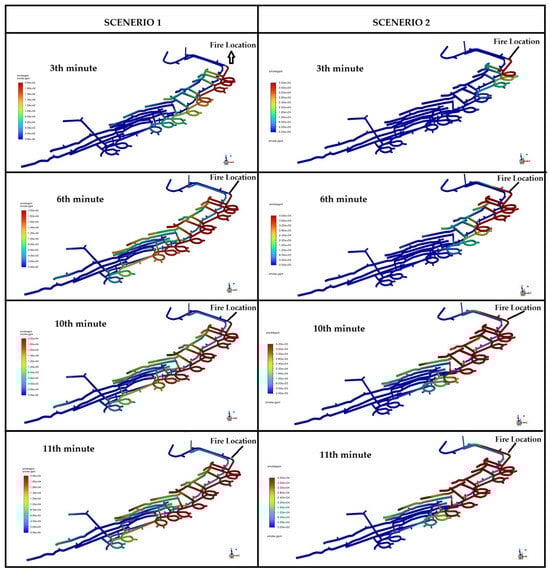
Figure 15.
Change in air flow direction if the fire in the third scenario lasts longer and differences between scenario 1 and scenario 4.
4. Discussion
This study focuses on the performance of ventilation systems and the tendency to change in air flow direction in the aftermath of potential fire incidents. Using advanced CFD, simulations were conducted based on three distinct fire scenarios. The findings offer comprehensive insights into the dynamics of heat release, the distribution of toxic gases, and the efficiency of gas evacuation within the ventilation system. Additionally, important results concerning the changing trends in air flow direction after changing thermodynamic conditions were obtained.
Three separate locations were strategically selected for the 25 MW fire scenarios. It was predicted that these fires would reach peak temperatures at 10 min and be successfully extinguished at 20 min. Analyses examined critical areas, gas release times, gas accumulation, and possible changes in air flow direction. In the first fire scenario, a fire at the mine entrance revealed an alarming trend. Smoke and heat rapidly spread from the main ramp into the lower levels.
The most critical finding in the second fire scenario is the increase in toxic gases and heat in the environment immediately after the fire breaks out which then rapidly moves towards the lower production areas of the mine. This air, which descends to the lower floors, also quickly penetrates the main ramp and cross galleries. Auxiliary fans also contribute to this situation.
In scenario 3, it was observed that the gas from the fire began to rise towards the ceiling within just 6 min, showing a natural upward trend. This upward movement continued until the 25th minute, highlighting the need for proactive measures. In more intense fires, changing thermodynamic conditions can elevate gas and heat up the main ramp, making it essential to address airflow issues. However, if the pressure generated by the fire overcomes the inlet air pressure, then the situation can go awry. The path of the fresh air can then be reversed, posing serious risks to workers. It can clearly be seen that where the first fire scenario is analyzed, the air flow direction changes in case of a fire that is twice as strong (Figure 15). The momentum generated by the fire exceeds the pressure difference created by the fan, causing the air to flow in the opposite direction and pushing the gases toward the fresh air intake. A similar situation was observed in the authors’ previous study [], which took place after a fire in an underground mine. Both the underground sensor data and on-site investigations validated this occurrence. The positioning of auxiliary fans plays a vital role in shaping post-fire smoke distribution and delivery. When the results were examined in general terms, it was observed that they agree with the results of similar studies [,].
5. Conclusions
The ventilation of underground mines is a very complex situation that includes many parameters. Beyond providing sufficient air in mine galleries with just a fan, factors such as air quality, flow rate, humidity, direction, etc., should also be taken into account. In addition to normal mine ventilation, this ventilation infrastructure is also expected to respond to sudden situations that may occur underground and pollute the air. In this case, many parameters such as fans, auxiliary fans, air doors, air paths, air path resistances, and seasons come into play. Thanks to CFDs studies, the ventilation simulation of the entire underground operation has become possible with today’s technology. On the other hand, the most important result of this study is that when a fire breaks out in any part of the mine, the thermodynamic conditions of the entire mine change, the air flow direction tends to change, and the air flow direction changes during a higher energy fire.
In this study, a digital twin of an underground mine was created. In this phase, all geometric elements from the real twin were integrated one-to-one with the digital twin. Detailed ventilation measurements were taken on the real twin and integrated into the digital twin. An interface was created to integrate data from air, pressure, and gas sensors on the real twin into the digital twin. This allows for the simultaneous monitoring of ongoing underground events. Furthermore, the potential for any fire in the underground mine was predicted, enabling strategic planning to take the necessary precautions.
By creating a digital twin of an underground mine, it is possible to predict what is actually occurring underground and what might happen in certain adverse situations. Using the results of this study, strategic escape plans can be developed in the event of a fire, which could occur in different locations and can be different sizes. Depending on the location and size of the fire, it is possible to predict how much or how completely the air vents on each production floor should be closed.
Author Contributions
C.O.A.: Research design, concept preparation, data interpretation, final writing. G.G.U.A.: Research design, data interpretation, preparation of the first writing. Y.A.: Literature research, data collection, study planning, review. H.B.S.: Data collection, modeling, software analysis, presentation of analysis results. E.K.: Data processing, modeling, software analysis and examination of results. All authors have read and agreed to the published version of the manuscript.
Funding
This research received no external funding.
Data Availability Statement
The original contributions presented in this study are included in the article. Further inquiries can be directed to the corresponding author.
Acknowledgments
The authors would like to thank the TÜMAD Mine Company for allowing the use of the underground mine model and data collection in this research. In addition, software and equipment received from another project supported by TÜBİTAK-TEYDEP were used in this research. The authors thank TÜBİTAK.
Conflicts of Interest
C. Okay Aksoy, G. Gülsev Uyar Aksoy, H. Berker Sarısan are an employee of GOA ARGE MADENCİLİK VE CEVRE TEKNOLOJILERI LTD. STI. Yavuz Aydemir is an employee of TUMAD MADENCILIK VE SANAYI A. Ş.Erdem Kaya is an employee of Diferans Engineering & Simulation. The paper reflects the views of the scientists and not the company.
References
- Grozdanovic, M.; Savic, S.; Marjanovic, D. Assessment of the key factors for ergonomic design of management information systems in coal mines. Int. J. Min. Reclam. Environ. 2015, 29, 96–111. [Google Scholar] [CrossRef]
- Nyaaba, W.; Frimpong, S.; El-Nagdy, K. Optimisation of mine ventilation networks using the Lagrangian algorithm for equality constraints. Int. J. Min. Reclam. Environ. 2015, 29, 201–212. [Google Scholar] [CrossRef]
- McPherson, M.J. Subsurface Ventilation and Environmental Engineering; Springer: Berlin/Heidelberg, Germany, 1993. [Google Scholar]
- Anderson, J.D. Computational Fluid Dynamics. In The Basics with Applications, 1st ed.; McGraw-Hill: New York, NY, USA, 1995. [Google Scholar]
- Xu, G.; Jong, E.C.; Luxbacher, K.D.; Ragab, S.A.; Karmis, M.E. Remote characterization of ventilation systems using tracer gas and CFD in an underground mine. Saf. Sci. 2015, 74, 140–149. [Google Scholar] [CrossRef]
- Blazek, J. Computational Fluid Dynamics: Principles and Applications, 2nd ed.; Elsevier Science: San Diego, CA, USA, 2005. [Google Scholar]
- Wala, A.M.; Vytla, S.; Taylor, C.D.; Huang, G. Mine face ventilation: A comparison of CFD results against benchmark experiments for the CFD code validation. NIOSH Min. Eng. 2007, 59, 49–55. [Google Scholar]
- Wala, A.M.; Yingling, J.C.; Zhang, J.; Ray, R. Validation study of computational fluid dynamics as a tool for mine ventilation design. In Proceedings of the 6th International Mining Ventilation Congress, Pittsburgh, PA, USA, 17–22 May 1997. [Google Scholar]
- AWala, M.; Yingling, J.C.; Zhang, J. Evaluation of the face ventilation systems for extended cuts with remotely operated mining machines using three-dimensional numerical simulations. In Proceedings of the SME Annual Meeting, Orlando, FL, USA, 9–11 March 1998; pp. 98–209. [Google Scholar]
- Jade, R.K.; Sastry, B.S. An experimental and numerical study of two-way splits and junctions in mine airways. In Proceedings of the 12th US/North American Mine Ventilation Symposium, Reno, NV, USA, 9–11 June 2008; pp. 293–298. [Google Scholar]
- Zheng, Y.; Tien, J.C. DPM dispersion study using CFD for underground metal/nonmetal mines. In Proceedings of the 12th US/North American Mine Ventilation Symposium, Reno, NV, USA, 9–11 June 2008; pp. 487–494. [Google Scholar]
- Kurnia, J.C.; Sasmito, A.P.; Wong, W.Y.; Mujumdar, A.S. Prediction and innovative control strategies for oxygen and hazardous gases from diesel emission in underground mines. Sci. Total. Environ. 2014, 481, 317–334. [Google Scholar] [CrossRef] [PubMed]
- Aminossadati, S.M. Numerical simulation of ventilation air flow in underground mine workings. In Proceedings of the 12th US/North American Mine Ventilation Symposium, Reno, NV, USA, 9–11 June 2008; pp. 253–260. [Google Scholar]
- Zhang, X.; Zhang, Y.; Tien, J.C. The efficiency study of the push-pull ventilation system in underground mine. In Proceedings of the 2011 Underground Coal Operators’ Conference, Wollongong, NSW, Australia, 10–11 February 2011. [Google Scholar]
- Yuan, L.; Smith, A.C. CFD modeling of spontaneous heating in a large-scale coal chamber. J. Loss Prev. Process. Ind. 2009, 22, 426–433. [Google Scholar] [CrossRef]
- Yuan, L.; Smith, A.C. Computational fluid dynamics modeling of spontaneous heating in longwall gob areas. In Proceedings of the Society of Mining Engineering Annual Meeting, Denver, CO, USA, 25–28 February 2007; pp. 7–101. [Google Scholar]
- Yuan, L.; Smith, A.C. Modeling the effect of barometric pressure changes on spontaneous heating in bleederless longwall panels. In Proceedings of the Society of Mining Engineering Annual Meeting, Denver, CO, USA, 25–28 February 2007; pp. 7–101. [Google Scholar]
- Toraño, J.; Torno, S.; Menéndez, M.; Gent, M. Auxiliary ventilation in mining roadways driven with roadheaders: Validated CFD modelling of dust behaviour. Tunn. Undergr. Space Technol. 2011, 26, 201–210. [Google Scholar] [CrossRef]
- Yuan, L.; Smith, A.C. Effects of ventilation and gob characteristics on spontaneous heating in longwall gob areas. In Proceedings of the 12th US/North American Mine Ventilation Symposium, Reno, NV, USA, 9–11 June 2008; pp. 141–147. [Google Scholar]
- Smith, A.C.; Yuan, L. Simulation of spontaneous heating in longwall gob area with a bleederless ventilation system. In Proceedings of the Society of Mining Engineering Annual Meeting, Salt Lake City, UT, USA, 24–27 February 2008; pp. 8–43. [Google Scholar]
- Daloğlu, G. Modeling Air Velocity and Methane Behavior in Underground Mining Operations Using Computational Fluid Dynamics (CFD). Ph.D. Thesis, Eskisehir Osmangazi University, Eskişehir, Türkiye, 2017. [Google Scholar]
- Yi, H.; Kim, M.; Lee, D.; Park, J. Applications of Computational Fluid Dynamics for Mine Ventilation in Mineral Development. Energies 2022, 15, 8405. [Google Scholar] [CrossRef]
- Ndenguma, F. A computational fluid dynamics model for investigating airflow patterns in underground coal mine sections. J. South Afr. Inst. Min. Metall. 2014, 114, 419–4226. [Google Scholar]
- Prasad, N.; Lal, B. Analysis of heat stress in an underground coal mine using computational fluid dynamics. Curr. Sci. 2021, 121, 264–274. [Google Scholar] [CrossRef]
- Sasmito, A.P.; Birgersson, E.; Ly, H.C.; Mujumdar, A.S. Some Approaches to İmprove Ventilation Systems in Underground Coal Mines—A Computational Fluid Dynamic Study; Minerals Metals Materials Technology Centre (M3TC); National University of Singapore: Singapore, 2012. [Google Scholar]
- Bandopadhyay, S.; Zhang, Y. Parametric analysis of heat and mass transfer process in Arctic mine ventilation. Int. J. Surf. Mining, Reclam. Environ. 1999, 13, 25–30. [Google Scholar] [CrossRef]
- Trevits, M.A.; Yuan, L.; Teacoach, K.; Valoski, M.P.; Urosek, J.E. Understanding Mine Fires by Determining the Characteristics of Deep-Seated Fires. In Proceedings of the Society of Mining Engineering Annual Meeting, Denver, CO, USA, 22–25 February 2009; pp. 05–190. [Google Scholar]
- Edwards, J.C.; Hwang, C.C. CFD analysis of mine fire smoke spread and reverse flow conditions. In Proceedings of the 8th U.S. Mine Ventilation Symposium NIOSH Document, Rolla, MO, USA, 11–17 June 1999; pp. 417–422. [Google Scholar]
- Hwang, C.C.; Edwards, J.C. CFD modeling of smoke reversal. In Proceedings of the International Conference on Engineered Fire Protection Design, San Francisco, CA, USA, 11–15 June 2001; pp. 376–387. [Google Scholar]
- Kumar, A.R.; Salami, O.; Amoah, N.A.; Xu, G. Comparative analysis of different CFD turbulence models for a diesel pool combustion event in an underground mine: A case study. Int. J. Min. Reclam. Environ. 2024, 38, 549–561. [Google Scholar] [CrossRef]
- NFPA. Standard for Smoke and Heat Venting; National Fire Protection Association: Quincy, MA, USA, 2015. [Google Scholar]
- Beard, A.; Richard, C. The Handbook of Tunnel Fire Safety; Thomas Telford Ltd.: London, UK, 2005. [Google Scholar]
- Ingason, H.; Li, Y.Z. Model scale tunnel fire tests with longitudinal ventilation. Fire Saf. J. 2010, 45, 371–384. [Google Scholar] [CrossRef]
- Hansen, R.; Ingason, H. Heat release rate measurements of burning mining vehicles in an underground mine. Fire Saf. J. 2013, 61, 12–25. [Google Scholar] [CrossRef]
- Hansen, R. Study of Heat Release Rates of Mining Vehicles in Underground Hard Rock Mines. Ph.D. Thesis, Mälardalen University, Västerås, Sweden, 2015. [Google Scholar]
- Hansen, R. Fire behavior of mining vehicles in underground hard rock mines. Int. J. Min. Sci. Technol. 2017, 27, 627–634. [Google Scholar] [CrossRef]
- Aksoy, C.O.; Uyar Aksoy, G.G.; Fişne, A. Development of a Basin Mining Model for Occupational Safety in Soma Kömürleri A.Ş.’s Mines; DEPARK: İzmir, Turkey, 2019. [Google Scholar]
- Aksoy, C.; Aksoy, G.; Fişne, A.; Alagoz, I.; Kaya, E. Investigation of a conveyor belt fire in an underground coal mine: Experimental studies and CFD analysis. J. South. Afr. Inst. Min. Met. 2023, 123, 589–597. [Google Scholar] [CrossRef]
- Parra, M.; Villafruela, J.; Castro, F.; Méndez, C. Numerical and experimental analysis of different ventilation systems in deep mines. Build. Environ. 2006, 41, 87–93. [Google Scholar] [CrossRef]
- Torano, J.; Rodriguez, R.; Diego, I. Computational Fluid Dynamics (CFD) use in the simulation of the death end ventilation in tunnels and galleries. WIT Trans. Eng. Sci. 2006, 52, 113–121. [Google Scholar] [CrossRef]
- Zhoua, L.; Pritchardb, C.; Zhenga, Y. CFD modeling of methane distribution at a continuous miner face with various curtain setback distances. Int. J. Min. Sci. Technol. 2015, 25, 297–306. [Google Scholar] [CrossRef]
- Park, J.; Jo, Y.; Park, G. Flow characteristics of fresh air discharged from a ventilation duct for mine ventilation. J. Mech. Sci. Technol. 2018, 32, 1187–1194. [Google Scholar] [CrossRef]
- Torno, S.; Torano, J. On the prediction of toxic fumes from underground blasting operations and dilution ventilation. Conventional and numerical models. Tunn. Undergr. Space Technol. 2020, 96, 103194. [Google Scholar] [CrossRef]
- Vives, J.; Bascompta, M.; Felipe, J.J.; Sanmiquel, L. Computational Fluid Dynamics (CFD) study to optimize the auxiliary ventilation system in an underground mine. DYNA 2022, 89, 84–91. [Google Scholar] [CrossRef]
- Obracaj, D.; Karzec, M.; Deszcz, P. Study on Methane Distribution in the Face Zone of the Fully Mechanized Roadway with Overlap Auxiliary Ventilation System. Energies 2021, 14, 6379. [Google Scholar] [CrossRef]
- Xin, S.; Wang, W.; Zhang, N.; Zhang, C.; Yuan, S.; Li, H. Comparative studies on control of thermal environment in development headings using force/exhaust overlap ventilation systems. J. Build. Eng. 2021, 38, 102227. [Google Scholar] [CrossRef]
- Jasak, H. Error Analysis and Estimation in the Finite Volume Method with Applications to Fluid Flows. Ph.D. Thesis, Imperial College of Science, Technology and Medicine, Department of Mechanical Engineering, London, UK, 1996. [Google Scholar]
- Weller, H.G.; Tabor, G.; Jasak, H.; Fureby, C. A tensorial approach to computational continuum mechanics using object-oriented techniques. Comput. Phys. 1998, 12, 620–631. [Google Scholar] [CrossRef]
- Ferziger, J.H.; Peric, M.; Street, R.L. Computational Methods for Fluid Dynamics, 3rd ed.; Springer: Berlin/Heidelberg, Germany; New York, NY, USA, 2019. [Google Scholar]
- Murugan, P.C.; Sekhar, S.J. Species—Transport CFD model for the gasification of rice husk (Oryza sativa) using downdraft gasifier. Comput. Electron. Agric. 2017, 139, 33–40. [Google Scholar] [CrossRef]
- Magnussen, B.F.; Hjertager, B.H. On mathematical modeling of turbulent combustion with special emphasis on soot formation and combustion. In Symposium (İnternational) on Combustion; Elsevier: Amsterdam, The Netherlands, 1977; Volume 16, No. 1. [Google Scholar]
- Pritchard, C.J. Validation of the Ventgraph program for use in metal/non-metal mines. In Proceedings of the 13th US Mine Ventilation Symposium, Sudbury, ON, Canada, 13–16 June 2010. [Google Scholar]
- Gillies, A.D.S.; Wu, H.W.; Wala, A.M. Australian Mine Emergency Exercises Aided by Fire Simulation. Arch. Min. Sci. 2005, 50, 17–47. [Google Scholar]
Disclaimer/Publisher’s Note: The statements, opinions and data contained in all publications are solely those of the individual author(s) and contributor(s) and not of MDPI and/or the editor(s). MDPI and/or the editor(s) disclaim responsibility for any injury to people or property resulting from any ideas, methods, instructions or products referred to in the content. |
© 2025 by the authors. Licensee MDPI, Basel, Switzerland. This article is an open access article distributed under the terms and conditions of the Creative Commons Attribution (CC BY) license (https://creativecommons.org/licenses/by/4.0/).