Article

A Multi-Objective Model for Economic and Carbon Emission Optimisation in Sublevel Stoping Operations

1
School of Mechanical and Mining Engineering, The University of Queensland, St Lucia, QLD 4072, Australia
2
Department of Mathematics, University of Chittagong, Chittagong 4331, Bangladesh
*
Author to whom correspondence should be addressed.
Mining 2025, 5(4), 76; https://doi.org/10.3390/mining5040076
Submission received: 30 September 2025 / Revised: 25 October 2025 / Accepted: 4 November 2025 / Published: 10 November 2025

Abstract

The mining industry faces the critical challenge of balancing economic profitability with environmental responsibility. Traditional mine planning models often prioritise financial gains, particularly Net Present Value (NPV), while placing less emphasis on environmental impacts, such as carbon emissions. This research presents a comprehensive multi-objective optimisation model for production scheduling in sublevel stoping operations. The model simultaneously aims to maximise NPV and minimise carbon emissions, providing a more sustainable framework for decision-making. The carbon emission objective comprehensively accounts for energy consumption across all key mining activities, including drilling, blasting, ventilation, transportation, crushing, and backfilling, using a “top-down” accounting method. The multi-objective problem is solved using the Non-dominated Sorting Genetic Algorithm II (NSGA-II), which generates a set of Pareto-optimal solutions representing the trade-off between the two conflicting goals. The model is applied to a conceptual copper deposit with 200 stopes. The results demonstrate a clear trade-off: schedules with higher NPV inevitably lead to higher carbon emissions, and vice versa. For instance, one solution yields a high NPV of $312.94 million but with 23,602 tonnes of CO2 emissions. In contrast, another, more environmentally friendly solution reduces emissions by 26.5% to 18,647 tonnes, resulting in only a 1.21% reduction in NPV. This research concludes that integrating environmental objectives into mine planning is not only feasible but essential for promoting sustainable mining practices, offering a practical tool for operators to make informed, balanced decisions.

1. Introduction

The mining sector is a fundamental pillar of worldwide industrial advancement, supplying vital primary resources for diverse industries [1]. Mining provides the key elements that underpin modern society. Everyday items such as power lines, laptops, washing machines, and even fertilisers all contain metals indispensable to our daily lives. These metals also play a vital role in the global transition toward cleaner energy. Technologies like solar panels, wind turbines, and electric vehicles rely heavily on materials such as aluminium, copper, and lithium. However, this essential contribution to industrial progress comes with growing environmental concerns. Therefore, adopting environmentally responsible practices has become critical in modern mining. The industry must pursue innovative and intelligent strategies that ensure profitability while maintaining environmental and social sustainability.
Energy production and consumption represent significant sources of greenhouse gas emissions globally [2]. According to the International Energy Agency (IEA), energy is expected to account for more than three-quarters of total carbon emissions globally by 2024 [3]. The mining industry, being highly energy-intensive, contributes significantly to these emissions [4]. The mining sector relies on three primary energy sources for its operations: grid electricity, diesel fuel, and natural gas [2,5]. Electricity powers plants and machinery, diesel drives transportation and mobile equipment, and natural gas is converted into electricity through fuel cell technologies. Although explosives used in rock blasting contribute relatively little to total emissions, the extensive reliance on diesel and electricity substantially impacts the sector’s carbon footprint. As a result, reducing energy consumption and emissions has become a central priority for achieving more sustainable mining operations.
Given this strong link between energy use, emissions, and operational efficiency, there is a pressing need to integrate economic and environmental objectives in mine planning. Balancing profitability with sustainability is crucial to addressing the dual challenges of resource depletion and climate change. Traditional mine optimisation models have primarily focused on economic outcomes, often neglecting environmental implications. This has limited their ability to support long-term sustainable practices. Over the past several decades, researchers have developed strategic mine production scheduling models for sublevel stoping, one of the most widely used underground mining methods. However, most of these models have historically prioritised a single objective: the maximisation of profit or Net Present Value (NPV) [6].
Trout [7] pioneered the application of integer programming to enhance the efficiency of scheduling production in an underground mine in 1995. Trout utilised Mixed-Integer Programming (MIP) to optimise the manufacturing schedule by maximising the NPV. The study focused on a copper ore operation utilising sublevel stoping techniques at Mt. Isa, Australia. The model was not implemented at mine due to the need for additional improvements, but the study highlighted the advantages of using MIP techniques over manual methods for scheduling stops [8]. In 2001, Carlyle and Eaves [9] developed a comprehensive MIP model that incorporated factors such as the intended mine layout, anticipated ore grade, and projected expenses for fundamental mining operations. Their methodology was designed to optimise the discounted revenue from ore by applying it to a specific part of the platinum and palladium mine in Stillwater, Montana.
Little [10] utilised an improved model, reducing the number of variables according to the approach. This method entails integrating the stages of development, drilling, and backfilling sequentially and naturally, resulting in a reduction in binary choice variables by a factor of five. In a limited-scale conceptual investigation, Little et al. [8] employed this novel mixed-integer programming paradigm, resulting in an 80% decrease in binary variables and a 92% enhancement in overall solution time while maintaining the same production schedule. The long-term planning problem was suggested to be easier to solve by Terblanche and Bley [11], who developed a unified model and a more straightforward method for displaying resources. They also showed a changed version that can be optimised while still taking into account the choice of blocks in the mine. Then Copland and Nehring [12] improved the previous method of combining stope boundary optimisation and production scheduling to make it work more effectively and efficiently in mining settings. They employed two methods to reduce solution time and increase overall productivity. A mathematical programming framework for mixed-integer linear programming (MILP) is presented by Appianing et al. [13] to address production scheduling and integrated open-stope development problems. According to the study, 2.48 million metric tonnes (Mt) of material were recovered and processed out of a total of 2.88 Mt of mineralised material. This resulted in an NPV of $244.7 million for a gold project over its estimated 25-year mine life.
Multi-objective optimisation in sublevel stoping operations has been conducted by a limited number of researchers. Wang et al. [14] introduced a multi-objective optimisation model for the Huogeqi Copper Mine in China. The purpose was to enhance mineral resource utilisation and promote sustainable development. The study aimed to optimise economic profit and resource efficiency by employing a rapid, non-dominated sorting genetic algorithm (NSGA-II). The findings presented a collection of Pareto-optimal alternatives for decision-makers, demonstrating possible enhancements of 2.99% in profit and 2.64% in resource utilisation when compared to the existing production metrics. The study also examined the influence of copper concentrating pricing on Pareto-optimal solutions, demonstrating that higher profits are more responsive to price fluctuations, resulting in reduced rates of resource utilisation.
Foroughi et al. [15] established a multi-objective integer programming (MOIP) model to optimise the mine plan and production scheduling for sublevel stoping mining. The objective of the study was to optimise both the NPV and metal recovery, which were identified as separate aims. To identify solutions, the authors employed a multi-objective genetic algorithm known as NSGA-II. The study revealed that the utilisation of NSGA-II resulted in a more convergent Pareto front and substantially decreased the solution time from 7 to 8 days to 6–7 h in comparison to the weighted sum technique. Although the NPV experienced a slight decrease of 0.41%, there was a significant 18.55% rise in metal recovery.
Sari and Kumral [16] presented a unique mixed-integer linear programme that uses chance-constrained programming to address uncertainty in NPV. The goal of maximising NPV became a multi-objective issue, with the objectives of maximising the mean NPV and minimising the negative standard deviation multiplied by a scalar (reliability level). This scalar, chosen based on project reliability, helped maintain a balance between the objectives. A case study revealed that when dependability levels improved, the expected NPV climbed while the total objective function decreased. Furthermore, at lower levels of dependability, stope grade order resembled extraction order.
There is a notable scarcity of published research that addresses both environmental and economic impacts concurrently. In recent years, the versatility of multi-objective optimisation techniques has gained prominence, proving particularly adept at addressing a diverse array of real-world challenges [6].
This research addresses this challenge by introducing a novel approach—a multi-objective optimisation model to enhance the production scheduling process in sublevel stoping operations while incorporating key environmental and NPV considerations.
Sublevel stoping, a widely employed underground mining method, involves the extraction of mineral resources through a series of horizontal slices or sublevels. Efficient production scheduling in such operations is vital for optimising economic returns, ensuring environmental sustainability, and fostering community well-being. This study focuses on two interrelated and critical objectives: maximising NPV and minimising carbon emissions.
The pursuit of maximising NPV aims to enhance the economic efficiency of mining operations through the strategic scheduling of production activities, ultimately seeking to maximise the overall financial return. The inclusion of NPV as a central objective ensures the development of a financially viable and sustainable mining strategy. Serving as the cornerstone of economic goals, this objective underscores the importance of devising a production schedule that judiciously allocates resources to optimise financial returns throughout the mine’s operational lifespan.
However, recognising that economic gains must coexist harmoniously with environmental stewardship, this model incorporates a second objective—the minimisation of carbon emissions. This objective acknowledges the imperative to mitigate the environmental impact of mining activities. The model takes into account various factors, including energy consumption, transportation, and process emissions, to develop production schedules that align with environmental sustainability goals. This imperative aligns with global efforts to curtail the environmental impact of mining activities, acknowledging the industry’s responsibility in combating climate change. Thus, this research aims to strike a delicate balance between economic efficiency and environmental responsibility within the unique context of sublevel stoping mining operations.
The work is organised as follows: Section 2 clarifies the issue and the optimising model. Section 3 displays the approach of the solution. Section 4 offers computer-based experiments. Section 5 is devoted to examining the acquired solutions by the algorithm. Section 6 presents the conclusions and future development directions.

2. Problem Description and the Optimisation Model/Model Formulation

In this study, a multi-objective optimisation model was introduced for sublevel stoping, considering both economic and environmental factors. The research evaluates the trade-off between economic and environmental aspects, with total costs representing the economic aspect and carbon emissions from energy consumption representing the environmental aspect. The NSGA-II is employed to assess this trade-off, and the details of the optimisation model are explained in the following section.

2.1. INDICES

S: set of stopes in the model
T: set of time periods

2.2. PARAMETERS

a: scaling coefficient
α : proportion of preparatory work in the whole sublevel stoping mine
α d i e s e l : diesel combustion conversion efficiency
b: decay coefficient
B1: average number of boreholes drilled by the drilling rigs
C d i e s e l : the carbon emission factor of diesel, tCO2/J
C e l e c t r i c i t y : the carbon emission factor of electric energy, tCO2/kWh
C e x p l o s i v e : the carbon emission factor for industrial explosives used in mines, tCO2/t
C V D A : amount of greenhouse gases released during the pressurisation, drainage, and ventilation procedures used to treat a unit cube of rock mass tCO2/t
C : corresponding carbon emission factor of the energy type consumed by the e type of equipment
e : energy consumption per ton by the e type of equipment
E: number of equipment types used
g s : ore grade of stope s
H: number of LHDs (load, haul, dump)
i: discount rate
K: number of rock types
k s : full bucket coefficient of the LHD
L k 1 : unit consumption of explosives for the same type of rock mass for preparation blasting kg/m3
L k 2 : unit consumption of explosives for the same type of rock mass for ore blasting kg/m3
λ : power ratio coefficient of an engine under no-load and heavy load
m t : mining cost at time period t
μ 1 : drilling efficiency of drilling rigs, m/h
n t : processing cost at time period t
n r ,   n u : number of mixers and pumps for each type
n v ,   n d ,   n a : quantity of a particular kind of ventilator, drainage pump, and compressor units in operation
o s : ore tonnage of stope s
p t : metal price at time period t
P1: rated power of the drilling rigs, kW
P c : working power of a specific type of crusher, kW
P v ,   P d ,   P a : corresponding operating power of a particular kind of fan, drain pump, and compressor, kW
P h : rate power of LHDs, w
P r ,   P u : rated power of each type of mixer, and pump, kW
Q d a y : total daily ore and waste rock production in the sublevel stoping mine, t/day
Q d a y 1 : daily average rock mass extracted in a sublevel stoping mine using compressed air equipment, t/day
Q d a y 3 : daily average amount of ore crushed, t/day
R, U: types of mixers and pumps used in the process of mixing and pumping backfilling
r t : ore recovery at time period t
ρ : Average density of ore
t c : average daily working time of a particular type of crusher, h
t v ,   t d ,   t a : average daily operating hours of a certain ventilator, drainage pump, and compressor, h
t h : average round-trip time of the LHDs, s
t r ,     t u : average working time of mixer, and pump to complete a workflow, h
V h : bucket capacity for a particular kind of diesel LHD used in the mine, t
V r ,   V u : treatment volume of the mixer, and pump in their respective single workflow time, t
v, d, a: quantity of ventilator, drainage pump, and compressor varieties

2.3. VARIABLES

e s , t =   1   if   extraction   from   stope   s   is   schedule   in   time   period   t 0   otherwise

2.4. Objective Functions

Two different objective functions are taken into consideration by the model. The first one is concerned with the economic aspect of sustainability, and the second is concerned with the environmental aspect.

2.5. Economic Objective

Equation (1) [16] expresses the objective function as the discounted revenue, which takes into account the ore grade, ore recovery, and tonnage of the stope.
N P V = s = 1 S t = 1 T g s · r t · p t m t n t · o s 1 + i t e s , t
where S is the set of stopes in the model, T is the set of time periods, g s is the ore grade of stope s, r t is the ore recovery at time period t, p t is the metal price at time period t, m t is the mining cost at time period t, n t is the processing cost at time period t, o s  is the ore tonnage of stope s, i is the discount rate, and e s , t is a binary decision variable, which represents whether a specific mining area (called a “stope”) is scheduled for extraction in a given time period. If extraction from stope s is scheduled in time period t, then e s , t = 1, otherwise e s , t = 0.
Carbon Emission Objective: The Intergovernmental Panel on Climate Change (IPCC) recommends the carbon emission coefficient method for carbon emission accounting, which has two calculating approaches: “top-down” and “bottom-up.” The “top-down” method sorts energy use within a given range and calculates carbon emissions by multiplying carbon emission coefficients after measuring consumption. The “bottom-up” method, on the other hand, directly measures the carbon emissions of each piece of equipment on-site. Due to challenges such as complicated settings and changing scenarios, the “top-down” method was adopted in this study to assess carbon emissions in the sublevel stoping mining stage of metal mines [17]. Equation (2) [18,19] expresses the objective function of reducing the overall amount of carbon emissions that are produced by activities such as drilling, blasting, air compression, drainage, ventilation, transportation, processing, and backfilling. The precise details of these activities are as follows:
C a r b o n   e m i s s i o n = s = 1 S t = 1 T a · g s b + e = 1 E e · C · o s · e s , t
where S is the set of stopes in the model, T is the set of time periods, a is a scaling coefficient, b is a decay coefficient, g s is the ore grade of stope s, E is the number of equipment types used, e is the energy consumption per tonne by the e type of equipment, C is the corresponding carbon emission factor of the energy type consumed by the e type of equipment, o s is the ore tonnage of stope s, and e s , t is a binary decision variable, which represents whether a specific mining area (called a “stope”) is scheduled for extraction in a given time period. If extraction from stope s is scheduled in time period t, then e s , t =1, otherwise e s , t = 0.
The first part of Equation (2) is the carbon emission from the processing plant, and the second part is the carbon emission from drilling, blasting, air compression, drainage, ventilation, transportation, crushing, grinding, and backfilling. The rules governing carbon emissions in mining operations led us to select electricity and diesel as the two primary forms of energy for carbon emissions in this study. During the mining stage, these energy forms are the primary sources of carbon emissions. The amount of explosives used during blasting should also be measured, as it is needed for completing sublevel stoping operations.

2.6. Modelling Carbon Emissions During Rock Drilling

Carbon emissions from drilling primarily come from the energy used by the equipment. In underground mining, drill rigs (jumbos) perform two main tasks: tunnelling and drilling blasting holes. The total energy consumption is determined by the power of these rigs and the duration of their operation. While a rig’s power rating is fixed, the drilling time varies based on rock hardness, the number of holes needed, and their depth. The following formula is used to determine the drilling operations’ carbon emissions per tonne of rock mass [19]:
C d r i l l i n g = k = 1 K P 1 B 1 μ 1 C e l e c t r i c i t y
where C d r i l l i n g is the total carbon emission during rock drilling measured in tCO2/kWh, K is the number of rock types, P1 is the rated power of the drilling rigs measured in kW, B1 is the average number of boreholes drilled by the drilling rigs, μ 1 is the drilling efficiency of drilling rigs measured in m/h, and C e l e c t r i c i t y is the carbon emission factor of electricity measured in tCO2/kWh.

2.7. Modelling Carbon Emissions During the Blasting Process

Carbon emissions from blasting primarily originate from industrial explosives, calculated by multiplying the unit explosive consumption by the volume or tonnage of blasted rock. In sublevel stoping metal mines, blasting includes excavation, preparation, and stoping. Excavation and preparation blasting, being more challenging with only one free surface, typically uses more explosives per unit compared to stoping blasting. The average unit consumption of explosives for different rock types used in mine blasting is determined using the general rock coefficient. The calculation model for carbon emissions per cubic metre of rock mass in various blasting procedures is as follows [19]:
C b l a s t i n g = k = 1 K L k 1 · α + L k 2 · 1 α · C e x p l o s i v e 1000
where C b l a s t i n g is the total carbon emission during the rock blasting process measured in tCO2/kWh, K is the number of rock types, L k 1 is the unit consumption of explosives for the same type of rock mass for preparation blasting measured in kg/m3, L k 2 is the unit consumption of explosives for the same type of rock mass for ore blasting measured in kg/m3, α is the proportion of preparatory work in the whole sublevel stoping mine, and C e x p l o s i v e is the carbon emission factor for industrial explosives used in mines, measured in tCO2/t.

2.8. Modelling Carbon Emissions During Ventilation, Drainage, and Air Compression Processes

The carbon emissions produced by underground mine ventilation, drainage, and compressed air systems are caused by power usage, and as the mining area expands, so do the equipment needs. Mine safety depends on the primary fan, drainage pump, and compressor running constantly throughout production. Converting carbon emissions into units of cubic ore takes into account the ratio of daily power usage to the total daily ore and waste rock production, since these systems are essential for safe production and are not highly correlated with ore quantity. The carbon emissions from air compression during the mining of a unit of cubic rock mass are calculated by dividing the daily power consumption by the average daily rock mass mined [19].
C V D A = v = 1 V P v · n v · t v + d = 1 D P d · n d · t d · C e l e c t r i c i t y Q d a y · 1000 + a = 1 A P a · n a · t a · C e l e c t r i c i t y Q d a y 1 · 1000
where C V D A is the amount of carbon emission during the ventilation, drainage, and air compression process measured in tCO2/t; v, d, a are the quantities of ventilator, drainage pump, and compressor varieties; P v ,   P d ,   P a are the corresponding operating powers of a particular kind of fan, drain pump, and compressor measured in kW; n v ,   n d ,   n a are the quantity of a particular kind of ventilator, drainage pump, and compressor units in operation; t v ,   t d ,   t a are the average daily operating hours of a certain ventilator, drainage pump, and compressor measured in hours; Q d a y is the total daily ore and waste rock production in the sublevel stoping mine measured in t/day; and Q d a y 1 is the daily average rock mass extracted in a sublevel stoping mine using compressed air equipment, measured in t/day.

2.9. Modelling Carbon Emissions During the Transportation Process

Loading and hauling are critical components in mining operations. Miners employ underground loaders/trucks and/or LHD carriers to carry run-of-mine ore to processing areas while also removing overburden and waste materials from the mine site. The carbon emissions produced during the stope’s transit are exceedingly complex, owing to the dynamic nature of the stope’s position and scope, as well as the fluctuating distances travelled by the transportation equipment.
Moreover, the power consumption of mining equipment varies depending on the transit conditions, including heavy load, no-load, downhill, uphill, and vehicle performance. Computing the average round-trip time for mining and loading without regard to stope slope, vehicle performance, or equipment effect uses the transport distance parameter. The engine’s power ratio coefficient, λ, is defined when the mining truck is empty and heavy, with a value of 0.91 [20]. Conventional LHDs run on fuel; hence, diesel is necessary for operation. Moving a unit rock mass with an LHD has a carbon emission model as follows [19]:
C t r a n s p o r t a t i o n = h = 1 H P h 1 + λ · t h · C d i e s e l 2 · α d i e s e l · V h · k s
where C t r a n s p o r t a t i o n is the total carbon emission during the transportation process measured in tCO2/kWh, H is the number of LHDs (load, haul, dump), P h is the rate power of LHDs in w, λ is the power ratio coefficient of an engine under no-load and heavy load, t h is the average round-trip time of the LHDs in seconds, C d i e s e l is the carbon emission factor of diesel measured in tCO2/J, α d i e s e l is the diesel combustion conversion efficiency, V h is the bucket capacity for a certain kind of diesel LHD used in the mine, measured in tonnes, and k s is the full bucket coefficient of the LHD.

2.10. Modelling Carbon Emissions During Crushing and Grinding Process

Crushing is a crucial process in mining, as it extracts valuable minerals from ore. Crushing is primarily used to reduce the size of ore in preparation for further processing and extraction of essential minerals. In underground mining, primary crushing is often performed with jaw crushers, gyratory crushers, or impact crushers. After crushing, the ore is ground to the proper particle size for mineral liberation and separation. Underground mining and crushing activities frequently use heavy machinery and equipment, which are powered by electricity or other energy sources. The combustion of fossil fuels produces carbon emissions to generate electricity or operate diesel-powered machines. The source of electricity (coal, natural gas, renewables) has a considerable impact on the carbon footprint. The formula for calculating carbon emissions per tonne of ore processed is as follows:
C c r u s h i n g   &   g r i n d i n g = k = 1 K P c · t c · ρ Q d a y 3 · 1000 C e l e c t r i c i t y
where C c r u s h i n g   &   g r i n d i n g is the total carbon emission during the crushing and grinding process measured in tCO2/kWh, P c is the working power of certain types of crushers and grinders measured in kW, t c is the average daily working time of a certain type of crusher measured in hours, ρ is the average density of ore, Q d a y 3 is the daily average amount of ore crushed measured in t/day, and C e l e c t r i c i t y is the carbon emission factor of electricity measured in tCO2/kWh.

2.11. Modelling Carbon Emissions During Backfilling Process

The backfilling process is a strategic phase used in sublevel stoping mining operations to improve safety, provide ground support, and maximise resource utilisation. Sublevel stoping is a typical underground mining technique in which ore is taken in horizontal slices, or sublevels, from a vertical ore body. In this method, backfilling involves using suitable materials to fill the voids left after ore extraction. Backfilling in sublevel stoping is performed using a variety of materials, including cemented fill, hydraulic fill, or a combination of waste rock and other additives. The carbon emissions during the backfilling stage are caused by a large quantity of power used in the production and transportation of the backfilling material. The carbon emissions per tonne for the backfilling process can be calculated using the following formula [19]:
C f i l l i n g = r = 1 R P r · t r · n r · C e l e c t r i c i t y V r + u = 1 U P u · t u · n u · C e l e c t r i c i t y V u
where C f i l l i n g is the total carbon emission during the backfilling process, measured in tCO2/kWh. R and U represent the types of mixers and pumps used in the mixing and pumping process for backfilling. P r   and   P u are the rated power of each type of mixer, and the pump measured in kW, t r   and   t u are the average working time of mixers and pumps to complete a workflow measured in hours, n r   and   n r are the numbers of mixers and pumps for each type, V r   and   V u are the treatment volumes of the mixer and the pump in their respective single workflow time measured in tonnes.

2.12. Constraints

There are some geotechnical and sequential constraints in sublevel stoping mining operations [17].
t = 1 T e s , t + t = 1 T e s , t 1 s | s o f f s
t = 1 T e s , t + t = 1 T e s , t 1 s | s c b s
t = 1 T e s , t + t = 1 T e s , t 1 s | s e x t s
e s , t + e s , t 1 s , t | s a d j s
t t p t e s , t + s a d j s e s , t 2 s , t
s = 1 S o s · e s , t O H u
s = 1 S o s · e s , t O H l
s = 1 S d f v e s , t B F
s = 1 S o s · g s · m r t · e s , t U t t
s = 1 S o s · g s · m r t · e s , t L t t
The formation of offset stopes that are exactly above one another and of the same size is prohibited by constraint (9). By doing this, possible material failure is avoided by avoiding the creation of vertical planes between backfilled stopes. Only one stope among those sharing a minimum of one block may be produced at a time, according to the constraint (10). It prevents overlapping stopes by guaranteeing that a single stope cannot be in more than one phase at a time. By prohibiting the selection of adjacent stopes without shared common drawpoint levels, constraint (11) creates practical drawpoint levels. Constraint (12) ensures that the total of the extraction variables never exceeds one at any point in time, preventing the simultaneous creation of adjacent stopes and ensuring that overly large voids do not compromise geotechnical stability. Effectively regulating strains, constraint (13) restricts production to a single adjacent stope following backfilling. The amount of material removed and constraints control the delivery of backfill (14)–(16), which are imposed by the handling system capacity of the mining operation and a predefined value. By keeping the amount of contained metal between the upper and lower bounds, Constraints (17) and (18) lessen grade changes in the plant’s feed for each period.

3. Solution Method: Multi-Objective Optimisation

Multi-objective optimisation (MOO) is a technique used to identify optimal solutions in situations where multiple objectives or criteria are in conflict and need to be simultaneously satisfied. Unlike typical optimisation issues, which focus on a single target, MOO aims to optimise many objectives simultaneously. The fundamental concept underlying multi-objective optimisation is to determine solutions that provide a favourable balance between many objectives. These solutions are referred to as Pareto-optimal or non-dominated solutions. A solution is considered Pareto-optimal if there is no way to improve one of the objectives without degrading at least one of the other objectives associated with the solution [21].
In general, there are two main approaches to tackling multiple objective optimisation problems: classical methods and non-traditional methods [22]. Classical approaches involve converting all objective functions into either a single-objective optimisation problem or a group of single-objective optimisation problems, utilising specific parameters. Nevertheless, these algorithms encounter challenges when attempting to solve issues that require either unavailable or excessive computation of gradient information. Non-traditional approaches refer to population-based metaheuristic optimisation algorithms that are well recognised for their effectiveness. These algorithms utilise biology-inspired phenomena, such as mutation, crossover, natural selection, and the survival of the fittest, to repeatedly improve a set of potential solutions. The process involves searching through a population of potential solutions that are randomly produced without requiring gradient knowledge. Several other approaches are available to handle MOO problems. The NSGA-II is utilised to address the MOO problem.
The NSGA-II algorithm was selected because it is a well-established and efficient method for solving multi-objective optimisation problems. Its main advantages include fast non-dominated sorting, an elitist mechanism that preserves high-quality solutions, and a crowding-distance operator that maintains diversity along the Pareto front. Moreover, it does not require prior weighting of objectives, making it suitable for problems with conflicting goals, such as maximising NPV and minimising carbon emissions. However, NSGA-II also has certain limitations, including relatively high computational requirements for large-scale problems and slight variations in results due to its stochastic nature. Despite these challenges, its robustness, flexibility, and ability to produce a well-distributed set of optimal solutions make it highly suitable for this study.
The NSGA-II begins by randomly generating an initial population within the defined problem range. Each individual in this population is evaluated using the objective functions to determine its fitness. The solutions are then ranked by non-dominated sorting, with the best (non-dominated) solutions receiving the highest ranks.
Parent solutions are selected based on their rank and fitness, followed by crossover and mutation to generate new offspring and maintain diversity. The offspring are evaluated, and both parent and offspring populations are combined. A new ranking and crowding distance are computed to assess the quality and diversity of solutions.
A new parent population is selected using a binary tournament and crowded comparison method. The process repeats until a termination condition—such as no further improvement, reaching a maximum number of generations, or achieving a target objective value—is met. Finally, the best set of solutions (the Pareto-optimal front) is produced as the output.
This algorithm is well-regarded and widely used for MOO. The algorithm uses the non-dominated sorting principle and crowding distance to identify the optimal solution for two objective functions concurrently [23].

4. Case Study

The case study was developed using realistic parameters and constraints derived from underground sublevel stoping operations, thereby closely approximating actual mining conditions. Due to confidentiality restrictions, real mine data could not be directly incorporated; however, the model structure and input values were selected to mirror practical operational settings, thereby ensuring relevance to real-world scenarios. To investigate the proposed approach, the model was applied to a copper deposit comprising 200 stopes, each measuring 2700 cubic metres (30 m × 30 m × 30 m). Table 1 contains a listing of the economic, operational, and mining-related parameters.
Table 2 displays the technical parameters of several rock masses with distinct lithologies. These parameters include the drilling length and the number of drill holes, which were determined for each unit cube of rock mass in the sublevel stoping gold-copper mine. Table 3 illustrates the technical features of the tunnelling and drilling rigs.
The primary explosive utilised in the mining production process is predominantly Ammonium Nitrate/Fuel Oil (ANFO), with a carbon emission factor of 0.189 t CO2/t. Table 4 displays the average consumption of explosive units for different types of rocks in various blasting operations within the mine.
During the mine’s production process, about 3500 tonnes of ore and 350 tonnes of waste rock were produced daily. Ore and rock have an average density of 3200 kg/m3. Compressed air equipment powered 75% of the mine’s operations. To conserve energy, a frequency converter fan was used for 24 h, resulting in a 40% reduction in energy consumption. The mine employed two operational tables sharing the same drainage pump, while others were on standby during the average 3 h workday. The air compressor operated continuously from 8:00 to 16:00; from 16:00 to 8:00, it operated in three cycles. The compressor stopped when reaching the required air pressure and resumed operation when the pressure dropped below that level. Table 5 and Table 6 present data on the mine fan and drainage pump, while Table 7 displays information on the surface air compressor.
It is presumed that a single type of LHD is utilised throughout the entire procedure of carrying the identical rock pile. The LHD has an average round-trip time of 200 s, while its diesel engine has an efficiency of 45%. Table 8 displays the data of LHDs utilised in mining operations.
In sublevel stopping mines, backfilling is an essential component of the process. Backfilling involves the employment of high-pressure piston pumps and mixer equipment. Table 9 displays the exact specifications of the machinery used in the backfilling procedure.
Energy-intensive operations, including crushing, grinding, and refining processes, are the source of carbon emissions from ore processing plants in the mining sector. The precise specifications of the equipment utilised in the crushing and grinding process are shown in Table 10.
The Australian Government Clean Energy Regulator (CER) states that the carbon emissions factor for electric energy is 0.73 t CO2-e/MWh, whereas the chosen carbon emission factor for diesel is 202 t CO2-e/TJ in Queensland, Australia [24].

5. Results and Discussions

The multi-objective production scheduling problem of maximising NPV and minimising carbon emissions in sublevel stoping operations was solved using NSGA-II. The parameters of the NSGA-II are listed in Table 11, and the range of objective function values is provided in Table 12. Figure 1 presents the Pareto front obtained by NSGA-II. The outcome of MOO problems produces a set of solutions that are non-dominated and considered Pareto-optimal. In the absence of a decision-maker’s preference, no solution within this set can be regarded as superior to another. However, it remains essential for the decision-maker to select a single solution for final implementation. In practice, the decision-maker ultimately has to select one solution from this set for system implementation. All the solutions converge to the Pareto front.
Table 12 illustrates a trade-off between NPV and carbon emissions. When the NPV is maximised at $312,940,000, the carbon emissions also become very high, reaching 23,602 tonnes. This means that if the goal is to maximise NPV, then one must accept higher carbon emissions. On the other hand, if the aim is to keep carbon emissions low, then NPV decreases. In this case, the lowest carbon emissions occur when the NPV drops to $218,177,000, which is the smallest NPV on the Pareto front. In short, the table indicates that higher NPVs are associated with higher emissions, while lower emissions are associated with lower NPVs. A decision-maker must therefore choose where to strike a balance on this spectrum.
The solution to the MOPs is a collection of efficient solutions that also match the Pareto optimality criteria. A decision-maker is responsible for selecting a solution from several possibilities. In this experiment, it is hard to determine which of the two solutions is superior to the other. Following their preferences, the decision-maker is the only one who can choose the optimal solution.
Based on the study of all 100 options, as shown in Figure 1, Solution A has the greatest NPV but the worst carbon emissions, whereas Solution B has the best carbon emissions but the poorest NPV. When examining the two options, A and C, a distinct trade-off between economic and environmental performance is evident. Solution A has a larger NPV of $312,940,000, showing that it is a more lucrative option. Nevertheless, this advantage is accompanied by a substantial increase in carbon emissions, totalling 23,602 tonnes. On the other hand, Solution C has an NPV of $309,183,000, making it less profitable. However, it is much more ecologically friendly, since it only emits 18,647 tonnes of carbon. The economic benefit of Solution A, while appealing in terms of finances, must be carefully considered in light of its significantly harmful environmental consequences. While Solution C has a lower NPV, it is a more sustainable option due to its ability to reduce carbon emissions by 4954 tonnes. This decrease aligns with the growing global focus on sustainability and the need to mitigate the effects of climate change. Choosing to prioritise environmental sustainability over maximising economic profits demonstrates a commitment to the accountable management of resources and the preservation of long-term ecological well-being. Therefore, choosing Solution C emphasises a strategic choice to prioritise environmental advantages, showcasing a comprehensive strategy that values the welfare of the world in addition to economic factors.

Stope Sequencing

Stope sequencing is a critical aspect of sublevel stoping operations, where the order of extracting ore bodies significantly influences both economic and environmental outcomes. When considering the dual objectives of maximising NPV and minimising carbon emissions, the sequencing process becomes a complex optimisation challenge. By strategically planning the sequence in which stopes are mined, it is possible to enhance the overall economic return while simultaneously reducing the environmental footprint. For instance, prioritising stopes that offer higher ore grades and lower extraction costs can boost NPV. Concurrently, sequencing decisions that minimise haulage distances and optimise equipment usage can lead to significant reductions in carbon emissions. Balancing these objectives requires advanced modelling techniques that can evaluate various scenarios and identify the optimal sequence that aligns with both financial and environmental goals. Thus, effective stope sequencing not only drives profitability but also promotes sustainable mining practices, ensuring that resource extraction is conducted in an economically viable and environmentally responsible manner.
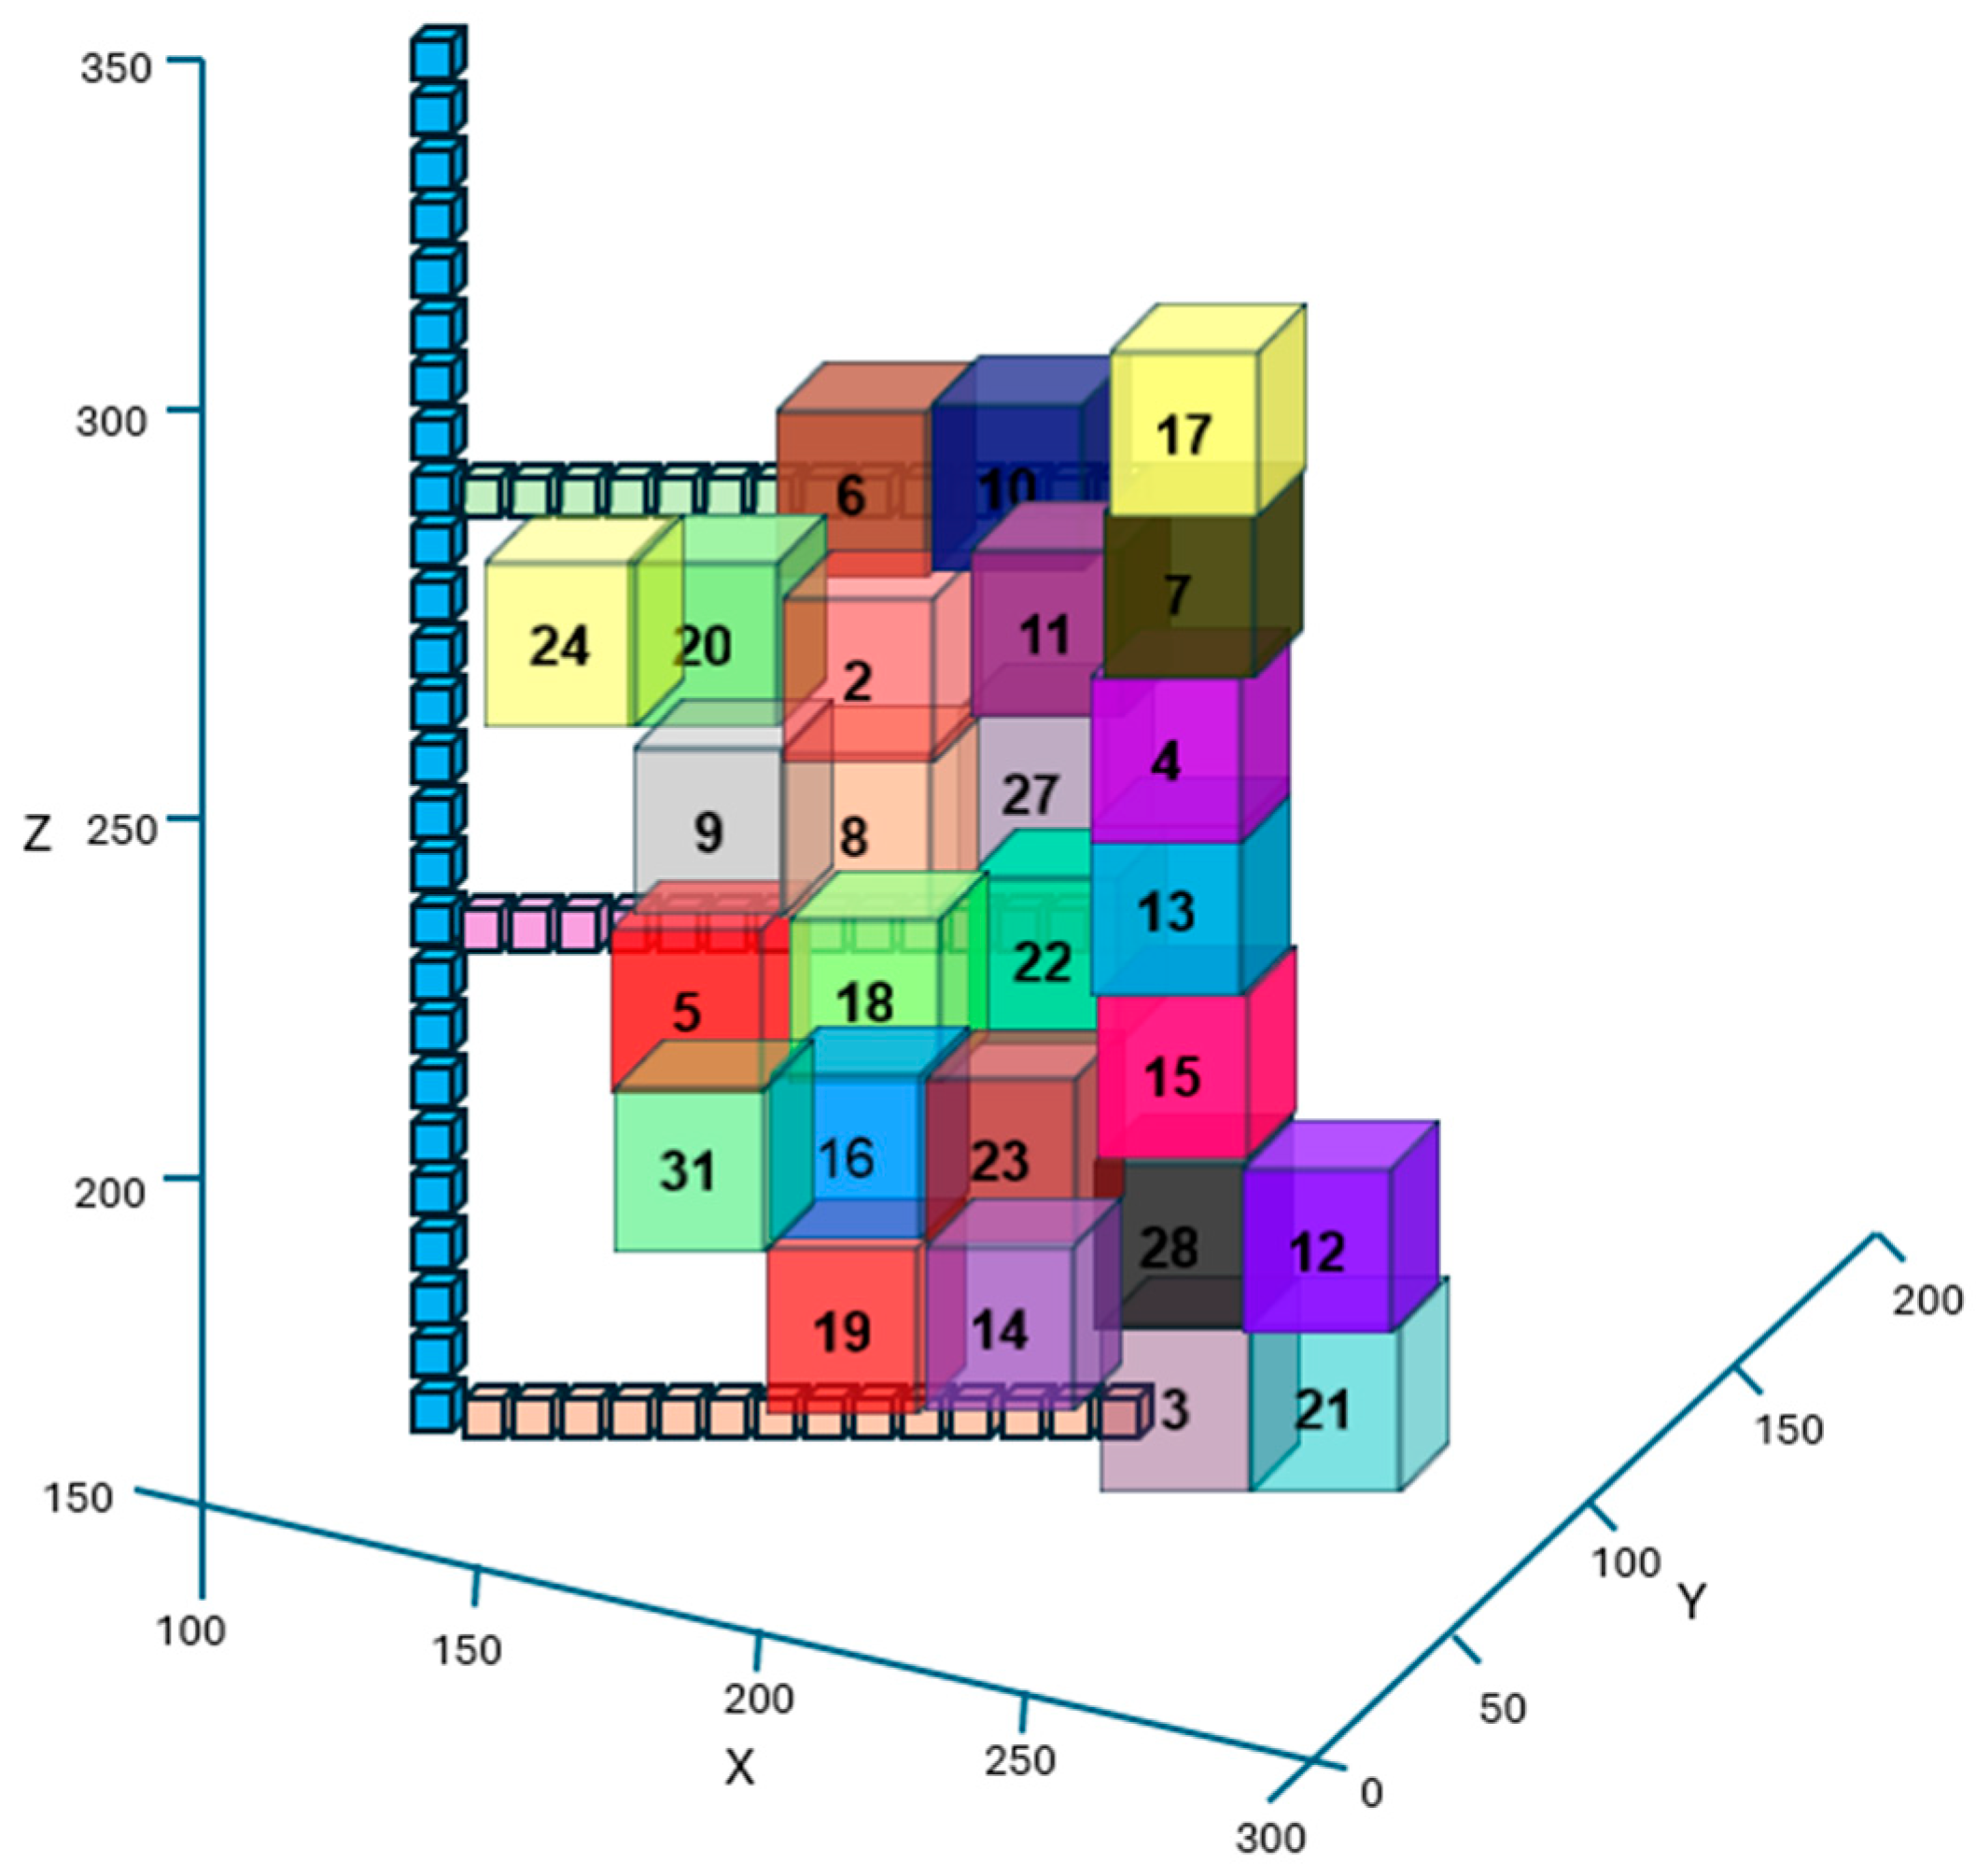
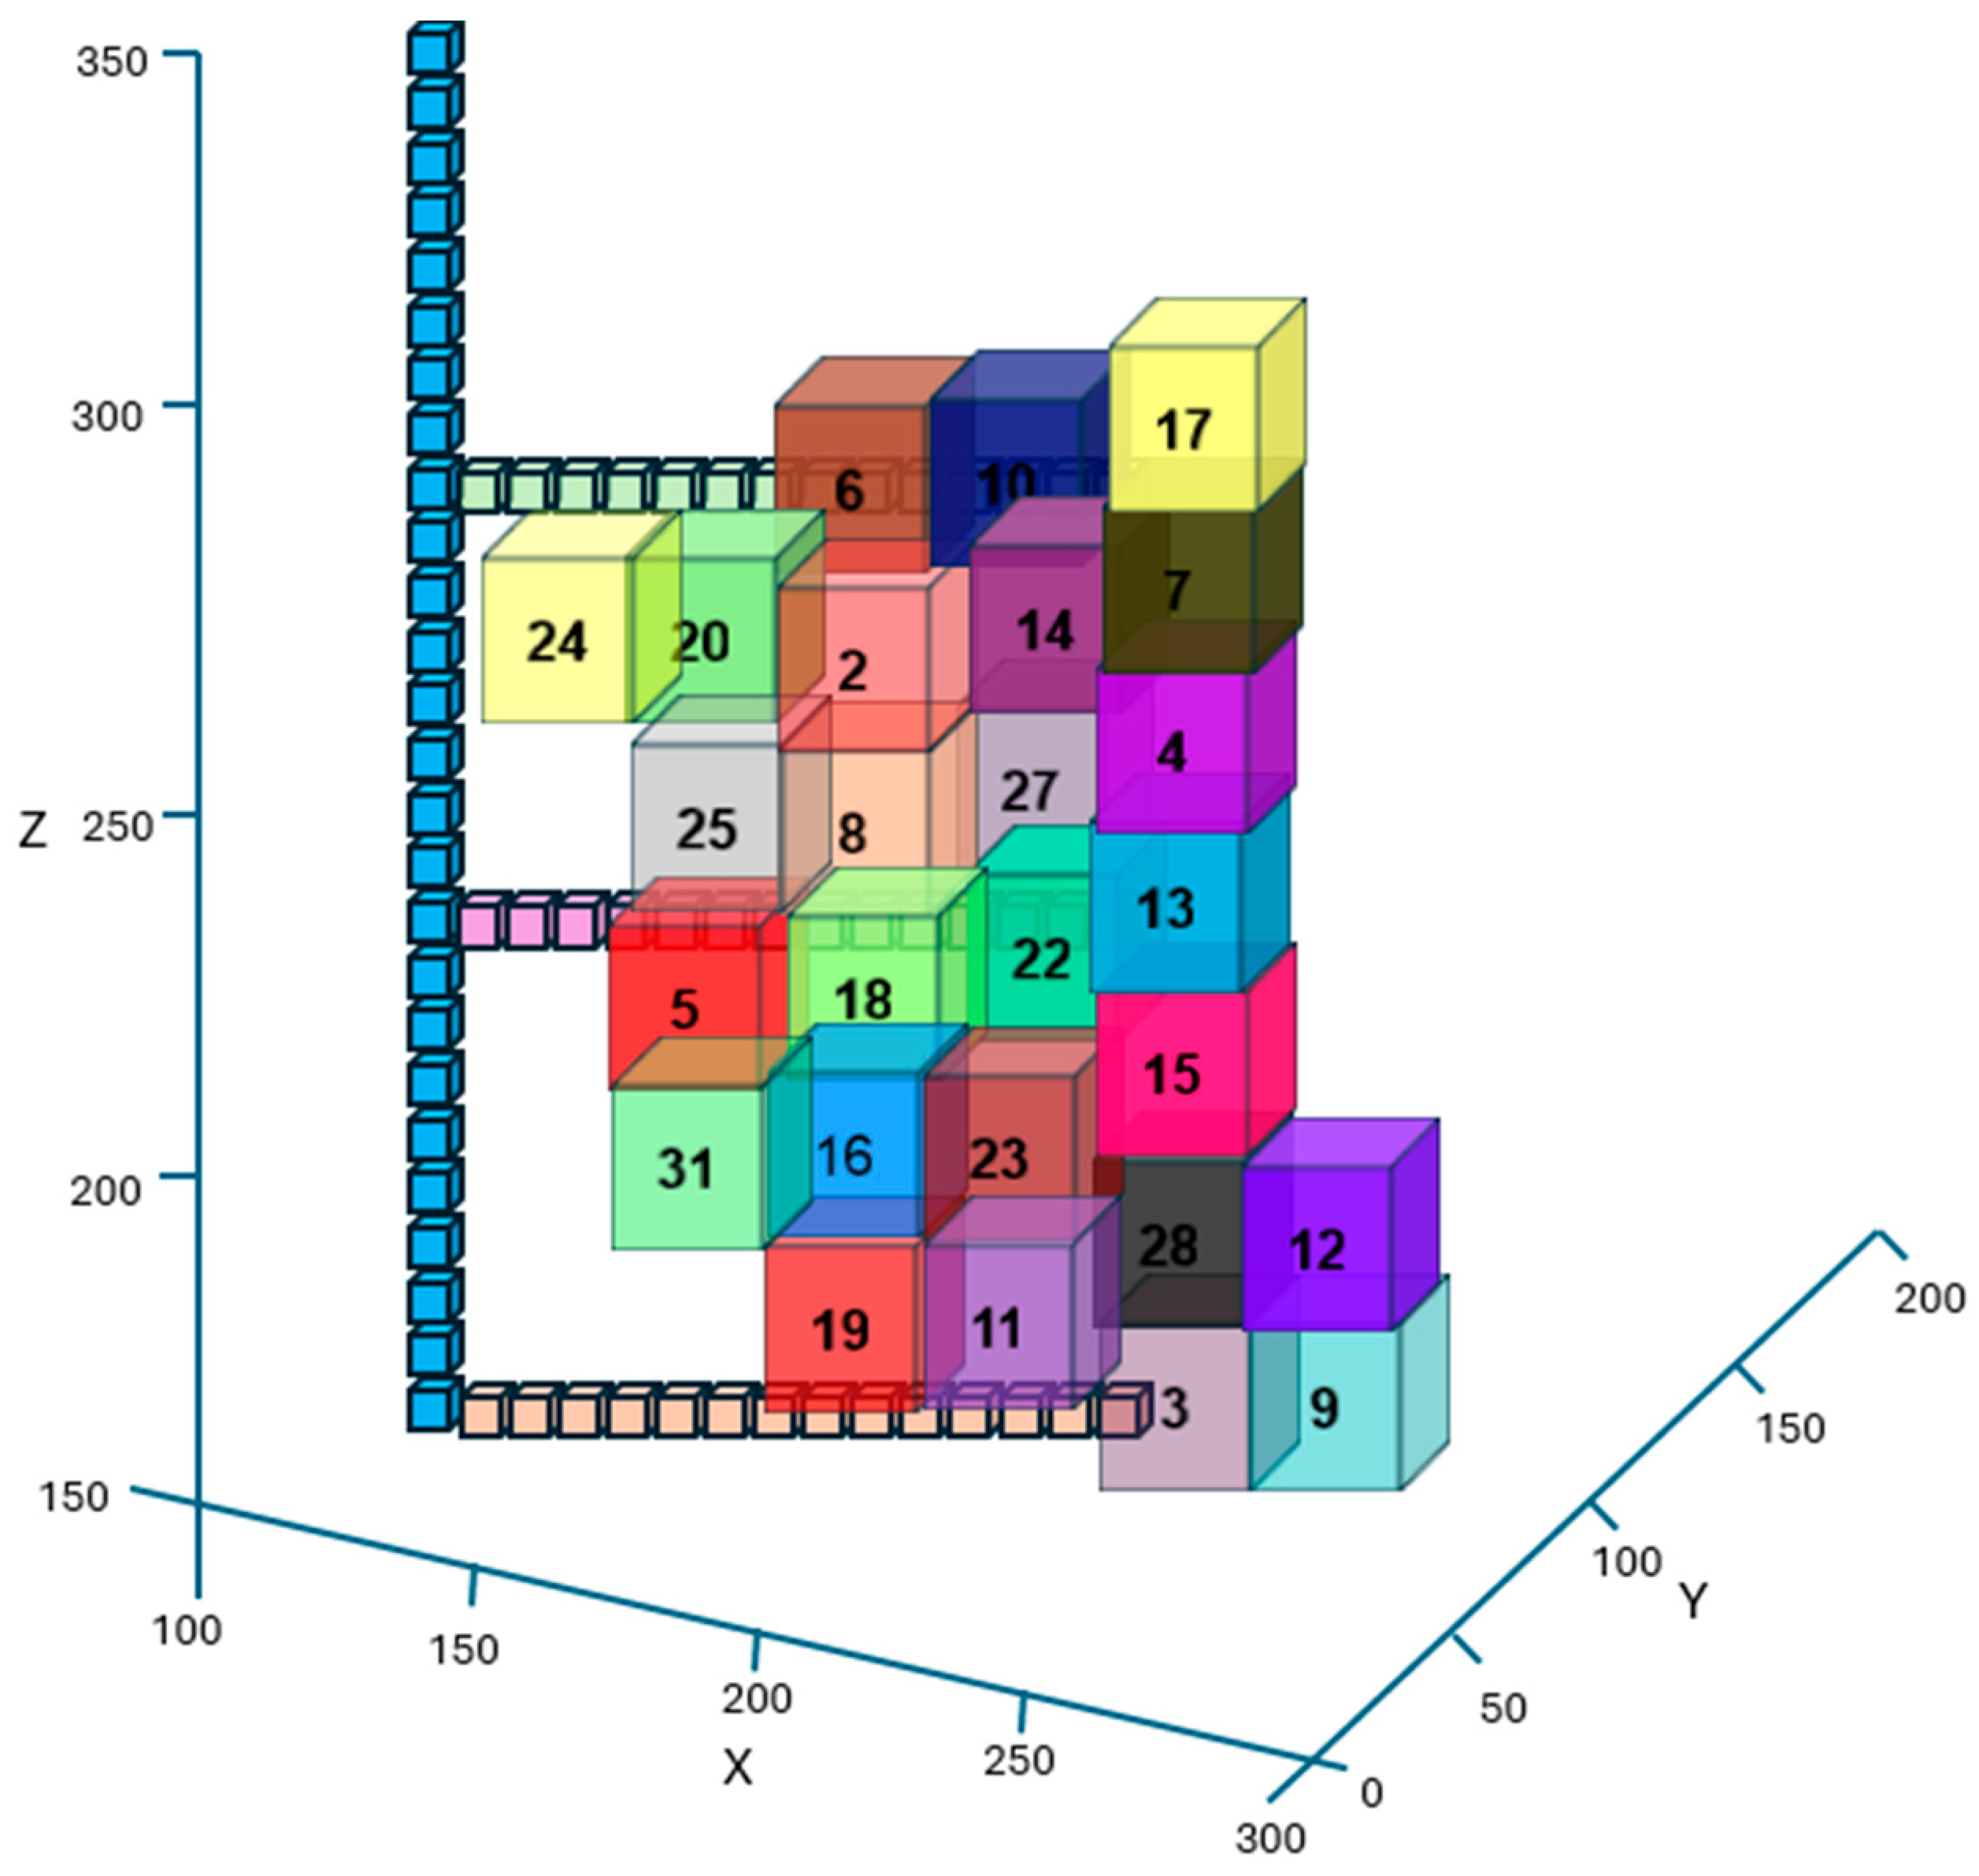
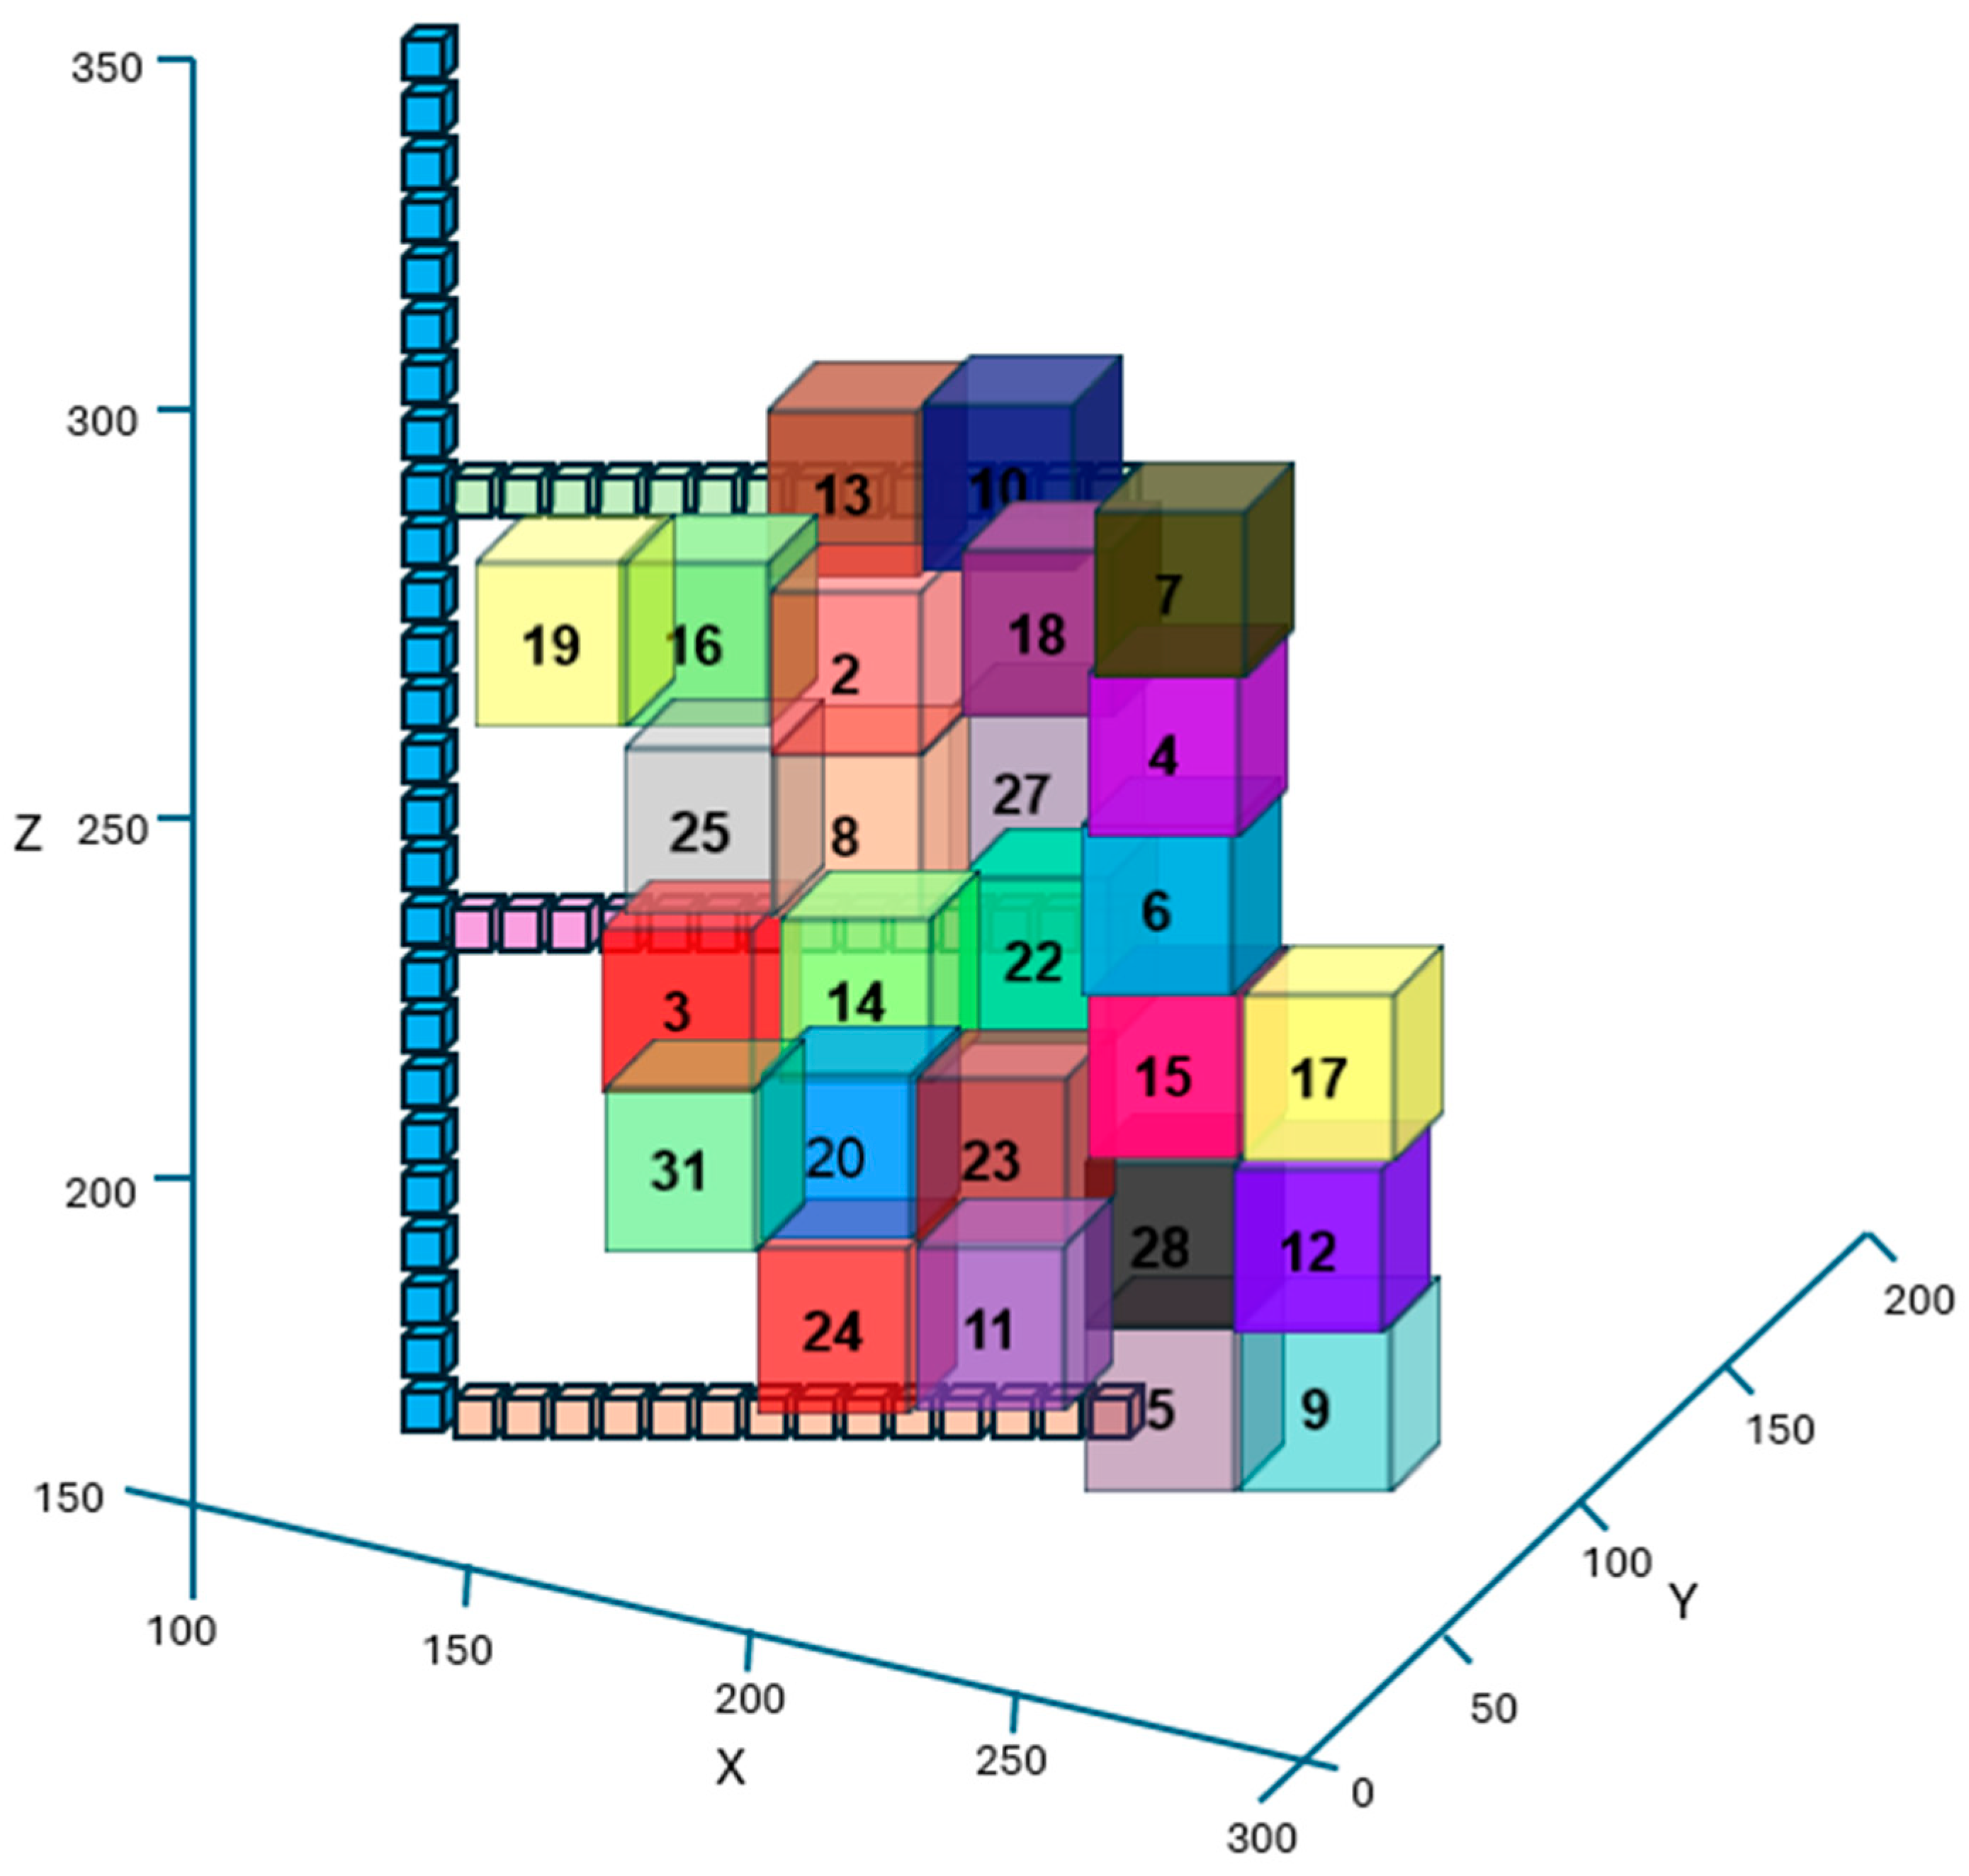
Figure 2, Figure 3 and Figure 4 present the visualisation of the sequencing scheme for solutions C, A, and B, respectively. The number represents the order in which stopes are extracted.
Economic and environmental outcomes are significantly influenced by the order of extracting mineral bodies in sublevel stoping mining operations, which is why stope sequencing is a critical component. The sequencing process becomes a complex optimisation challenge when the dual objectives of minimising carbon emissions and maximising NPV are considered. The environmental footprint can be reduced while the overall economic return is improved by strategically arranging the sequence in which stopes are mined. For example, the NPV can be increased by prioritising stopes that provide higher ore grades and reduced extraction costs. At the same time, decisions regarding sequencing that reduce haulage distances and optimise equipment utilisation can result in substantial reductions in carbon emissions. To achieve these objectives, it is necessary to employ sophisticated modelling techniques that can assess various scenarios and determine the most effective sequence consistent with both financial and environmental objectives. Consequently, ensuring that resource extraction is conducted in an economically viable and environmentally responsible manner is facilitated by effective stope sequencing, which also advances profitability and promotes sustainable mining practices.

6. Conclusions

This research introduces a novel multi-objective optimisation (MOO) approach for production scheduling in sublevel stoping operations. By integrating the goals of maximising NPV and minimising carbon emissions, the study demonstrates the importance and practicality of incorporating environmental objectives into economic decision-making frameworks.
Results indicate a clear trade-off between profitability and environmental responsibility. While maximising NPV supports business growth, it often leads to higher carbon emissions. For example, Solution A achieves a 1.21% higher NPV ($312.94 million) than Solution C ($309.18 million) but produces 26.54% more emissions (23,602 tonnes vs. 18,647 tonnes). This comparison highlights the necessity of balanced strategies that align financial performance with sustainability goals.
The proposed model encourages mining companies to adopt production plans that reduce environmental impact without compromising competitiveness—an increasingly vital approach as regulatory and social pressures for sustainability intensify.
Beyond its practical implications, this study contributes to the broader field of sustainable mining by demonstrating how advanced optimisation tools can effectively manage multiple, often conflicting objectives. Future work will validate the model using real mine datasets and expand it to include social factors, such as minimising vibration impacts.
Ultimately, integrating economic and environmental objectives is not only achievable but essential for the long-term sustainability and responsible growth of the mining industry.

Author Contributions

Conceptualization, G.M.W.U.; methodology, G.M.W.U.; validation, G.M.W.U.; writing—original draft preparation, G.M.W.U.; writing—review and editing, M.N., M.K. and P.K.; supervision, M.N., M.K. and P.K.; data collection, G.M.W.U.; All authors have read and agreed to the published version of the manuscript.

Funding

This research received no external funding.

Data Availability Statement

The data that support the findings of this study are available from G.M.W.U. upon request.

Conflicts of Interest

The authors declare no conflict of interest.

References

  1. Pons, A.; Vintrò, C.; Rius, J.; Vilaplana, J. Impact of Corporate Social Responsibility in mining industries. Resour. Policy 2021, 72, 102117. [Google Scholar] [CrossRef]
  2. Azadi, M.; Northey, S.A.; Ali, S.H.; Edraki, M. Transparency on greenhouse gas emissions from mining to enable climate change mitigation. Nat. Geosci. 2020, 13, 100–104. [Google Scholar] [CrossRef]
  3. IEA. Greenhouse Gas Emissions from Energy Data Explorer. Paris. 2024. Available online: https://www.iea.org/data-and-statistics/data-tools/greenhouse-gas-emissions-from-energy-data-explorer (accessed on 19 August 2024).
  4. Aramendia, E.; Brockway, P.E.; Taylor, P.G.; Norman, J. Global energy consumption of the mineral mining industry: Exploring the historical perspective and future pathways to 2060. Glob. Environ. Change 2023, 83, 102745. [Google Scholar] [CrossRef]
  5. SunSHIFT Pty Ltd. Australian Renewable Energy Agency (ARENA). Renewable Energy in the Australian Mining Sector White Paper. NSW. 2017. Available online: https://arena.gov.au/assets/2017/11/renewable-energy-in-the-australian-mining-sector.pdf (accessed on 31 December 2023).
  6. Ullah, G.M.W.; Nehring, M.; Kizil, M.; Knights, P. Environmental, Social, and Governance Considerations in Production Scheduling Optimisation for Sublevel Stoping Mining Operations: A Review of Relevant Works and Future Directions. Min. Met. Explor. 2023, 40, 2167–2182. [Google Scholar] [CrossRef]
  7. Trout, L.P. Underground mine production scheduling using mixed integer programming. In 25th International APCOM Symposium Proceedings; The Australasian Institute of Mining and Metallurgy: Melbourne, Australia, 1995. [Google Scholar]
  8. Little, J.; Nehring, M.; Topal, E. A new mixed-integer programming model for mine production scheduling optimisation in sublevel stope mining. In Proceedings of the Australian Mining Technology Conference 2008, Sunshine Coast, Australia, 16–18 September 2008; pp. 157–172. Available online: http://198.106.181.16/Conf2008/papers/Little.pdf (accessed on 2 February 2024).
  9. Carlyle, W.M.; Eaves, B.C. Underground Planning at Stillwater Mining Company. Interfaces (Providence) 2001, 31, 50–60. [Google Scholar] [CrossRef]
  10. Little, J. A New Approach to Using Mixed-Integer Programming for Scheduling Optimisation in Sublevel Stope Mining. Bachelor’s Thesis, The University of Queensland, Brisbane City, Australia, 2007. [Google Scholar]
  11. Terblanche, S.; Bley, A. An improved formulation of the underground mine scheduling optimisation problem when considering selective mining. ORiON 2015, 31, 1–16. [Google Scholar] [CrossRef]
  12. Copland, T.; Nehring, M. Integrated optimization of stope boundary selection and scheduling for sublevel stoping operations. J. South Afr. Inst. Min. Met. 2016, 116, 1135–1142. [Google Scholar] [CrossRef]
  13. Appianing, E.J.A.; Ben-Awuah, E.; Pourrahimian, Y. Life-of-mine optimization for integrated open stope development and production scheduling using a mixed-integer linear programming framework. Min. Technol. Trans. Inst. Min. Metall. 2023, 132, 106–120. [Google Scholar] [CrossRef]
  14. Wang, X.; Gu, X.; Liu, Z.; Wang, Q.; Xu, X.; Zheng, M. Production process optimization of metal mines considering economic benefit and resource efficiency using an NSGA-II model. Processes 2018, 6, 228. [Google Scholar] [CrossRef]
  15. Foroughi, S.; Hamidi, J.K.; Monjezi, M.; Nehring, M. The integrated optimization of underground stope layout designing and production scheduling incorporating a non-dominated sorting genetic algorithm (NSGA-II). Resour. Policy 2019, 63, 101408. [Google Scholar] [CrossRef]
  16. Sari, Y.A.; Kumral, M. Stope Sequencing Optimization for Underground Mines Through Chance-Constrained Programming. Min. Met. Explor. 2023, 40, 1737–1748. [Google Scholar] [CrossRef]
  17. Wang, G.; Zhou, J. Multiobjective Optimization of Carbon Emission Reduction Responsibility Allocation in the Open-Pit Mine Production Process against the Background of Peak Carbon Dioxide Emissions. Sustainability 2022, 14, 9514. [Google Scholar] [CrossRef]
  18. Ulrich, S.; Trench, A.; Hagemann, S. Greenhouse gas emissions and production cost footprints in Australian gold mines. J. Clean. Prod. 2020, 267, 122118. [Google Scholar] [CrossRef]
  19. Ren, G.; Wang, W.; Wu, W.; Hu, Y.; Liu, Y. Carbon Emission Prediction Model for the Underground Mining Stage of Metal Mines. Sustainability 2023, 15, 12738. [Google Scholar] [CrossRef]
  20. Zhang, Z.; Song, G.; Chen, J.; Zhai, Z.; Yu, L. Development of a simplified model of speed-specific vehicle-specific power distribution based on vehicle weight for fuel consumption estimates. In Transportation Research Record; SAGE Publications Ltd.: London, UK, 2020; Volume 2674, pp. 52–67. [Google Scholar] [CrossRef]
  21. Ullah, G.M.W.; Nehring, M. A multi-objective mathematical model of a water management problem with environmental impacts: An application in an irrigation project. PLoS ONE 2021, 16, e0255441. [Google Scholar] [CrossRef] [PubMed]
  22. Nakayama, H.; Yun, Y.; Yoon, M. Sequential Approximate Multiobjective Optimization Using Computational Intelligence (Vector Optimization), 1st ed.; Springer: Berlin/Heidelberg, Germany, 2009. [Google Scholar]
  23. Deb, T.; Agrawal, K.; Pratap, S.; Meyarivan, A. A fast elitist non-dominated sorting genetic algorithm for multi-objective optimization: NSGA-II. In International Conference on Parallel Problem Solving from Nature; Springer: Berlin/Heidelberg, Germany, 2000; pp. 849–858. [Google Scholar]
  24. Department of Climate Change, Energy, the Environment and Water. Australian National Greenhouse Accounts Factors. 2023. Available online: https://www.dcceew.gov.au/sites/default/files/documents/national-greenhouse-accounts-factors-2022.pdf (accessed on 8 February 2024).
Figure 1. Pareto front.
Mining 05 00076 g001
Figure 2. Stope sequencing for solution C.
Mining 05 00076 g002
Figure 3. Stope sequencing for solution A.
Mining 05 00076 g003
Figure 4. Stope sequencing for solution B.
Mining 05 00076 g004
Table 1. The list of parameters regarding the case study.
ParameterUnitValue
Recovery%95
Average iron price$/t90
Fixed extraction cost$/stope1,400,000
Variable extraction cost$/t20
Fixed backfill cost$/stope1,200,000
Variables backfill cost$/m315
Discount rate%10
Ore production capacity in each periodt150,000
Minimum contained metal tonnage target per periodkg60,000
Maximum contained metal tonnage target per periodkg90,000
Backfill availability per time periodm340,000
Backfilling, waste, and ore densityt/m32.1, 3 and 5.2
Mine lifeperiod200
Table 2. Technical parameters of different rock masses.
Common Rock Mass TypesAverage Drill Hole Length m/m3Average Number of Drill Holes
(Orebody) Skarn0.835.0
(Orebody) Marble0.835.0
(Wall-rock) Quartz diorite porphyrite0.945.0
(Wall-rock) Diorite0.945.4
Table 3. Technical parameters of the tunnelling and drilling rigs.
Drill TypeModel of DrillNominal Power (kW)Rock Breaking Efficiency (m/h)Equipment Size (m)Equipment Weight (t)
TunnellingHuatai HT82623011 × 1.45 × 2.0810.0
Deep-hole
drilling
Huatai HT7262609.05 × 1.45 × 2.0811.5
Table 4. Explosive blasting parameters.
Rock TypesSolid Coefficient of RockUnit Explosive for Preparatory WorkUnit Explosive for Ore Blasting
Skarn8~101.62~1.89 kg/m31.49 kg/m3
Marble10~121.89~2.11 kg/m31.58 kg/m3
Table 5. Fan data.
Table 5. Fan data.
Type of FanOperating Capacity (kW)Number of Working DevicesFan Air Volume (m3/min)Static Pressure (Pa)Fan Speed (r/min)
K40-6-no 14301984~2064150~695960
K45-6-no 144511434~2718500~959980
FCDZ-6-no 2237032400~7600750~2750990
K40-4-no 12371882~1926242~11181450
Table 6. Drainage pump data.
Type of PumpOperating Capacity (kW)Number of Working DevicesPumping Capacity (m3/h)Fan Speed (r/min)
200D43.630012801480
MD280-65.763022801480
MD280-43.525022801480
MD280-65.980022801480
Table 7. Air compressor data.
Type of CompressorOperating Capacity (kW)Number of Working DevicesOperating Time (h)Rated Exhaust Pressure (MPa)Nominal Volume Flow (m3/min)
TS325-400300880.741.8
TS325-4003003160.761.7
Table 8. LHD data.
Table 8. LHD data.
Type of LHDsRated Power (kW)Number of Working DevicesBucket Capacity (m3)Full Bucket Coefficient
WJ-1.56381.51.12
WJ-0.755840.751.09
WJ-15871.01.10
Table 9. Backfilling the equipment parameter table.
EquipmentNumber of TypesNumber of Working DevicesRated Power (kW)Operating Time (h)
MixerSJ6.623016
SJ6.813016
Pump80ZBYL-4507908
150ZJ-I-A7012008
100ZJ-I-A503908
100ZJ-I-A502558
Table 10. Crushing and Grinding equipment parameter table.
EquipmentModelFeeding Size (mm)Rated Power (kW)Capacity (t/h)Operating Time (h)
CrushersPE600.9005007514016
PE1200.1500102025080016
GrinderΦ2.4.10255703016
Φ3.4.7.52510006016
Table 11. Parameters for NSGA-II.
ParameterValue
Population size100
Total number of iterations10,000
Crossover probability0.9
Mutation probability0.8
Table 12. Summary statistics of objectives.
NPV ($)Carbon Emissions (Tonnes)
Minimum output$218,177,00013,551
Maximum output$312,940,00023,602
Mean$279,146,00016,723
Disclaimer/Publisher’s Note: The statements, opinions and data contained in all publications are solely those of the individual author(s) and contributor(s) and not of MDPI and/or the editor(s). MDPI and/or the editor(s) disclaim responsibility for any injury to people or property resulting from any ideas, methods, instructions or products referred to in the content.