Article

Solvometallurgical Properties of Choline Chloride-Based Deep Eutectic Solvents for Copper Extraction from Chalcopyrite: Optimization and Analysis

by
Seyed Mojtaba Ghadamgahi
1,
Abolfazl Babakhani
1,*,
Ghasem Barati Darband
1,
Hossein Shalchian
1 and
Reza Behmadi
2
1
Materials and Metallurgical Engineering Department, Faculty of Engineering, Ferdowsi University of Mashhad, Mashhad 9177948974, Iran
2
Department of Materials Engineering, Science and Research Branch, Islamic Azad University, Shohada Hesarak Blvd., Daneshgah Square, Sattari Highway, Tehran 1477893855, Iran
*
Author to whom correspondence should be addressed.
Submission received: 2 December 2024 / Revised: 18 December 2024 / Accepted: 24 December 2024 / Published: 13 January 2025

Abstract

:
This paper focuses on the solvometallurgical properties of choline chloride-based deep eutectic solvents for copper extraction from chalcopyrite concentrate. The study, conducted with scientific rigor, utilized the response surface methodology to optimize the extraction process and investigate the effects of the temperature and contact time on the copper recovery efficiency. The results showed that the ChCl-EG-Ox solvent at 80 °C and 48 h produced the highest copper recovery rate, exceeding 76%. This underscores the potential of deep eutectic solvents for sustainable metal extraction. Kinetic studies revealed the influence of temperature on dissolution kinetics, with higher temperatures leading to faster reaction rates. The mineralogical analysis demonstrated the changes in the chalcopyrite concentrate after dissolution, while spectroscopy and mass spectrometry highlighted the esterification reactions in the solvent. The study also examined the effects of adding water and heating on the solvent’s behavior, providing insights into the chemical interactions and structural changes. Ultimately, the research demonstrated that ChCl-based deep eutectic solvents present a promising avenue for environmentally friendly and efficient copper extraction processes in the metallurgical industry.

1. Introduction

Copper is a crucial element widely used in various industries [1] due to its remarkable thermal and electrical conductivity properties [2]. Extracting copper from ores is a complex process that requires technical expertise and economic viability [3]. The majority of global copper resources, approximately 90%, are found in sulfide ores [4], with chalcocite, covellite, and chalcopyrite being the predominant copper minerals [5]. As surface deposits of covellite and chalcocite gradually deplete, chalcopyrite has emerged as the primary copper mineral, accounting for over 70% of global copper reserves [6,7]. However, the economic leaching of chalcopyrite remains challenging with current methods due to slow kinetics and passivation. This has led to the continued prevalence of pyrometallurgical processes in copper processing [8]. Pyrometallurgical processes for chalcopyrite have several disadvantages, including high energy consumption, emissions of pollutants, and waste generation. Basically, pyrometallurgy involves high-temperature processes, which typically require significant energy input to achieve the necessary temperatures for smelting. This contributes to overall high energy consumption. On the other hand, the energy consumption of the pyrometallurgy process for chalcopyrite can be substantial due to several factors involved in the extraction and processing of copper. The pyrometallurgical process of chalcopyrite does not only involve smelting but also concentration, roasting, and conversion. The entire pyrometallurgical process of chalcopyrite is characterized by a high energy consumption, primarily due to the need for elevated temperatures during roasting and smelting. The energy demand is significantly higher compared to hydrometallurgical processes (like heap leaching), which can operate at ambient temperatures and may require less energy overall. Given these challenges, the metallurgical industry is increasingly exploring eco-friendly and cost-effective solvents [9,10]. Deep eutectic solvents (DESs) have emerged as a promising alternative for mineral processing, particularly for challenging minerals like chalcopyrite [11]. Deep eutectic solvents (DESs) offer several advantages over classical mineral acids for leaching chalcopyrite, including eco-friendliness, selectivity and efficiency, lower corrosiveness, and reduced toxicity [12].
Efficient and innovative processes are essential to enhance the extraction and recovery of copper from complex minerals like chalcopyrite [13,14]. Various redox and non-redox processes have been utilized [15], but forming insoluble products during the leaching process can hinder progress [16]. Alternative methods, such as using deep eutectic solvents with a low water content have been proposed [17] to address this issue. Solvometallurgy and ionometallurgy offer promising approaches for copper processing, providing tunable selectivity [18], reduced wastewater generation, intensified processes, and a non-aqueous processing approach [19].
Copper electrodeposition is a significant area of interest for various applications, including the electronics industry [20]. Nonetheless, the complex nature of copper sulfides limits conventional approaches [21]. Electrodeposition offers a more straightforward and cost-effective method for manufacturing thin-film materials in emerging fields like electronics [22]. To overcome the challenges associated with toxic and corrosive aqueous solvents in copper extraction processes, deep eutectic solvents (DESs) have been explored as a viable alternative [23]. DESs offer advantages such as a lower cost, reduced toxicity, and biodegradability compared to ionic liquids [24], showing potential for copper electrodeposition and metal dissolution in ores [25].
The response surface methodology (RSM) is crucial in optimizing the copper dissolution process from chalcopyrite using deep eutectic solvents. The RSM provides a systematic approach to process and product optimization through designed experiments, offering valuable insights into the chemical dissolution processes involved in copper extraction [26]. By integrating the RSM with deep eutectic solvents, researchers can gain a deeper understanding of chemical equilibria and kinetics, contributing to the optimization of copper dissolution processes [27].
Traditional copper extraction methods rely on aqueous solutions, which can have adverse environmental impacts [28]. DESs, particularly those containing sustainable compounds like choline chloride, show immense promise for large-scale applications in metal processing [29]. Studies have shown that copper and iron dissolve in their original oxidation states in DES, forming a chloride complex without altering the solvent’s pH [30]. Increasing the water content in DESs could enhance the mass transfer currents without affecting the electrochemical range or the formation of copper chloro-complexes, potentially boosting metal deposition rates [31].
Using deep eutectic solvents to extract and recover copper from challenging minerals like chalcopyrite presents a promising alternative to conventional methods [32]. By optimizing the copper dissolution process using the response surface methodology, and exploring the effects of water addition and heating on DES behavior, researchers can enhance the efficiency and sustainability of copper processing [33]. However, it is essential to be mindful of the negative effects of deep eutectic solvent esterification on its performance during copper dissolution, highlighting the importance of continued research and innovation in this field [34,35].
This research focused on studying the hydrometallurgical properties of different deep eutectic solvents (DESs) containing choline chloride to extract copper from chalcopyrite concentrate. Optimization experiments were conducted using the response surface methodology to improve the leaching process efficiency. Inductively coupled plasma–optical emission spectroscopy (ICP-OES) was used to analyze the chemical composition of chalcopyrite dissolved in filtered PLS by DES. The study results showed the potential of DES with choline chloride for copper extraction from chalcopyrite. Additionally, optimization experiments using the response surface methodology enhanced the leaching process efficiency. Fourier Transform Infrared Spectroscopy (FTIR) studies examined the impact of adding water on the esterification reaction of DESs. This work also investigated the effect of adding water to DESs on copper’s kinetic behavior and dissolution rate. Additionally, the degradation of DESs with heating was studied to improve the understanding of copper dissolution kinetics and to optimize the reaction conditions. Gas chromatography–mass spectrometry (GC/MS) was used to analyze the changes in the DES composition during copper dissolution and to study the esterification reaction.

2. Experimental Section

2.1. Materials

The primary material used in this study was chalcopyrite concentrate sourced from the Sarcheshmeh Copper Complex mine located in the city of Rafsanjan in Kerman province, Iran. The X-ray fluorescence (XRF) analysis of the concentrate revealed that it contained 24.03% copper (Cu), 33.4% sulfur (S), and 31.5% iron (Fe), along with 5.74% silicon dioxide (SiO2), 2.15% aluminum oxide (Al2O3), 0.45% magnesium oxide (MgO), and 0.25% titanium dioxide (TiO2). Choline chloride (≥99%), acquired from Loba Chemie, DAB 10, produced in Mumbai, Maharashtra, India, ethylene glycol (≥99%), and oxalic acid (≥99%) were obtained from Merck to create deep eutectic solvents in various molar ratios.

2.2. Synthesis of Deep Eutectic Solvents

A series of deep eutectic solvents were synthesized by combining choline chloride (ChCl) or (HOC2H4N(CH3)3Cl) as a hydrogen bond acceptor (HBA) and ethylene glycol (EG) with oxalic acid (Ox) as hydrogen bond donors (HBD) at a constant molar ratio of 1:2 for ChCl-EG, 1:1 for ChCl-Ox, and 1:1:2 for ChCl-EG-Ox, as described in Table 1. The components were mixed in a beaker using a magnetic stirrer on a hot plate, gradually increasing the temperature from 50 °C to 90 °C until a transparent and homogeneously mixed liquid was obtained. The resulting solvent was maintained at 50 °C for an extended period to avoid crystal formation.

2.3. Characterization

The morphologies of the samples were analyzed using a scanning electron microscope (SEM), specifically a Philips-type device manufactured in Amsterdam, Netherlands with an operating voltage of 20 kV. The metal contents in the chalcopyrite and deep eutectic solvents were analyzed using an inductively coupled plasma–optical emission spectrometry (ICP-OES) system with a spectrometer and axially viewed plasma. The technique, with a detection limit of parts per million, was explicitly used to measure the copper levels in the liquid samples. The analysis was carried out with the DV7300 Optima device from Perkin Elmer located in Washington, DC, USA. The composition of the crystalline structure and phase content of all of the samples were analyzed by an XRD diffractometer (Italstructure APD2000 diffractometer is produced by VEMID Ltd., a company located in Vinorača, Serbia). The target and wavelength were Cu Ka and 1.54060 Å, respectively. The XRD measurements were performed with a source power of 40 kV and a 300 mA current, and the scanning range was between 10° and 100° with a step size of 0.05°. The FTIR spectral analysis was conducted using a thermal spectrometer model AVATAR with an MCT detector cooled by liquid nitrogen and a KBr beam splitter. The gas chromatography apparatus used for the GC-MS analysis in this work had specific technical specifications, such as a working ambient temperature range, a pumping speed of 65 m3/h, sample volume ranges from 0.1 μL to 250 μL, and a sampling accuracy of ±0.01%. The instrument also had a precision level and flow rate range from 0 to 500 mL/min (N2) or 0 to 1000 mL/min (He).

3. Results and Discussion

3.1. Response Surface Methodology Studies

The main objective of this study was to investigate copper extraction from chalcopyrite concentrate using ChCl-based deep eutectic solvents. Various factors such as the dissolution temperature (50 °C, 65 °C, and 80 °C) and time (24 h, 48 h, and 72 h) were studied to determine their influence on the extraction process. The extraction process was optimized using Central Composite Design (CCD) to determine the most efficient conditions for copper dissolution. Two key factors that affected the efficiency of copper recovery were identified in the extraction process. The multivariate response surface methodology (RSM) was applied to optimize the process and design experiments faster, more economically, and more accurately. The temperature of the DES solvent during the process and the contact time were considered as independent variables, while the efficiency of the copper recovery was the response variable. The experiments maintained a rotation speed of 500 rpm and a pulp density ratio of 1:6 (powder chalcopyrite/DES solution volume).
The relationship of responses as a function of independent variables was explained using a quadratic model according to Equation (1) in all of the experiments [36,37], as follows:
Y = β 0 + i = 1 n β i x i + i = 1 n β i i x i 2 + i = 1 n j = i + 1 n β i j x i x j + ε
In the above equation, Y represents the mean efficiency of the copper recovery. Additionally, β0 represents a constant coefficient, while βi, βii, and βij refer to the coefficients associated with linear, quadratic, and interaction effects [38]. The variables xi and xj are independent variables in the model, and the term ε represents the error within the model calculation [39]. Table 2 displays the independent variables and their corresponding coded levels needed for the RSM analysis.
Table 3 displays the results of the copper dissolution process on the chalcopyrite concentrate. Three replicated center points were included to assess the experiment’s reproducibility. With a total of 11 experiments, a linear model equation was developed. Insignificant model terms were eliminated to pinpoint the most influential outcome parameters. Despite some terms having a minimal impact on the results, they were all included to consider any linear interactions between them. The RSM, a highly effective statistical and mathematical approach, examined multiple factors.
This study employed CCD to analyze how the operating parameters impacted the copper recovery rate [40]. The model equation derived indicates that the efficiency of copper recovery (ɳ) is influenced by the working temperature (A) and contact time (B) (Equation (2)). Through RSM, a model linking responses to operating parameters regarding actual factors was established. Equations (2)–(4) correspond to the eutectic solvent of choline chloride containing ethylene glycol, oxalic acid, and ethylene glycol–oxalic acid, respectively, as follows:
ɳChCl-EG = 10.93 + 2.78 A + 5.83 B + 0.7566 AB + 0.86 A2 − 1.01 B2
ɳChCl-Ox = 58.29 + 14.16 A + 16.67 B + 0.13 AB − 0.92 A2 − 6.34 B2
ɳChCl-EG-Ox = 48.16 + 3.85 A + 2.86 B + 1.65 AB − 1.24 A2 − 13.21 B2
Table 4 presents the results of the ANOVA analysis, which was used to determine the significance of the variables’ main effects and the interaction effects [41]. A significance level of less than 0.05 was used, as indicated by the p-values [42]. ANOVA is useful for assessing the significance of predicted models and their parameters. The F-values and p-values for the quadratic models of A2, B2, and C3 were found to be as follows: F-values = 124.73, 254.70, and 9.23, and p-values = <0.0001, <0.0001, and 0.0146, respectively, indicating that the models are statistically significant.
In the presented ANOVA results, the F-values serve as a crucial statistical measure to evaluate the significance of the independent variables and their interactions in the suggested regression model. Specifically, an F-value is a ratio that compares the variance explained by the model (regression sum of squares) to the variance not explained by the model (error sum of squares). A higher F-value indicates that a significant portion of the variance in the dependent variable can be explained by the independent variables in the model.
The notably high F-values values for A2 and B2 suggest a very strong relationship between these variables and the dependent variable, indicating that changes in these predictors are associated with significant changes in the outcome. Conversely, while the F-value for C3 is lower, it still indicates some level of significance, particularly since its p-value is below 0.05.
The comparison of F-values between models helps in understanding which independent variables have a more pronounced effect. A2 and B2 are likely critical components of the model, and their strong significance suggests that they should be prioritized in interpretations and applications of presented findings. Meanwhile, C3, while significant, may have a less pronounced effect and could warrant further investigation to determine its practical implications or to explore why its effect is comparatively weaker.
The strong evidence that the developed regression model fits the data better than a model without independent variables is supported by the high F-values and low p-values. This suggests that the inclusion of A2, B2, and C3 contributes valuable information to the analysis, validating the relevance of these variables in understanding the underlying phenomena being studied.
Higher F-values and lower p-values suggest greater significance in the variables under examination. A “prob > F” value below 0.05 indicates significant model terms, while values above 0.1 are considered insignificant [43]. The sample data provide strong evidence that the developed regression model fits the data better than a model without independent variables, given the p-value below the significance level [44].
Considering this criterion, the terms A, B, AB, and B2 with p-values lower than 0.05 can be deemed as significant and effective model parameters. For instance, the R2, adjusted R2, and predicted R2 values for the C3 model (ɳChCl-EG-Ox) are 0.9023, 0.8045, and 0.1338, respectively, indicating accurate model fitting. A signal-to-noise ratio greater than 4 is desirable for adequate precision, with a ratio of 8.7866 in this case, suggesting accurate prediction of experimental data by the model.
The R-squared measures the relationship strength between the model and dependent variable, while the F-test confirms the overall significance of this relationship. Given the significant F-test results, it can be concluded that R-squared is not zero, and the correlation between the model and dependent variable is statistically significant [45].
Furthermore, Equation (2) was used to calculate the predicted values compared to the actual values from the experiments, as shown in Figure 1(aI,aII,aIII). The results indicate a strong agreement between the expected and actual values. Three-dimensional response plots, as shown in Figure 1(bI,bII,bIII), were also used to explore the correlation between the working temperature, contact time, and copper recovery efficiency. Increasing the contact time between the DES (C3) and the chalcopyrite concentrate improved the copper extraction. Additionally, changes in the working temperature directly affected the efficiency of the copper recovery.
Figure 1(aI,aII,aIII) compares the predicted values from a statistical model with the actual dissolution results in the C3 solvent, resulting in an R2 value of 0.90. The decrease in the R2 at high temperatures is due to eutectic solvent degradation. Figure 1(bI,bII,bIII) presents the 3D effect of temperature and time on copper dissolution in the C3 solvent. An increase in temperature beyond a certain range can reduce the copper recovery due to the esterification and degradation of the solvent.
The research conducted in the RSM section discovered that a ternary mixture of C3 is the most effective solvent for dissolving high amounts of copper. The ideal conditions for this process are a temperature of 80 °C and a contact time of 48 h. As a result, the subsequent studies focused solely on the properties of C3. On the other hand, when calibrating the Design Expert software (version 11), the parameter of dissolution time was optimized to achieve acceptable dissolution efficiencies within shorter durations. Consequently, Solvent C3, which exhibits a dissolution efficiency of 76% after a period of 48 h, is favored over Solvent B2, which necessitates 72 h to attain a higher dissolution efficiency of 83%. This prioritization underscores the importance of time efficiency in solvent selection for dissolution processes.

3.2. Mineralogical Studies on Chalcopyrite

The XRD analysis of the initial chalcopyrite concentrate revealed distinct peaks, indicating the presence of certain minerals (Figure 2a). The main minerals identified were chalcopyrite (CuFeS2), along with smaller amounts of pyrite (FeS2) and quartz (SiO2). The JCPDS database reference code for chalcopyrite is JCPDS 37-0471 [46]. Chalcopyrite displays diffraction peaks at angles of 29.3° (112), 33.9° (204), 49.0° (220), and 57.8° (312) [47]. The sharp and distinct peaks suggest a high purity of the chalcopyrite phase, with a relatively high intensity indicating a good concentration of chalcopyrite in the sample. Pyrite, JCPDS# 653321, shows characteristic diffraction peaks on its standard X-ray diffraction pattern at around 27.6°, 33.1°, 37.2°, 40.8°, 47.5°, and 56.3°, corresponding to the crystal planes (100), (111), (200), (210), (211), and (220), respectively [48]. The intensity of these peaks is lower compared to chalcopyrite, suggesting a lower pyrite content in the concentrate. The presence of quartz as a minor gangue mineral in the chalcopyrite concentrate is confirmed by its peaks on the standard card of JCPDS 00-046-1045 at 20.9° (101), 26.6° (110), and 79.2° (112) [49]. These peaks are weaker than the chalcopyrite and pyrite peaks, indicating a lower abundance of quartz in the initial chalcopyrite concentrate. The effectiveness of using the solvometallurgical process of deep eutectic solvents (DESs) to dissolve chalcopyrite can be clearly seen in Figure 2b, where there is no longer a peak for chalcopyrite. This indicates that the chalcopyrite content has significantly decreased after undergoing the dissolution process, as confirmed by the XRD result of the leached chalcopyrite concentrate.

3.3. Kinetics of Dissolution

This research focused on examining the chalcopyrite leaching process in solvometallurgy by utilizing the shrinking core model, which observed a decrease in particle size following the leaching process [50]. In the shrinking core model, the reaction occurs on the surface of a solid particle, and the solid core gradually diminishes as the reactants infiltrate the particle [51]. This model is commonly applied to reactions hindered by the speed of mass transfer from the solution bulk to the solid surface [52,53]. Within this model, the reaction transpires at the boundary between the solid reactant and the liquid phase, resulting in a shrinking core of the reactant material [54]. This study emphasized the important role that time and temperature play in the effectiveness of copper dissolution when using synthesized deep eutectic solvents. It indicated that surface diffusion reactions primarily controlled the process. Equation (5) represents a reaction kinetics model under diffusion control. It relates the fractional conversion of the reactant before time t (X), the rate constant of the reaction (kD), the diffusivity constant (D), and time (t) in a chemical reaction under kinetic control, as follows:
1 − (2/3 X) − (1 − X)2/3 = kDt
Equation (6) for Arrhenius’s law is expressed as (kD) equals (A) times e to the power of negative (Ea) divided by RT, where k represents the rate constant, A is the Arrhenius pre-exponential factor, (Ea) is the activation energy, (R) is the gas constant (8.314 J/mol·K), (T) is the temperature in Kelvin, and e denotes the base of natural logarithm [55], as follows:
kD = A × e(−Ea/RT)
To investigate the dissolution rate of copper from chalcopyrite concentrate using deep eutectic solvents at varying temperatures, a series of experiments were carried out at 50, 65, and 80 °C with a pulp density of 1:6 S/L. The results of the kinetic study using the synthesized solvents (A2, B2, and C3) are presented in Figure 3. Figure 3(A2-I,B2-I,C2-I), corresponding to Equation (5), shows good alignment with the model and an acceptable R2 value, suggesting a diffusion-controlled reaction. To confirm this, the activation energy was calculated using Equation (6): kD = A exp(−Ea/RT). In Figure 3(A2-II,B2-II,C2-II), plotting the natural logarithm of the rate constant (Ln k) against the reciprocal of temperature (1/T) enabled the calculation of the activation energy (−Ea/R). The activation energies determined for substances A2, B2, and C3 were 26.6 KJ/mol, 37.4 KJ/mol, and 35.75 KJ/mol, respectively. The relatively low activation energy suggests that the reaction is governed by a diffusion-controlled model through the ash layer [56], as diffusion-controlled reactions typically have lower activation energies and higher rates than chemically controlled reactions [57].

3.4. Results of Fourier Transform Infrared Spectroscopy Analysis

3.4.1. Interception of Synthesized Solvents and Their Constituent Components

Analyzing the components in deep eutectic solvents (C3) was performed using the FTIR technique (Figure 4). The individual spectra of choline chloride, oxalic acid dihydrate, and ethylene glycol in the solvent were recorded and compared to the C3 deep eutectic solvent spectrum. In the infrared spectrum, various absorption peaks were observed. The 3400 to 3300 cm−1 range showed a weak peak related to O-H hydroxyl group vibration [58]. The 3100 to 3000 cm−1 range likely represented the C-H vibration of the methyl group CH3 [59]. The 1500 to 1400 cm−1 range may be linked to N-C bending vibration [60]. Additionally, the 1100 to 1000 cm−1 range might be indicative of C-O-C ether group vibration. Oxalic acid dihydrate’s spectrum displayed a strong peak at 3600 to 3200 cm−1 for O-H hydroxyl group and carboxylic acid (-COOH) stretching vibration, a sharp peak at 1750 to 1700 cm−1 for C=O stretching in the carboxylic acid group, and another peak at 1400 to 1300 cm−1 possibly related to O-H bending or C-O stretching vibrations. The deep eutectic solvent spectrum combined the components’ spectra, showing O-H stretching from ethylene glycol and oxalic acid dihydrate at 3600 to 3200 cm−1, C-H from choline chloride and ethylene glycol at 3000 to 2800 cm−1, C=O stretching from oxalic acid dihydrate at 1750 to 1700 cm−1, C-N from choline chloride at 1500 to 1400 cm−1, O-H bending from oxalic acid dihydrate at 1400 to 1300 cm−1, and C-O from ethylene glycol and oxalic acid dihydrate at 1100 to 1000 cm−1. The changes in the peak width, position, and intensity in the deep eutectic solvent spectrum compared to the individual components are due to hydrogen bonding within the solvent structure, influencing its structural and chemical properties [61].

3.4.2. The Effect of Heating on the Degradation of Deep Eutectic Solvents

The impact of heat treatment on the structure of deep eutectic solvents was studied by subjecting them to a constant temperature of 75 °C for 24, 48, and 72 h, and comparing them to untreated solvents (Figure 5). Esterification involves the reaction of an acid and an alcohol to produce an ester and water [62].
The infrared spectra show peaks corresponding to esters, with stretching vibrations of the C=O bond group between 1750 and 1720 cm−1, and the C-O bond group between 1300 and 1000 cm−1. Notably, peaks related to the O-H bond group of carboxylic acid and choline chloride decrease or disappear in intensity, as do peaks for acidic C=O bonds. Initially, peaks for O-H, C=O, and C-O bonds are seen at 3236, 1738, and 1641 cm−1, respectively, in fresh solvent. Upon heat treatment, the intensity of the O-H peak decreases, indicating the consumption of hydroxyl groups from choline chloride and oxalic acid dihydrate. New peaks appear for C=O and C-O ester bonds from 1750 to 1735 cm−1 and 1300 to 1000 cm−1, respectively, indicating ester formation. These changes in the infrared spectra align with the functional groups of esters, confirming the occurrence of esterification [61].

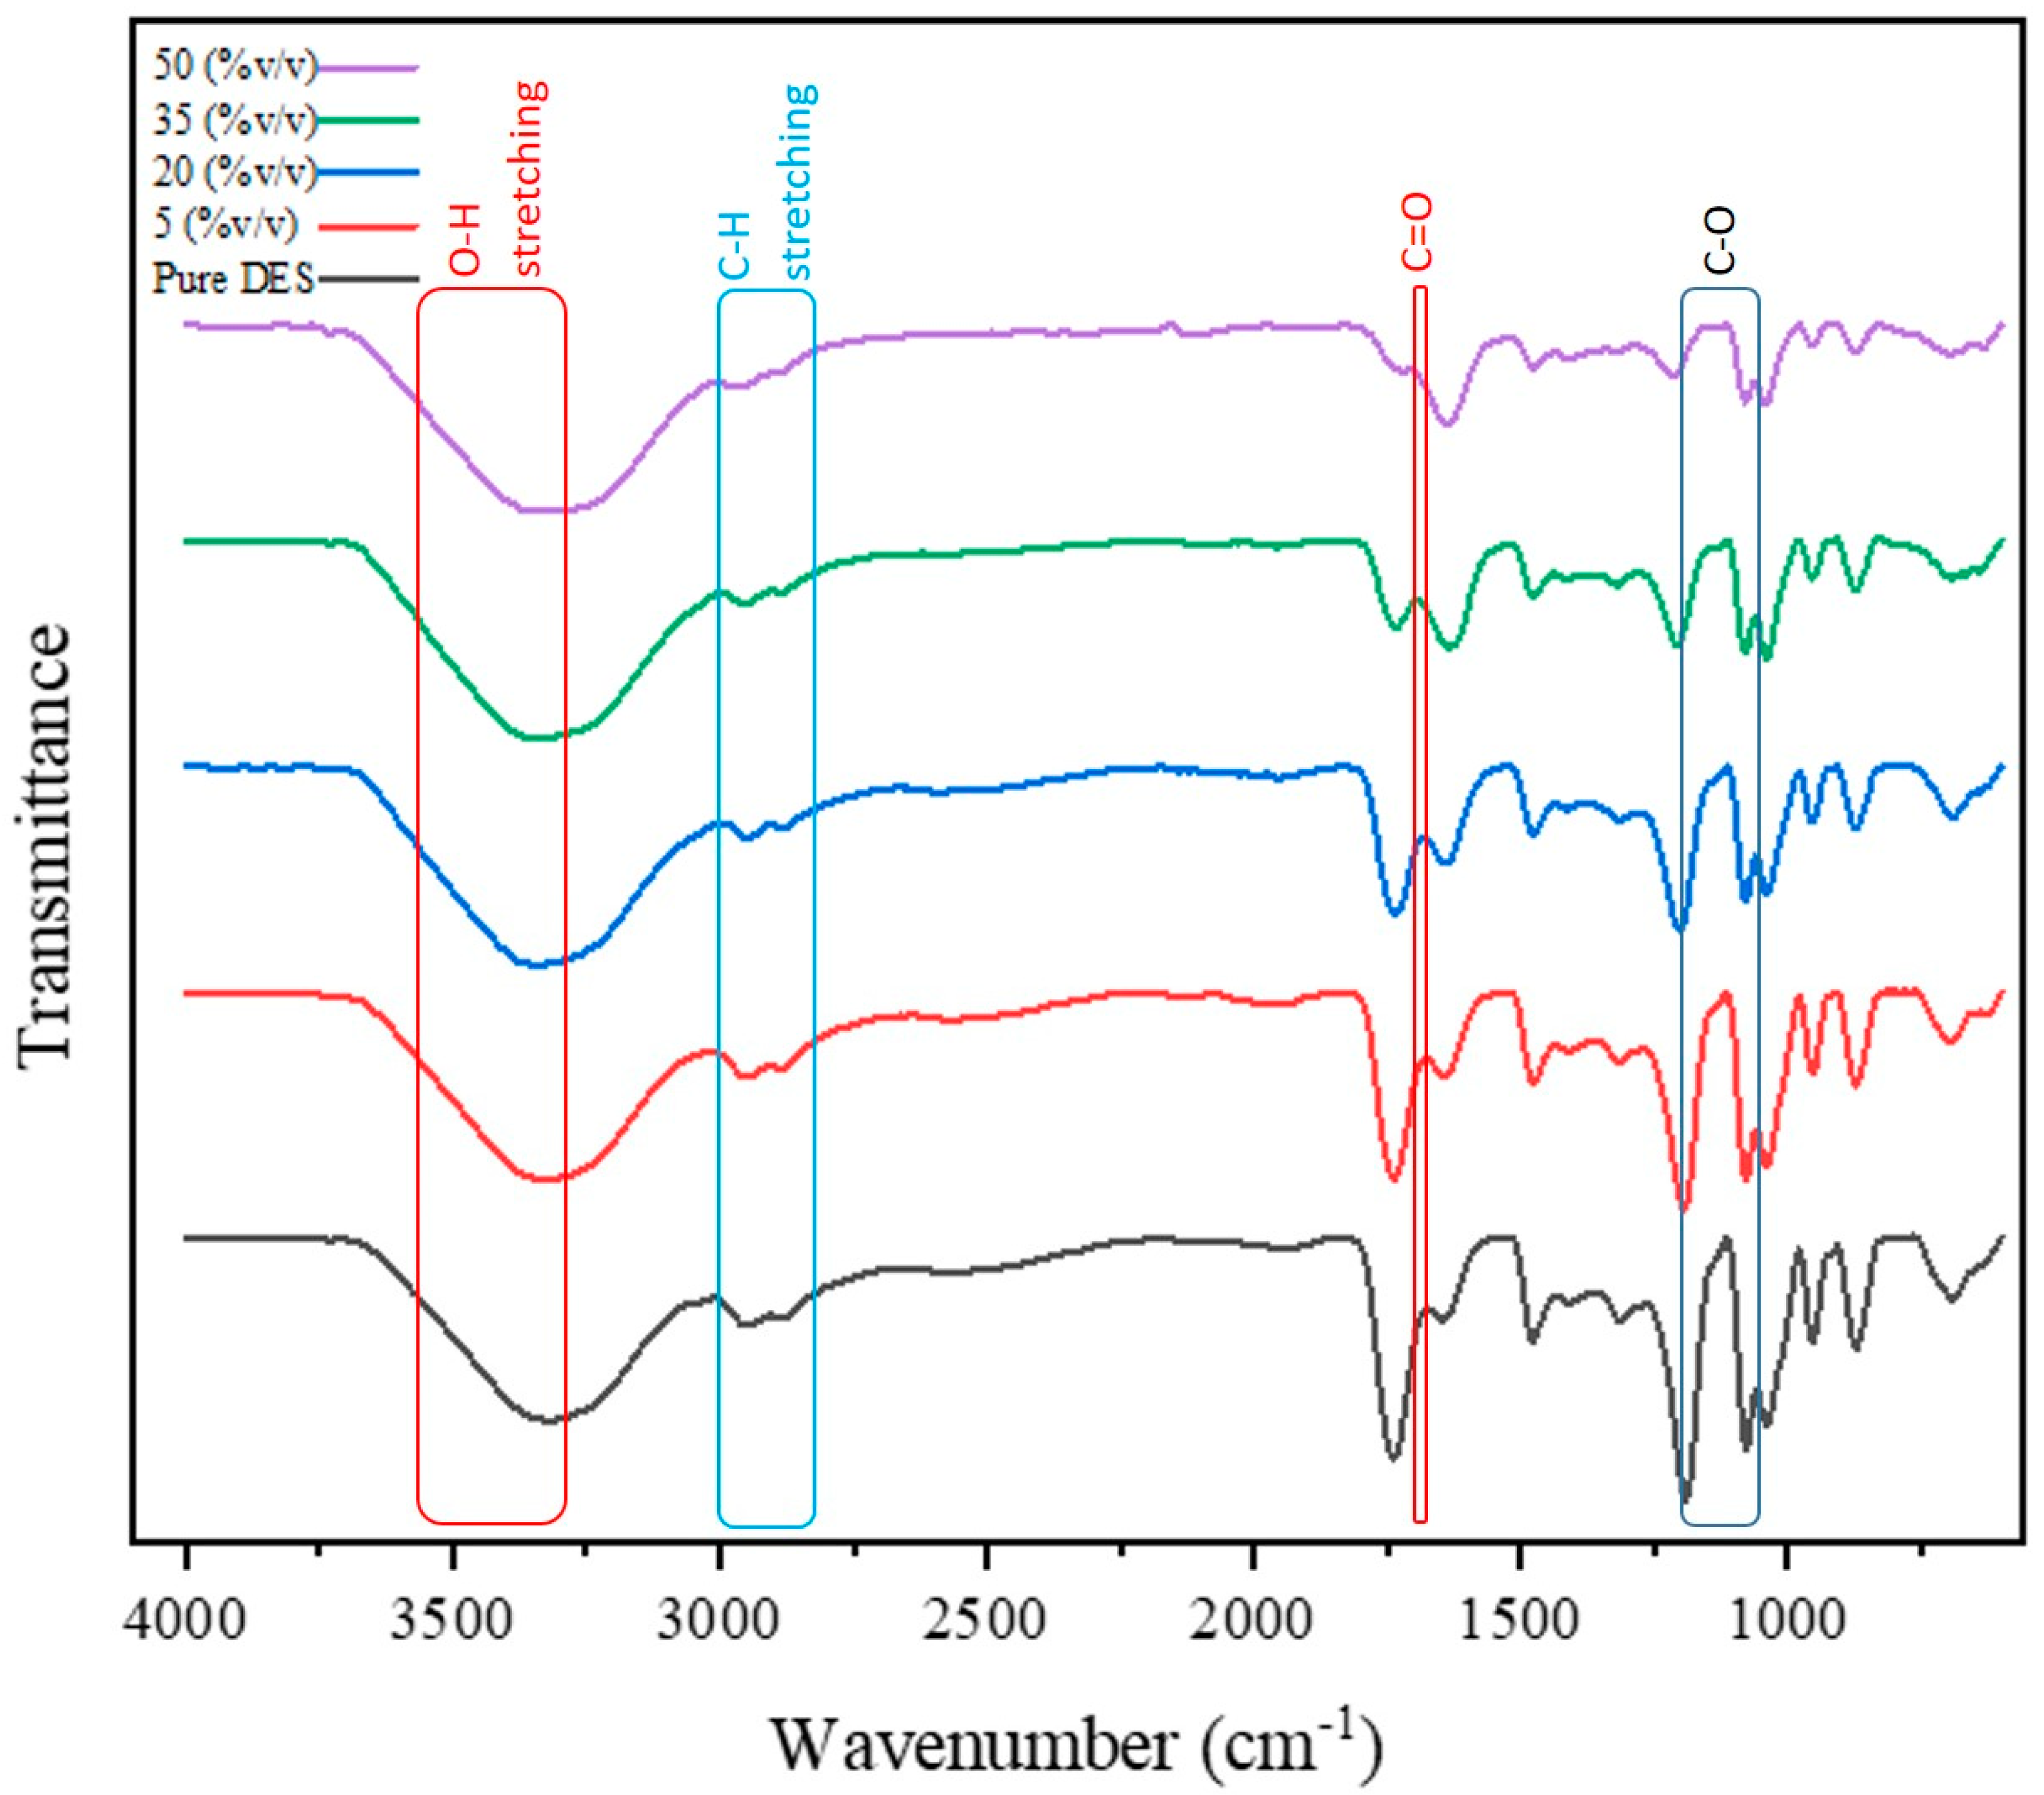
3.4.3. The Effect of Adding Water on the Deep Eutectic Solvent Behavior

In Figure 6, the effect of adding water to the solvent to prevent the esterification reaction has been investigated. In this case, adding water should lead to the broadening and increasing intensity of the O-H peak while preventing the formation of peaks related to C-O and C=O esters. Instead, the peak corresponding to the C=O carboxyl group should also be accompanied by minimal changes [63].
The effect of adding water on the solvent structure and hydrogen bonding network has also been studied. As seen in Table 5, the recovery rates of copper and iron in the deep eutectic solvent C3 were found to increase with the addition of water. The unique properties of water in the mixture are responsible for this effect. When water is added to the deep eutectic solvent, it alters the hydrogen bonding interactions and overall structure [64]. Water molecules form hydrogen bonds with polar functional groups in the solvent, such as hydroxyl groups in ethylene glycol, which disrupts the structure [65] and increases the availability of active sites for metal ion complexation [66]. This leads to a faster rate of copper complexation and subsequent recovery with 5% v/v water, and an increased solubility of iron ions and the formation of more stable iron complexes with 35–50% v/v water. The addition of water up to 20% in deep eutectic solvents causes a decrease in esterification, a decrease in viscosity, and an increase in ion exchange, which ultimately results in an enhanced dissolution of copper from chalcopyrite. On the other hand, exceeding this threshold leads to a reduction in the solvent concentration, essentially over-diluting the solution and causing a decline in copper dissolution.
In Figure 6, where the pure deep eutectic solvent is used, the infrared spectrum includes peaks of O-H stretching vibration in the range of 3600 to 3200 cm−1, C=O stretching vibration at approximately 1700 cm−1, C-H stretching vibration in the range of 3000 to 2800 cm−1, and C-O stretching vibration in the range of 1300 to 1100 cm−1 [67]. In the esterification reaction, where an alcohol and an acid react together, the bands corresponding to the hydroxyl O-H and carbonyl C=O should decrease in intensity, and, in turn, a band corresponding to the ester C=O should be formed. Initially, by comparing the band related to the carbonyl C=O bond at around 1700 cm−1 under different water content conditions in the solvent, this band is observed to have the least change [68].
Regarding the band related to the hydroxyl group, it is noted that, as the water content increases from 5 to 50%, the peak becomes broader and shifts to lower frequencies, which is clearer when compared to spectra of heat-treated solvents discussed in the previous section, indicating a higher intensity of the O-H band under these conditions. It is possible that, by adding water to the solvent, the esterification reaction could be hindered or slowed down. Moreover, in terms of the effect of water on the solvent structure, the broadening of the band related to the hydroxyl group bond indicates an increase in hydrogen bonding between the solvent and water. However, it should be noted that a further increase in water content leads to a change in the solvent structure from organic to aqueous, as confirmed by the changes observed in the mentioned peaks in this comparison. Therefore, the optimal amount of water should be chosen proportionally to maintain the organic solvent structure while achieving the desired objectives.

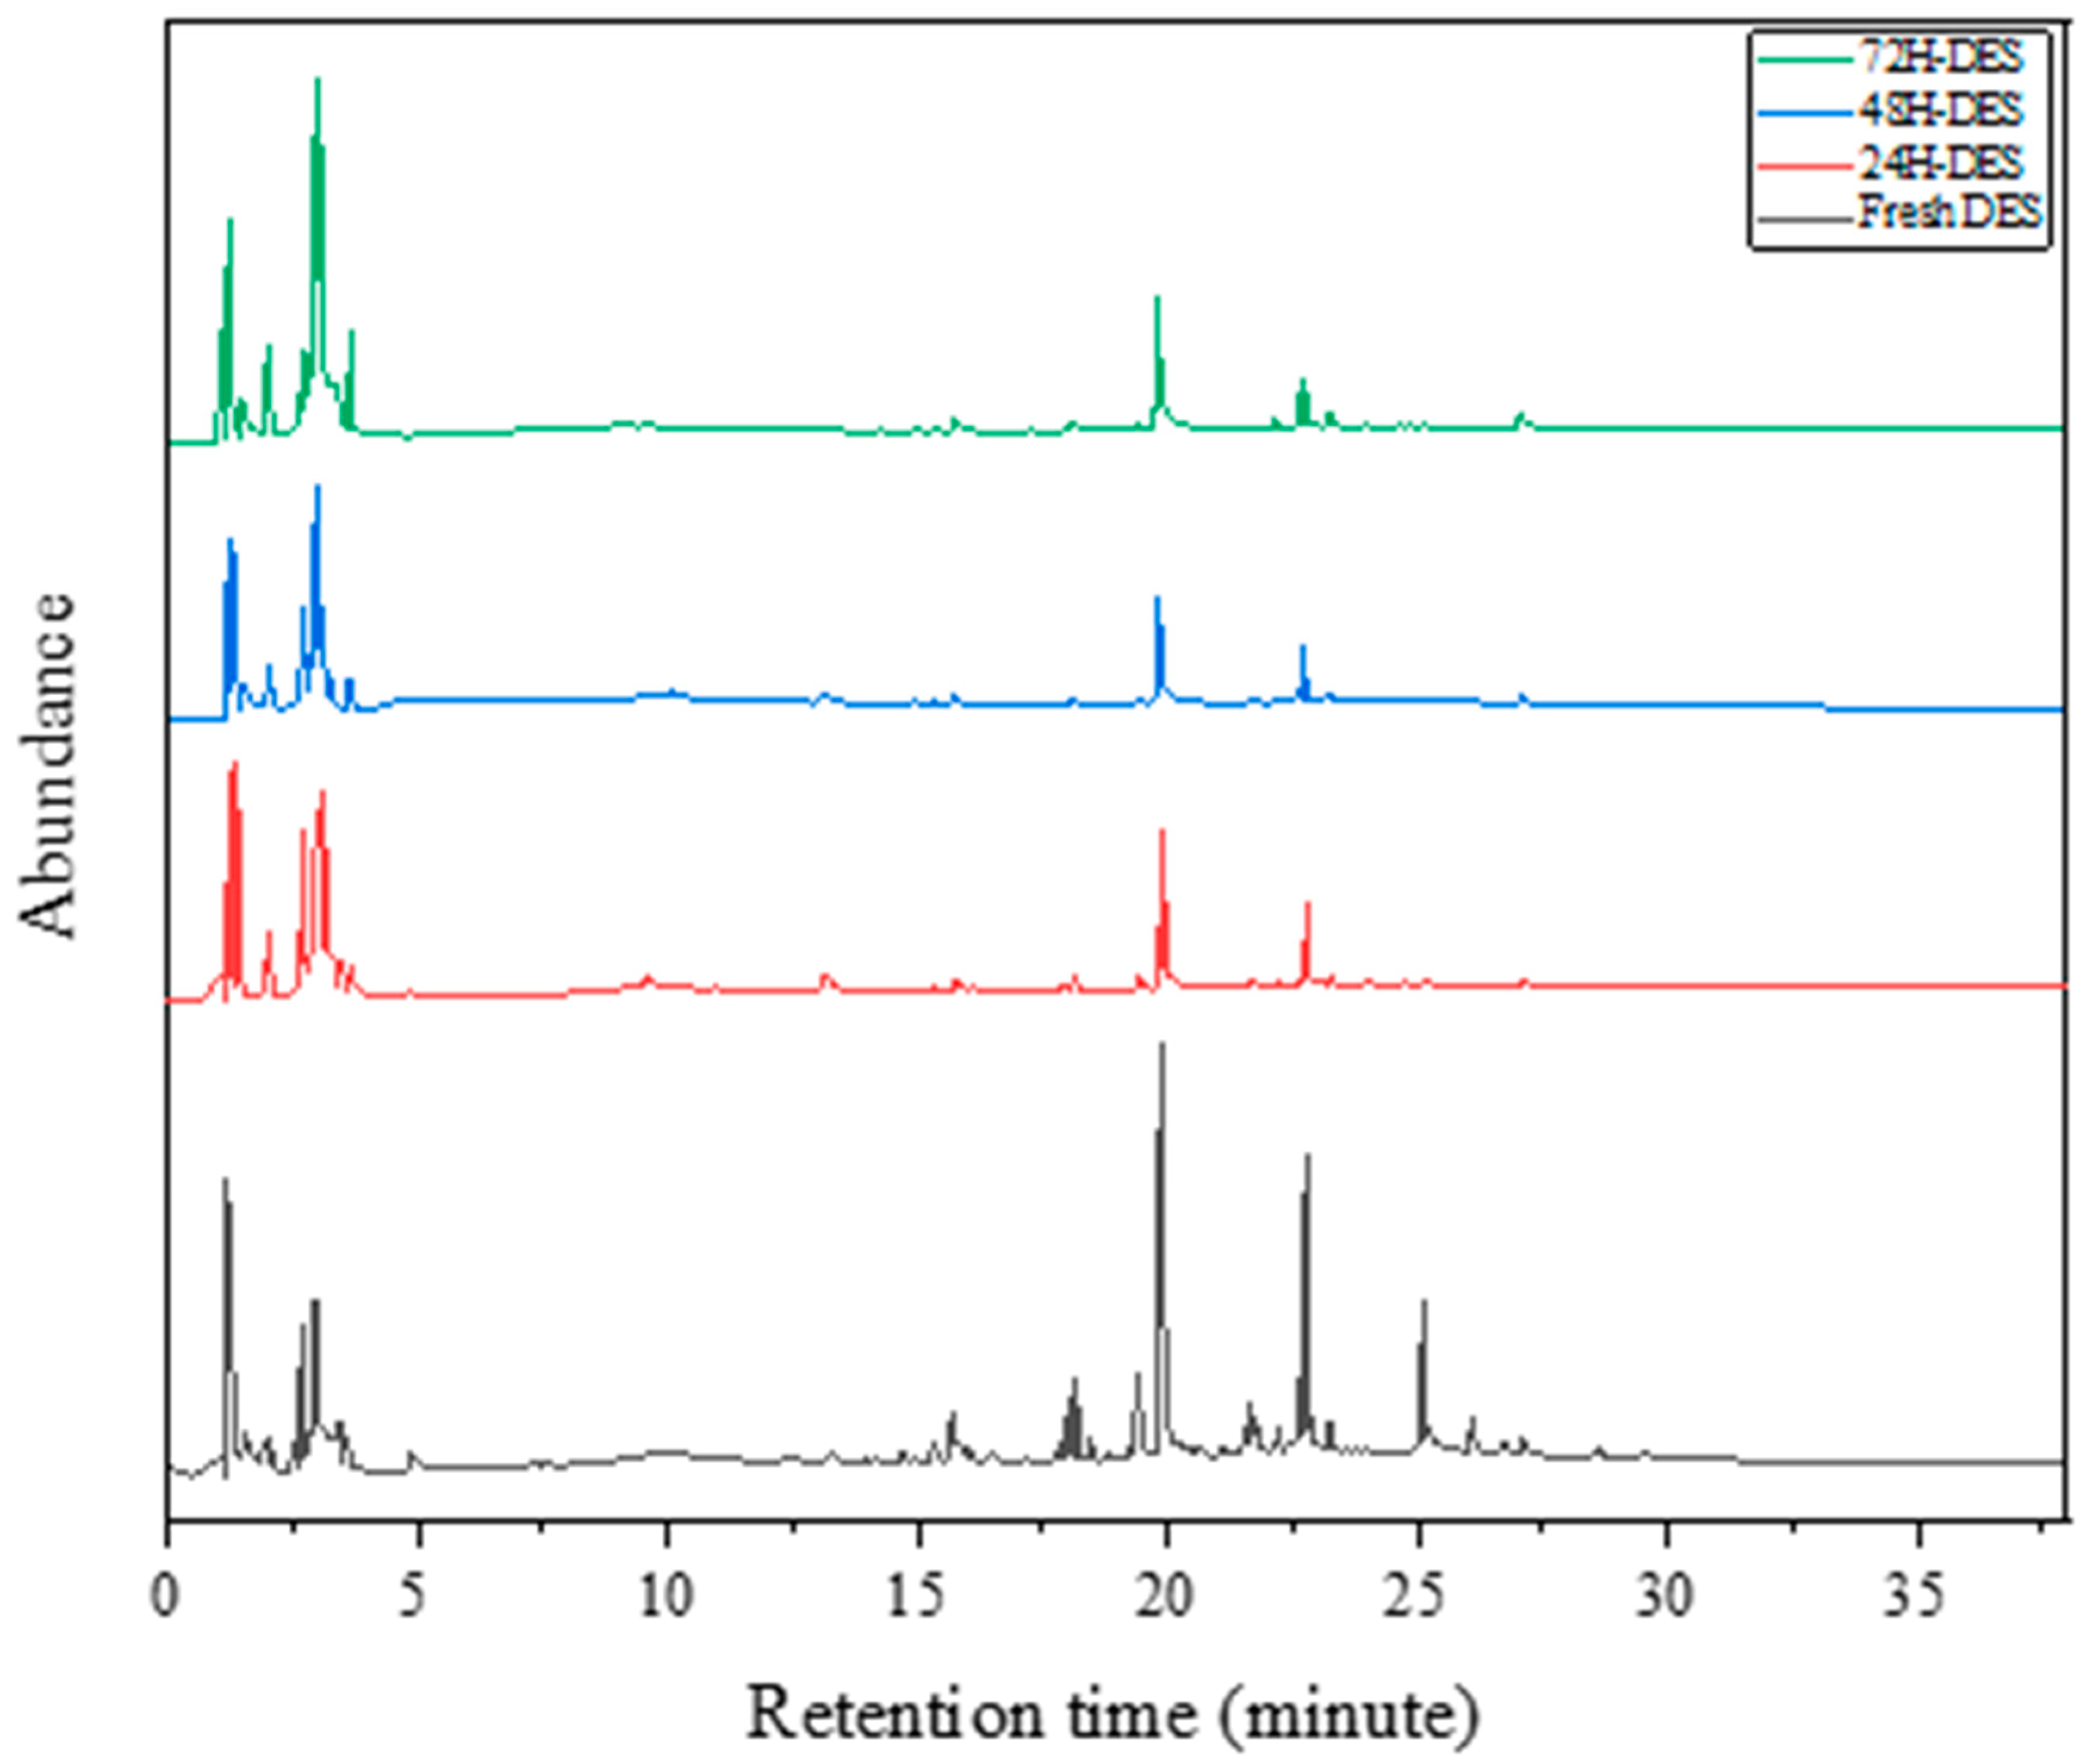
3.5. Results of Gas Chromatography/Mass Spectrometry Analysis

As seen in Figure 7, to better understand the esterification reaction and analyze the compositional changes resulting from this phenomenon in deep eutectic solvents (C3), gas chromatography/mass spectrometry analysis was performed on fresh solvents and solvents that had been heated at 75 °C for 24, 48, and 72 h. As the deep eutectic solvent is a combination of three different substances, the obtained chromatograms show multiple peaks corresponding to different compounds.
To determine the percentage of the solvent converted to ester compounds, the peaks belonging to compounds with the ester functional group -COO in their structure was identified. The identified compounds in the analysis of interest are listed in Table 6 for the four mentioned samples. The ester compounds were identified and marked with α in the Ester column (Table S1). To calculate the percentage of conversion to ester in each sample, the area under each peak belonging to ester compounds was determined, the total areas under the peaks were calculated, and ultimately the total percentage of ester areas was calculated.
As shown in Table 6, a significant percentage of the solvent is converted to ester compounds, which increases with the heating time. Considering that ester compounds may interfere with the desired efficiency in applications such as extraction, precautions should be taken to prevent or at least reduce the rate of the esterification reaction.
In the fresh DES, the relative abundance of the C3 solvent with the chemical composition of choline chloride–ethylene glycol–oxalic acid was relatively high, as the components were present in their original quantities. However, upon heating at 75 °C for 24, 48, and 72 h, the relative abundance of the deep eutectic solvent changed. When the solvent was heated at 75 °C, the C3 components underwent different chemical reactions, leading to changes in their relative abundance. For example, oxalic acid was degraded to other by-products and its relative abundance in the mixture was probably reduced. This phenomenon could potentially impact the properties and effectiveness of the deep eutectic solvent. After 24 h of heating at 75 °C, the relative abundance of the deep eutectic solvent started to decrease with the reaction of the components and its transformation. By 48 h, the relative abundance continued to decrease, which could be caused by more chemical reactions and more components being degraded. The increase in the relative abundance noted in the GC-MS analysis after 72 h of heating in a deep eutectic solvent with choline chloride–ethylene glycol–oxalic acid, as opposed to heating for 24 and 48 h, could be attributed to several factors. A key factor may be the extended heating time, which likely resulted in a combination of factors contributing to the elevated relative abundance observed in the GC-MS analysis findings.

4. Conclusions

In summary, this study focused on optimizing the extraction of copper from chalcopyrite concentrate using ChCl-based deep eutectic solvents. The response surface methodology (RSM) was employed to design experiments and analyze the effects of the working temperature and contact time on the copper recovery efficiency. The results showed that the ChCl-EG-Ox solvent at 80 °C and 48 h of contact time yielded a 76% copper recovery efficiency. Kinetic studies revealed that the reaction rate was enhanced by increased temperatures, facilitating faster dissolution kinetics. The analysis of the mineralogical changes in the chalcopyrite concentrate after dissolution, as well as the effects of adding water and heating on deep eutectic solvents, provided valuable insights into the solvometallurgical properties of these solvents for copper extraction. Additionally, the identification of esterification reactions in the deep eutectic solvent through spectroscopy and mass spectrometry highlighted the importance of understanding the solvent’s chemical behavior. Thereupon, the findings suggest that ChCl-based deep eutectic solvents have great potential for sustainable and efficient copper extraction processes in the metallurgical industry, paving the way for greener and more effective methods in mineral processing.

Supplementary Materials

The following supporting information can be downloaded at: https://www.mdpi.com/article/10.3390/mining5010008/s1, Table S1: The functional groups and ester compounds identified in the developed deep eutectic solvents for fresh-, 24 h-, 48 h-, 72 h-DESs.

Author Contributions

S.M.G.: Conceptualization, Investigation, Data curation, Formal analysis, and Writing—original draft. A.B.: Conceptualization, Project administration, Funding acquisition, Resources, Supervision, and Writing—review and editing. G.B.D.: Project administration, Funding acquisition, Resources, Advisory, and Writing—review and editing. H.S.: Project administration, Funding acquisition, Resources, Advisory, and Writing—review and editing. R.B.: Conceptualization, Data analysis, Advisory, and Writing—review and editing. All authors have read and agreed to the published version of the manuscript.

Funding

This research received no external funding.

Data Availability Statement

Data will be made available on request.

Conflicts of Interest

The authors declare that they have no known competing financial interests or personal relationships that could have appeared to influence the work reported in this paper.

References

  1. Jamwal, A.; Mittal, P.; Agrawal, R.; Gupta, S.; Kumar, D.; Sadasivuni, K.K.; Gupta, P. Towards Sustainable Copper Matrix Composites: Manufacturing Routes with Structural, Mechanical, Electrical and Corrosion Behaviour. J. Compos. Mater. 2020, 54, 2635–2649. [Google Scholar] [CrossRef]
  2. Chen, T.F.; Siow, K.S. Comparing the Mechanical and Thermal-Electrical Properties of Sintered Copper (Cu) and Sintered Silver (Ag) Joints. J. Alloys Compd. 2021, 866, 158783. [Google Scholar] [CrossRef]
  3. Mokmeli, M. Pre Feasibility Study in Hydrometallurgical Treatment of Low-Grade Chalcopyrite Ores from Sarcheshmeh Copper Mine. Hydrometallurgy 2020, 191, 105215. [Google Scholar] [CrossRef]
  4. Jena, S.S.; Tripathy, S.K.; Mandre, N.R.; Venugopal, R.; Farrokhpay, S. Sustainable Use of Copper Resources: Beneficiation of Low-Grade Copper Ores. Minerals 2022, 12, 545. [Google Scholar] [CrossRef]
  5. Gantait, A.; Debnath, S.; Anand, A.; Jakhar, S. Fluid Evolution, Metal Source, and Ore Genesis of Sulfide Mineralization, Nim Ka Thana Copper Belt, Rajasthan, India: Evidence from Mineral Chemistry, Fluid Inclusions and Sulfur Isotope Geochemistry. Arab. J. Geosci. 2023, 16, 167. [Google Scholar] [CrossRef]
  6. Amuthenu, V.L. Assessment of Copper Recovery from Leaching of Microwave Pre-Treated Tailing from the Otjihase Mine. Master’s Thesis, University of Namibia, Windhoek, Namibia, 2020. [Google Scholar]
  7. Barlow, B. Leaching Kinetics of Carbonatite and Silicate Based Chalcopyrite Minerals. Master’s Thesis, North-West University, Potchefstroom, South Africa, 2020. [Google Scholar]
  8. Liu, Y.; Zhao, S.X.; Wang, G.R.; Yang, H.Y. Copper leaching from complex chalcopyrite-rich ores: Utilizing mechanical activation and wastewater-based sulfuric acid system. Sep. Purif. Technol. 2024, 354, 128631. [Google Scholar] [CrossRef]
  9. Binnemans, K.; Jones, P.T. Ionic Liquids and Deep-Eutectic Solvents in Extractive Metallurgy: Mismatch between Academic Research and Industrial Applicability. J. Sustain. Metall. 2023, 9, 423–438. [Google Scholar] [CrossRef]
  10. Yuan, Z.; Liu, H.; Yong, W.F.; She, Q.; Esteban, J. Status and Advances of Deep Eutectic Solvents for Metal Separation and Recovery. Green Chem. 2022, 24, 1895–1929. [Google Scholar] [CrossRef]
  11. Tian, G.; Liu, H. Review on the Mineral Processing in Ionic Liquids and Deep Eutectic Solvents. Miner. Process. Extr. Metall. Rev. 2024, 45, 130–153. [Google Scholar] [CrossRef]
  12. Huntington, V.E.; Coulon, F.; Wagland, S.T. Innovative Resource Recovery from Industrial Sites: A Critical Review. Sustainability 2022, 15, 489. [Google Scholar] [CrossRef]
  13. Bilal, M.; Park, I.; Hornn, V.; Ito, M.; Hassan, F.U.; Jeon, S.; Hiroyoshi, N. The Challenges and Prospects of Recovering Fine Copper Sulfides from Tailings Using Different Flotation Techniques: A Review. Minerals 2022, 12, 586. [Google Scholar] [CrossRef]
  14. Mohanraj, G.T.; Rahman, M.R.; Arya, S.B.; Barman, R.; Krishnendu, P.; Meena, S.S. Characterization Study and Recovery of Copper from Low Grade Copper Ore through Hydrometallurgical Route. Adv. Powder Technol. 2022, 33, 103382. [Google Scholar] [CrossRef]
  15. Nagar, N.; Garg, H.; Dhaka, M.; Gahan, C.S. Bioleaching of Zinc Sulfide Concentrate in Redox-Controlled Fed-Batch Process Compared to Redox Non-Controlled Batch Process. J. Sustain. Metall. 2022, 8, 333–342. [Google Scholar] [CrossRef]
  16. Röbbert, Y. Mobilization and Isotope Fractionation of Uranium, Copper and Iron in the Environment-Implications for (Bio) Remediation of Contaminated Sites and Mine Tailings; Institutionelles Repositorium der Leibniz Universität Hannover: Hannover, German, 2021. [Google Scholar]
  17. Fan, Y.; Kong, Y.; Jiang, P.; Zhang, G.; Cong, J.; Shi, X.; Liu, Y.; Zhang, P.; Zhang, R.; Huang, Y. Development and Challenges of Deep Eutectic Solvents for Cathode Recycling of End-of-Life Lithium-Ion Batteries. Chem. Eng. J. 2023, 463, 142278. [Google Scholar] [CrossRef]
  18. Inman, G.; Nlebedim, I.C.; Prodius, D. Application of Ionic Liquids for the Recycling and Recovery of Technologically Critical and Valuable Metals. Energies 2022, 15, 628. [Google Scholar] [CrossRef]
  19. Van den Bossche, A. Recovery of Valuable Metals from Urban Waste via Oxidative Dissolution in Polyhalide Ionic Liquids. 2020. Available online: https://kuleuven.limo.libis.be/discovery/fulldisplay?docid=alma9994273436701488&context=L&vid=32KUL_KUL:KULeuven&lang=en&search_scope=All_Content&adaptor=Local%20Search%20Engine&tab=all_content_tab&query=sub,exact,%20Ionic%20Liquids,AND&mode=advanced&offset=0 (accessed on 1 December 2024).
  20. Stando, G.; Hannula, P.-M.; Kumanek, B.; Lundström, M.; Janas, D. Copper Recovery from Industrial Wastewater-Synergistic Electrodeposition onto Nanocarbon Materials. Water Resour. Ind. 2021, 26, 100156. [Google Scholar] [CrossRef]
  21. Estay, H.; Barros, L.; Troncoso, E. Metal Sulfide Precipitation: Recent Breakthroughs and Future Outlooks. Minerals 2021, 11, 1385. [Google Scholar] [CrossRef]
  22. Kalinina, E.; Pikalova, E. Opportunities, Challenges and Prospects for Electrodeposition of Thin-Film Functional Layers in Solid Oxide Fuel Cell Technology. Materials 2021, 14, 5584. [Google Scholar] [CrossRef]
  23. Prabhune, A.; Dey, R. Green and Sustainable Solvents of the Future: Deep Eutectic Solvents. J. Mol. Liq. 2023, 379, 121676. [Google Scholar] [CrossRef]
  24. Zante, G.; Boltoeva, M. Review on Hydrometallurgical Recovery of Metals with Deep Eutectic Solvents. Sustain. Chem. 2020, 1, 238–255. [Google Scholar] [CrossRef]
  25. Moradi, M.; Karimi, S.; Behnajady, B. The Effect of the Third Component on the Dissolution of Chalcopyrite in Deep Eutectic Solvents Based on Choline Chloride, and P-Toluenesulfonic Acid. In Proceedings of the 3rd International Conference & 7th National Conference on Materials, Metallurgy, Mining, Ahvaz, Iran, 7 February 2024. [Google Scholar]
  26. Behmadi, R.; Mirzaei, M.; Afshar, M.R.; Najafi, H. Investigation of Chalcopyrite Removal from Low-Grade Molybdenite Using Response Surface Methodology and Its Effect on Molybdenum Trioxide Morphology by Roasting. RSC Adv. 2023, 13, 14899–14913. [Google Scholar] [CrossRef]
  27. Teimouri, S.; Potgieter, J.H.; Billing, C.; Conradie, J. The Feasibility of Pyrite Dissolution in the Deep Eutectic Solvent Ethaline: Experimental and Theoretical Study. J. Mol. Liq. 2023, 392, 123468. [Google Scholar] [CrossRef]
  28. Nakhjiri, A.T.; Sanaeepur, H.; Amooghin, A.E.; Shirazi, M.M.A. Recovery of Precious Metals from Industrial Wastewater Towards Resource Recovery and Environmental Sustainability: A Critical Review. Desalination 2022, 527, 115510. [Google Scholar] [CrossRef]
  29. Hansen, B.B.; Spittle, S.; Chen, B.; Poe, D.; Zhang, Y.; Klein, J.M.; Horton, A.; Adhikari, L.; Zelovich, T.; Doherty, B.W. Deep Eutectic Solvents: A Review of Fundamentals and Applications. Chem. Rev. 2020, 121, 1232–1285. [Google Scholar] [CrossRef]
  30. Carlesi, C.; Harris, R.C.; Abbott, A.P.; Jenkin, G.R.T. Chemical Dissolution of Chalcopyrite Concentrate in Choline Chloride Ethylene Glycol Deep Eutectic Solvent. Minerals 2022, 12, 65. [Google Scholar] [CrossRef]
  31. Valverde, P.E.; Green, T.A.; Roy, S. Effect of Water on the Electrodeposition of Copper from a Deep Eutectic Solvent. J. Appl. Electrochem. 2020, 50, 699–712. [Google Scholar] [CrossRef]
  32. Aragón-Tobar, C.F.; Endara, D.; de la Torre, E. Dissolution of Metals (Cu, Fe, Pb, and Zn) from Different Metal-Bearing Species (Sulfides, Oxides, and Sulfates) Using Three Deep Eutectic Solvents Based on Choline Chloride. Molecules 2024, 29, 290. [Google Scholar] [CrossRef] [PubMed]
  33. Wang, L.; Song, S.; Gao, H.; Wang, L.; Yang, S.; Liu, C. The Optimization and Characterization of the Recycling Utilization of Raffinate in the Copper Leaching Process. J. Mater. Res. Technol. 2020, 9, 2214–2222. [Google Scholar] [CrossRef]
  34. Freitas, D.S.; Cavaco-Paulo, A.; Silva, C. Enhancing Insights into the Phenomena of Deep Eutectic Solvents. Sustain. Mater. Technol. 2024, 41, e01039. [Google Scholar] [CrossRef]
  35. Mannu, A.; Blangetti, M.; Baldino, S.; Prandi, C. Promising Technological and Industrial Applications of Deep Eutectic Systems. Materials 2021, 14, 2494. [Google Scholar] [CrossRef] [PubMed]
  36. Lamidi, S.; Olaleye, N.; Bankole, Y.; Obalola, A.; Aribike, E.; Adigun, I. Applications of Response Surface Methodology (Rsm) in Product Design, Development, and Process Optimization; IntechOpen: Rijeka, Croatia, 2022. [Google Scholar]
  37. Behmadi, R.; Mokhtarian, M.; Davoodi, A.; Hosseinpour, S. Desulfurization of Natural Gas Condensate Using Polyethylene Glycol and Water Intercalated Activated Γ-Bauxite. J. Clean. Prod. 2022, 376, 134230. [Google Scholar] [CrossRef]
  38. Maalihan, R.D. Modelling the Toughness of Nanostructured Polyhedral Oligomeric Silsesquioxane Composites Fabricated by Stereolithography 3D Printing: A Response Surface Methodology and Artificial Neural Network Approach. In Materials Science Forum; Trans Tech Publications Ltd.: Stafa-Zurich, Switzerland, 2022. [Google Scholar]
  39. Kumari, B.; Tiwary, R.K.; Yadav, M. Non Linear Regression Analysis and Rsm Modeling for Removal of Cr (Vi) from Aqueous Solution Using Pani@ Wh Composites. Mater. Chem. Phys. 2022, 290, 126457. [Google Scholar] [CrossRef]
  40. Ghodrati, S.; Nakhaei, F.; VandGhorbany, O.; Hekmati, M. Modeling and Optimization of Chemical Reagents to Improve Copper Flotation Performance Using Response Surface Methodology. Energy Sources Part A Recovery Util. Environ. Eff. 2020, 42, 1633–1648. [Google Scholar] [CrossRef]
  41. Chen, W.-H.; Uribe, M.C.; Kwon, E.E.; Lin, K.-Y.A.; Park, Y.-K.; Ding, L.; Saw, L.H. A Comprehensive Review of Thermoelectric Generation Optimization by Statistical Approach: Taguchi Method, Analysis of Variance (Anova), and Response Surface Methodology (Rsm). Renew. Sustain. Energy Rev. 2022, 169, 112917. [Google Scholar] [CrossRef]
  42. Di Leo, G.; Sardanelli, F. Statistical Significance: P Value, 0.05 Threshold, and Applications to Radiomics—Reasons for a Conservative Approach. Eur. Radiol. Exp. 2020, 4, 18. [Google Scholar] [CrossRef]
  43. Toledo, R.; Guilherme, A.; Tayar, S.P.; Arena, F.A.; Benedetti, A.V.; Bevilaqua, D. New Insights into Oxidative-Reductive Leaching of Chalcopyrite Concentrate Using a Central Composite Factorial Design. Miner. Eng. 2022, 180, 107467. [Google Scholar] [CrossRef]
  44. Maneejuk, P.; Yamaka, W. Significance Test for Linear Regression: How to Test without P-Values? J. Appl. Stat. 2021, 48, 827–845. [Google Scholar] [CrossRef] [PubMed]
  45. Vidhya, R.; Balakrishnan, T.; Kumar, B.S. Experimental and Theoretical Investigation of Heat Transfer Characteristics of Cylindrical Heat Pipe Using Al2O3–SiO2/W-EG Hybrid Nanofluids by Rsm Modeling Approach. J. Eng. Appl. Sci. 2021, 68, 32. [Google Scholar] [CrossRef]
  46. Wu, N.; Liu, X.; Zeng, M.; Lu, X.; Zeng, Z.; Zheng, Y. Controllable Synthesis of Novel Luminescent CuFeS2 Quantum Dots with Magnetic Properties and Cation Sensing Features. J. Nanoparticle Res. 2019, 21, 268. [Google Scholar] [CrossRef]
  47. Lee, S.; Lee, G.; Lee, H.-S.; Kim, D.; Kang, Y. Characterization of Mocvd-Prepared Cis Solar Cells. Energies 2021, 14, 7721. [Google Scholar] [CrossRef]
  48. Nguyen, K.; Borja, D.; You, J.; Hong, G.; Jung, H.; Kim, H. Chalcopyrite Bioleaching Using Adapted Mesophilic Microorganisms: Effects of Temperature, Pulp Density, and Initial Ferrous Concentrations. Mater. Trans. 2018, 59, 1860–1866. [Google Scholar] [CrossRef]
  49. Sun, H.; Peng, T.; Liu, B.; Xian, H. Effects of Montmorillonite on Phase Transition and Size of TiO2 Nanoparticles in TiO2/Montmorillonite Nanocomposites. Appl. Clay Sci. 2015, 114, 440–446. [Google Scholar] [CrossRef]
  50. Miao, J.; Leng, H.; Han, B. Leaching and Kinetic Study of Chalcopyrite without Acid in an O2–H2O System. J. Sustain. Metall. 2023, 9, 1279–1288. [Google Scholar] [CrossRef]
  51. Nadimi, H.; Sarpoolaky, H.; Soltanieh, M. Formation Reaction Kinetics of Nanocrystalline TiC via Molten LiCl–KCl Applying Shrinking Core Model. Ceram. Int. 2021, 47, 12859–12869. [Google Scholar] [CrossRef]
  52. Chen, H.; He, J.; Zhu, L.; Liu, B.; Zhou, K.; Xu, J.; Guo, C. Eco-Friendly Oxidation Leaching from Chalcopyrite Powder and Kinetics Assisted by Sodium Chloride in Organic Acid Media. Adv. Powder Technol. 2022, 33, 103547. [Google Scholar] [CrossRef]
  53. Yu, S.; Liao, R.; Yang, B.; Fang, C.; Wang, Z.; Liu, Y.; Wu, B.; Wang, J.; Qiu, G. Chalcocite (Bio)Hydrometallurgy—Current State, Mechanism, and Future Directions: A Review. Chin. J. Chem. Eng. 2022, 41, 109–120. [Google Scholar] [CrossRef]
  54. Sun, W.; Wei, X.; Zhang, X.; Li, W.; Ma, L. Dynamic Change Model of Shrinkage Liquid Membrane of Multi-Particle Cellulose in Organic-Aqueous-Solid Multiphase System. Biomass Convers. Biorefinery 2024, 14, 22479–22504. [Google Scholar] [CrossRef]
  55. Wei, L.; Pu, X.; Cheng, D.; Wang, Y. Measurement of the Concentration- and Temperature-Dependent Diffusion Coefficient and Activation Energy Via Diffusion Image Analysis. AIP Adv. 2022, 12, 105013. [Google Scholar] [CrossRef]
  56. Arnaut, L. Chapter 9—Elementary Reactions in Solution. In Chemical Kinetics, 2nd ed.; Arnaut, L., Ed.; Elsevier: Amsterdam, The Netherlands, 2021; pp. 263–293. [Google Scholar]
  57. Grebenkov, D.S. Diffusion-Controlled Reactions: An Overview. Molecules 2023, 28, 7570. [Google Scholar] [CrossRef]
  58. Gaweł, B.A.; Ulvensøen, A.; Łukaszuk, K.; Arstad, B.; Muggerud, A.M.F.; Erbe, A. Structural Evolution of Water and Hydroxyl Groups During Thermal, Mechanical and Chemical Treatment of High Purity Natural Quartz. RSC Adv. 2020, 10, 29018–29030. [Google Scholar] [CrossRef] [PubMed]
  59. Guo, A.; Ren, Z.; Tian, L.; Wang, Z.; Li, K. Characterization of Molecular Change of Heavy Oil under Mild Thermal Processing Using FT-IR Spectroscopy. J. Fuel Chem. Technol. 2007, 35, 168–175. [Google Scholar] [CrossRef]
  60. Ferrari, A.C.; Rodil, S.E.; Robertson, J. Interpretation of Infrared and Raman Spectra of Amorphous Carbon Nitrides. Phys. Rev. B 2003, 67, 155306. [Google Scholar] [CrossRef]
  61. Shurvell, H.F. Spectra–Structure Correlations in the Mid-and Far-Infrared. In Handbook of Vibrational Spectroscopy; John Wiley & Sons, Ltd.: Hoboken, NJ, USA, 2006. [Google Scholar]
  62. Khan, Z.; Javed, F.; Shamair, Z.; Hafeez, A.; Fazal, T.; Aslam, A.; Zimmerman, W.B.; Rehman, F. Current Developments in Esterification Reaction: A Review on Process and Parameters. J. Ind. Eng. Chem. 2021, 103, 80–101. [Google Scholar] [CrossRef]
  63. González-Rivera, J.; Husanu, E.; Mero, A.; Ferrari, C.; Duce, C.; Tine, M.R.; D’Andrea, F.; Pomelli, C.S.; Guazzelli, L. Insights into Microwave Heating Response and Thermal Decomposition Behavior of Deep Eutectic Solvents. J. Mol. Liq. 2020, 300, 112357. [Google Scholar] [CrossRef]
  64. Kaur, S.; Gupta, A.; Kashyap, H.K. How Hydration Affects the Microscopic Structural Morphology in a Deep Eutectic Solvent. J. Phys. Chem. B 2020, 124, 2230–2237. [Google Scholar] [CrossRef]
  65. Chabib, C.M.; Ali, J.K.; Jaoude, M.A.; Alhseinat, E.; Adeyemi, I.A.; Al Nashef, I.M. Application of Deep Eutectic Solvents in Water Treatment Processes: A Review. J. Water Process Eng. 2022, 47, 102663. [Google Scholar] [CrossRef]
  66. Khan, A.S.; Ibrahim, T.H.; Jabbar, N.A.; Khamis, M.I.; Nancarrow, P.; Mjalli, F.S. Ionic Liquids and Deep Eutectic Solvents for the Recovery of Phenolic Compounds: Effect of Ionic Liquids Structure and Process Parameters. RSC Adv. 2021, 11, 12398–12422. [Google Scholar] [CrossRef] [PubMed]
  67. Rain, M.I.; Iqbal, H.; Saha, M.; Ali, M.A.; Chohan, H.K.; Rahman, M.S.; Halim, M.A. A Comprehensive Computational and Principal Component Analysis on Various Choline Chloride-Based Deep Eutectic Solvents to Reveal Their Structural and Spectroscopic Properties. J. Chem. Phys. 2021, 155, 044308. [Google Scholar] [CrossRef]
  68. Jurić, T.; Uka, D.; Holló, B.B.; Jović, B.; Kordić, B.; Popović, B.M. Comprehensive Physicochemical Evaluation of Choline Chloride-Based Natural Deep Eutectic Solvents. J. Mol. Liq. 2021, 343, 116968. [Google Scholar] [CrossRef]
Figure 1. The effect of the studied parameters on the copper recovery efficiency: ((a) I, II, III) Predicted versus actual efficiency data for the dissolution of the chalcopyrite concentrate. Perturbation curves for assessing the main factors on the efficiency of copper recovery; ((b) I, II, III) Working temperature and contact time.
Mining 05 00008 g001
Figure 2. The X-ray diffraction graph of (a) the initial chalcopyrite concentrate and (b) its leaching by the deep eutectic solvent of C3 for 48 h.
Mining 05 00008 g002
Figure 3. The plots of the relationship kinetics related to the reactions under (A2-I,B2-I,C2-I) diffusion control over the experimental data. (A2-II,B2-II,C2-II) Arrhenius functions used to calculate the activation energy based on the reaction under diffusion control for the synthesized DESs.
Mining 05 00008 g003
Figure 4. FTIR spectra of the components of the ChCl-EG-Ox solvent (C3).
Mining 05 00008 g004
Figure 5. The effect of heating on the FTIR spectra of the ChCl-EG-Ox solvent (C3).
Mining 05 00008 g005
Figure 6. The effect of water on the esterification reaction and its impact on the FTIR spectra.
Mining 05 00008 g006
Figure 7. Results of the gas chromatography/mass spectrometry analysis on the esterification phenomenon of the C3 solvent.
Mining 05 00008 g007
Table 1. Designation and chemical composition of the synthesized solvents.
NumberDesignationCompositionMolar Ratio
1A2ChCl:EG1:2
2B2ChCl:Ox1:1
3C3ChCl:EG:Ox1:1:2
Table 2. The independent variables, along with their coded and actual levels, for the used the CCD.
VariablesLevels
Low ActualHigh ActualLow CodedHigh CodedMean
Temperature (A)50 °C80 °C−1165 °C
Time (B)24 h72 h−1148 h
Table 3. Experimental design via Design Expert software based on Central Composite Design (CCD) technique with copper recovery values (ICP-OES) for ChCl-EG, ChCl-Ox, and ChCl-EG-Ox.
RunFactor 1Factor 2Response
A: Temperature (°C)B: Time (h)Efficiency of Cu Recovery (%)
A2: Choline Chloride–Ethylene Glycol
165244
2507213
3654813
4807217
5657216
6654812
750242
8654811
980247
10504810
11804816
B2: Choline Chloride–Oxalic Acid
1652437
2507253
3654861
4807283
5657268
6654862
7502419
8654860
9802448
10504848
11804874
C3: Choline Chloride–Ethylene Glycol–Oxalic Acid
1652433
2507257
3654862
4807252
5657268
6654861
7502422
8654863
9802437
10504851
11804876
Table 4. Obtained results of ANOVA for the dissolution of copper from chalcopyrite concentrate by A2, B2, C3.
A2: Choline Chloride–Ethylene Glycol
SourceSum of SquaresdfMean SquareF-valuep-value
Model266.41553.28124.73<0.0001significant
A—temp.46.16146.16108.060.0001
B—time204.171204.17477.930.0001
AB2.3212.325.430.0672
A21.9111.914.470.0881
B22.3212.325.430.0672
Residual2.1450.4272
Std. Dev. = 0.6536; R2 = 0.9920; Mean = 11.36; Adjusted R2 = 0.9841; C.V. % = 5.75; Predicted R2 = 0.9821; Adequate Precision = 35.6990
B2: Choline Chloride–Oxalic Acid
SourceSum of SquaresdfMean SquareF-valuep-value
Model3127.905625.58254.70<0.0001significant
A—temp.1194.8211194.82486.46<0.0001
B—time1666.6711666.67678.57<0.0001
AB0.070210.07020.02860.8724
A22.1512.150.87500.3925
B292.33192.3337.590.0017
Residual12.2852.46
Std. Dev. = 1.57; R2 = 0.9961; Mean = 55.73; Adjusted R2 = 0.9922; C.V. % = 2.81; Predicted R2 = 0.9631; Adequate Precision = 53.2624
C3: Choline Chloride–Ethylene Glycol–Oxalic Acid
SourceSum of SquaresdfMean SquareF-valuep-value
Model2379.215475.849.230.0146significant
A—temp.223.141223.144.330.0920
B—time1204.1711204.1723.360.0047
AB74.12174.121.440.2842
A235.88135.880.69610.4421
B2483.401483.409.380.0280
Residual257.70551.54
Std. Dev. = 7.18; R2 = 0.9023; Mean = 52.91; Adjusted R2 = 0.8045; C.V. % = 13.57; Predicted R2 = 0.1338; Adequate Precision = 8.7866
Table 5. The effect of adding water on the deep eutectic solvent behavior.
CuFe
Water
(% v/v)
Concentration (ppm)Recovery Rate (%)Concentration (ppm)Recovery Rate (%)
5512782.53458659.85
205287.585.124653.560.73
35210833.93588576.80
50132221.28682089.01
Table 6. The level of esterification in solvents.
SolventEsterification (%)
Fresh—C324.74
24 h—C336.19
48 h—C347.14
72 h—C360.30
Disclaimer/Publisher’s Note: The statements, opinions and data contained in all publications are solely those of the individual author(s) and contributor(s) and not of MDPI and/or the editor(s). MDPI and/or the editor(s) disclaim responsibility for any injury to people or property resulting from any ideas, methods, instructions or products referred to in the content.

