Article

Mitigating Shrinkage and Enhancing the Structure of Thermally Insulating Starch Aerogel via Solvent Exchange and Chitin Addition

by
Jacob Staker
1,
Gracie M. White
2,3,
Sevinch Pasilova
4,
Daniel A. Scheiman
5,
Haiquan Guo
5,
Andres Tovar
3,4,* and
Amanda P. Siegel
6,7,*
1
Department of Chemistry, Purdue University, West Lafayette, IN 47907, USA
2
Luddy School of Informatics, Computing, and Engineering, Indiana University Indianapolis, Indianapolis, IN 46202, USA
3
Integrated Nanosystems Development Institute (INDI), Indiana University Indianapolis, Indianapolis, IN 46202, USA
4
School of Mechanical Engineering, Purdue University, West Lafayette, IN 47907, USA
5
Universities Space Research Association, Cleveland, OH 44135, USA
6
Department of Chemistry and Chemical Biology, Indiana University Indianapolis, Indianapolis, IN 46202, USA
7
Department of Biomedical Engineering, University of Illinois Chicago, Chicago, IL 60612, USA
*
Authors to whom correspondence should be addressed.
Macromol 2025, 5(2), 28; https://doi.org/10.3390/macromol5020028
Submission received: 23 March 2025 / Revised: 13 May 2025 / Accepted: 10 June 2025 / Published: 18 June 2025

Abstract

:
Bio-based compostable starch aerogels have significant potential as a sustainable alternative to traditional polymer aerogels across various applications. However, they suffer from very significant shrinkage, shown in published work as 40–50% using existing processes. We hypothesized that the shrinkage is largely caused by pore collapse through the solvent exchange process, during which the water used to fabricate the starch matrix is replaced with ethanol. To mitigate this issue, this work introduces two strategies: (1) implementing a deep-freezing protocol (DFP) prior to the solvent exchange, followed by pure ethanol solvent exchanges instead of water/ethanol mixtures, and (2) incorporating chitin as a structural additive. As a baseline, we fabricated potato starch aerogels (PSAs) using conventional processes of mixing, heating, and retrogradation. By applying a DFP before pure ethanol exchanges, shrinkage was reduced from 44% to 10% in pure PSA samples. Furthermore, the addition of chitin reduced shrinkage to 8% in potato starch-chitin aerogels. Porosity, density, surface area, pore size distribution, thermal decomposition temperature, thermal conductivities, and scanning electron microscopy images demonstrate a correlation between reduced shrinkage and desired thermal material properties.

1. Introduction

Insulation materials for use in vehicles, housing, and aerospace applications have shown considerable advancements since the mid-1900s. This is evident from the invention of spray foam by the military in the 1940s, and then the heightened use of harmful to human (although highly effective) asbestos insulation. The demand for advanced insulating materials became more prevalent after home insulation requirements were instituted in the U.S. in 1965 [1] and toxicology reports were released on asbestos and lose-packed asbestos (thermal conductivity 0.154 W/mK, density 0.520 g/cm3 [2]). According to an American Chemistry Council report in August 2023, the market for insulation materials has grown to over USD 24.9 billion [3], showing an even greater popularity and demand.
New insulation alternatives have emerged, although most are comprised of non-biodegradable compounds. While these materials provide excellent insulation in many applications, they have numerous negative effects when in contact with humans or the environment. They have been found to leech organics and microplastics into surrounding systems [4], including bodies of water and clouds [5], which cause risks and health-related issues to the human body. These systems lack sustainability.
Aerogels have proven great utility as thermal insulation due to their nanoporous structures, high surface areas, and high porosities, which greatly reduce the three kinds of heat transfers: conduction, convection, and radiation. Since they are mostly comprised of air (generally >80–90%), they exhibit extremely low thermal conductivity [6,7]. Among the different kinds of aerogels, biodegradable aerogels have shown promise in sustainable applications, including the development of biomedical sensors [8], drug delivery methods [9,10], and their utilization as an absorbing material for oil spills [11].
Research in starch-based aerogels [12] for biodegradable insulation materials has grown in research popularity [13]. Starch consists of two main biopolymers, amylose and amylopectin, which are made up of glucose monomers bonded together via glycosidic linkages. Distinct differences in their branching nature lead to either a more linear and uniform structure, in the case of amylose [14], or a branched and more crystalline structure, in the case of amylopectin [12,15]. Starch aerogels with different ratios of amylose and amylopectin produce different material properties [16,17,18]. Potato starch, for example, is an excellent candidate for thermal insulation and contains 20% amylose and 80% amylopectin [19]. However, potato starch aerogels (PSAs) made using traditional procedures have led to large shrinkages (20–41% [20,21]) and surface deformations. These features correlate to diminished porosity, pore shape, and thermal conductivity, limiting PSA’s use for certain applications.
To target these issues, we look towards a crucial step in aerogel fabrication processes: the removal of solvent in exchange for a fluid that is miscible with liquid CO2. This is a necessary step to enable supercritical drying (SCD) [22], the most popular method for fabricating aerogel. Optimal solvents for the sol-gel process do not always fit the miscibility requirements for SCD, thus commonly requiring solvent exchange steps [17,23,
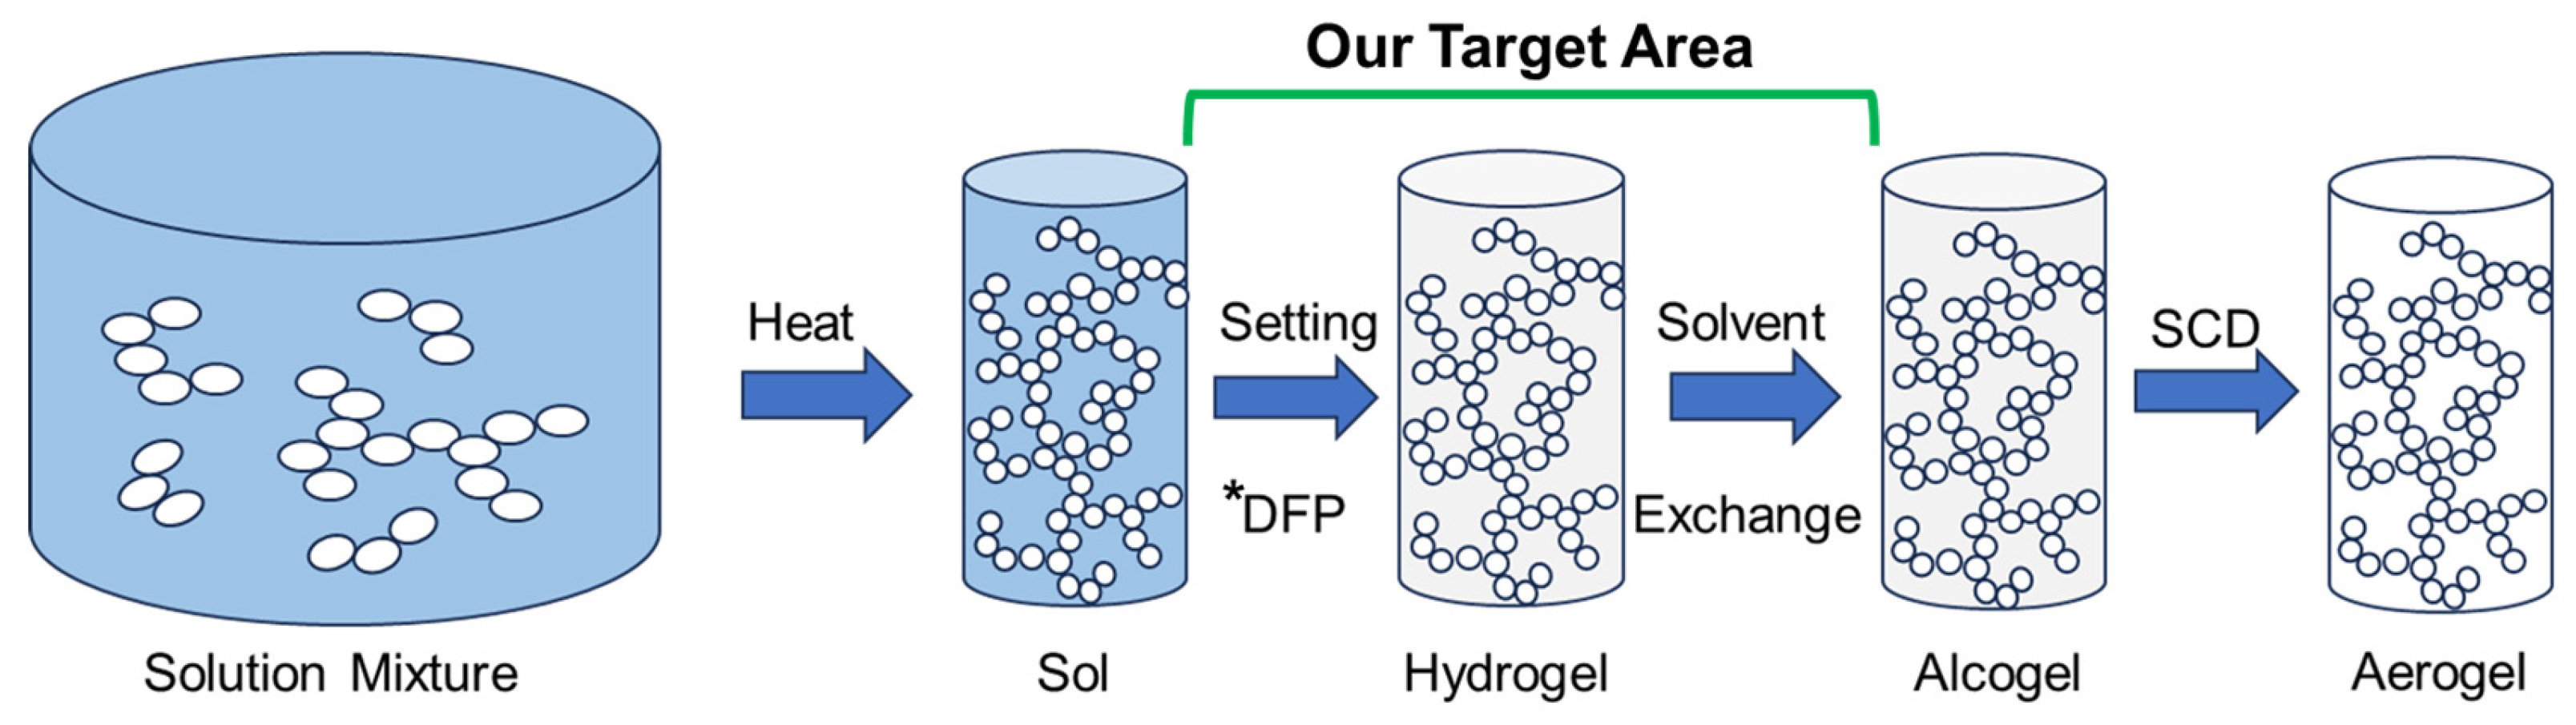
24] (or baths) beforehand. We hypothesized that adding water into these baths (Figure 1) might contribute to large gel shrinkages in the resulting aerogel due to destructive interactions between the capillary forces of solvent (water being exchanged for ethanol) and the polymer’s skeleton. We also hypothesized that if the solvent is frozen in place before the solvent exchange, the ice crystal formation may create expansion internally, which may help mitigate shrinkages. This study explores this hypothesis by comparing previously reported starch-based aerogel solvent exchanges (with the solvent mixtures of 40, 70, 90, then 100% of ethanol in water [8,9,19,20,22]) and comparing them with our proposed method below.
A related but different approach is freeze-drying, also known as lyophilization [21]. The main difference between lyophilization and our deep-freezing protocol (DFP) lies in the solvent removal mechanism. Lyophilization involves freezing the water inside the gel, forming ice crystals within the pore network. During sublimation under vacuum, the ice transitions directly to vapor. However, ice crystal growth and the mechanical stresses associated with sublimation can damage the pore structure, leading to greater shrinkage, surface cracking, and heterogeneous pore sizes. In contrast, DFP allows the water within the gel to be exchanged with ethanol, which is fully miscible with liquid CO2. During the supercritical drying process, the ethanol is then replaced with liquid CO2. This transition reduces capillary forces within the pores, preserving the solid network without inducing significant shrinkage or deformation.
We utilize a full sol-gel process (Figure 1), which starts with an initial mixture of biopolymers, plasticizers (if included), and water. The mixture is heated, allowing the starch to swell and gel [15]. An acid is added, causing portions of the glycosidic bonds to break, increasing chain homogeneity [
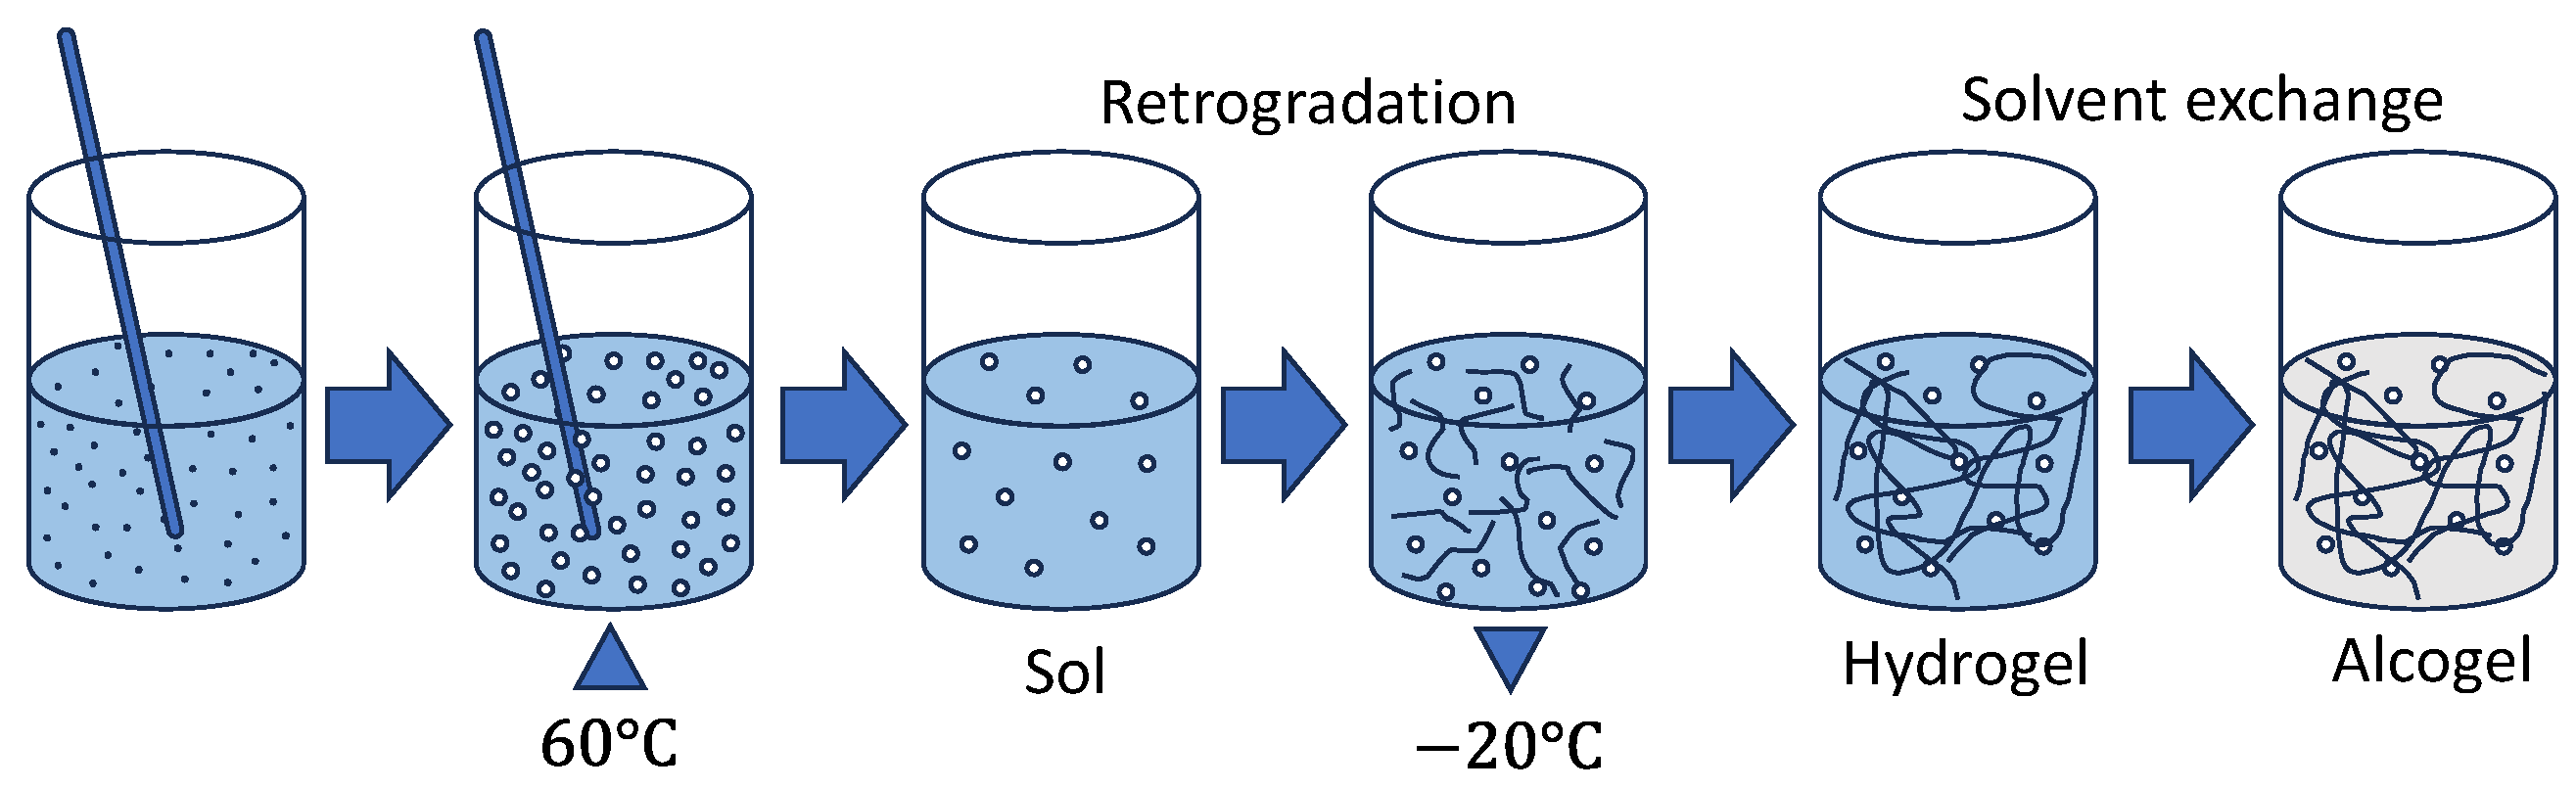
15]. Afterward, the sol is set in a sealed container at room temperature (RT) for 24 h. During this time, the newly formed hydrogel will undergo a process called retrogradation, where the starch molecules rearrange to the most energetically favorable state [21]. Instead of performing additional retrogradation at RT or 4 °C, we tested an alternative deep-freezing protocol (DFP), before performing the solvent exchange, effectively freezing the polymers in place in the hopes it could increase structural robustness. We hypothesized that a DFP of 48 h would be sufficient, as similar results have been shown in the literature to speed up this process for other starch aerogels [20], even though they still suffered from large shrinkages. Subsequently, the gels then undergo solvent exchanges before liquid CO2 supercritical extraction. We hypothesized that increasing the equilibration time and then freezing would help the gel structure be maintained. We further hypothesized that after the DFP, three successive 200-proof ethanol solvent exchange baths would fully remove any water left inside the hydrogel and enable it to undergo SCD.
In addition to the solvent exchange modification described, further efforts to mitigate starch-based aerogel shrinkages and deformations included adding a biopolymer, chitin. Due to its high hydrogen bonding content [25], chitin has been used before as a gel modifier for increased strength [26]. By adding different wt% of chitin to the potato starch we expected that a potato starch/chitin biopolymer blend would help strengthen and lock the starch chains in place during the sol-gel process, also increasing the surface area and thermal stability of the material.
The aerogels were analyzed for their physical properties, including shrinkage, density, and porosity, and other chemical/mechanical properties, such as surface area, microstructure, thermal conductivity, and thermal decomposition temperatures.

2. Materials and Methods

2.1. Materials Used for Aerogel Formulations

The aerogels were created using the following food-based materials: potato starch from Gefen Foods (Bayonne, NJ, USA); distilled white vinegar from Walmart (Bentonville, AR, USA); vegetable glycerol from Florida Laboratories (Fort Lauderdale, FL, USA); chitin from Thermo Fisher Scientific (Waltham, MA, USA); and 200-proof ethanol from Decon Labs (King of Prussia, PA, USA).

2.2. Method for Fabricating Starch and Chitin-Blended Aerogel Samples Including Supercritical Drying

For pure PSA samples (PSA 1.1–1.5), 10 wt% of potato starch was added into 40 mL of deionized (DI) water while stirring. Once stirred, 1.9 mL of white vinegar and 3.0 mL of glycerol were added to the mixture. The solution mixture was heated to 60 °C and stirred at this temperature until a change in color (white to translucent) and an increase in viscosity was observed (Figure 2).
The resulting mixture was poured into cylindrical molds with a diameter of 14.3 mm and covered with parafilm to mitigate solvent loss. Filled molds with sample were set for 24 h at room temperature (RT) and then followed a range of ethanol/DI water washes or DFP processes (Table 1). Hydrogel samples PSA 1.1–1.4 were placed into varying 200-proof ethanol/DI water solution baths for 24 h. PSA 1.5 was kept frozen at −20 °C for 48 h (DFP) and then placed directly into 200-proof ethanol with no DI water. All samples received two more 200-proof ethanol baths. Then, each alcogel sample was dried by supercritical extraction with four soaking and rinse cycles of liquid carbon dioxide (CO2), where supercritical CO2 washes/exchanges at 78 bar and 35 °C were followed by venting. The resulting PSA samples were then tested.
For samples with chitin (C-PSA), the total weight percentage of chitin and potato starch is 10 wt% with 0–7.5 wt% of potato starch replaced by chitin. Chitin is added with potato starch to the DI water prior to adding white vinegar and glycerol. The C-PSA samples were heated for an extra 10 min to ensure a homogeneous mixture was created with the chitin before the next steps. All C-PSA samples underwent the PSA 1.5 solvent exchange bath method (24 h at RT followed by 48 h of deep freeze and 3 × 100% ethanol baths).

2.3. Bulk Density and Shrinkage Determination

The bulk density ρ (g/cm3) of each aerogel sample is determined by the ratio of mass and its volume as follows:
ρ = m v c   ,
where m is the sample mass (g), and v c = π d 2 h / 4 is the volume (cm3), where d and h are the sample’s diameter and length, respectively.
The sample shrinkage S   % is determined by the relative change diameter as follows:
S   % = 100 × d 0 d x d 0   ,
where d 0 is the initial sample diameter and   d x is the sample diameter after each step. Here, the initial sample diameter corresponds to the mold inner diameter, 14.3 mm.

2.4. Gas Pycnometry for Porosity

The aerogel porosity P t   ( % ) corresponds to the ratio of the sample’s bulk density ρ , Equation (1), and its corresponding skeleton density ρ s . This is
P t   % = 100 × 1 ρ ρ s   .
A Micromeritics Accupyc li 1345 (Norcross, GA, USA) helium pycnometer was utilized to measure the skeletal density of the samples. Samples were measured in a 10 cm3 micromeritics cell with cap. Each sample was measured over 50 trials, and the average value of all measurements was used to calculate the porosity of the aerogel samples.

2.5. C13 Nuclear Magnetic Resonance (C13-NMR) Spectroscopy

C13-NMR spectra of the samples were collected using a Bruker solid state NMR Avance 300 spectrometer (Bruker Biospin, Billerica, MA, USA) with cross-polarization and a magic angle spinning at 11 KHz.

2.6. Surface Area Testing via Brunauer, Emmett, and Teller (BET)

Approximately 20 mg samples were degassed at 80 °C overnight and run for nitrogen-adsorption porosimetry using a Micromeritics Tristar 3020 II (Norcross, GA, USA) to determine the BET surface areas, pore size distributions, and absorption/desorption curves of the aerogel samples.

2.7. Scanning Electron Microscopy (SEM)

SEM microscopy for PSA samples was conducted using a JSM-7800F Field Emission Scanning Electron Microscope (JEOL, Ashland, OR, USA) with 5.0 kV at ×100 and ×250 magnification. Samples were cut using a metal blade and held at the desired angle using carbon tape, adhering them to the side of the SEM stage after gold sputtering.
A JEOL IT710 Large Chamber Field Emission Scanning Electron Microscope was used to catch SEM images for C-PSA samples with a 10 nm platinum coating at 10 KV.

2.8. Thermal Conductivity Testing

The C-Therm Trident thermal conductivity instrument (Fredericton, NB, Canada), conforming to ASTM D7984 [27] using a modified transient plane technique, was utilized to determine the thermal conductivities of the aerogels. A 4 mm thick sample was run at room temperature.

2.9. Thermogravimetric Analysis (TGA) Testing

Thermogravimetric analysis (TGA) was performed with the TA Instruments Q500 TGA (New Castle, DE, USA). Heating was performed from RT-800 °C at 10 °C/min under air and nitrogen as specified. Pans were tared beforehand, where ~0.5 g of sample was loaded before each trial. For TGA in N2, before each run, an extra 15-min purging in N2 was added before heating the samples.

3. Results

3.1. Sample Images, Density, Shrinkage, and Porosity Data

Figure 3 shows an optical microscope image of the potato starch (Figure 3a) and the chitin (Figure 3b) used in the synthesis. Potato starch granules show oval, spherical, and irregular outer shapes with granule sizes ranging from 2–50 µm. Chitin chunks and particles show a more fibrous and crystalline nature and can be larger than potato starch. Figure 3c–g shows photos of the resulting potato starch aerogels (PSAs) without chitin. PSA samples with water included in solvent exchange baths had lower surface toughness to the touch and had starch powder falling off. PSA 1.5 exhibited the least surface starch powder detachment, which potentially shows better durability. All the samples are opaque white and maintained their structural integrity, except for sample PSA 1.1. Figure 3h–j presents the resulting chitin/potato starch blended aerogel (C-PSA), which used the same solvent exchange process as PSA 1.5.
The amount of linear shrinkage after the first and second baths and after supercritical drying (SCD) is shown in Figure 4. PSA 1.5, with just three 100% ethanol baths (no water/ethanol baths), had the least shrinkage. It was noticed that the shrinkage of PSA 1.5 changed from positive to negative during the DFP process, which indicates the retrogradation completed after the set time. PSA 1.1, with two 100% water baths, had a complete structure loss; thus, no calculations could be completed. Shrinkage, sample density, and porosity results, shown in Table 2, were calculated using Equations (1)–(3). For comparison, Table 3 includes the results of the chitin potato starch aerogels. For convenience, the corresponding specific surface area values are included in Table 2 and Table 3.

3.2. Carbon Nuclear Magnetic Resonance (C13-NMR) Data

C13-NMR spectra of potato starch itself and PSA 1.5 were taken and are presented in Figure 5. The peaks for pure potato starch and PSA 1.5 C13-NMR spectra are in the same ppm range, although there is a slightly lower intensity for the potato starch at 82 ppm (peak c). The peak at 62 ppm (a) is from the methyl carbon in the methyl ether linkage between the rings and the attached methanol groups. The peak at 73 ppm (b) is from the carbon on the ring next to the OH groups. The carbons next to the ether linkages have a peak at 82 ppm. The peak at 101 ppm (d) is from the carbon in between the ether linkages of the glucose ring and the oxygen linkages between the glucose rings. The increase in intensity seen at 82 ppm for the potato starch aerogels is from the crosslinks between the starch chains caused by forming the potato starch gel (e.g., the addition of glycerol).
C13-NMR of pure chitin and the C-PSA (1.2) are presented in the Supplementary Materials (Figure S1). The C-PSA material shows the characteristic peaks of chitin and potato starch.

3.3. BET Data

N2 adsorption–desorption was performed to determine surface area and pore size distribution. Table 2 and Table 3 contain the specific surface area of each sample. Figure 6 left shows the plot of the N2 adsorption–desorption curves for the aerogel samples. The samples all show the IUPAC type IV curves, with a hysteresis loop related to the mesopores (2–50 nm). Among all the starch samples, PSA 1.5 shows the highest quantity adsorbed. The washing baths have a significant effect on the pore size–pore volume distributions. Ethanol baths of 100% cause the sample PSA 1.5 to have the narrowest pore size distribution with a major pore size of around 10 nm. The first bath, with a medium amount of ethanol, shows a wider pore size distribution with the major pore size at 30 nm.
The adsorption–desorption curves of C-PSA with varying w/w% chitin (Figure 7) showed increased adsorption ability compared to PSA samples with no chitin. Surface areas for C-PSA 1.1, 1.2, and 1.3 contained 151.6, 90.1, and 150.2 m2/g, respectively (Table 3). The addition of 2.5 wt% chitin yielded a better adsorption property than 5 wt% chitin. Out of the other C-PSA samples shown herein, 7.5 wt% had the highest C-PSA adsorption curve.
The chitin-blended samples showed a narrower pore size distribution and reduced pore volume than C-PSA 1.0 (which is 100% potato starch). C-PSA 1.2, which is 50:50 chitin/potato starch (w/w), had less pore volume than either C-PSA 1.1 or C-PSA 1.3. This may explain why the surface area of C-PSA 1.2 is lower than that of C-PSA 1.1 and C-PSA 1.3. We suspect C-PSA 1.2, with equal amounts of chitin and potato starch, experienced synergies not seen in the other samples.

3.4. SEM Analysis

The scanning electron microscopy (SEM) images of PSA provided structure analysis. Samples PSA 1.1 and 1.5 are compared in Figure 8. PSA 1.1 shows pore collapse, structural deformation, and visible tears, while PSA 1.5 had a more homogenous pore size and starch granule spread with larger pore networking. The mesopores within 100 nm cannot be observed at this magnification scale.
SEM images of C-PSA are shown in Figure 9. Due to these samples being heated longer and having lower potato starch content, the starch granules are no longer evident. Chitin wt% affects the morphology of the C-PSA. Compared to 2.5 wt% chitin and 7.5 wt% chitin samples, aerogel with 5 wt% chitin shows a denser structure both in lower and higher magnification images. C-PSA with 2.5 wt% samples show the largest pore size. Both C-PSA samples with 2.5 wt% and 7.5 wt% also have nanopores smaller than 100 nm. However, micropores and mesopores (<50 nm) are not visible from SEM images. SEM images match the finding of BET surface area results, 5 wt% chitin sample has the least surface area due to its denser structure.

3.5. Thermal Conductivity Data

Thermal conductivity for the surviving and most promising PSA sample 1.5 was reported as an average of five tests, resulting in an average thermal conductivity value of 0.047 W/mK. The thermal conductivity is within the reported aerogel range discussed below. Thermal conductivity was taken for the C-PSA sample, in the same manner as with the greatest porosity (C-PSA 1.3) and yielded 0.035 W/mK.

3.6. TGA Data

Derivation weight curves show peaks at the decomposition temperatures, shown in Figure 10. PSA 1.1, 1.3, and 1.5 had an initial decomposition temperature of 310, 310, and 317 °C, respectively, in air. By contrast, in nitrogen, the initial decomposition temperatures were 306, 308, and 314 °C, respectively. The derivation weight curves showed a clear increase in decomposition temperature with PSA 1.5, which correlates with its improved microstructure.
C-PSA 1.0, the starch-only sample, showed a decomposition temperature of 318 °C, while the chitin-only powder (C-PSA 1.5) showed a decomposition temperature of 336 °C. The intermediate samples mostly had intermediate decomposition temperatures—the 2.5 wt% chitin samples had an initial decomposition temperature of 333 °C in air, the 5 wt% chitin samples had decomposition temperatures of 321 °C and 334 °C in air, and the 7.5 wt% chitin samples decomposed at 316 °C in air. In N2, this increase in temperature is more significant: the 2.5 wt% chitin samples decompose at 333 and 358 °C, the 5 wt% chitin samples decompose at 322 °C and 351 °C, and the 7.5 wt% chitin samples decompose at 319 °C and 353 °C in N2. The results of the decomposition are shown in Supplemental Figure S2. These results show the same trends. In derivative weight (DTG) vs. temperature, weight loss in air at around 500 °C cannot be seen in N2, which is due to the burning from the samples. For instance, as shown in the TGA N2 vs. temperature plot, the PSA samples presented a 9–21% char yield (Figure S2).

4. Discussion

While different researchers have performed testing to optimize other parts of the starch aerogel process, here we first focused on the solvent exchange step. We initially sought to make potato starch aerogels (PSAs) using previously published methods [8,9,19,20,22] with varying DI water/ethanol solvent exchanges (
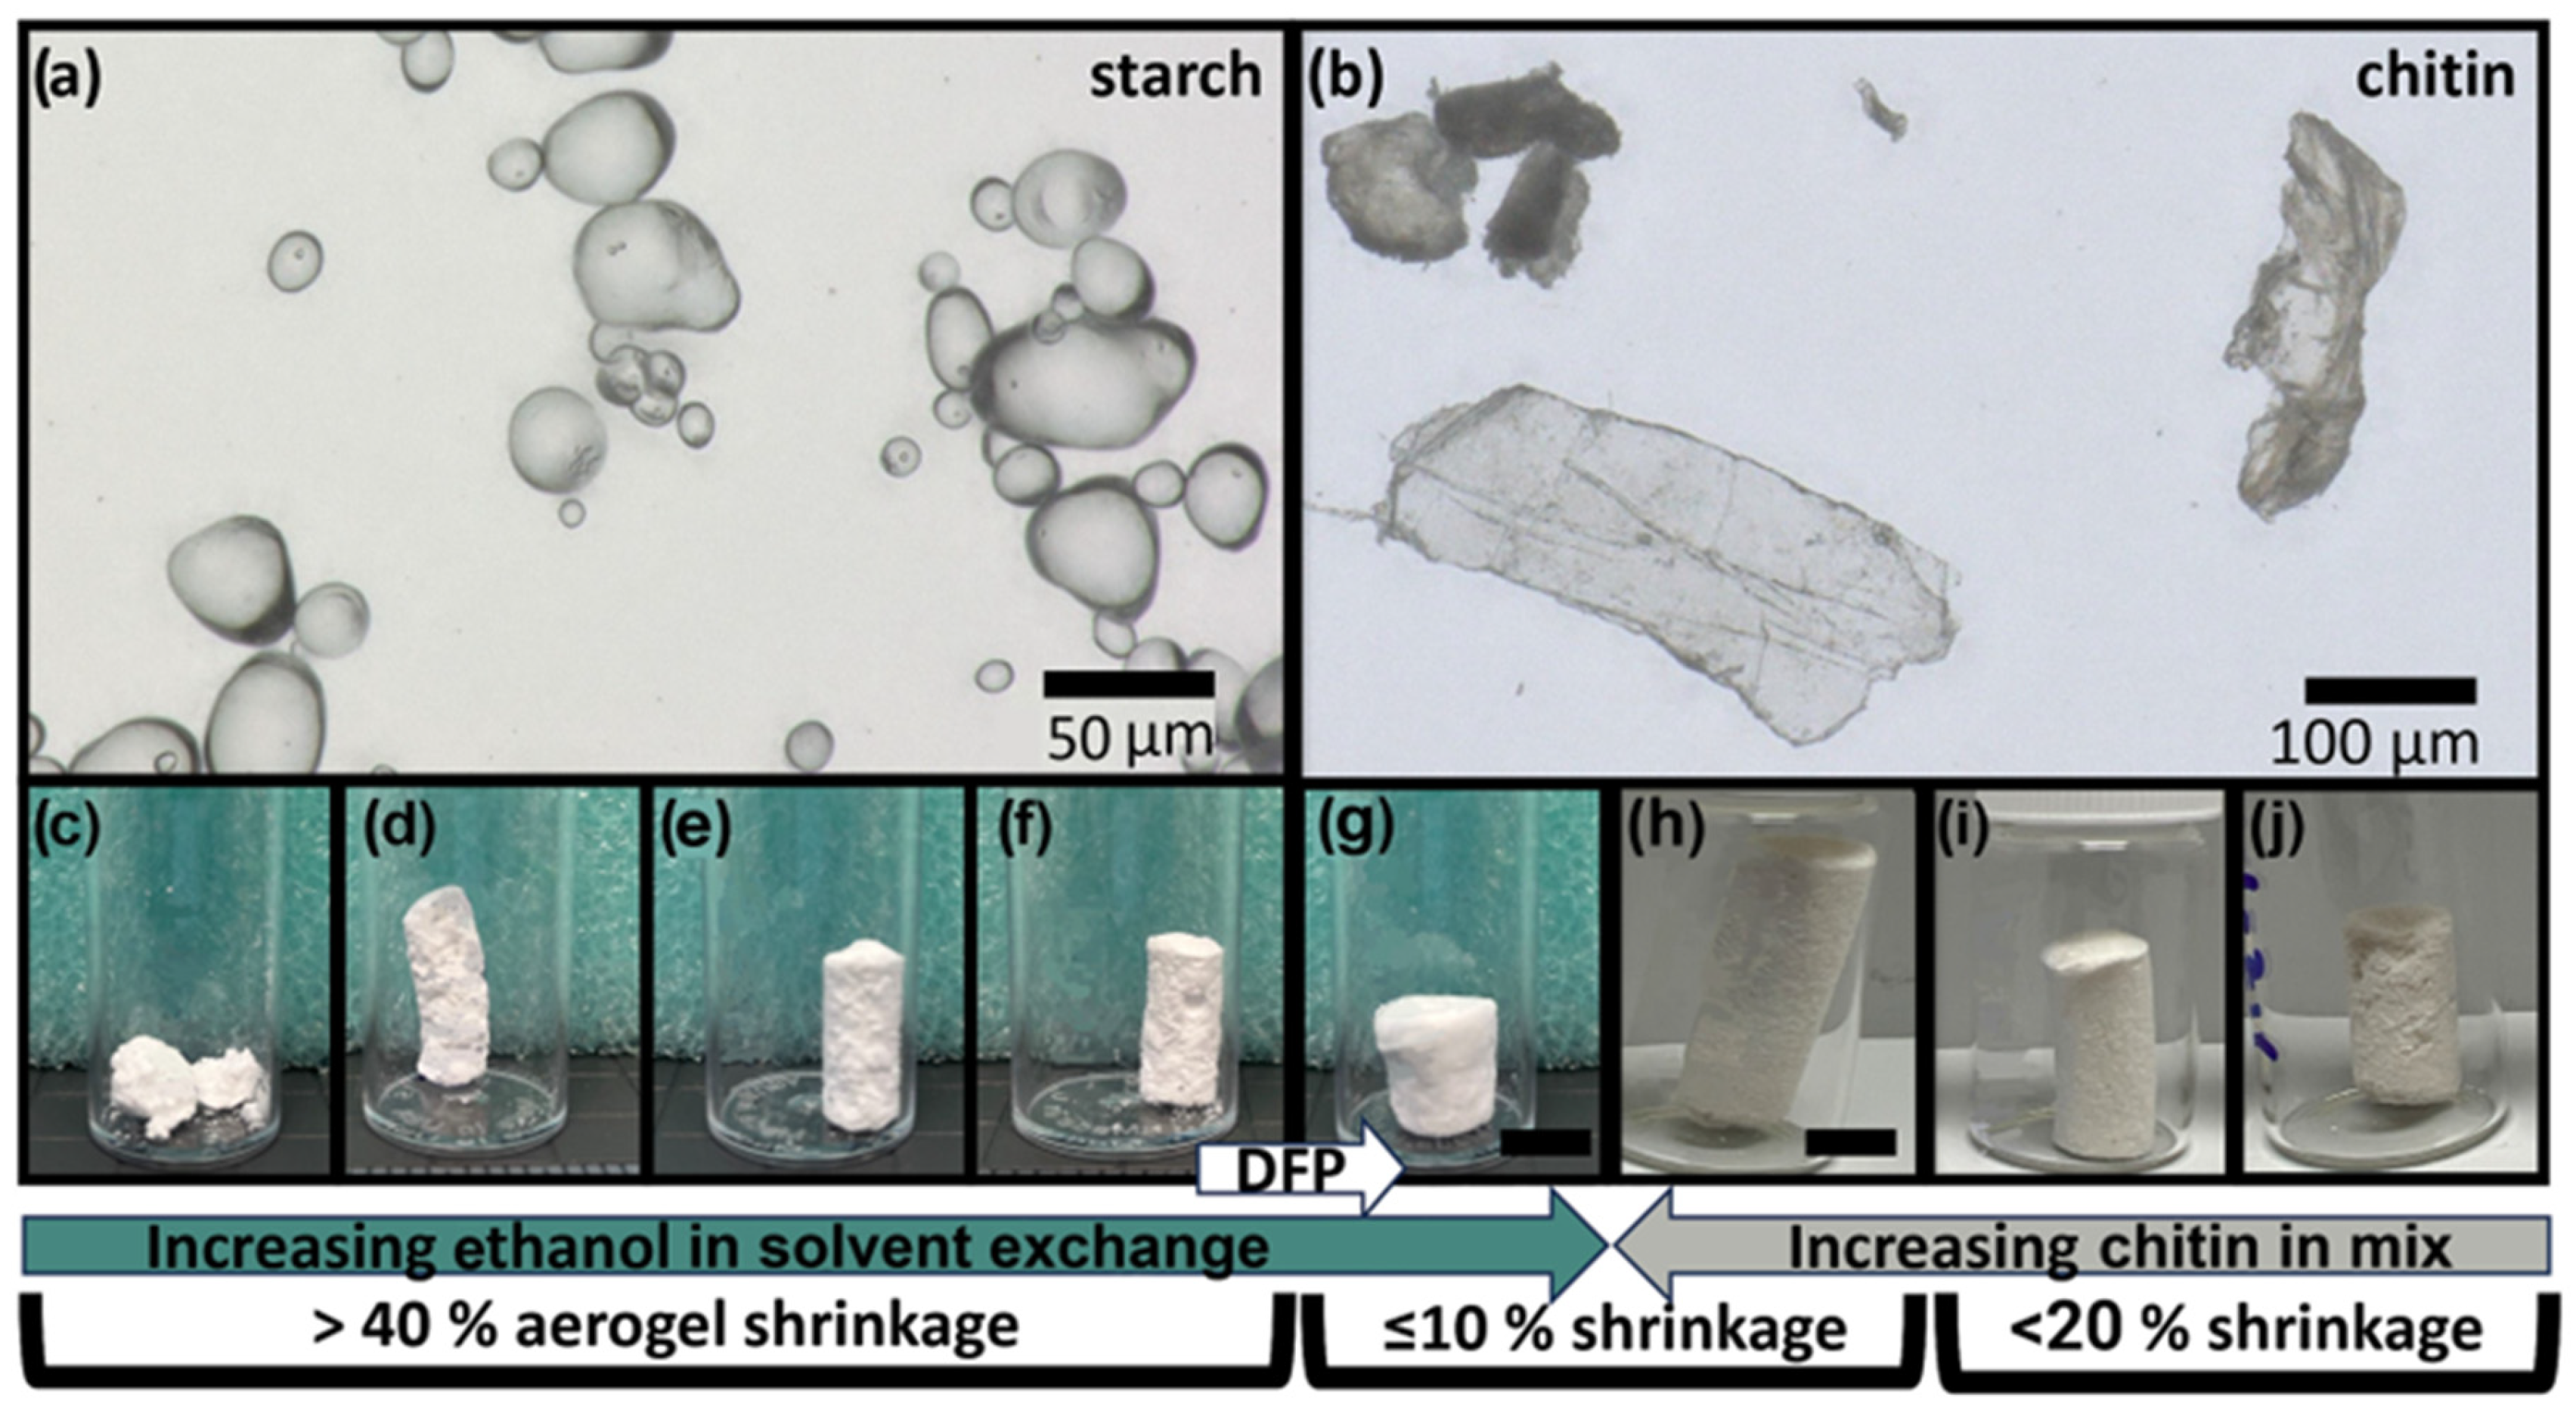
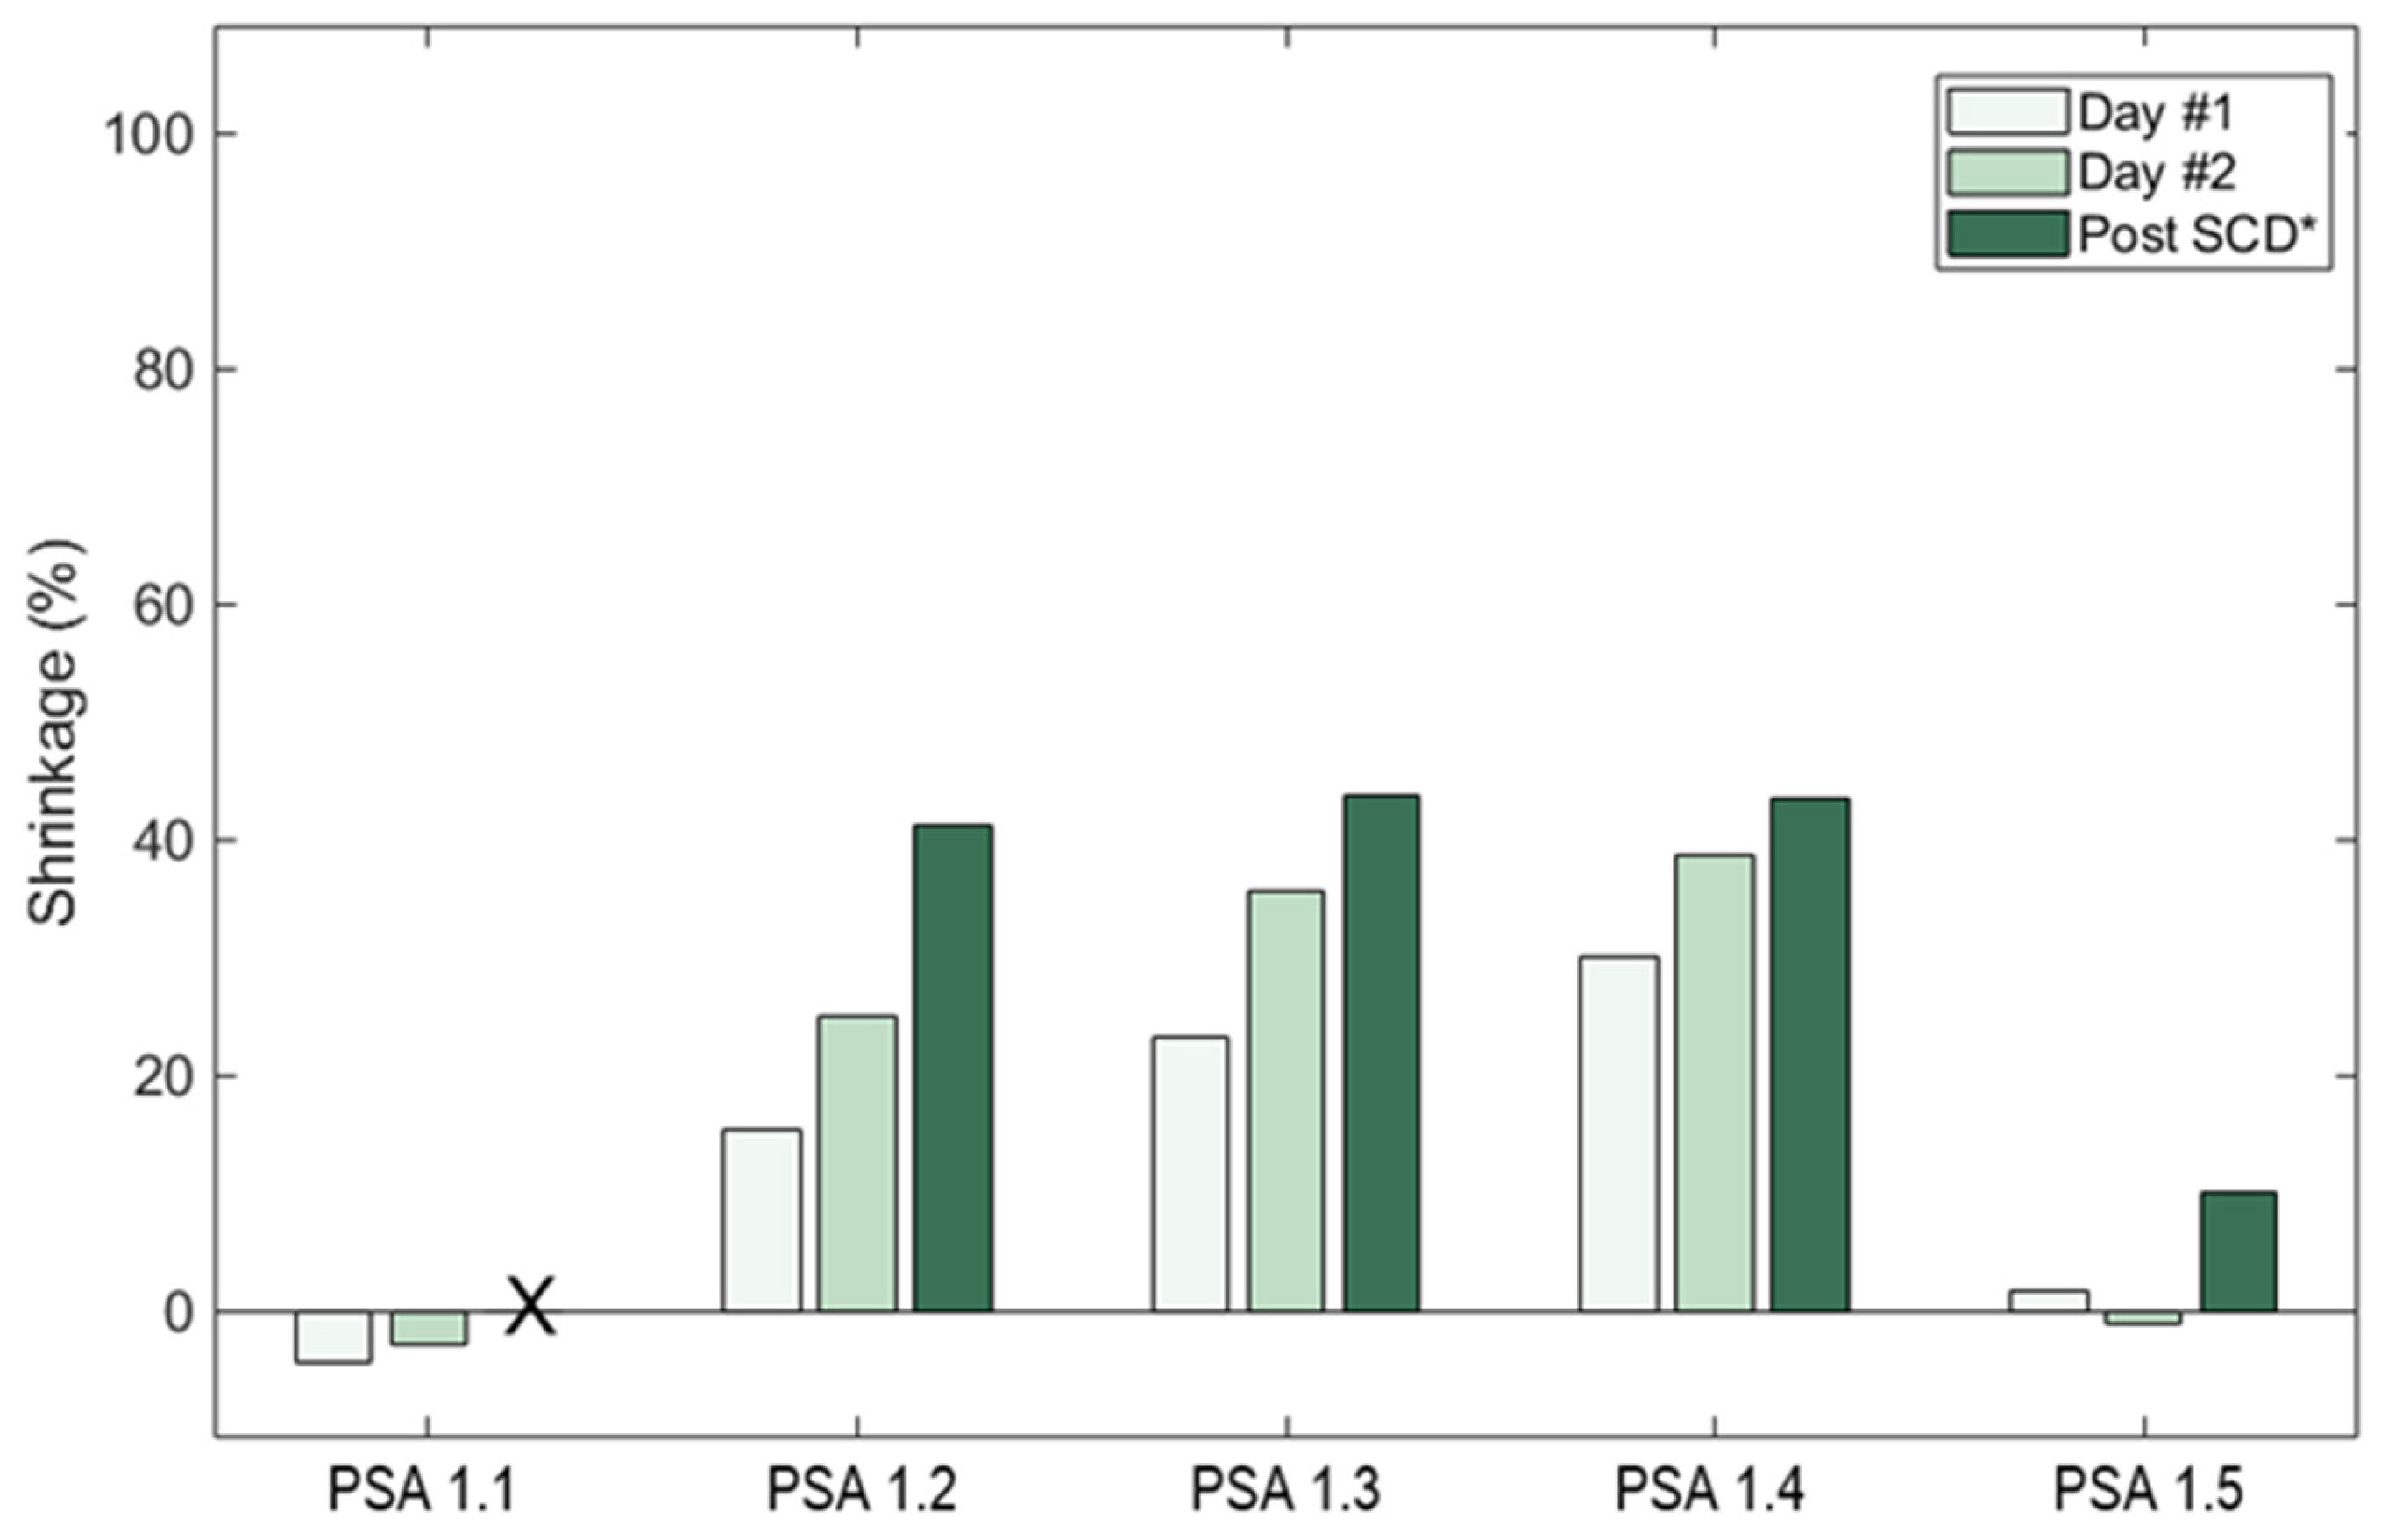
Table 1). PSAs that were subjected to an immediate 100% water solvent did not retain their structures after the end of the SCD stage; thus, their porosities could not be measured (PSA 1.1). PSA 1.1 showed the most starch powder runoff, which correlates with its decreased durability. Samples that went through different baths with increasing ethanol concentrations kept their monolith structures through to the end of the SCD stage seen in Figure 3. PSA 1.2–1.4 had porosities (Table 2) of 63.9–77.0% and shrinkages of 41.0–43.6%. These numbers are in line with other literature [21].
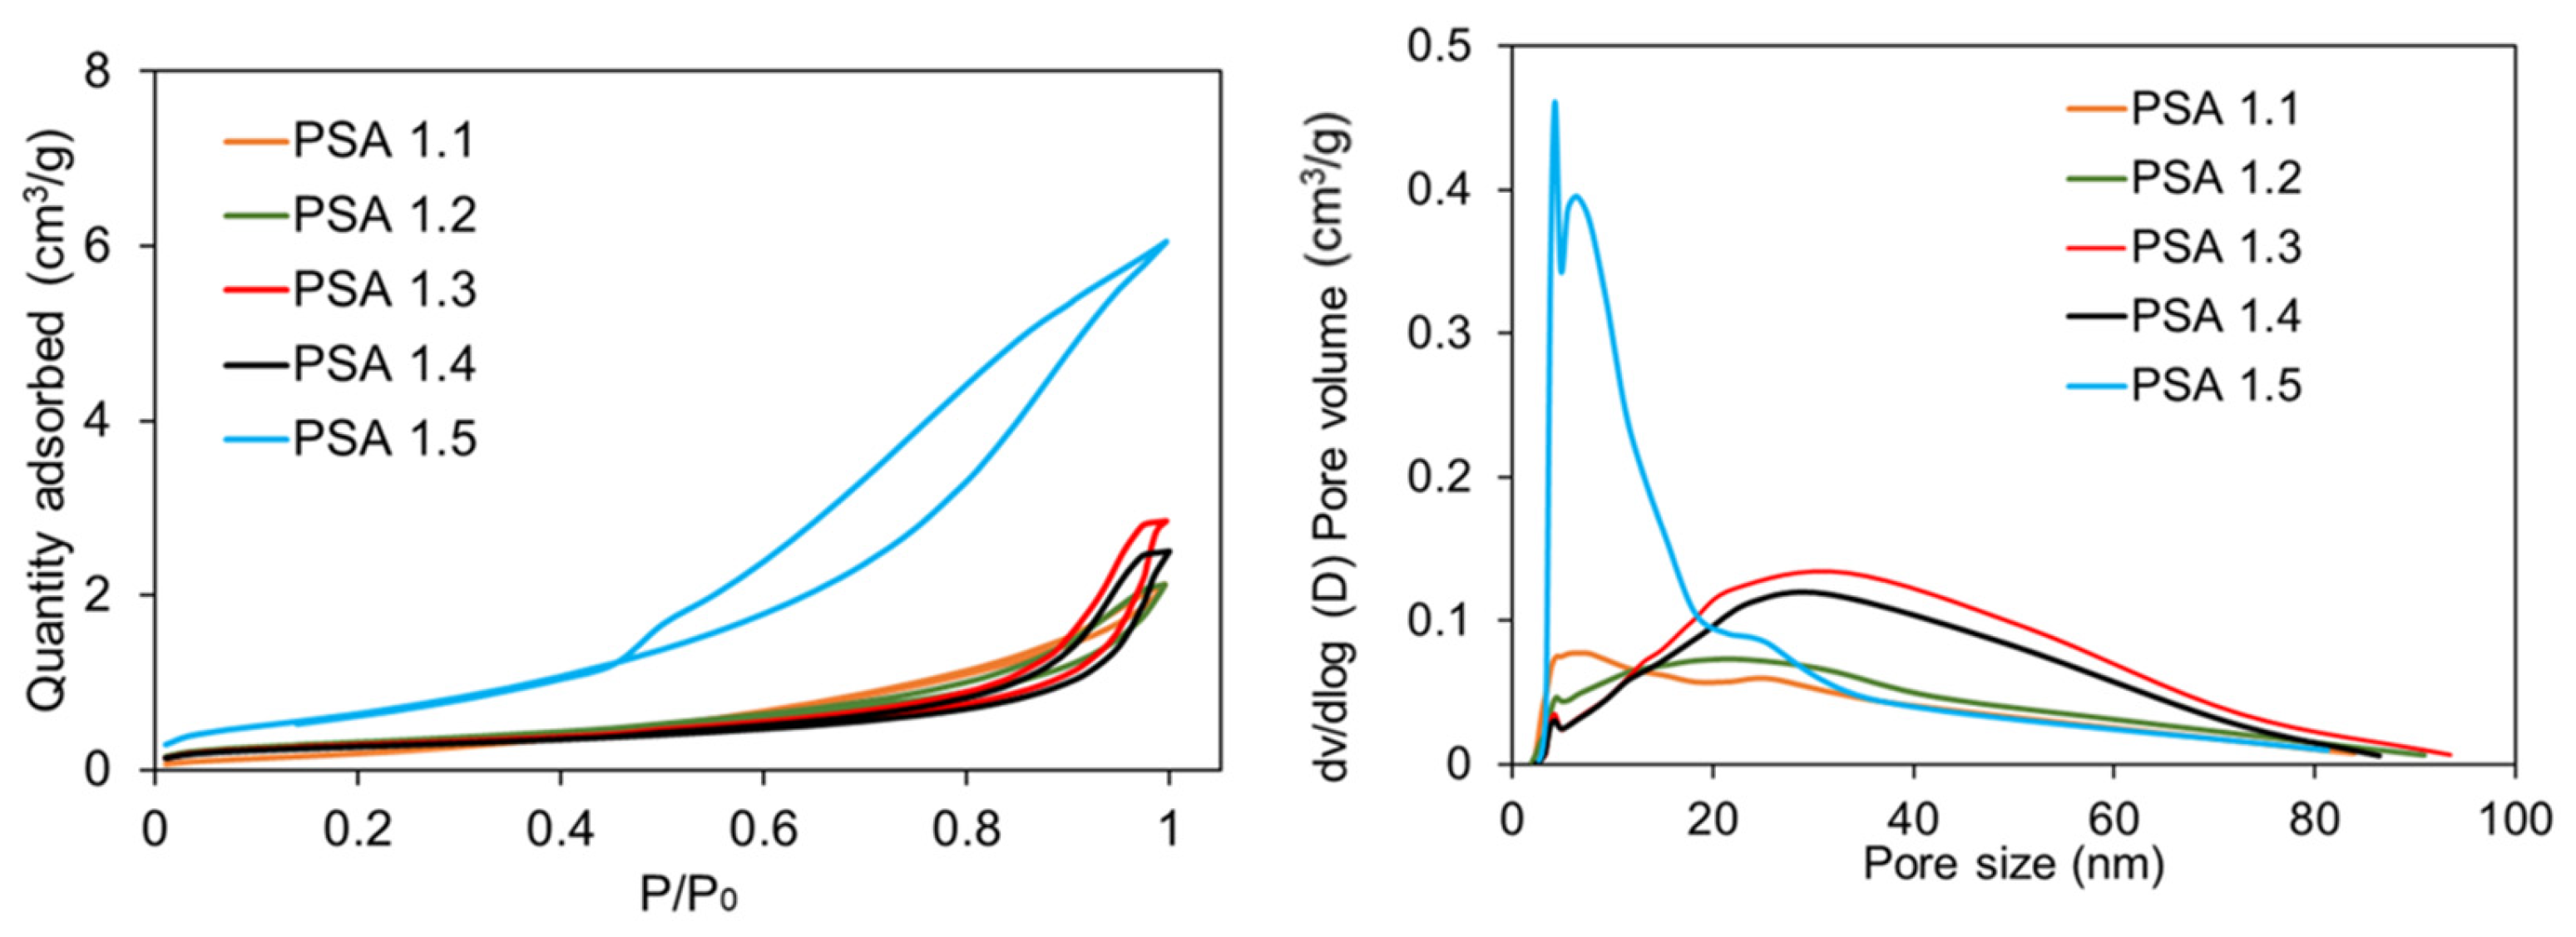
PSA sample 1.5, which underwent a DFP for 48 h before three 24-h 100% ethanol baths, yielded significantly lower shrinkages of 10% and higher porosity (91.7%) than the other PSAs (Figure 4 and Table 1). The sample also contained the least amount of starch powder shedding, showing better durability. This additional DFP process for 48 h could partially explain the marked improvement in shrinkage behavior for PSA 1.5. We hypothesize that retrogradation enables a strong network of amylose and amylopectin with small pores and fine structures, but the addition of water into the solvent baths leads to hydrogen bonding disruption of the retrograded gels, causing pore collapse and shrinkage. We hypothesize that solvent exchanges with water upset the delicate retrogradation process, leading to pore collapse and changes in pore size distribution. We note that the samples with the most water in the exchanges (PSA 1.1 and PSA 1.2) showed the widest distribution of pore width, whereas samples with modest amounts of water in the exchanges (PSA 1.3 and PSA 1.4) showed organization, with most pore sizes ranging from 20–50 nm in size, and the sample using 100% ethanol (PSA 1.5) showed the narrower pore size distribution. The use of pure ethanol solvent baths minimizes the damage, as the only water available is the water leaving the gel structures and dissolving into the ethanol bath. Thus, samples with higher water content in the baths (PSA 1.1–1.4) showed more pore collapse and a lower surface area (Figure 6 and Table 2) in the resulting aerogel. N2 adsorption measures pores from 0–300 nm but SEM, discussed later, reveals macropores.
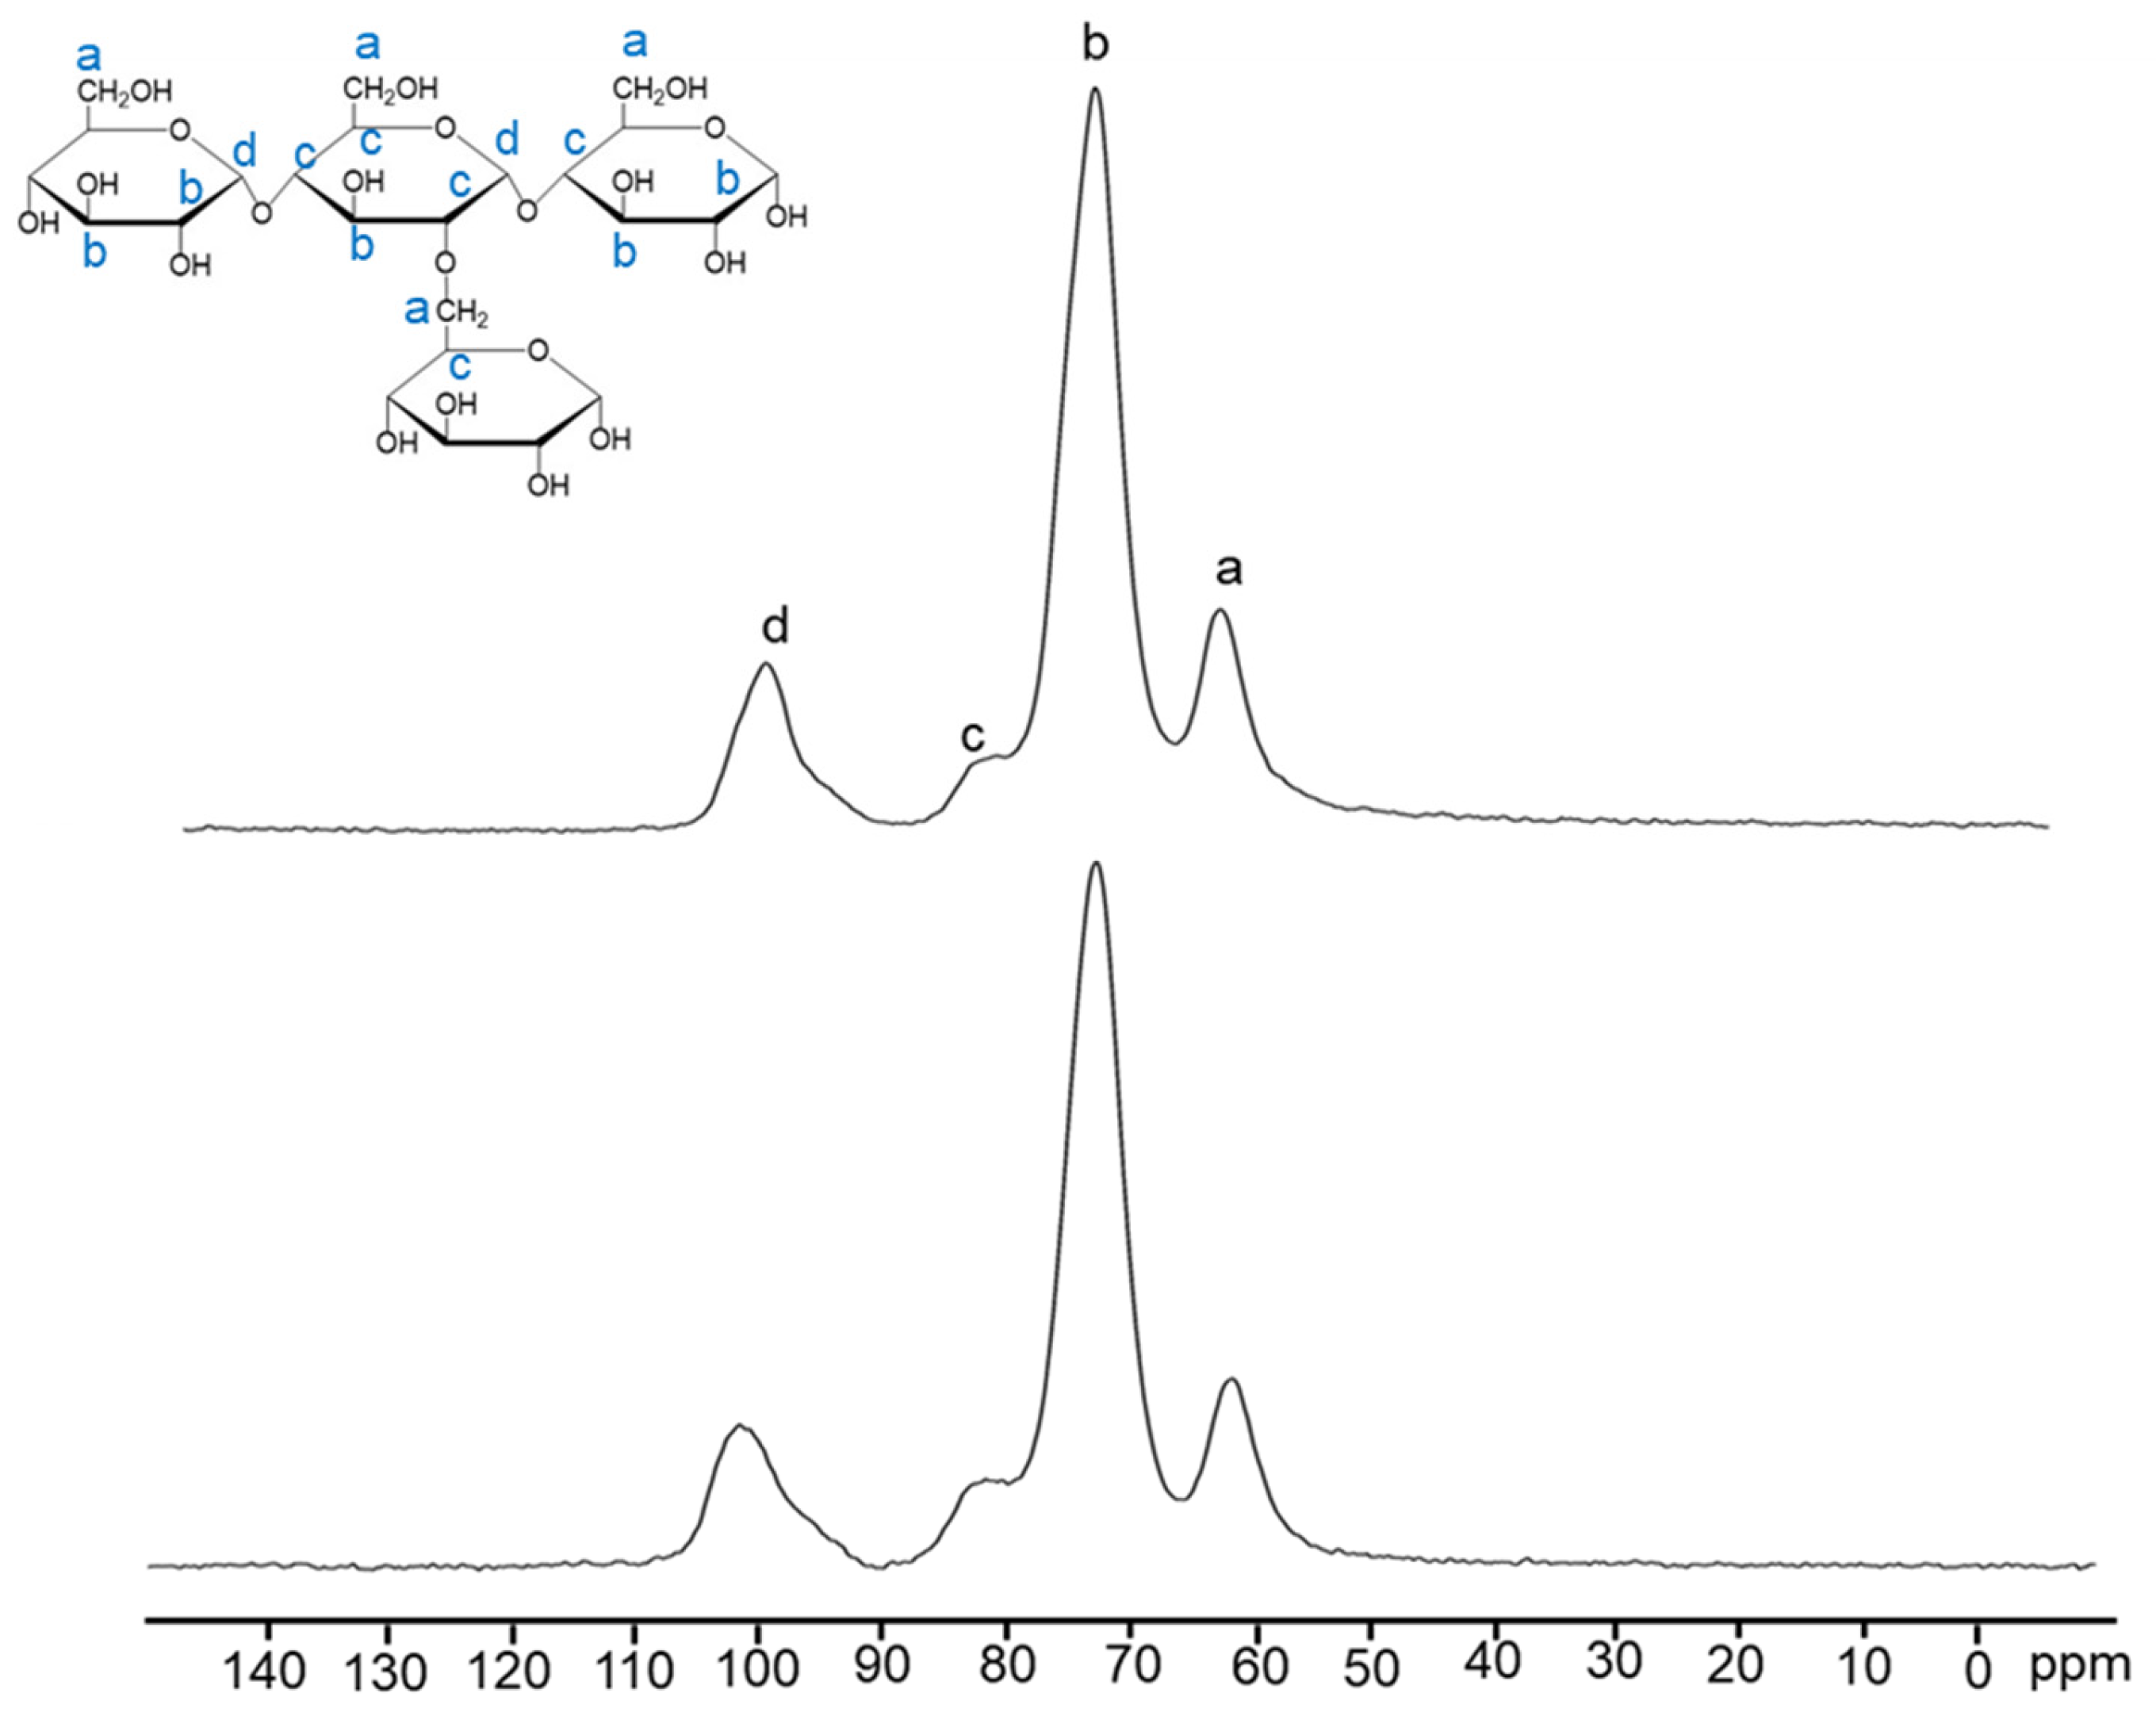
C13-NMR was performed to assess the chemical structure change in the starch after the formation of the 3D network of the aerogel. Crosslinks between the starch chains with the addition of glycerol can be seen by the intensity increase of 82 ppm, shown in Figure 5. From the intensity change in the characteristic peak, 56 ppm, of the carbon connected to the -NH- peak, chitin addition with PSA can be noticed. To further mitigate shrinkages and deformations, we tested the addition of a crystalline biopolymer, chitin, and saw an increase in porosity and decrease in density with higher wt% chitin and lower wt% starch (
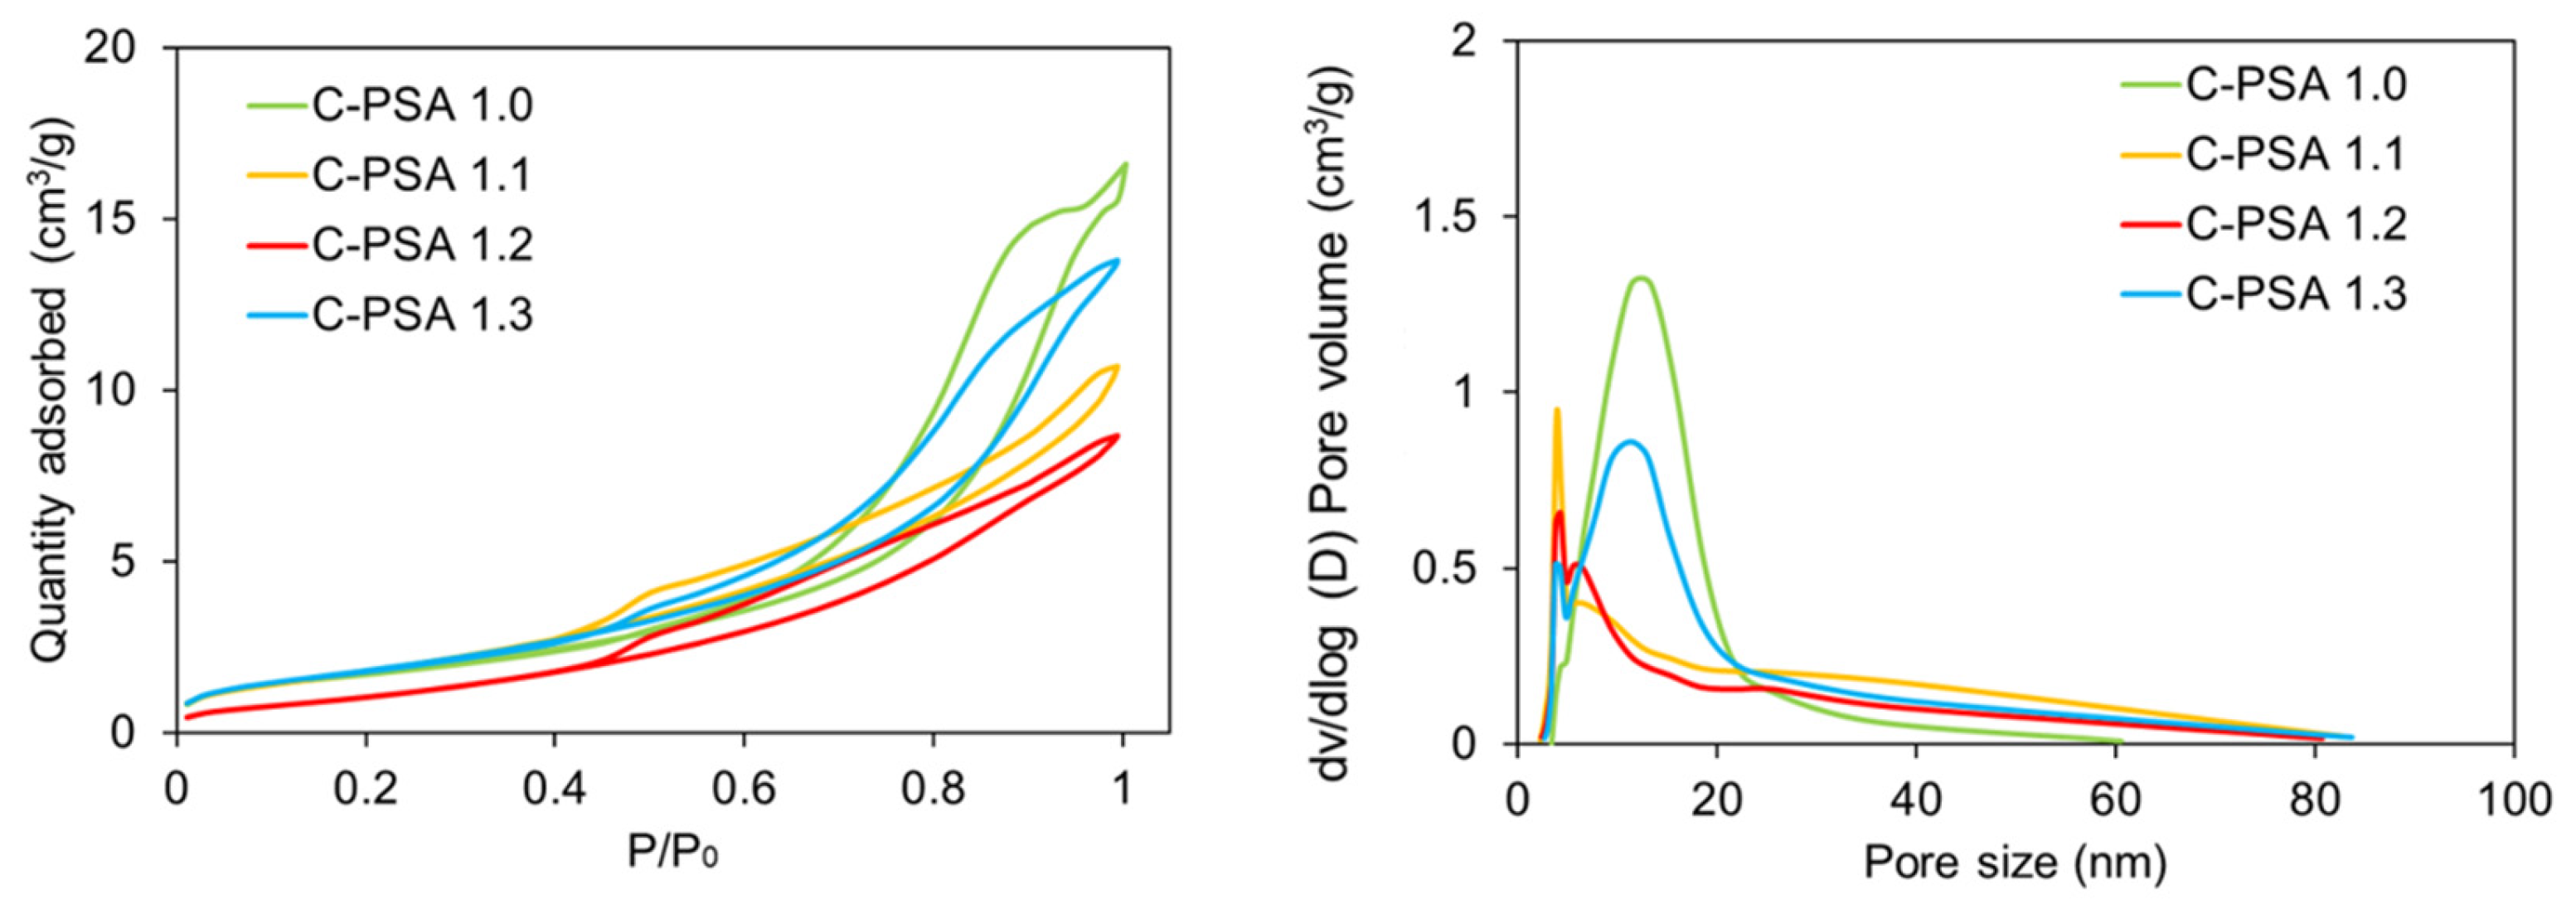
Table 3). Chitin-blended samples contained the highest porosity of this study (C-PSA 1.3 with 92.1%) and the lowest shrinkage (8.1%). We remind the reader that all C-PSA samples underwent the same sol-gel process as PSA 1.5, although with the addition of chitin and 10 min longer heating due to chitin’s limited solubility in water. This longer heating explains C-PSA 1.0’s different shrinkage, porosity, and surface area than PSA 1.5. Further characterizing the C-PSA samples, the BET and surface area data of the chitin-blended samples (Figure 7, Table 2 and Table 3) suggest that the addition of chitin enhances the pore size distribution at smaller diameters 0–5 nm while also increasing the surface area by almost 3× compared with PSA-1.5.
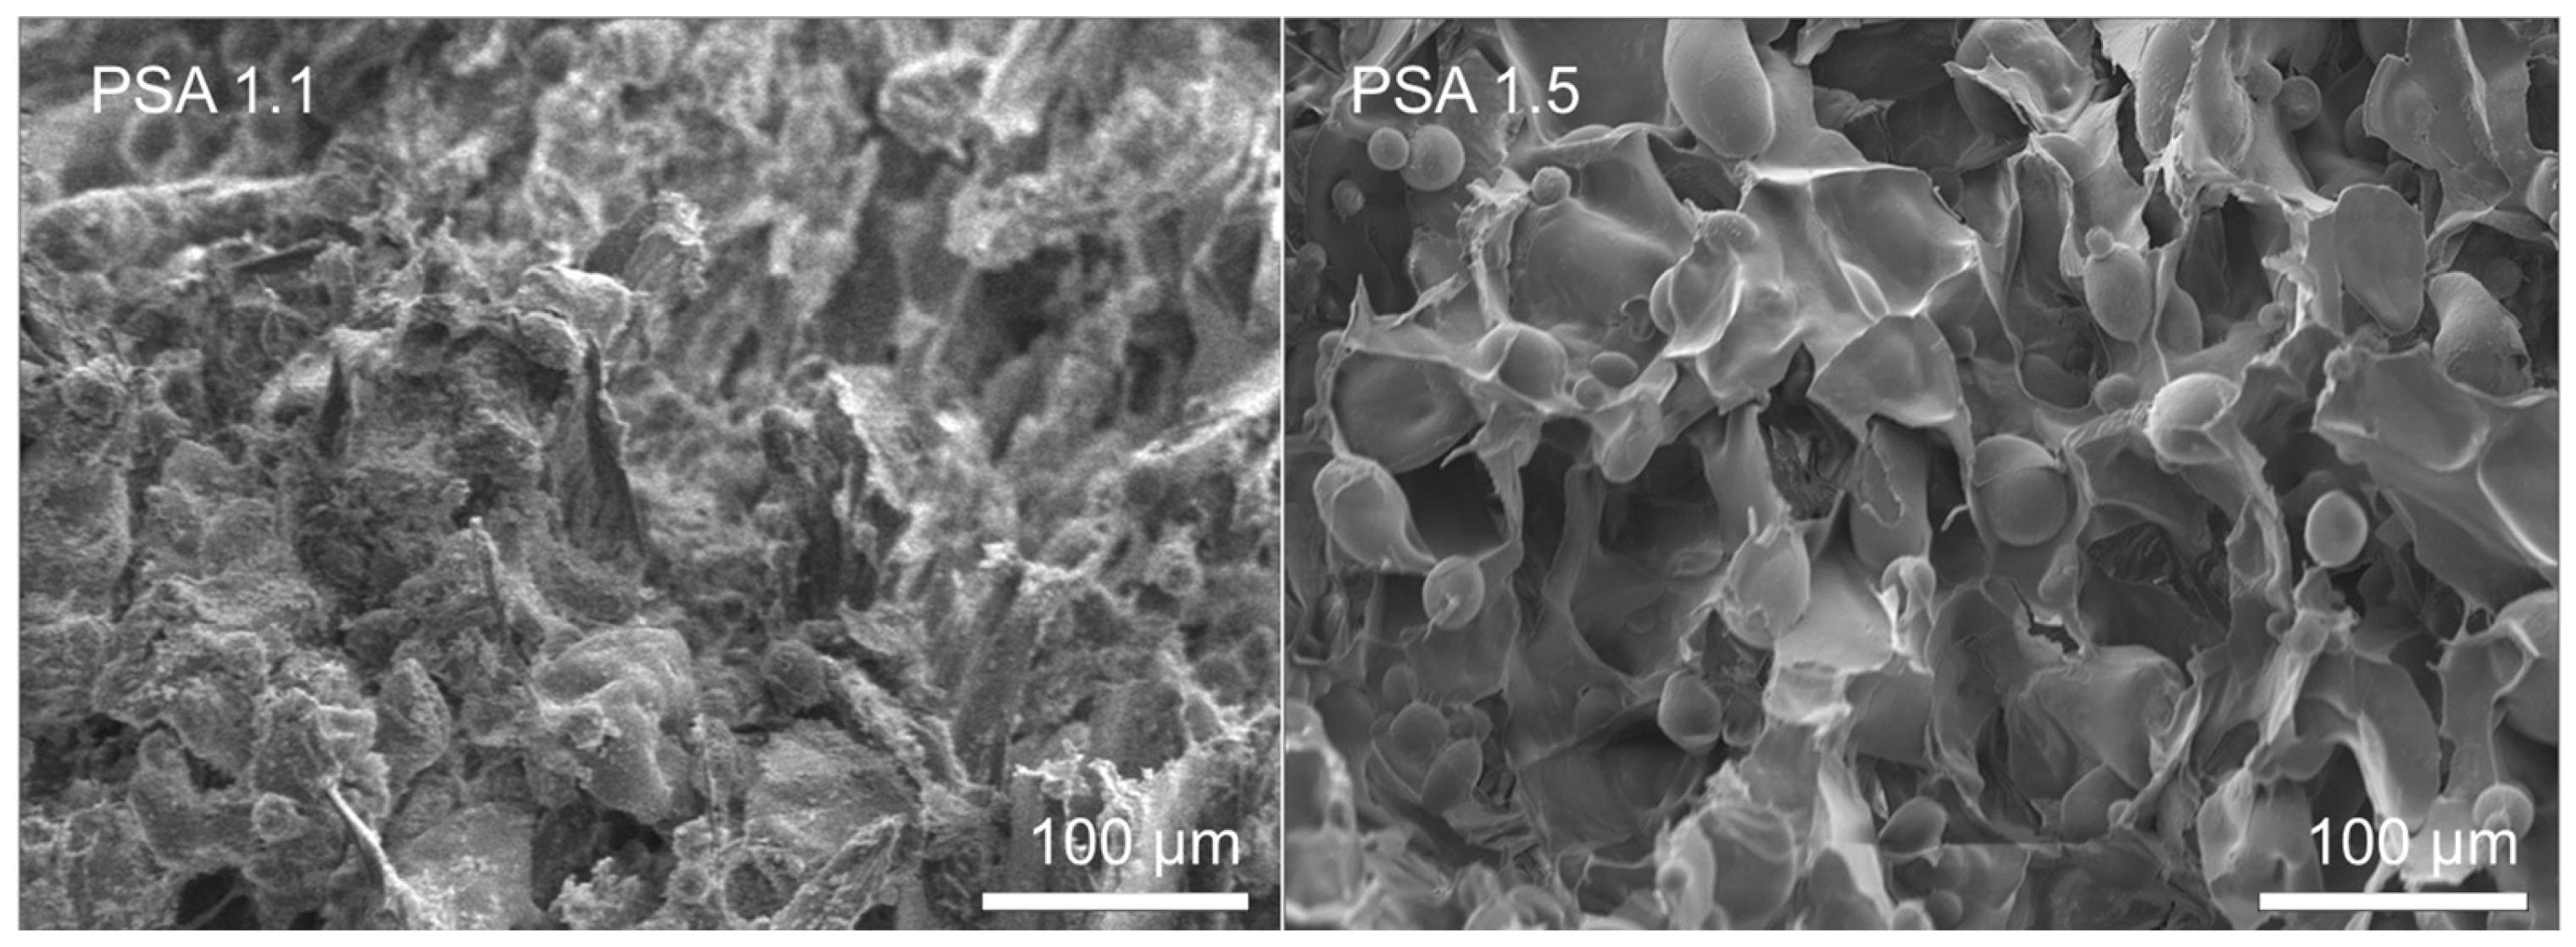
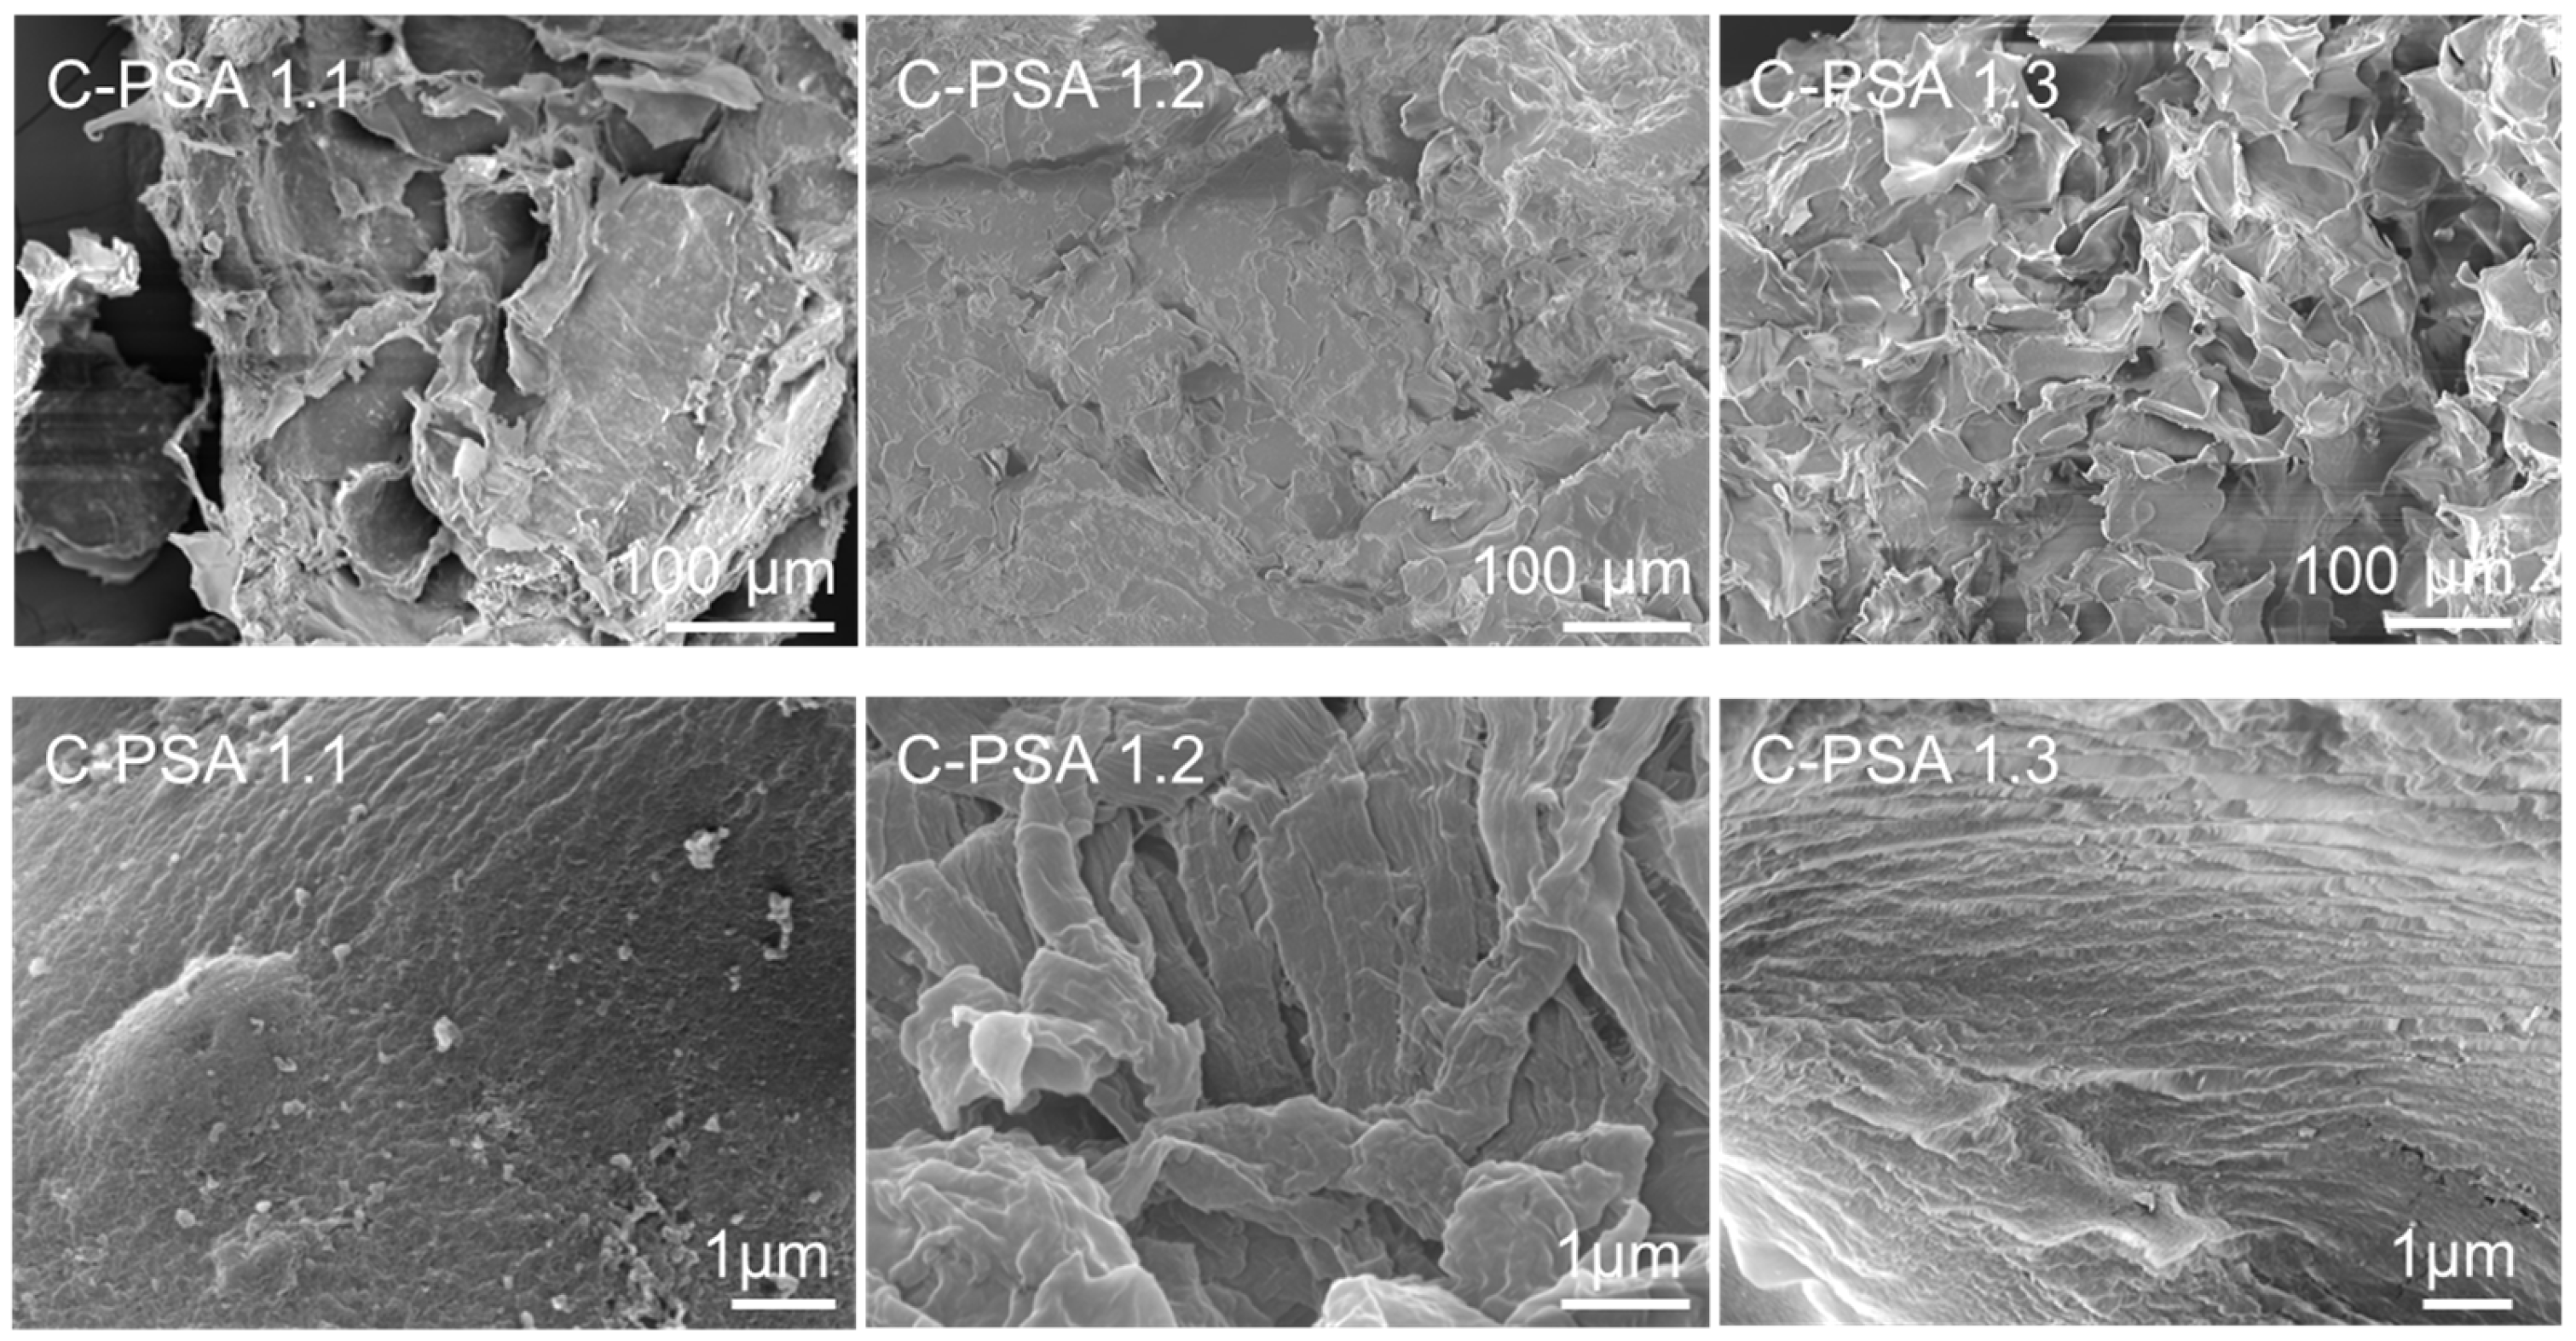
SEM analysis suggests that the pore structure of both PSA 1.5 and C-PSA 1.3 resembles “honeycomb” walls (Figure 8 and Figure 9) and “plate-like” interstitials, while PSA 1.5 had some 20–80 µm starch granules. With a longer heating time, all starch granules can swell and rupture. PSA 1.1 when compared to PSA 1.5, suggests that more water included in solvent exchange baths correlates to pore collapse. The DFP process may have helped build this honeycomb structure since ice is hexagonal in shape. The structure likely reduced water’s impact on the gel as it transitioned through successive ethanol baths. PSA 1.5 certainly showed better surface and pore structure than other PSA samples that were not frozen. Similarly, through the addition of chitin with 7.5 wt%, we observed clearly defined nanoporous walls and no residual starch granules (Figure 9). With increasing chitin, the aerogel microstructure becomes more variable. The 50:50 chitin/potato starch sample (C-PSA 1.2) resulted in the most condensed structure. A reasonable hypothesis as to why the starch-chitin integrates so well together is that the chitin in suspension has a positive surface charge, whereas the starch in solution has a negative surface charge [28].
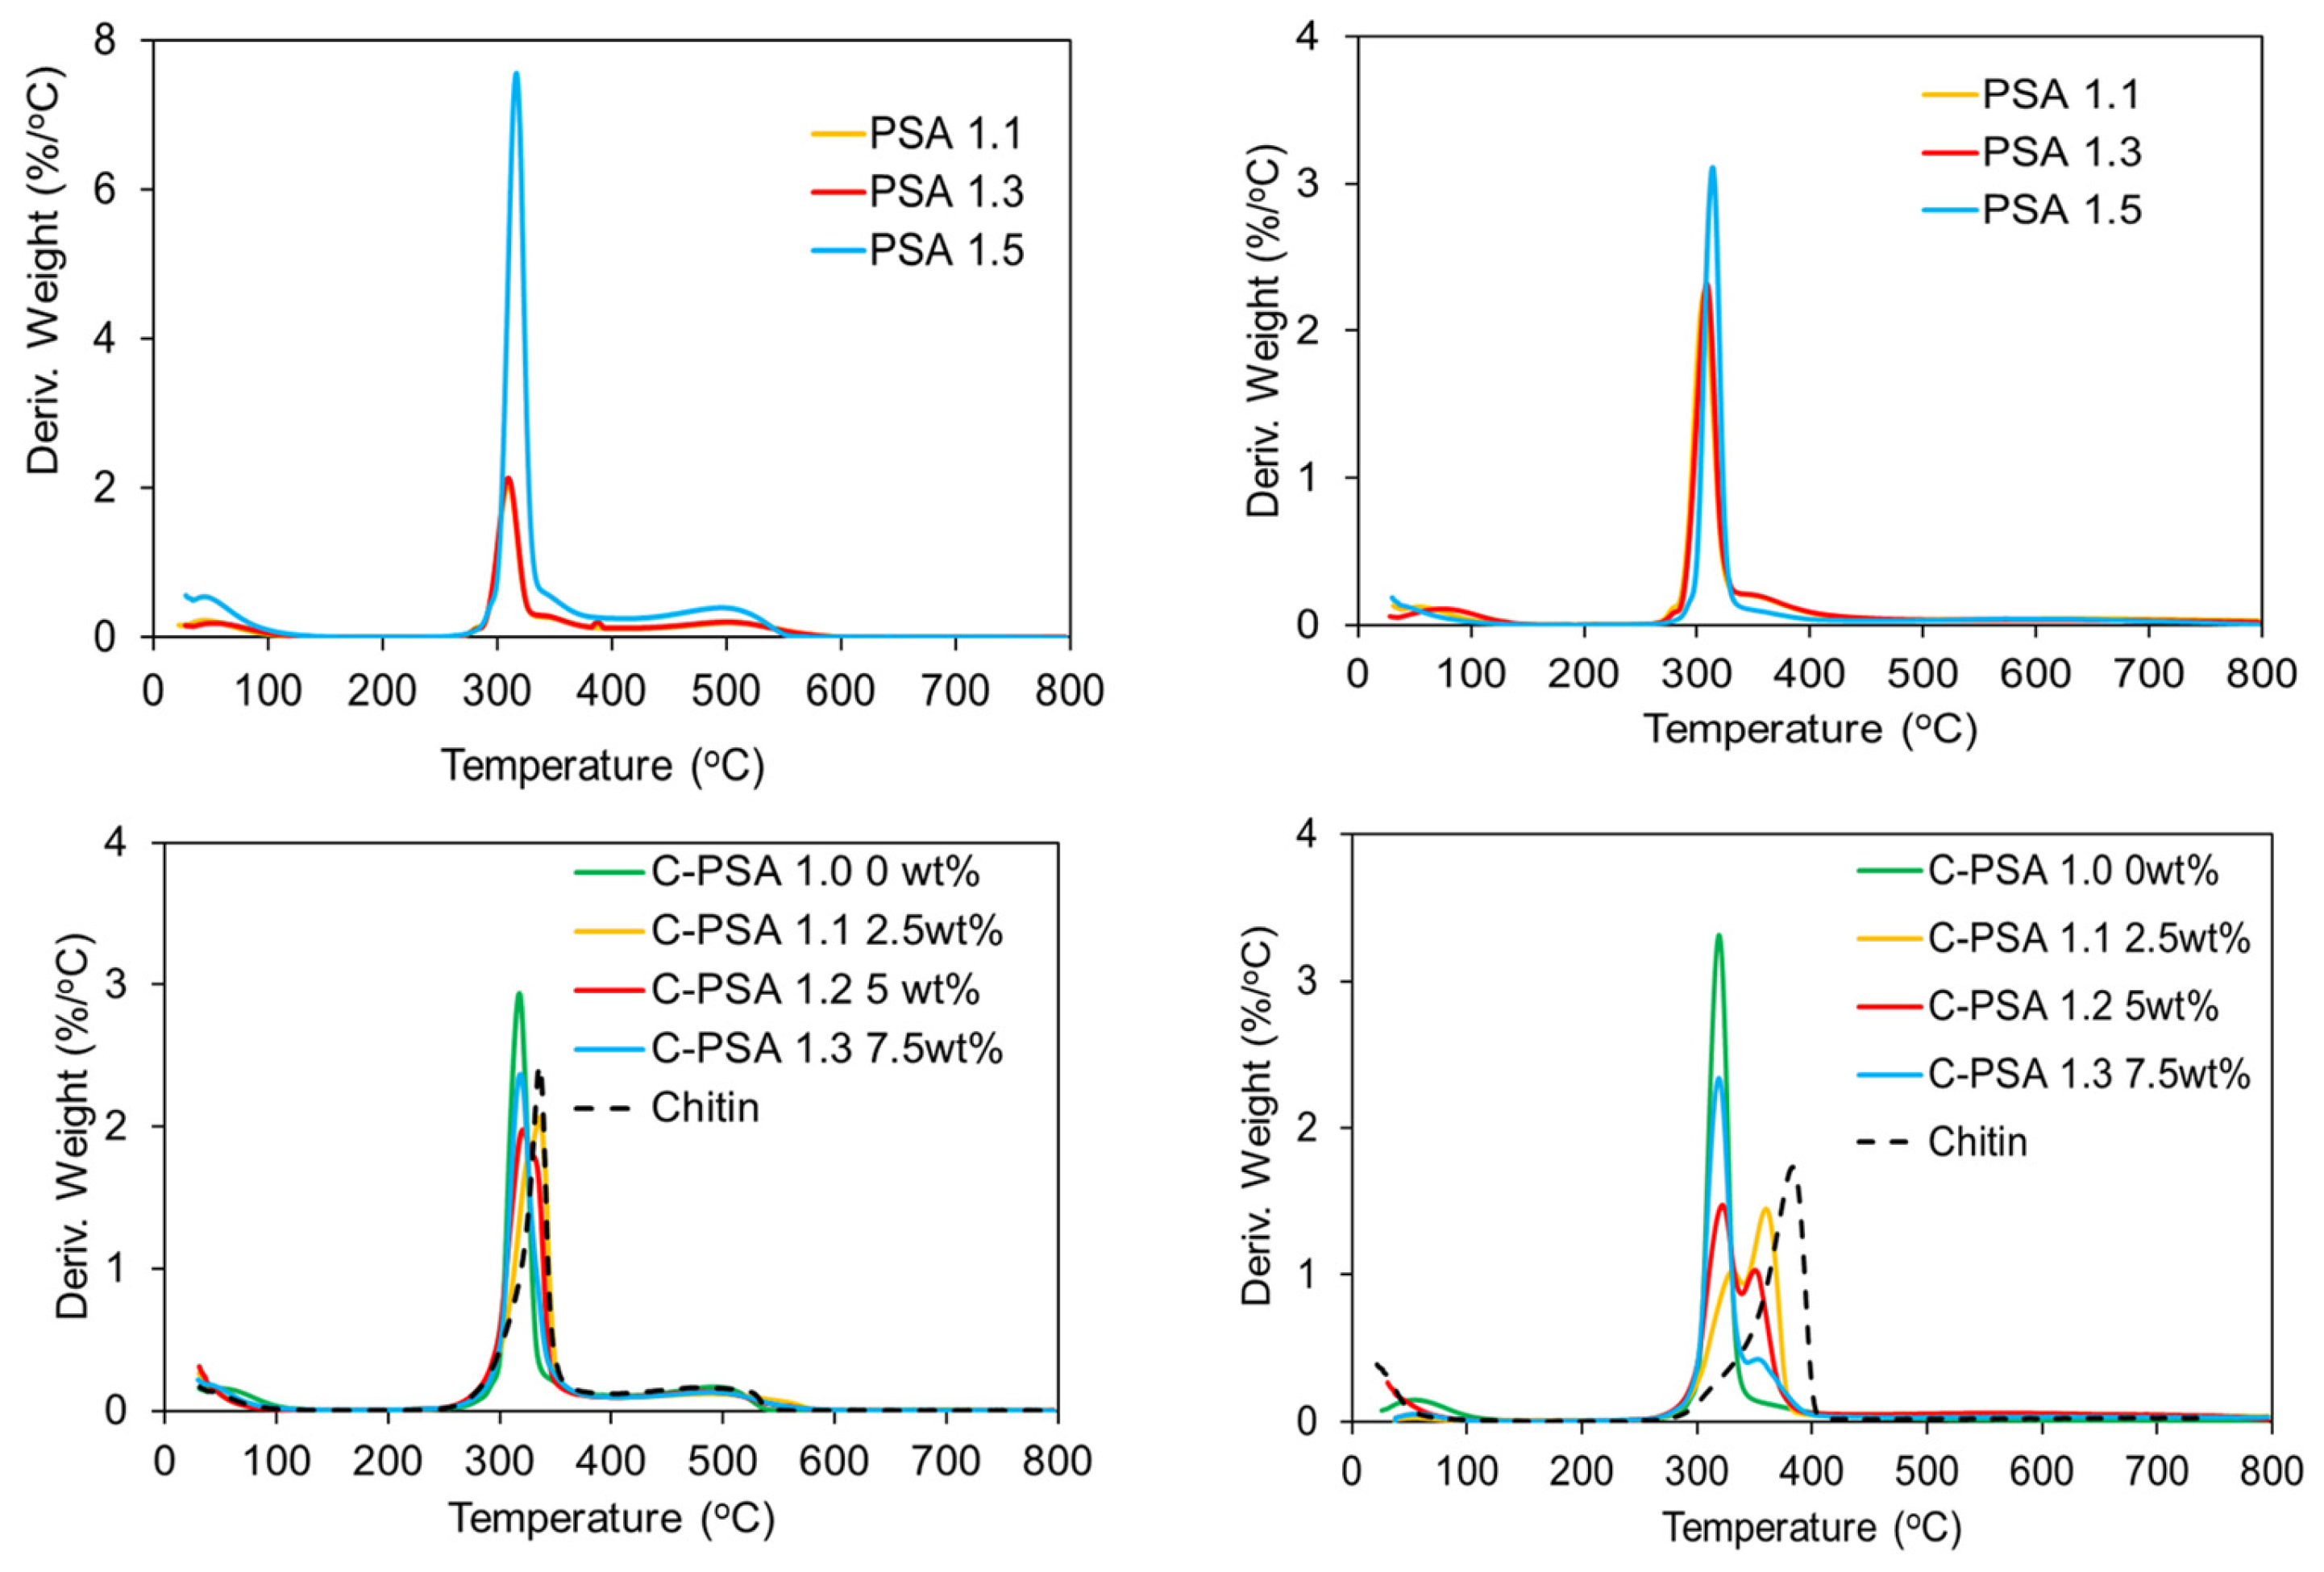
For the thermal decomposition comparison of PSA 1.5 and other aerogels with the same formulation but different solvent exchange methods, PSA 1.5 had a slightly higher decomposition temperature in both air and nitrogen (Figure 10). PSA 1.1 and PSA 1.3 had no significant differences in curves within TGA air testing. All aerogels in TGA tests showed an initial 10 wt% drop below 100 °C due to trapped solvent being burnt off. Chitin has a higher decomposition temperature than starch both in air and N2, as seen from the derivative weight vs. temperature curve. The addition of chitin (Figure S2) is expected to cause an increase in decomposition temperature. This increase is more significant in N2. With 2.5 wt% chitin, the decomposition temperature increased from 318 °C (0 wt%) to 333 °C in air, and in N2, two decomposition temperatures at 333 °C and 358 °C can be observed. However, it seems that 2.5 wt% chitin is the optimized amount for higher thermal stability; 7.5 wt% chitin resulted in lower decomposition temperature than the 2.5 wt% and 5 wt% chitin samples. Samples with 2.5 wt% chitin (C-PSA 1.1) showed the best amount for increasing the decomposition temperature within PSAs, although the 7.5 wt% chitin sample has less shrinkage and a similar surface area. The reason behind this may be that the 2.5 wt% sample has both dense walls and a significant amount of nanopores for hindering heat transfer. The 5 wt% chitin sample has a dense structure but less micro–mesopore volume than the other two samples. The 7.5 wt% chitin sample has the most stable structure, but the wall of the structure is too thin to be retained when exposed to heat.
PSA 1.5’s aerogel porosity was similar to values reported before using agar and microcrystalline cellulose as reinforcements for corn starch (70% amylose at 92% porosity). However, these corn starch-based aerogels had shrinkages of up to 41.2% [20]. In this study, we used a slightly different process for gel formation than other studies, including a shorter starch hydration period and the use of acetic acid to hasten gelation. Thus, our results cannot be directly compared. However, our shrinkage values for mixed water/ethanol baths mirror values found by other studies as listed above. In addition, we performed all the experiments with only one type of starch (potato starch) so we cannot say whether starches with lower amylopectin content (such as pea starch or corn starch) would also see such a significant reduction in shrinkage. This study was performed with all the samples contained inside glass vials unless the sample was being tested. Humidity may have been a variable included in our findings, although even during sample preparation, the gels were not exposed to ambient air for long periods of time.
With a low density and high porosity, PSA 1.5 is an ideal candidate for thermal decomposition testing, having a thermal conductivity value of 0.047 W/mK. The DFP and direct ethanol solvent exchange baths provided mitigation of most shrinkages and deformations. We further suggest from these findings that, in addition to the above suggestion, the blending in of 5–7.5 wt% chitin will further mitigate shrinkages, surface area, and surface deformations while providing an attractive thermal insulator due to its lower thermal conductivity of 0.035 W/mK. For comparison, polylactic acid (PLA), a common 3D printing biodegradable polymer, has a thermal conductivity of 0.13 W/mK, and polystyrene (PS) has a value of 0.14 W/mK. Non-biodegradable foams used in insulation such as polyurethane and phenolic materials have values of 0.041 and 0.043 W/mK [29]. For comparison with other aerogels, polyimides have a value of 0.03 W/mK, and bio-based cellulose, 0.04 W/mK.

5. Conclusions

This study introduces two effective strategies to mitigate shrinkage and improve the structural stability of starch-based aerogels: (1) the implementation of a deep-freezing protocol (DFP) prior to solvent exchange, followed by pure ethanol washes, and (2) the incorporation of chitin as a structural additive. Both strategies resulted in lower shrinkage, enhanced porosity, and reduced bulk density, as demonstrated by the measurement of surface area and pore distribution. This work demonstrated that conventional solvent exchange baths containing a mixture of water and ethanol contribute to substantial pore collapse and deformation, which can be prevented through DFP and pure ethanol baths.
The thermal conductivity of the aerogels was significantly influenced by the processing method and the material composition. The optimized sample, prepared using DFP and pure ethanol solvent exchange, exhibited a thermal conductivity of 0.047 W/mK, demonstrating the effectiveness of the protocol in preserving the porous structure. The addition of chitin yielded aerogels with higher porosity, more uniform pore networks, and lower thermal conductivity, with the best-performing sample achieving a value of 0.035 W/mK. These values fall within the expected range for aerogels and compare favorably with conventional polystyrene foam (0.14 W/mK), confirming the potential of bio-based aerogels as high-performing thermal insulators.
While this work focused on mitigating shrinkage and optimizing thermal and structural characteristics, we acknowledge that other performance metrics—such as mechanical strength, environmental durability (e.g., resistance to humidity), and long-term stability of the aerogels—are critical for practical applications. These properties are currently under investigation and will be the subject of future studies.
Here, we only demonstrated our methods with one type of starch (potato). However, potato starch is known to incur larger shrinkages than other commonly used starches such as pea starch or corn starch. The solvent exchange process and addition of chitin can easily be implemented by others in the field of bio-based aerogel and cryogels, mitigating shrinkage and deformations in all types of starch-based aerogels, and enhancing their usability for a broader range of applications as sustainable materials.
The potential applications of starch-based aerogels include their use as disposable thermal barriers, where biodegradability and minimal environmental impact are important. For example, these materials can serve as thermal liners for perishable goods and temperature-sensitive items, such as fresh produce, frozen food, and biological samples, aiming at zero-waste operations. Disposable thermal barriers are valuable in logistics, healthcare, and humanitarian aid sectors, where performance and sustainability are critical. Additional potential applications include aerospace and motorsport applications due to their lightweight, porous, and insulating properties. This represents a greener, more sustainable alternative to the fossil fuel-based materials currently used in these industries.

Supplementary Materials

The following supporting information can be downloaded at: https://www.mdpi.com/article/10.3390/macromol5020028/s1, Table S1: Chitin potato starch aerogel (C-PSA) Sample 1.2 with Duplicate Sample 1.4; Figure S1: C13-NMR of (top) Chitin and (bottom) C-PSA 1.2 (5% chitin, 5% potato starch); Figure S2. (Top) of thermogravimetric analysis (TGA) of PSA 1.1, PSA 1.3, and PSA 1.5 in air (left) and in N2 (right); and (bottom) TGA of C-PSA 1.0, C-PSA 1.1, C-PSA 1.2, C-PSA 1.3, and chitin in air (left) and in N2 (right).

Author Contributions

This manuscript was written through the contributions of all authors. Conceptualization, J.S., H.G., A.T. and A.P.S.; Data curation, H.G. and A.T.; Formal analysis, J.S., D.A.S., H.G. and A.T.; Funding acquisition, A.T.; Investigation, J.S., G.M.W., S.P., H.G. and D.A.S.; Methodology, J.S., H.G., A.T. and A.P.S.; Project administration, A.T.; Supervision, A.T. and A.P.S.; Visualization, G.M.W. and A.T.; Writing—original draft, J.S.; Writing—review and editing, H.G., A.T. and A.P.S. All authors have read and agreed to the published version of the manuscript.

Funding

This research was funded by Indiana Space Grant Consortia (INSGC), Indiana University Indianapolis (IUI), and Purdue University.

Institutional Review Board Statement

Not applicable.

Informed Consent Statement

Not applicable.

Data Availability Statement

Data are contained within the article and Supplementary Materials.

Acknowledgments

We thank the NASA GRC O-STEM program for its support and the Integrated Nanosystems Development Institute at Indiana University Indianapolis for the use of the SEM. We also thank INSGC for funding our research and making such findings possible.

Conflicts of Interest

The authors declare no conflicts of interest.

References

  1. Ringler, A. When Did They Start Using Insulation in Homes? 2019. Available online: https://www.retrofoamofmichigan.com/blog/home-insulation-history (accessed on 3 January 2025).
  2. Engineers Edge. Thermal Properties for Non-Metals. Engineers Edge. Contributions of Insulation to the U.S. Economy in 2020—American Chemistry Council. Available online: https://www.americanchemistry.com/industry-groups/center-for-the-polyurethanes-industry-cpi/resources/library/contributions-of-insulation-to-the-us-economy-in-2020 (accessed on 3 January 2025).
  3. Council, A.C. The Contributions of Insulation to the U.S. Economy in 2020; American Chemistry Council: Washington, DC, USA, 2021. [Google Scholar]
  4. Zhao, J.R. A mini review on building insulation materials from perspective of plastic pollution: Current issues and natural fibres as a possible solution. J. Hazard. Mater. 2022, 438, 129449. [Google Scholar] [CrossRef] [PubMed]
  5. Wang, Y. Airborne hydrophilic microplastics in cloud water at high altitudes and their role in cloud formation. Environ. Chem. Lett. 2023, 21, 3055–3062. [Google Scholar] [CrossRef]
  6. Guo, H.; Meador, M.A.; McCorkle, L.; Quade, D.J.; Guo, J.; Hamilton, B.; Cakmak, M.; Sprowl, G. Polyimide Aerogels Cross-Linked through Amine Functionalized Polyoligomeric Silsesquioxane. ACS Appl. Mater. Interfaces 2011, 3, 546–552. [Google Scholar] [CrossRef] [PubMed]
  7. Meador, M.A.B.; Malow, E.J.; Silva, R.; Wright, S.; Quade, D.; Vivod, S.L.; Guo, H.; Guo, J.; Cakmak, M. Mechanically Strong, Flexible Polyimide Aerogels Cross-Linked with Aromatic Triamine. ACS Appl. Mater. Interfaces 2012, 4, 536–544. [Google Scholar] [CrossRef]
  8. Noman, M.T. Aerogels for Biomedical, Energy, Sensing Applications. Gels 2021, 7, 264. [Google Scholar] [CrossRef]
  9. Mehling, T.; Smirnova, I.; Guenther, U.; Neubert, R.H. Polysaccharide-based aerogels as drug carriers. J. Non-Cryst. Solids 2009, 255, 2472–2479. [Google Scholar] [CrossRef]
  10. García-González, C.A.; Sosnik, A.; Kalmár, J.; De Marco, I.; Erkey, C.; Concheiro, A.; Alvarez-Lorenzo, C. Aerogels in drug delivery: From design to application. J. Control. Release 2021, 332, 40–63. [Google Scholar] [CrossRef]
  11. Huang, J. Bio-Based Aerogel Based on Bamboo, Waste Paper, and Reduced Graphene Oxide for Oil/Water Separation. Langmuir 2022, 10, 3064–3075. [Google Scholar] [CrossRef]
  12. Wang, Y. The advances of polysaccharide-based aerogels: Preparation and potential application. Carbohydr. Polym. 2019, 226, 115242. [Google Scholar] [CrossRef]
  13. Raja, P. A Review of Sustainable Bio-Based Insulation Materials for Energy-Efficient Buildings. Macro-Mol. Mater. Eng. 2023, 308, 2300086. [Google Scholar] [CrossRef]
  14. Seung, D. Amylose in starch: Towards an understanding of biosynthesis, structure and function. New Phytol. 2020, 228, 1490–1504. [Google Scholar] [CrossRef] [PubMed]
  15. Staker, J. Influence of Choline Chloride/Urea and Glycerol Plasticizers on the Mechanical Properties of Thermoplastic Starch Plastics. Polymers 2024, 16, 751. [Google Scholar] [CrossRef] [PubMed]
  16. Thanh-Blicharz, J.L. Chemical Modifications of Normal and Waxy Potato Starches Affect Functional Properties of Aerogels. Gels 2022, 8, 720. [Google Scholar] [CrossRef] [PubMed]
  17. Glenn, G.M. Starch-Based Microcellular Foams. Cereal Chem. 1995, 72, 155–161. [Google Scholar]
  18. Biswal, A.K.; Chakraborty, S.; Saha, J.; Panda, P.K.; Pradhan, S.K.; Behera, P.K.; Misra, P.K. Process Optimization, Fabrication, and Characterization of a Starch-Based Biodegradable Film Derived from an Underutilized Crop. ACS Food Sci. Technol. 2024, 4, 1844–1863. [Google Scholar] [CrossRef]
  19. Druel, L. Starch Aerogels: A Member of the Family of Thermal Superinsulating Materials. Biomacromolecules 2017, 18, 4232–4239. [Google Scholar] [CrossRef]
  20. Dogenski, M. Properties of starch-based aerogels incorporated with agar or microcrystalline cellulose. Food Hydrocoll. 2020, 108, 106033. [Google Scholar] [CrossRef]
  21. Fangxin Zou, T.B. Tailoring the morphology and properties of starch aerogels and cryogels via starch source and process parameter. Carbohydr. Polym. 2021, 255, 117344. [Google Scholar]
  22. Garcia-Gonzalez, C.A. Supercritical drying of aerogels using CO2: Effect of extraction time on the end material textural properties. J. Supercrit. Fluids 2012, 66, 297–306. [Google Scholar] [CrossRef]
  23. Dirauf, M.P. Mass transfer kinetics inside bio-(aero)gels during solvent exchange and supercritical drying: On the relevance of advection, gel-porosity and a peculiarity regarding the tortuosity. J. Supercrit. Fluids 2022, 191, 105762. [Google Scholar] [CrossRef]
  24. Lebedev, A. Investigation of Aerogel Production Processes: Solvent Exchange under High Pressure Combined with Supercritical Drying in One Apparatus. Gels 2021, 7, 4. [Google Scholar] [CrossRef] [PubMed]
  25. Huang, J.; Zhong, Y.; Lu, A.; Zhang, L.; Cai, J. Temperature and time-dependent self-assembly and gelation behavior of chitin in aqueous KOH/urea solution. Giant 2020, 4, 100038. [Google Scholar] [CrossRef]
  26. Zhang, Q.; Sun, P.; Xu, Z.; Qu, W.; Zhang, Y.; Sui, X. Chitin nanocrystals as natural gel modifier for yielding stronger acid-induced soy protein isolate gel. Carbohydr. Polym. 2024, 323, 121446. [Google Scholar] [CrossRef] [PubMed]
  27. ASTM D7984-21; Standard Test Method for Measurement of Thermal Effusivity of Fabrics Using a Modified Transient Plane Source (MTPS) Instrument. ASTM International: West Conshohocken, PA, USA, 2021.
  28. Shan, J.; Liu, D.; Su, F.; Li, M.; Tian, H.; Guo, M.; Qiao, W.; He, J.; Li, Q.; Qian, J. Anisotropic Structure and Properties of Chitin and Chitosan Nanofibril-Supported Starch Foams. ACS Sustain. Chem. Eng. 2020, 8, 17387–17396. [Google Scholar] [CrossRef]
  29. Feng, J.; Wang, X.; Jiang, Y.; Du, D.; Feng, J. Study on Thermal Conductivities of Aromatic Polyimide Aerogels. ACS Appl. Mater. Interfaces 2016, 8, 12992–12996. [Google Scholar] [CrossRef]
Figure 1. Schematic of sol-gel process stages: heating the solution mixture for sol, RT setting and deep-freezing protocol (DFP) to hydrogel, and solvent exchange (to alcogel) before supercritical drying (SCD) to aerogel. * DFP is not required for sol-gel, but its impact is studied herein.
Macromol 05 00028 g001
Figure 2. Formation of starch aerogel precursor through the sol-gel process followed by retrogradation and solvent exchange. At 60 °C, starch granules swell and rupture, releasing amylose and amylopectin, forming a sol. Over time, these molecules interact, creating a three-dimensional gel network that traps water, forming a hydrogel. The gel is then slowly cooled, allowing amylose and amylopectin chains to reassociate into a semi-crystalline structure through retrogradation. Finally, water in the gel is replaced with ethanol via solvent exchange, resulting in a highly porous aerogel precursor or alcogel.
Macromol 05 00028 g002
Figure 3. Potato starch aerogels (PSAs) and chitin/potato starch blend aerogel (C-PSA). (a) Potato starch under an optical microscope (scale bar 100 µm). (b) Chitin under an optical microscope (scale bar 100 µm). (cg) PSA 1.1–1.5 samples fabricated (Table 2), using alternate sol-gel preparation processes described in Table 1. (hj) C-PSA 1.3, 1.2, and 1.1, respectively (Table 3). The scale bar for aerogel is 10 mm.
Macromol 05 00028 g003
Figure 4. Sample shrinkages (%) after the first two solvent exchange baths and after supercritical drying (SCD). X: No value shown because PSA 1.1 lost all structure after SCD. * Post-SCD shrinkages are reported to show the differences after all water baths were completed and after all ethanol baths were completed.
Macromol 05 00028 g004
Figure 5. C13-NMR spectra of potato starch (top) and PSA 1.5 (bottom). The x-axis shows chemical shifts in ppm (parts per million). Peaks are labeled based on carbon positions and associated functional group environments in the starch structure: (a) ~62 ppm, (C-6, –CH2O-), (b) ~73 ppm, alcohol (C-2, C-3, C-5, –CHOH), (c) ~82 ppm, (C-4, involved in -CO-), and (d) ~101 ppm, ether-linked carbon (C-1, O-C-O). PSA 1.5 shows increased intensity at ~82 ppm, indicating network change after gel formation.
Macromol 05 00028 g005
Figure 6. (Left) adsorption–desorption curves and (right) pore size/volume distribution of aerogel samples PSA 1.1, PSA 1.2, PSA 1.3, PSA 1.4, and PSA 1.5.
Macromol 05 00028 g006
Figure 7. (Left) adsorption–desorption curves and (right) pore size/volume distribution of aerogel samples C-PSA 1.1 (2.5 wt% chitin), 1.2 (5 wt% chitin), and 1.3 (7.5 wt% chitin).
Macromol 05 00028 g007
Figure 8. SEM image of potato starch aerogels: (left) PSA 1.1 showing pore collapse and structural deformation, and (right) PSA 1.5 displaying a more uniform and preserved pore network.
Macromol 05 00028 g008
Figure 9. SEM image of chitin-reinforced potato starch aerogels: (top) lower magnification images of C-PSA with 2.5 wt% chitin (left) and 5.0 wt% chitin (middle), and C-PSA with 7.5 wt% (right); (bottom) higher magnification images of C-PSA with 2.5 wt% chitin (left) and 5.0 wt% chitin (middle), and C-PSA with 7.5 wt% (right).
Macromol 05 00028 g009
Figure 10. (Top) derivative weight vs. temperature curves of PSA 1.1, 1.3, and 1.5 in air (left) and nitrogen (right); (bottom) derivative weight vs. temperature curves of C-PSA 1.0, 1.1, 1.2, 1.3, and chitin in air (left) and nitrogen (right).
Macromol 05 00028 g010
Table 1. Sample solvent exchange bath ethanol/water ratios in percentages. Each bath was applied for 24 h.
SampleDay #1Day #2Day #3–5
PSA 1.1 *DI WaterDI WaterEthanol 100%
PSA 1.2Ethanol 20%Ethanol 40%Ethanol 100%
PSA 1.3Ethanol 40%Ethanol 60%Ethanol 100%
PSA 1.4Ethanol 60%Ethanol 80%Ethanol 100%
PSA 1.5DFP (−20 °C)DFP (−20 °C)Ethanol 100%
* Sample loses structure integrity after supercritical drying.
Table 2. Bulk densities, shrinkage, porosity, and surface area of PSA samples using different water/ethanol solvent baths.
PSA SampleBulk Density
(g/cm3)
Shrinkage
(%)
Porosity
(%)
Surface Area (m2/g)
PSA 1.1N/AN/AN/A17.6
PSA 1.20.34241.077.025.1
PSA 1.30.48243.667.122.8
PSA 1.40.50243.463.921.0
PSA 1.50.15110.091.754.6
Table 3. Bulk density, shrinkage, porosity, and surface area of C-PSA samples utilizing PSA 1.5 solvent bath methods.
SampleChitin (wt%)Starch (wt%)Bulk Density (g/cm3)Shrinkage
(%)
Porosity
(%)
Surface Area, (m2/g)
C-PSA 1.0 *0100.18618.988.9143.6
C-PSA 1.12.57.50.18419.387.2151.6
C-PSA 1.2 **5.05.00.16413.190.290.1
C-PSA 1.37.52.50.1448.192.1150.2
* C-PSA 1.0 and PSA 1.5 are the same formulation; however, C-PSA was heated for longer due to chitin addition. ** Duplicate presented in Supplementary Data (Table S1).
Disclaimer/Publisher’s Note: The statements, opinions and data contained in all publications are solely those of the individual author(s) and contributor(s) and not of MDPI and/or the editor(s). MDPI and/or the editor(s) disclaim responsibility for any injury to people or property resulting from any ideas, methods, instructions or products referred to in the content.

