Abstract
For a better understanding of the previously observed increased natural radioactivity at the confluence of the Varzob and Sioma rivers, Central Tajikistan, the activity concentration of natural radioactive K, Th and U daughters as well as of the anthropogenic Cs were determined in nine locations covering the entire Sioma River. The radiometric determinations evidenced, in addition to increased activity concentrations of Th and U daughter radionuclides, an anomalous accumulation of anthropic Cs and natural Pb in the middle of the Sioma gorge. Complementarily, the mass fractions of natural Th and U determined by instrumental neutron activation analysis evidenced an increased presence of Th and U, which, in some places, overpasses six-times the average mass fraction found in the upper continental crust. The possible influence of active air transport from the southern Tadjik plane during the Afghani storms, as well as the presence of actinide-rich minerals, were analyzed and discussed.
1. Introduction
The Sioma River, a right-bank tributary of the Varzob River, flows into Varzob about 50 km north of the city of Dushanbe, the capital of Tajikistan. The Sioma River Gorge stretches parallel to the Hissar Range in an east–west orientation. The gorge is about 17 km long and rather narrow, its width not exceeding 500 m. It is framed by mountains with snow and glacial peaks 3500–4600 m high, while the gorge altitude varies between 2500–2700 m (Figure 1).
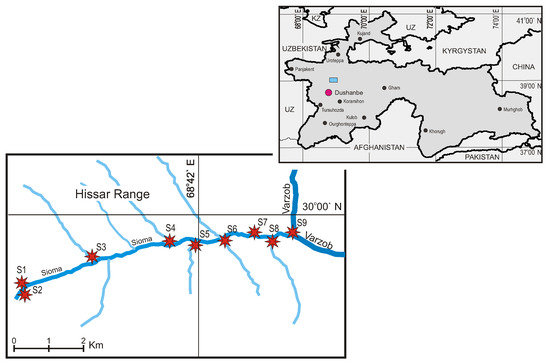
Figure 1.
The locations of sampling points along the Sioma gorge, whose position with respect to Tajikistan is illustrated in the inset. The tributaries of the Sioma River are, in fact, small creeks, the majority without names.
The basin of the Sioma River, in geological terms, belongs to the South Hissar structural-formational zone of Central Tajikistan (Southern Tien Shan Mountains). Its catchment basin occurred in the multi-phase Hissar batholith, composed of various granitoids of the Middle Carboniferous–Early Permian age and broken in places by Early Mesozoic lamprophyre dikes and explosive tubes with alkaline basalts [1]. The climate is cold and temperate, classified as Dfb (continental, dry season, warm summer) according to the Köppen–Geiger classification [2].
The Sioma basin is placed in an area of aerosol deposition by the Afghani dust storms, but due to the steep banks of the gorge and abundant precipitation, dust particles are washed into the river, of the form, in some places, shallow loess soils [3,4]. During the aerosols transport, the large particles and heavy minerals fall out, with the remaining dust being enriched in light minerals, including potassium ones. At the entrance to the Sioma Gorge, there is a sharp change in the direction of the wind, and it licks the surface of the rock, leading to increased fallout of aerosols. At the end of the gorge, winds and dust hit higher rocks, which could also determine an increased aerosol deposition.
Previous studies performed within the Cooperative Transboundary Monitoring Data Sharing and Modeling of Water Resources in Central Asia (NAVRUZ) project [5] have evidenced increased gamma-ray activity along the Varzob River at the confluence of the Sioma and Varzob rivers [6,7]. This finding was analyzed by taking into account the existence of a significant number of former post-Soviet era uranium mines, mainly located in the northern Tajikistan ridges as well in the other neighboring mountainous regions of Central Asian states [8,9,10].
In view of these findings, during the summer season of 2019, this project was organized by the Institute of Water Problems, Hydropower and Ecology of the Academy of Science of Tajikistan. Nine representative samples have been collected from Sioma River sediments for the purpose of radiological studies. High-resolution gamma-ray spectroscopy as well as instrumental neutron activation analysis (INAA) were used to determine the activity concentration of Th and U radioactive daughters as well as the mass fractions of natural Th and U in collected sediments. The final aim of this study consists of realizing a detailed description of the natural radioactivity distribution along the Sioma River evidencing the contribution of local petrology as well as the long distance airborne transport, mainly by the Afghani storms [11].
The results of this project will be further presented and discussed.
2. Materials and Methods
2.1. Sampling
The positions of the sampling points are shown in Figure 1 and presented in Table A1 in Appendix A. It should be noted that due to the fast flow of the water and the granite bed of the river, sometimes it was relatively difficult to collect samples of bottom sediment. At the same time, to increase the sampling accuracy, the distances between collecting points were chosen, when possible, as equal and distributed on both river sides.
Therefore, nine surface sediments samples were collected by means of an AMS 12 Multi-Stage Sediment Sampler (AMS Inc., American Falls, ID, USA) [12]. At each sampling point, three independent samples were collected from an area of about 10 m and mixed together, which resulted in an average specimen. To avoid any cross-contamination, after each operation, sampling tubes were intensively cleaned with water and soaked with paper napkins. Collected sediments of about 1 kg consisting of a silty greyish sand without visible vegetal debris were kept in clean polyethylene bags and transported to the Dushanbe laboratory. Here, the large fragments of rocks and pebbles were removed, and the remaining sedimentary material was air-dried until a constant weight, sieved through a 1 mm (18 mesh) sieve, and stored for future analysis [7,13].
2.2. Radiometric Measurements
Sediment samples, prepared as mentioned before, were poured into 500 cm Marinelli backers, sealed and kept for four weeks to reach the radioactive equilibrium. Keeping the same geometry, the measuring time was 6 h for sediment but increased to 24 h to determine the background contribution in the presence of empty backers.
High-resolution gamma-ray spectrometry was used to determine the activity concentration of anthropogenic Cs, natural K as well as Bi and Pb (Th daughters) and Bi, Pb and Pb (U daughters) (Table A2). All measurements were made using an Extended Range Coaxial Ge Detector (XtRa) with an energy resolution of 1.78 keV for the Co 1.33 MeV line. Gamma spectra were processed by using the GENIE 2000 software. Efficiency calibration, self-absorption correction and coincidence-summing correction were done using the Gunt River sediments of which natural radionuclide activity concentrations were certified both by the National Radiation Laboratories of Kazakhstan and Uzbekistan as well as by the Sandia National Laboratory, USA. A Canberra MGS-6 1030 certified reference material was used to check the measurement accuracy. Under these circumstances, the total uncertainty concerning the activity concentrations was no greater than 7% [7].
2.3. Instrumental Neutron Activation Analysis
The mass fractions of Th and U in the considered sediments were determined by INAA, carried out at the research nuclear reactor of the Institute of Nuclear Physics of the Academy of Sciences of the Republic of Uzbekistan [14] following the same technique presented in [15]. Sediment samples and reference materials weighing about 0.5 g were wrapped in polyethylene bags and irradiated twice at a thermal neutrons fluency density of 5 × 10 neutrons cm s; for 15 s for short living radionuclides and after two weeks for 15 h in the same conditions for the long-living ones.
Spectra calibration was done by using internal reference material by micro-pipetting a determined volume of chloride or nitrate of considered elements on an ash-less filter paper. Zn was used as a secondary reference element. The quality control of all determinations was done by measuring in the same condition the certified reference material IAEA-336 (trace and minor elements in lichen). In these conditions, the combined uncertainty concerning Th and U mass fractions was no greater than 6%.
3. Results and Discussion
The final data concerning the experimentally determined activity concentrations as well as INAA-determined mass fractions of Th and U are reproduced in Table A3 and illustrated as stacked columns in Figure 2a,b (activity concentration, and Th and U mass fractions). For comparison, we have reproduced the mass fractions of Th and U corresponding to the upper continental crust (UCC) [16] too.
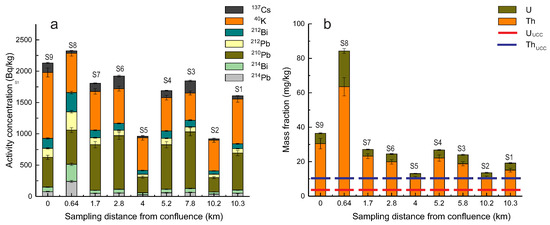
Figure 2.
The activity concentration distribution of the main radioactive natural as well as anthropogenic isotopes (a) and the mass fractions of Th and U (b) along the Sioma valley from the confluence with the Varzob river. For comparison, Th and U mass fractions corresponding to the UCC [16] are illustrated too.
At a more careful analysis of experimental results illustrated in Figure 2a and Table A3, it can be remarked that the K activity concentration presents increased values at the western end of the Sioma Gorge, reaching a maximum of 1060 ± 70 Bq/kg, higher than the UCC average of 870 ± 70 Bq/kg, the last one corresponding to a mass fraction of 2.80% w specific to UCC [16].
In this regard, it is worth mentioning that the K activity concentration presented two peaks; one at the gorge entrance (S1) and the other one at the confluence with the Varzob River (S9), both on the left bank (Table A1 and Table A3, Figure 1). Moreover, it reaches a minimum on the (S2) sampling point, situated on the right bank, in the immediate vicinity of (S1). This peculiarity could be associated with the fallout of dusty aerosols. Indeed, the dust storms known as Afghani [3] originate in the Sahara Desert and fly a long way through the Arabian Peninsula, Iran and Afghanistan. The approximate equality of the K isotope in the samples from the middle part of the gorge suggests the same geological and geochemical origin of the Sioma River soils. In this regard, our results should be considered exploratory, which implies a further detailed analysis based on a significantly higher number of samples.
Other peculiarities concern the mass fraction as well as the activity concentration of Th and U in conjunction with their daughter radionuclide Bi, Pb as well as Bi and Pb, respectively. According to Figure 2a and Table A3, it should be noted their elevated presence in the S8 sampling point. A corresponding sharp increase of Th and U mass fractions, as illustrated by both INAA and radiometric measurements (Figure 2b), excludes, at this point, the possibility of an accidental statistical outlier. To this remark, it should add the fact that Pb activity concentration significantly overpasses, for sediments collected along the entire Sioma valley, those of the Bi and Pb daughters of natural Uranium (Table A3).
On the other hand, Pb activity concentration does not correlate either with Th and U daughter radioactivity or with the K, but only with the anthropogenic Cs one (Table 1). Similar behavior of the Pb activity concentration was previously reported for the entire length of the Varzob River gorge [7], suggesting the presence of an airborne material transported by the Afghani storm. However, regardless of these considerations, only a future detailed investigation of the Rn distribution along Sioma valley could elucidate this finding.

Table 1.
The matrix of Pearson’s (lower diagonal) and Spearman’s (upper diagonal) correlation coefficients of activity concentration distribution of investigated radionuclides. The correlations valid at p < 0.05 are represented in red.
The radiometric results concerning the spatial distribution of Th and U daughter radionuclides, with the exception of Pb, are in good concordance with INAA ones. Accordingly, Th and U mass fractions reached a significant maximum for the S8 sampling point, slowly decreasing upstream. With two exceptions, S2 and S5 sampling points, the mass fraction significantly exceeds the UCC ones of 10.5 and 2.5 mg/kg, respectively [16]. At the same time, the Th/U mass fraction ratio of 4.4 ± 0.8 showed to be closer to 3.9—the characteristic value for the UCC [16] (Table A3).
Concerning Cs, its average activity concentration along the Sioma valley of 100 Bq/kg is significantly higher than the average value of 2 Bq/kg reported for the entirety of Central Asia, which is most probably a remant of the Lop Nur atmospheric nuclear tests [17].
Despite different origins and sources between the activity concentrations of Cs and Pb, there is a good correlation characterized by a Pearson’s correlation coefficient of 0.824 and a corresponding nonparametric Spearman’s correlation coefficient of 0.812, both at p < 0.05 (Table 1). At the same time, between Cs and Pb activity concentrations and the other investigated radionuclides, there are no correlations (Table 1).
The global intercorrelation between investigated elements is well illustrated by the principal component analysis (PCA) result. Indeed, the principal component (PC) 2 vs. PC1 bi-plot documents the existence of four clusters, three of them, i.e., K, Cs,Pb, consist of a single radionuclide, while Pb, Bi, Pb and Bi are grouped together. At the same time, Th as well as U daughters, which, except Pb, make up the same cluster, suggest a correlated distribution of natural Th and U. On the contrary, K, Cs and Pb form distinct individual clusters, and this fact could be explained either by the presence different parent rocks as the case of K or by the existence of some external sources, e.g., dust carried by Afghani storms, such as Cs and partially Pb (Figure 3).
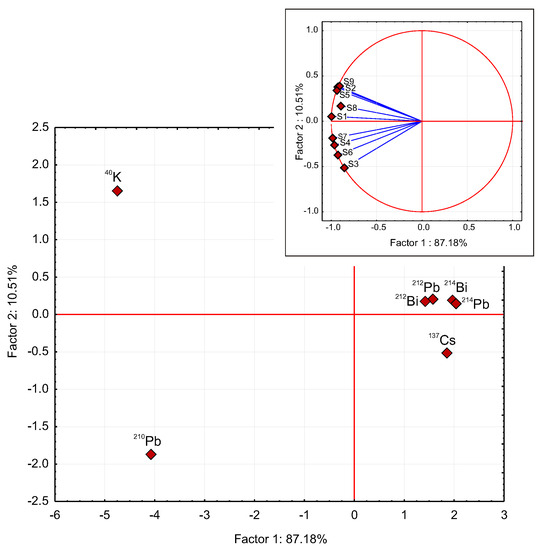
Figure 3.
The result of PCA of the activity concentration of investigated radionuclides.
In this regard, it is of interest to remark that the major contribution to discrimination between all radionuclides comes, in a more or less equal measure, from all sampling points, Factor 1 being responsible for more than 81% of the total variance (Figure 3).
The increased presence of Th and U indicates the existence of some enriched natural actinides deposits or ore occurrences located on the Sioma gorge in the vicinity of sampling point S8. These deposits could be either close to the surface or of high thickness, which is in good correlation with the previously reported data [7,13] concerning natural radioactivity along the Varzob River.
The relative stability along the Sioma River of the Th/U ration of 4.3 ± 0.8, i.e., not far from the characteristic value of 3.9 for the UCC [16], suggests the presence of same type of acid rocks such as granitoids of pegmatites. The last one was found, as mentioned before, in the neighboring Odjuk pegmatite field [7,13]. This observation is sustained by a good correlation between Th and U mass fractions characterized by both Pearson’s and Spearman’s correlation coefficients of 0.969 and 0.778, respectively, at p < 0.05 (Table 1). At the same time, the Th/U ratio, which is almost constant, does not correlate, as expected, with any other radionuclides or elements (Table 1).
4. Concluding Remarks
Gamma ray spectrometry was used to determine the distribution of activity concentration of Th and U daughter radionuclides, i.e., Pb, Bi, and Pb, Bi as well as Pb, respectively, together with K and anthropogenic Cs along the Sioma River, a high mountain tributary of the Varzob River. These results were analyzed in correlation with the Th and U mass fraction distribution as determined by INAA for the same sampling points.
The results showed an increased presence of Th, U and of their daughter radionuclides near the confluence of Sioma and Varzob rivers, attesting the presence of some mineral fractions, most probably pegmatites, such as those existing nearby in the Odjuk River valley.
Quite different was the situation of Cs and Pb of which content was significantly higher than those reported outside the mountainous areas of Tajikistan. In the investigated area, these elements are most probably transported by the local Afghani storms and deposited when the air mass is intercepted by the Hissar range, whose east–west orientation facilitates the aerosol deposition.
Author Contributions
Conceptualization, D.A.A. and O.G.D.; methodology D.A.A. and O.G.D.; software, D.A.A., O.G.D. and D.A.; validation, D.A.A. and O.G.D.; formal analysis, D.A.A. and M.V.F.; investigation, D.A.A. and D.A.; resources, D.A.A.; data curation, D.A.A. and O.G.D.; writing—original draft preparation, D.A.A. and M.V.F.; writing—review and editing, D.A.A., O.G.D. and M.V.F.; visualization, M.V.F. and D.A.A.; supervision, D.A.A. and M.V.F.; project administration, D.A.A.; funding acquisition, D.A.A. All authors have read and agreed to the published version of the manuscript.
Funding
The authors declare no funding.
Institutional Review Board Statement
Not applicable.
Informed Consent Statement
Not applicable.
Data Availability Statement
The data presented in this study are available within the article.
Acknowledgments
O.G.D. wishes to acknowledge their contribution was done within the Cooperation Protocol No. 4290-4-20/22 between the University of Bucharest and the Joint Institute for Nuclear Research, Dubna, Russian Federation. The authors would thank Richard Hoover for his help in revising the manuscript and two anonymous reviewers for their remarks and advice.
Conflicts of Interest
The authors declare no conflict of interest.
Appendix A
Table A1.
Coordinates of sampling points, altitude above sea level (m) and distance to confluence with Varzob River (km).
Table A1.
Coordinates of sampling points, altitude above sea level (m) and distance to confluence with Varzob River (km).
| Sampling Point | Latitude | Longitude | Altitude | Distance | Position |
|---|---|---|---|---|---|
| S1 | 38.9668 | 68.7503 | 2631 | 10.3 | Left bank |
| S2 | 38.9668 | 68.7422 | 2705 | 10.2 | Right bank |
| S3 | 38.9651 | 68.7284 | 2478 | 7.8 | Left bank |
| S4 | 38.9638 | 68.7154 | 2184 | 5.2 | Right-bank |
| S5 | 38.9642 | 68.7014 | 2123 | 4.0 | Left-bank |
| S6 | 38.9561 | 68.6716 | 2057 | 2.8 | Left-bank |
| S7 | 38.9444 | 68.6482 | 1893 | 1.7 | Left-bank |
| S8 | 38.9478 | 68.6467 | 1871 | 0.6 | Right-bank |
| S9 | 38.9683 | 68.7596 | 1751 | 0 | Varzob confluence, left-bank |
Table A2.
The main characteristics of the gamma-ray-emitting isotopes utilized in this study.
Table A2.
The main characteristics of the gamma-ray-emitting isotopes utilized in this study.
| Isotope | Half-Life | -Ray Energy (KeV) | Output % |
|---|---|---|---|
| K | 1.26 × 10 y | 1640 | 11 |
| Cs | 30.17 y | 661 | 85 |
| Pb | 10.6 h | 239 | 47 |
| Bi | 60.6 min | 727 | 6.5 |
| Pb | 28.8 min | 352 | 37 |
| Bi | 19.9 min | 609 | 47 |
| Pb | 20.4 y | 47 | 4 |
Table A3.
The distribution of activity concentration of investigated radionuclides (in Bq/kg) as well as the corresponding mass fractions of Th and U (in mg/kg).
Table A3.
The distribution of activity concentration of investigated radionuclides (in Bq/kg) as well as the corresponding mass fractions of Th and U (in mg/kg).
| Sampling Point | K | Cs | Pb | Bi | Pb | Bi | Pb | Th | U | Th/U |
|---|---|---|---|---|---|---|---|---|---|---|
| S1 | 710 ± 50 | 53 ± 3 | 71 ± 5 | 78 ± 7 | 51 ± 3 | 51 ± 3 | 590 ± 38 | 15.1 ± 1.1 | 4.1 ± 0.3 | 3.7 ± 0.4 |
| S2 | 490 ± 35 | 21 ± 2 | 54 ± 3 | 52 ± 4 | 37 ± 3 | 35 ± 3 | 230 ± 9 | 10.7 ± 0.9 | 2.9 ± 0.3 | 3.7 ± 0.5 |
| S3 | 430 ± 30 | 195 ± 13 | 80 ± 8 | 106 ± 8 | 64 ± 4 | 64 ± 4 | 900 ± 55 | 18.8 ± 1.2 | 5.2 ± 0.4 | 3.6 ± 0.4 |
| S4 | 530 ± 35 | 113 ± 7 | 102 ± 7 | 117 ± 10 | 59 ± 4 | 56 ± 4 | 710 ± 42 | 22.1 ± 1.8 | 4.7 ± 0.3 | 4.7 ± 0.5 |
| S5 | 520 ± 30 | 24 ± 2 | 45 ± 3 | 61 ± 6 | 27 ± 2 | 32 ± 2 | 250 ± 15 | 10.7 ± 0.7 | 2.4 ± 0.2 | 4.5 ± 0.5 |
| S6 | 550 ± 40 | 200 ± 12 | 88 ± 4 | 109 ± 8 | 55 ± 4 | 59 ± 4 | 860 ± 55 | 19.9 ± 1.3 | 4.6 ± 0.3 | 4.3 ± 0.4 |
| S7 | 620 ± 40 | 130 ± 7 | 111 ± 9 | 118 ± 10 | 49 ± 3 | 49 ± 3 | 730 ± 35 | 23.2 ± 1.4 | 3.9 ± 0.3 | 5.9 ± 0.6 |
| S8 | 630 ± 40 | 37 ± 3 | 293 ± 21 | 306 ± 25 | 240 ± 15 | 274 ± 19 | 550 ± 30 | 63.5 ± 5.3 | 20.8 ± 1.4 | 3.1 ± 0.3 |
| S9 | 1060 ± 70 | 150 ± 9 | 143 ± 11 | 159 ± 11 | 77 ± 4 | 72 ± 5 | 480 ± 30 | 30.5 ± 3.0 | 6.0 ± 0.3 | 5.1 ± 0.6 |
| Average | 4.4 ± 0.8 |
References
- Central Asian Geoportal, Geoportal of Tajikistan, Key Features of Geological Structure and Tajikistan’s Metallogeny. Available online: https://www.geoportal-tj.org/index.php/geology (accessed on 2 March 2021).
- Peel, M.C.; Finlayson, B.L.; McMahon, T.A. Updated world map of the Köppen-Geiger climate classification. Hydrol. Earth Syst. Sci. 2007, 11, 1633–1644. [Google Scholar] [CrossRef]
- Middleton, N.J. A geography of dust storms in South-West Asia. J. Climatol. 1986, 6, 183–198. [Google Scholar] [CrossRef]
- Indoitu, R.; Orlovsky, L.; Orlovsky, N. Dust storms in Central Asia: Spatial and temporal variations. J. Arid Environ. 2012, 85, 62–70. [Google Scholar] [CrossRef]
- Barber, D.S.; Betsil, J.D.; Mohagheghi, A.H.; Passel, H.D.; Yuldashev, B.S.; Salikhbaev, U.S.; Djuraev, A.A.; Vasiliev, I.; Solodukhin, V. The NAVRUZ experiment: Cooperative monitoring for radionuclides and metals in Central Asia transboundary rivers. J. Radioanal. Nucl. Chem. 2005, 263, 213–218. [Google Scholar] [CrossRef]
- Yuldashev, B.S.; Salikhbaev, U.S.; Kist, A.A.; Radyuk, R.I.; Barber, D.S.; Passell, H.D.; Betsill, J.D.; Matthews, R.; Vdovina, E.D.; Zhuk, L.I.; et al. Radioecological monitoring of Transboundary Rivers of the Central Asian Region. J. Radioanal. Nucl. Chem. 2005, 263, 219–228. [Google Scholar] [CrossRef]
- Abdushukurov, D.A.; Abdusamadzoda, D.; Djuraev, A.A.; Duliu, O.G.; Frontaseva, M.V. Distribution of radioactive isotopes in the mountain and piedmont regions of Central Tajikistan Varzob river valley. J. Radioanal. Nucl. Chem. 2018, 318, 1873–1879. [Google Scholar] [CrossRef]
- Lind, O.C.; Stegnar, P.; Tolongutov, B.; Rosseland, B.O.; Strømman, G.; Uralbekove, B.; Usubalieva, A.; Solomatina, A.; Gwynn, J.P.; Lespukh, E.; et al. Environmental impact assessment of radionuclide and metal contamination at the former U site at Kadji Say, Kyrgyzstan. J. Environ. Radioact. 2013, 23, 37–44. [Google Scholar] [CrossRef] [PubMed]
- Skipperud, L.; Strømman, G.; Yunusov, M.; Stegnar, P.; Uralbekov, B.; Tilloboev, H.; Zjazjev, G.; Heier, L.S.; Rosseland, B.O.; Salbu, B. Environmental impact assessment of radionuclide and metal contamination at the former U sites Taboshar and Digmai, Tajikistan. J. Environ. Radioact. 2013, 123, 50–56. [Google Scholar] [CrossRef] [PubMed]
- Salbu, B. Preface: Uranium mining legacy issue in Central Asia. J. Environ. Radioact. 2013, 123, 1–3. [Google Scholar] [CrossRef] [PubMed]
- Abdullaev, S.F.; Sokolik, I.N. Main characteristics f dust storm sand their radiative impacts: With a focus on Tajikistan. J. Atm. Sci. Res. 2019, 2, 1–21. [Google Scholar] [CrossRef]
- AMS Sampler. Available online: www.ams-samplers.com/hand-tooling/sludge-and-sediment-samplers/sludge-and-sediment-samplers.html (accessed on 3 March 2021).
- Abdusamadzoda, D.; Abdushukurov, D.D.; Zinicovscaia, I.; Duliu, O.G.; Vergel, K.N. Assessment of the ecological and geochemical conditions in surface sediments of the Varzob river, Tajikistan. Microchem. J. 2020, 158, 105173. [Google Scholar] [CrossRef]
- ISTC. Available online: https://istc.int/en/institute/20513 (accessed on 30 March 2021).
- Abdusamadzoda, D.; Abdushukurov, D.A.; Duliu, O.G.; Zinicovscaia, I. Assessment of the toxic metals pollution of soil and sediment in Zarafshon valley, Northwest Tajikistan (part II). Toxics 2020, 8, 113. [Google Scholar] [CrossRef] [PubMed]
- Rudnick, R.L.; Gao, S. Composition of the continental crust. In Treatise on Geochemistry; Holland, H.D., Turekian, K.K., Eds.; Elsevier-Pergamon: Oxford, UK, 2004; p. 63. [Google Scholar]
- Available online: https://web.archive.org/web/20140107163417/http://rdss.info/ (accessed on 23 April 2021).


Publisher’s Note: MDPI stays neutral with regard to jurisdictional claims in published maps and institutional affiliations. |
© 2021 by the authors. Licensee MDPI, Basel, Switzerland. This article is an open access article distributed under the terms and conditions of the Creative Commons Attribution (CC BY) license (https://creativecommons.org/licenses/by/4.0/).