Abstract
Background: Systemic lupus erythematosus (SLE) is a multifactorial autoimmune disease in which cytotoxic T cells contribute to tissue damage through dysregulated effector pathways. CD107a (LAMP-1) serves as a functional marker of CD8+ T-cell degranulation and may reflect disease-related alterations in cytotoxicity. Objective: To investigate the expression of CD107a on cytotoxic T cells in SLE patients and evaluate its relationship with disease activity and immunological features. Methods: Demographic, hematological, and immunological profiles of SLE patients and controls were compared. Flow cytometry was used to evaluate CD3+, CD3+CD8+, CD4+, double-negative T cells, and CD107a+CD8+ subsets. Correlations with disease activity and diagnostic performance were assessed. Results: SLE patients showed anemia, thrombocytopenia, and lymphopenia compared with controls. Immunophenotyping revealed significantly elevated CD3+CD8+, CD107a+CD8+ T cells in SLE, and reduced CD4+ counts. While CD107a+CD8+ levels were strongly elevated, they did not correlate with disease activity scores, suggesting persistent upregulation of CD107a expression independent of clinical severity. ROC curve analysis indicated that CD3+ and CD3+CD8+ subsets had diagnostic utility, while double-negative T cells showed additional value. Conclusion: SLE is associated with increased CD107a+CD8+ T cells, reflecting heightened basal expression of this degranulation marker regardless of disease activity level. These findings underscore the role of altered cytotoxic T-cell function in SLE immunopathogenesis and support CD107a as a potential biomarker of immune dysregulation.
1. Introduction
Systemic lupus erythematosus (SLE) is a chronic autoimmune disease with devastating multiorgan involvement. Inflammation occurs due to immunologic aberrations involving both the innate and adaptive immune systems [1]. The disease has a global distribution, with overall prevalence ranging from 3.2/100,000 in India to 517.5/100,000 among Afro-Caribbean people living in the United Kingdom [2]. However, SLE varies in prevalence, severity, and clinical course across different populations.
In Egypt, the national prevalence of adult SLE was estimated at 6.1 per 100,000 (1.2 per 100,000 in males vs. 11.3 per 100,000 in females), while childhood-onset SLE was reported at approximately 1 per 100,000 (0.24 in males vs. 1.8 in females) [3,4]. Despite this relatively modest prevalence compared with some other regions, Egyptian patients frequently present with severe systemic manifestations, including lupus nephritis and neuropsychiatric involvement, which contribute substantially to morbidity and mortality. These features highlight the importance of studying immune mechanisms in Egyptian patients to better understand disease pathogenesis and improve management strategies [5].
Traditionally, research in SLE has focused on B-cell autoimmunity, autoantibody profiles, and abnormalities in CD4+ T-cell regulation. However, growing evidence suggests that cytotoxic CD8+ T-cells also play a key role in disease progression. Activated CD8+ T-cells infiltrate inflamed organs, particularly the kidney in lupus nephritis, where they correlate with tissue damage and poor prognosis. Despite this, cytotoxic T-cell function in SLE remains underexplored, particularly in Middle Eastern and North African populations [6].
Cytotoxic lymphocytes, including CD8+ T-cells and natural killer (NK) cells, eliminate target cells through directed degranulation of lytic vesicles containing perforin and granzymes. During this process, lysosomal-associated membrane protein-1 (LAMP-1, CD107a) is translocated to the cell surface, where it serves as a reliable marker of degranulation and cytotoxic activity. CD107a expression not only provides a functional readout of granule release but also facilitates perforin delivery and protects effector cells from self-damage [7]. Moreover, CD107a is required for efficient perforin delivery into lytic granules, and its disruption leads to impaired cytotoxic function [8]. Altered CD107a expression on CD8+ T-cells has also been reported in SLE, correlating with higher disease activity and renal involvement [9], but its expression in intrarenal CD8+ cells remains to be fully elucidated.
In Egypt, most studies on SLE have relied on conventional laboratory parameters such as autoantibodies, complement levels, and inflammatory cytokines, with very limited attention to cytotoxic markers. For instance, research exploring biomarkers in Egyptian SLE patients has focused on cytokine expression, like interleukin-36α, and broad T-cell subset distributions, but none have assessed CD8+ T-cell degranulation activity or CD107a expression [10]. No studies to date have systematically evaluated CD107a expression in Egyptian patients. Given the high disease burden, severe clinical presentation, and the clear gap in cellular immunology research, investigating CD107a expression could provide valuable insights into disease pathogenesis, identify potential prognostic markers, and contribute to tailoring immunomodulatory therapies in this population.
2. Materials and Methods
2.1. Ethical Statement
The study adhered strictly to the Research Ethics Committee guidelines at Suez Canal University, with ethical approval granted under reference code #5136. Patient recruitment, control data handling, and participants’ rights and privacy were carefully protected throughout the study. Written informed consent was obtained from all participants prior to sample and data collection.
2.2. Study Participants
This cross-sectional controlled study included forty patients with systemic lupus erythematosus (SLE) and forty healthy controls. Patients were recruited from the Rheumatology and Rehabilitative Medicine outpatient clinic at Suez Canal University Hospitals, Ismailia, Egypt, while controls were obtained from the hospital blood bank. All participants were adults (>18 years old) of both sexes. SLE was diagnosed according to the Systemic Lupus International Collaborating Clinics (SLICC) criteria [11]. Exclusion criteria ruled out patients with other autoimmune diseases (e.g., rheumatoid arthritis, multiple sclerosis, Sjögren’s syndrome), chronic infections (e.g., hepatitis B, hepatitis C, tuberculosis), or chronic illnesses such as diabetes mellitus. Healthy controls had no history of autoimmune disease, chronic infection, or systemic illness. Written informed consent was obtained from all participants according to the Declaration of Helsinki, and the study protocol was approved by the Suez Canal University Faculty of Medicine Ethics Committee.
Each participant underwent a full clinical history assessment and a detailed rheumatological examination performed by a rheumatologist. Disease activity among patients was assessed using the Systemic Lupus Erythematosus Disease Activity Index (SLEDAI) [12,13].
2.3. Biochemical Analysis
Basic laboratory investigations were performed for all participants, including complete blood count, urine analysis, complement levels (C3 and C4), and autoantibody tests (ANA and anti-dsDNA). Peripheral venous blood samples (5 mL) were collected under aseptic conditions from each participant. Three milliliters were allowed to clot at room temperature, centrifuged, and the separated serum aliquots were stored at −20 °C until use. The remaining two milliliters were collected in EDTA tubes for complete blood count and flow cytometric analysis.
These serum samples were used to measure complement levels (C3 and C4) using, COBAS e411 Analyzer (Roche Diagnostics GmbH, Mannheim, Germany). while autoantibody tests, including ANA and anti-dsDNA, were assessed by indirect immunofluorescence assay. The remaining two milliliters of blood were collected into EDTA tubes and used for complete blood count analysis, performed with a Sysmex XT Automated Cell Counter (Sysmex Corporation, Kobe, Japan), and for flow cytometry analysis. In addition, urine samples were analyzed by dipstick testing for proteinuria and by microscopic examination for hematuria or casts. Laboratory results were obtained from patient records when available, and any missing data were reanalyzed as required using standard hospital protocols.
2.4. Flow Cytometric Analysis
Flow cytometry was performed to assess cytotoxic T lymphocyte degranulation. In brief, two tubes were prepared for each sample (unstained control and antibody-stained). One hundred microliters of fresh EDTA blood were incubated with BD Simultest™ Anti-Human CD3-FITC/CD8-PE and PE-Cy™5 Mouse Anti-Human CD107a (BD Pharmingen, San Diego, CA, USA) for 20 min at room temperature in the dark. Red blood cells were then lysed with BD FACS™ Lysing Solution (10× Concentrate), vortexed gently, and incubated for 10 min. After centrifugation, the supernatant was discarded, and the cell pellet was washed twice with phosphate-buffered saline (PBS) before being resuspended in 500 µL PBS. Data acquisition was carried out on a NAVIOS™ Flow Cytometer (Version 1.5, Beckman Coulter GmbH, Krefeld, Germany), and analysis was performed using Kaluza C Analysis Software (Version 2.1, Beckman Coulter). For data analysis, lymphocytes were first gated according to forward and side scatter parameters, and T cells were identified within the CD3+ population. Cytotoxic T cells were defined as CD3+/CD8+ events, and their degranulation capacity was assessed by surface expression of CD107a (LAMP-1). The total number of acquired events was automatically determined by the flow cytometer, and a minimum of 10,000 gated lymphocyte events per sample were recorded to ensure statistical accuracy. Percentages of CD3+, CD8+, and CD107a+ cells were calculated relative to the total gated lymphocyte population. Back gating was used to confirm the staining pattern and validate the gating strategy [9].
2.5. Selection of the Pathway
To identify the biological processes related to cytotoxicity-associated genes (CD107a/LAMP-1, CD8A, CD8B, PRF1, GZMB, and NKG7), pathway enrichment analysis was performed. Gene ontology (GO) functional enrichment and pathway analysis were carried out using the Reactome Pathway Database (https://reactome.org) (accessed 1 September 2025). The Kyoto Encyclopedia of Genes and Genomes (KEGG) (https://www.genome.jp/kegg/mapper.html) (accessed 1 September 2025), Pathways with a false discovery rate (FDR) < 0.05 were considered significant [14].
2.6. In Silico Enrichment Bioinformatics Analysis
Differentially expressed genes (DEGs) associated with systemic lupus erythematosus (SLE) were identified from the publicly available microarray dataset GSE10325 (Gene Expression Omnibus, GEO). Gene expression data were analyzed using the GEO2R tool (https://www.ncbi.nlm.nih.gov/geo/query/acc.cgi) (accessed 1 September 2025), applying an adjusted p-value < 0.05 and |log2 fold change| ≥ 1 as the selection criteria. The insilico structural and functional analyses of the selected DEGs were then conducted using multiple bioinformatics tools. Protein–protein interaction (PPI) networks and co-expression analyses were generated through the STRING database (https://string-db.org/, version 12.0) (accessed 1 September 2025), with a confidence score threshold of 0.7 applied to ensure high reliability of interactions. In these networks, nodes represented proteins and edges represented predicted functional associations [14]. Enriched pathways were subsequently explored using KEGG Mapper to highlight immune-related signaling cascades, including the T-cell receptor signaling, NK-cell mediated cytotoxicity, and systemic lupus erythematosus pathways. Reactome analysis further supported enrichment in antigen processing and presentation, apoptosis, and cytotoxicity-related pathways. All databases and tools were last accessed in August 2025.
2.7. Data Analysis
The Shapiro–Wilk test was applied to assess the normality of data distribution at a significance level of 0.05. Descriptive statistics were expressed as mean, standard deviation, median, interquartile range (IQR), and range (minimum–maximum), while categorical data were presented as frequencies and percentages. For inferential statistics, the chi-square test was used to compare categorical variables between groups. For quantitative variables, Student’s t-test was applied to parametric data, while the Mann–Whitney U test was employed for non-parametric data. Spearman’s rank correlation coefficient was used to explore correlations between abnormally distributed quantitative variables. All statistical analyses were performed using the Statistical Package for the Social Sciences (SPSS) software, version 20.0 (IBM Corp., Armonk, NY, USA, released 2011). The level of statistical significance was set at p < 0.05.
3. Results
3.1. In Silico Data Analysis
3.1.1. KEGG and Reactome Pathway Enrichment Analysis
KEGG and Reactome pathway enrichment analyses were conducted to explore the functional context of the cytotoxicity-related genes investigated in this study. The analyses revealed enrichment of immune-related signaling pathways, including the T-cell receptor signaling and natural killer cell–mediated cytotoxicity pathways, both of which are functionally associated with CD107a (LAMP-1) expression and cytotoxic T-cell activity. To maintain focus on the experimental findings, detailed enrichment maps and pathway lists have been moved to the Supplementary Material (Supplementary Figures S1 and S2, Supplementary Table S1). The in silico results support the subsequent flow cytometric analyses, providing a broader mechanistic framework for the observed alterations in CD107a expression.
3.1.2. Protein–Protein Interaction (PPI) Network Analysis
Analysis of the cytotoxicity-related gene set (CD107a, CD8A, CD8B, PRF1, GZMB, and NKG7) revealed a highly interconnected PPI network (Figure 1A). CD8A and CD8B clustered tightly, reflecting their co-receptor function in T-cell receptor signaling. PRF1 and GZMB formed a functional module related to cytolytic effector activity, while NKG7 showed strong links with PRF1 and GZMB, consistent with its role in cytotoxic granule exocytosis. LAMP1 (CD107a) was also connected within this cytotoxic module, reflecting its role in degranulation.
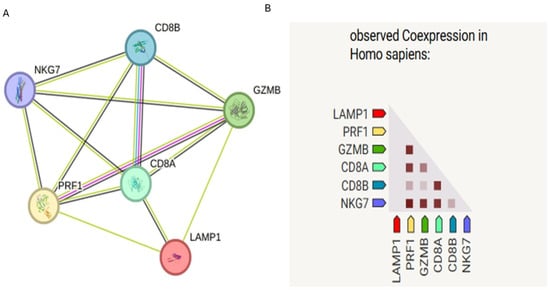
Figure 1.
STRING protein–protein interaction (PPI) network of cytotoxicity-related genes (CD107a, CD8A, CD8B, PRF1, GZMB, and NKG7). (A) Nodes represent proteins, and edges represent predicted functional associations (confidence score ≥ 0.7). (B) Co-expression analysis of the same cytotoxicity-related gene set within STRING, darker shades indicate stronger co-expression.
STRING co-expression analysis of the same gene set revealed varying degrees of transcriptional correlation (Figure 1B). While strong co-expression was observed between PRF1, GZMB, and NKG7—as expected for key cytotoxic effectors—LAMP1 showed relatively weaker co-expression with other genes in the network. This suggests that although LAMP1 plays a functional role in cytotoxic degranulation, its transcriptional regulation may be somewhat independent or differentially modulated compared to other cytotoxic effectors.
3.2. Flow Cytometry Gating Strategy
The gating strategy used for identification of CD107a+ cytotoxic T cells is shown in (Figure 2). Representative dot plots illustrate the sequential gating steps: (Figure 2A) lymphocytes were first identified based on forward scatter (FS) and side scatter (SS) characteristics; (Figure 2B) T cells were then gated as CD3+ events; (Figure 2C) within the CD3+ population, cytotoxic T cells were defined as CD3+/CD8+ double-positive cells; and (Figure 2D) degranulating cytotoxic T cells were subsequently identified as CD8+/CD107a+ double-positive populations. A minimum of 10,000 gated lymphocyte events were acquired per sample to ensure statistical reliability, and percentages were calculated relative to the total gated lymphocyte population. Back gating was applied to confirm the staining pattern and validate the gating strategy.
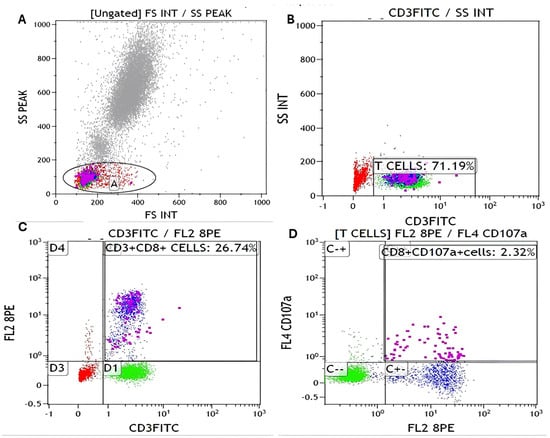
Figure 2.
Flow cytometry analysis of CD8+/CD107a+ T cells. (A) Gate A (black circle) defines the lymphocyte population based on FSC/SSC characteristics. (B) From Gate A, CD3+ T cells (purple dots) were identified (71.19%). (C) Within the CD3+ population, CD8+ T cells (blue dots) were gated (26.74%). (D) CD8+CD107a+ cells (pink dots) (2.32%) were identified from the CD8+ T cell gate. Red dots represent non-T-cell populations, green dots indicate negative or control populations, and black circles outline the gated regions used for population selection. All percentages are expressed relative to the initial lymphocyte gate (Gate A in panel (A)).
3.3. Demographic Characteristics of SLE Patients and Controls, and Baseline
The demographic and baseline characteristics of SLE patients and controls are summarized. The groups were comparable in age and sex distribution. Patients exhibited moderate disease activity with diverse clinical manifestations reflecting multisystem involvement. Serological evaluation confirmed autoimmune activity with prevalent ANA and anti-dsDNA positivity and frequent complement consumption. Treatment patterns indicate that all patients received standard-of-care therapy, with additional immunosuppressive medications used according to disease severity as shown in Table 1.

Table 1.
Demographic characteristics of SLE patients and controls, and baseline clinical, serological, and treatment profile of patients.
The hematological profile of the studied groups is shown in Table 2. SLE patients demonstrated significantly lower hemoglobin, RBC count, platelet count, and absolute lymphocyte counts compared to controls, indicating mild anemia, thrombocytopenia, and lymphopenia common in autoimmune conditions. Other parameters, including hematocrit, total WBC count, differential percentages of lymphocytes, MID, and neutrophils, were not significantly different between patients and controls, suggesting that overall leukocyte distribution was largely preserved.
Table 2.
Hematological profile of the studied groups: complete blood count, lymphocyte, MID, and neutrophil parameters.
3.4. T-Cell Subsets and CD107a+CD8+ Expression in SLE Patients and Controls
Analysis of T-cell subsets and CD107a+CD8+ expression is presented in Table 3. SLE patients exhibited significantly higher percentages and absolute counts of CD3+CD8+ T cells, CD107a+CD8+ cells, and double-negative T cells (DNT) compared to controls, indicating increased cytotoxic T-cell representation and elevated basal CD107a expression. In contrast, CD3+CD4+ percentages, and absolute counts were significantly lower. Total CD3 percentages were also elevated, whereas absolute total CD3 counts were comparable between groups.
Table 3.
Comparison between the Two Studied Groups according to CD Subsets and CD107a+CD8+ Expression.
Although CD107a+CD8+ expression represents a functional marker of cytotoxic T-cell activity, no significant correlation was observed with SLEDAI scores (r = 0.118, p = 0.394 and r = 0.110, p = 0.500) as shown in (Figure 3). This indicates that CD107a+CD8+ expression in SLE patients may reflect a persistent activation state rather than dynamic changes in disease activity.
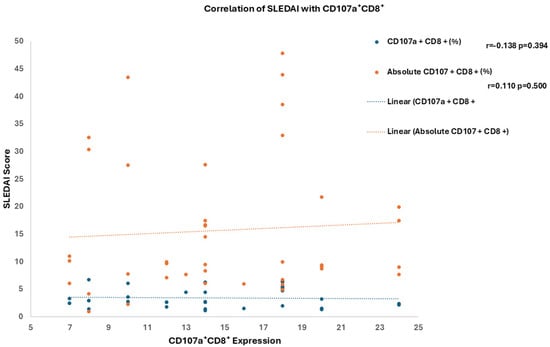
Figure 3.
Correlation of SLEDAI Score with CD107a+CD8+ Expression.
Within the correlation matrix in (Figure 4), absolute CD107a+CD8+ counts showed a strong positive correlation with absolute CD8+ T-cell numbers (r = 0.69), consistent with the dependence of CD107a expression levels on CD8+ cell availability. A moderate positive correlation was also observed with absolute lymphocyte counts (r = 0.63). In contrast, both CD107a+CD8+% and absolute counts showed no meaningful correlation with SLEDAI, highlighting that while basal CD107a upregulation parallels CD8+ cell expansion, it does not directly reflect clinical disease activity.
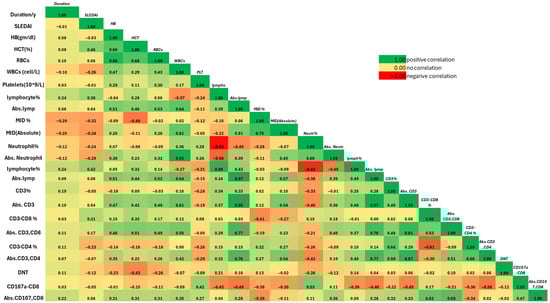
Figure 4.
Correlation Matrix of Clinical, Hematological, and Immunological Parameters in the Diseased Group.
ROC curve analysis in (Figure 5) and Table S2 was performed to determine optimal cutoffs for the immunophenotypic markers of cytotoxic T cells in SLE patients. Among the studied markers, CD3+% showed a cutoff of 79.44% with high specificity (97.5%) but low sensitivity (45%), indicating it is more reliable for confirming T-cell presence rather than detecting all patients. CD3+CD8+% demonstrated moderate performance (cutoff 33.65%, sensitivity 55%, specificity 45%, AUC 0.738, p < 0.001), reflecting its potential role in identifying expanded cytotoxic T-cell subsets.
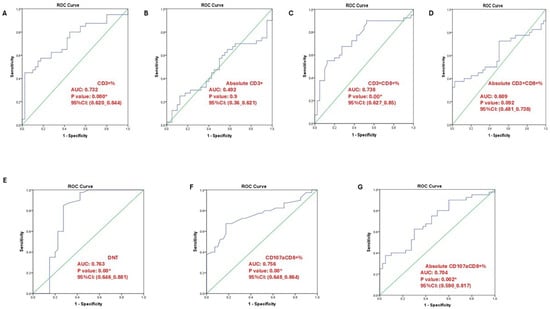
Figure 5.
ROC curve analysis illustrating the diagnostic performance of different T-cell subsets. (A) CD3⁺% (AUC = 0.732, p = 0.000); (B) absolute CD3⁺ count (AUC = 0.492, p = 0.900); (C) CD3⁺CD8⁺% (AUC = 0.738, p = 0.000); (D) absolute CD3⁺CD8⁺ count (AUC = 0.609, p = 0.092); (E) double-negative T cells (DNT; AUC = 0.763, p = 0.000); (F) CD107a⁺CD8⁺% (AUC = 0.756, p = 0.000); (G) absolute CD107a⁺CD8⁺ count (AUC = 0.704, p = 0.020). An asterisk (*) indicates statistically significant results at p < 0.05 *.
Absolute counts of CD3+ and CD3+CD8+ cells showed lower discriminatory ability (AUC 0.492 and 0.609, respectively), suggesting percentage-based analysis may better reflect functional T-cell alterations in SLE. Notably, double-negative T cells (DNTs) had the highest diagnostic performance, with a cutoff of 4.45%, sensitivity 85%, specificity 72%, and AUC 0.763, supporting their relevance as a sensitive marker of T-cell dysregulation in active disease.
Markers of cytotoxic activity, CD107a+CD8+% and absolute counts, also distinguished SLE patients from controls, with CD107a+CD8+% showing higher sensitivity (68%) but low specificity (18%), highlighting its potential utility in detecting increased basal CD107a expression, consistent with our LAMP-1-based immunophenotyping approach.
3.5. Association of T-Cell Subsets with Clinical and Laboratory Features of SLE
Table S3 compares T-cell subsets (CD107a+CD8+, CD3, CD3+CD8+, CD3+CD4+) across different clinical and laboratory features in SLE patients. Most clinical manifestations, including nephritis, photosensitivity, rash types, and serological markers, showed no significant differences in T-cell subset distribution. However, several notable associations were observed. Discoid rash was associated with significantly higher absolute CD3 (p = 0.002) and CD3+CD4+ (p = 0.003) counts. Hematological abnormalities were linked to reduced absolute CD3 (p = 0.039) and CD3+CD8+ (p = 0.006) counts. CNS involvement showed a significantly lower percentage of CD107a+CD8+ cells (p = 0.016). Proteinuria was associated with reduced absolute CD3+CD8+ counts (p = 0.008), while leucopenia was accompanied by significant reductions in absolute CD3 (p = 0.009) and CD3+CD8+ (p = 0.015) counts. This suggests that while basal CD107a expression on CD8+ T cells does not vary widely across most SLE features, specific clinical manifestations such as hematological abnormalities, CNS involvement, and discoid rash are associated with significant alterations in T-cell subset distributions, underscoring their potential relevance to SLE immunopathogenesis.
4. Discussion
The enrichment of T-cell receptor, NK cell–mediated cytotoxicity, and antigen-processing pathways strongly suggests that cytotoxic lymphocytes remain central drivers of immune imbalance in SLE. Prior studies have reported impaired CD8+ T-cell cytotoxicity in SLE patients, often linked to defective perforin and granzyme expression, which correlates with disease activity and tissue injury [15,16]. Our findings extend this knowledge by showing that CD8A, CD8B, PRF1, GZMB, and NKG7 form a tightly interconnected module with CD107a, indicating that the dysfunction is network-based rather than limited to individual molecules. In line with earlier observations that aberrant cytotoxic activity can promote inflammation through secondary necrosis and the release of danger-associated molecular patterns (DAMPs) [17].
Consistent with this concept, CD107a (LAMP-1) has been widely validated as a marker of cytotoxic T lymphocyte (CTL) degranulation, reflecting the exocytosis of lytic granules containing perforin (PRF1) and granzyme B (GZMB). Experimental studies have demonstrated that CD107a+/CD8+ T cells display significantly higher expression of PRF1 and GZMB compared with CD107a−/CD8+ subsets, confirming their stronger cytolytic potential [8,18]. In our in silico STRING co-expression analysis, LAMP1 exhibited strong connectivity with PRF1, GZMB, and NKG7, supporting this coordinated transcriptional regulation and aligning with the known biology of active CTL degranulation.
In our study, basal CD107a expression was significantly elevated on CD8+ T cells in SLE patients, yet we did not directly assess their cytotoxic function. Elevated basal CD107a may indicate that these cells are chronically activated, potentially reflecting a compensatory response to ongoing immune dysregulation. However, persistent stimulation in the context of SLE could also lead to functional exhaustion, as reported in studies of chronic autoimmune inflammation [9,19,20]. Therefore, while the cells display increased degranulation potential, this does not necessarily imply enhanced cytotoxic activity. Our findings suggest that basal CD107a expression may serve as a marker of sustained immune perturbation rather than a direct indicator of effective cytotoxicity, highlighting the complex functional state of CD8+ T cells in SLE. Future studies incorporating functional assays, such as target cell killing or cytokine production, are warranted to clarify the precise effector capabilities of these cells.
Our enrichment of apoptosis- and pyroptosis-related pathways suggests a mechanism by which defective cytotoxic lymphocytes could amplify innate immune activation in lupus. Although LAMP-1 (CD107a) is not explicitly annotated in Reactome, its established role as a surface marker reflecting cytotoxic T-cell degranulation status [21] supports its functional integration into this cytotoxicity network. Thus, altered CD107a expression in SLE may not only reflect impaired killing capacity, as previously reported [22], but may also mark a broader dysregulation of effector and death pathways that bridge adaptive and innate immunity.
Our bioinformatics analysis highlighted that CD107a is part of a broader cytotoxicity network that is chronically upregulated in SLE patients. This persistent activation may reflect a compensatory mechanism, where CD8+ T cells are chronically stimulated to maintain immune surveillance despite impaired effector function. Alternatively, sustained network upregulation could be a marker of ongoing immune dysregulation, potentially contributing to tissue damage over time. It is also plausible that these cells are in a partially exhausted state, where degranulation machinery remains active (as reflected by elevated CD107a) but overall cytotoxic function is impaired [9,19,23]. These interpretations integrate our ex vivo findings with the in silico network data, suggesting that chronic cytotoxic pathway activation is a feature of SLE pathogenesis and may serve as a biomarker for persistent immune perturbation rather than acute disease activity. Further studies combining functional assays with network-level analyses will be required to delineate the precise role of this cytotoxicity network in disease progression.
The demographic and baseline characteristics of SLE patients and controls were broadly comparable, with patients exhibiting moderate disease activity and diverse multisystem manifestations. Serological evaluation confirmed autoimmune activity with prevalent ANA and anti-dsDNA positivity and frequent complement consumption, in line with previous reports on the immunological hallmarks of SLE [24]. Hematological abnormalities, particularly anemia, thrombocytopenia, and lymphopenia, were significantly more frequent in patients compared to controls. These findings are consistent with earlier studies demonstrating that lymphopenia is one of the most common hematological abnormalities in SLE and is linked to disease activity and immune dysregulation [24,25]. Our results demonstrated that absolute lymphocyte counts were significantly reduced, while the distribution of neutrophils and monocytes (MID) was preserved. Similar patterns have been described, where type I interferon signaling was shown to drive alterations in lymphocyte subsets while sparing neutrophil distribution [26]. This suggests that lymphopenia in SLE is not merely a byproduct of general cytopenias but reflects disease-specific immune perturbation.
The influence of immunosuppressive treatment on T-cell function is an important consideration. Most patients in our cohort were receiving corticosteroids and/or immunosuppressive agents such as azathioprine or mycophenolate mofetil, which may modulate cytotoxic T-cell degranulation and CD107a expression. Therefore, the elevated basal CD107a+CD8+ levels observed here may represent the residual activation state of cytotoxic T cells under treatment, rather than untreated disease activity. Future studies should stratify patients according to treatment regimens and disease stage to better define the independent effects of therapy on CD107a expression.
Analysis of T-cell subsets revealed several noteworthy associations. While overall CD107a+CD8+ expression was not broadly different across most clinical features, CNS involvement was significantly associated with reduced percentages of CD107a+CD8+ cells. This observation agrees with reports linking CD8+ T-cell exhaustion and impaired cytotoxicity to neuropsychiatric SLE Dysfunctional CD8+ T cells may fail to control autoreactive responses in the CNS, thereby contributing to disease pathology.
Our results differ from those of Wiechmann et al. [9], who reported decreased CD107a+/CD8+ T cells and a positive correlation with SLEDAI scores. This variation may be attributed to differences in disease stage, patient treatment status, and gating strategies. In our cohort, patients were under standard immunosuppressive therapy with moderate disease activity, which may have influenced the basal activation status of cytotoxic T cells. Moreover, our analysis detected increased basal CD107a expression without correlation to SLEDAI, suggesting a state of chronic immune activation or exhaustion, rather than transient disease flares. Such variability across cohorts underscores the heterogeneity of cytotoxic responses in SLE and highlights the need for further standardized studies.
The significant reduction in CD3+CD4+ T cells observed in SLE patients reflects the well-documented CD4+ T-cell depletion characteristic of this disease [26,27]. This depletion contributes to impaired helper T-cell function and may underlie dysregulated immune responses in SLE.
Interestingly, discoid rash was associated with higher absolute CD3 and CD3+CD4+ counts, which is consistent with prior evidence of increased dermal T-cell infiltration in cutaneous lupus lesions [28]. This expansion of T-cell subsets in discoid lupus suggests that distinct skin manifestations may recruit and expand particular T-cell populations, highlighting the heterogeneity of immune responses in SLE.
Hematological abnormalities, including anemia and leukopenia, correlated with significantly reduced absolute CD3 and CD3+CD8+ counts in our cohort. Previous studies have linked cytopenia with enhanced disease activity and immune cell dysfunction, supporting the view that abnormal T-cell subset distributions may be a biomarker of disease severity [24,27]. Moreover, proteinuria was associated with decreased absolute CD3+CD8+ counts, reinforcing earlier findings that T-cell dysregulation contributes to renal involvement in lupus nephritis [29,30].
Our findings demonstrate a clear expansion of cytotoxic T-cell subsets in SLE patients, as evidenced by elevated CD3+CD8+ T cells and CD107a+CD8+ cells. This aligns with accumulating evidence that cytotoxic T lymphocytes (CTLs) play an important role in tissue damage in lupus, beyond the conventional focus on B cells and autoantibodies. For example, Blanco et al. reported that increased CD8+ T-cell frequencies are associated with tissue infiltration and disease manifestations in SLE patients [16]. Our study extends this by showing that basal CD107a expression on CD8+ T cells, a surrogate marker of degranulation status, is significantly elevated in the patient cohort, supporting the notion of altered cytotoxic function in SLE.
Interestingly, while CD107a+CD8+ expression was elevated, it did not correlate with SLEDAI scores, suggesting that increased basal CD107a expression may represent a persistent immunological trait rather than a dynamic reflection of clinical disease activity. This observation is consistent with prior studies indicating that immune dysregulation in SLE often persists independently of clinical flares [31]. The lack of correlation underscores the complex dissociation between immune cell abnormalities and clinical activity indices in SLE.
The observed expansion of double-negative T cells (DNTs) is also noteworthy. DNTs have been repeatedly implicated in SLE pathogenesis, with evidence suggesting they produce proinflammatory cytokines such as IL-17 and contribute to tissue injury [32]. Our findings reinforce this pathogenic role by demonstrating significantly higher DNT frequencies in SLE patients compared to controls, in line with previous reports of their contribution to lupus nephritis and systemic inflammation.
In contrast, the reduction in CD4+ T-cell percentages and absolute counts observed in our cohort mirrors previous findings of CD4+ lymphopenia in SLE. This phenomenon has been linked to chronic activation-induced cell death, impaired thymic output, and increased susceptibility to apoptosis [33]. The imbalance between expanded cytotoxic subsets and reduced helper T cells likely contributes to the disrupted immune homeostasis characteristic of lupus.
Correlation analysis revealed that CD107a+CD8+ counts were strongly associated with absolute CD8+ T-cell numbers and moderately with lymphocyte counts, but not with SLEDAI. This suggests that elevated CD107a expression is primarily dependent on the overall CD8+ T-cell pool rather than fluctuations in clinical activity. Consistent with this, studies have demonstrated that cytotoxic T-cell dysfunction in SLE reflects intrinsic alterations in activation and signaling pathways rather than dynamic changes in disease activity scores [34]. Moreover, CD8+ T-cell abnormalities, including persistent cytotoxic activity and altered effector function, have been described as stable immunological features across different patient subsets, independent of flare severity [22]. Together, these findings support the notion that CTL abnormalities represent a core pathogenic trait in SLE rather than a transient marker of disease exacerbation.
Our analysis highlights the clinical relevance of percentage-based immunophenotypic markers over absolute counts in distinguishing SLE patients. In particular, double-negative T cells (DNTs) emerged as a sensitive indicator of disease activity, which is in line with reports that these cells are expanded in lupus and contribute to autoantibody production and immune dysregulation [32]. This supports their growing recognition as a biomarker of T-cell imbalance in SLE.
Markers of cytotoxic function, such as CD107a (LAMP-1) expression on CD8+ T cells, also showed discriminatory capacity, consistent with previous findings of altered degranulation pathways in lupus patients [9]. CD107a has been linked to impaired cytotoxic responses and tissue infiltration in lupus nephritis, reinforcing its role as a functional marker of ongoing immune activation.
By contrast, conventional CD3+ and CD8+ subsets, while important in defining T-cell compartments, demonstrated limited ability to separate cases from controls compared to functional or dysregulated subsets. This observation aligns with earlier studies suggesting that qualitative alterations in cytotoxic pathways, rather than quantitative T-cell changes, are more closely tied to SLE pathogenesis [22].
Taken together, these findings emphasize the value of functional markers—particularly DNTs and CD107a+CD8+ T cells—as more reliable indicators of immune dysregulation in SLE, complementing routine lymphocyte profiling and aligning with the mechanistic focus of our LAMP-1–based immunophenotyping approach.
5. Conclusions
Our study highlights the central role of cytotoxic lymphocytes in SLE pathogenesis, with basal CD107a expression and double-negative T cells (DNTs) emerging as key functional markers of immune dysregulation. Elevated CD107a expression on CD8+ T cells reflects persistent alterations in cytotoxic pathways, independent of clinical activity indices, while increased DNT frequencies reinforce their pathogenic contribution to systemic inflammation and lupus nephritis. In contrast, reduced CD4+ T-cell counts underscore the loss of helper subsets and the resulting immune imbalance. Together, these findings demonstrate that functional markers such as CD107a and DNTs provide greater discriminatory power than conventional T-cell subsets, supporting their utility as reliable indicators of immune perturbation in SLE and potential biomarkers for disease monitoring.
Supplementary Materials
The following supporting information can be downloaded at: https://www.mdpi.com/article/10.3390/immuno5040056/s1. Figure S1: KEGG Pathway Enrichment Analysis, Figure S2: Reactome Pathway Enrichment Analysis, Table S1. Top 25 enriched pathways identified by Reactome analysis, Table S2: ROC analysis of immunophenotypic markers of cytotoxic T cells in SLE patients, Table S3: Comparison of T-cell Subsets (CD107a⁺CD8⁺, CD3, CD3⁺CD8⁺, CD3⁺CD4⁺) According to Clinical and Laboratory Features in SLE Patients.
Author Contributions
Conceptualization, A.M.A. and A.K.K.A.; Data curation, A.M.A., M.G.T., S.K., H.A.A., N.H., H.A.A.A. and A.K.K.A.; Formal analysis, A.M.A., M.G.T., S.K., H.A.A., N.H., H.A.A.A. and A.K.K.A.; Funding acquisition, A.M.A., M.G.T., S.K., H.A.A., N.H., H.A.A.A. and A.K.K.A.; Investigation, A.M.A., M.G.T., S.K., H.A.A.A. and A.K.K.A.; Methodology, A.M.A., M.G.T., S.K., H.A.A., N.H., H.A.A.A. and A.K.K.A.; Project administration, A.M.A., M.G.T., S.K., H.A.A., N.H., H.A.A.A. and A.K.K.A.; Resources, A.M.A., M.G.T., S.K., H.A.A., N.H., H.A.A.A. and A.K.K.A.; Software, A.M.A., H.A.A.A. and A.K.K.A.; Validation, A.M.A., M.G.T., S.K. and A.K.K.A.; Visualization, A.M.A., H.A.A.A. and A.K.K.A.; Writing—original draft, H.A.A.A.; Writing—review and editing, A.M.A., M.G.T., S.K., H.A.A.A., N.H. and A.K.K.A. All authors have read and agreed to the published version of the manuscript.
Funding
This research received no external funding.
Institutional Review Board Statement
The study was conducted in accordance with the declaration of Helsinki, and approved by the Ethics Committee of Suez Canal University, Faculty of Medicine (Research 5136#).
Informed Consent Statement
Informed consent was obtained from all subjects involved in the study.
Data Availability Statement
The original contributions presented in this study are included in the article. Further inquiries can be directed to the corresponding author(s).
Acknowledgments
The authors sincerely thank Suez Canal University Governmental and Specialized Hospitals for their invaluable assistance in facilitating sample collection. Additionally, we would like to thank the “Oncology Diagnostic Unit” for their support in conducting the laboratory molecular investigations.
Conflicts of Interest
The authors declare no conflicts of interest.
Abbreviations
The following abbreviations are used in this manuscript:
| KEGG | Kyoto Encyclopedia of Genes and Genomes |
| NK cell | Natural Killer Cell |
| Reactome | Database of Curated Biological Pathways |
| CD28 | Cluster of Differentiation 28 |
| RAP1 | RAS-related Protein 1 |
| CTL | Cytotoxic T Lymphocyte |
| CD107a (LAMP-1) | Lysosomal-Associated Membrane Protein 1 |
| SLE | Systemic Lupus Erythematosus |
| ALK | Anaplastic Lymphoma Kinase |
| FDR | False Discovery Rate |
| PPI | Protein–Protein Interaction |
| CD8A/CD8B | CD8 Alpha and Beta Chains (Co-receptor Molecules on Cytotoxic T Cells) |
| PRF1 | Perforin 1 |
| GZMB | Granzyme B |
| NKG7 | Natural Killer Cell Granule Protein 7 |
| STRING | Search Tool for the Retrieval of Interacting Genes/Proteins |
| FS | Forward Scatter |
| SS | Side Scatter |
| ANA | Antinuclear Antibody |
| Anti-dsDNA | Anti–double-stranded DNA Antibody |
| RBC | Red Blood Cell |
| WBC | White Blood Cell |
| MID | Monocytes, Eosinophils, and Basophils: Intermediate Cell Population |
| CD3 | Cluster of Differentiation 3 |
| CD4 | Cluster of Differentiation 4 |
| CD8 | Cluster of Differentiation 8 |
| DNT | Double-Negative T Cell |
| SLEDAI | Systemic Lupus Erythematosus Disease Activity Index |
| ROC | Receiver Operating Characteristic |
| AUC | Area Under the Curve |
| CNS | Central Nervous System |
| DAMPs | Danger-Associated Molecular Patterns |
| IL-17 | Interleukin-17 |
| CTLs | Cytotoxic T Lymphocytes (plural form of CTL) |
| DNTs | Double-Negative T Cells (plural form of DNT) |
References
- Justiz Vaillant, A.A.; Goyal, A.; Varacallo, M.A. Systemic Lupus Erythematosus; StatPearls Publishing LLC.: Treasure Island, FL, USA, 2023. [Google Scholar]
- Gheita, T.A.; Noor, R.A.; Abualfadl, E.; Abousehly, O.S.; El-Gazzar, I.I.; El Shereef, R.R.; Senara, S.; Abdalla, A.M.; Khalil, N.M.; ElSaman, A.M.; et al. Adult systemic lupus erythematosus in Egypt: The nation-wide spectrum of 3661 patients and world-wide standpoint. Lupus 2021, 30, 1526–1535. [Google Scholar] [CrossRef]
- El Miedany, Y.; Elhadidi, K.; Mahmoud, G.A.; Abu-Zaid, M.H.; Mahmoud, A.A.; El Gaafary, M.; Kamel, N.; Fathi, N.A.; Nasser, A.A.; Hassan, W.; et al. Egyptian recommendations for the management of systemic lupus erythematosus: A consensus, evidence-based, clinical practice guidelines for treat-to-target management. Egypt. Rheumatol. Rehabil. 2023, 50, 23. [Google Scholar] [CrossRef]
- Eesa, N.N.; Nabi, H.A.; El Owaidy, R.; Khalifa, I.; Radwan, A.R.; NourEl-Din, A.M.; Amer, M.A.; ElShereef, R.R.; Hassan, E.; Ismail, F.; et al. Systemic lupus erythematosus children in Egypt: Homeland spectrum amid the global situation. Lupus 2021, 30, 2135–2143. [Google Scholar] [CrossRef]
- El Hadidi, K.T.; Medhat, B.M.; Baki, N.M.A.; Kafy, H.A.; Abdelrahaman, W.; Yousri, A.Y.; Attia, D.H.; Eissa, M.; El Dessouki, D.; Elgazzar, I.; et al. Characteristics of systemic lupus erythematosus in a sample of the Egyptian population: A retrospective cohort of 1109 patients from a single center. Lupus 2018, 27, 1030–1038. [Google Scholar] [CrossRef]
- Couzi, L.; Merville, P.; Deminière, C.; Moreau, J.; Combe, C.; Pellegrin, J.; Viallard, J.; Blanco, P. Predominance of CD8+ T lymphocytes among periglomerular infiltrating cells and link to the prognosis of class III and class IV lupus nephritis. Arthritis Rheum. 2007, 56, 2362–2370. [Google Scholar] [CrossRef]
- Cohnen, A.; Chiang, S.C.; Stojanovic, A.; Schmidt, H.; Claus, M.; Saftig, P.; Janßen, O.; Cerwenka, A.; Bryceson, Y.T.; Watzl, C. Surface CD107a/LAMP-1 protects natural killer cells from degranulation-associated damage. Blood 2013, 122, 1411–1418. [Google Scholar] [CrossRef] [PubMed]
- Krzewski, K.; Gil-Krzewska, A.; Nguyen, V.; Peruzzi, G.; Coligan, J.E. LAMP1/CD107a is required for efficient perforin delivery to lytic granules and NK-cell cytotoxicity. Blood 2013, 121, 4672–4683. [Google Scholar] [CrossRef] [PubMed]
- Wiechmann, A.; Wilde, B.; Tyczynski, B.; Amann, K.; Abdulahad, W.H.; Kribben, A.; Lang, K.S.; Witzke, O.; Dolff, S. CD107a+ (LAMP-1) Cytotoxic CD8+ T-Cells in Lupus Nephritis Patients. Front. Med. 2021, 8, 556776. [Google Scholar] [CrossRef]
- Mohamed, A.; Zaki, H.; Hosny, M.; Fouad, M.; Moneim, N. Association of interleukin-36α gene expression in Egyptian patients with systemic lupus erythematosus with organ involvement and disease activity. Egypt. J. Immunol. 2021, 28, 75–84. [Google Scholar] [CrossRef] [PubMed]
- Petri, M.; Orbai, A.; Alarcón, G.S.; Gordon, C.; Merrill, J.T.; Fortin, P.R.; Bruce, I.N.; Isenberg, D.; Wallace, D.J.; Nived, O.; et al. Derivation and validation of the Systemic Lupus International Collaborating Clinics classification criteria for systemic lupus erythematosus. Arthritis Rheum. 2012, 64, 2677–2686. [Google Scholar] [CrossRef]
- Mosca, M.; Merrill, J.T.; Bombardieri, S. Assessment of Disease Activity in Systemic Lupus Erythematosus. In Systemic Lupus Erythematosus: A Companion to Rheumatology; Elsevier Health Sciences: Amsterdam, The Netherlands, 2007; pp. 19–23. [Google Scholar] [CrossRef]
- Arora, S.; Isenberg, D.A.; Castrejon, I. Measures of Adult Systemic Lupus Erythematosus: Disease Activity and Damage. Arthritis Care Res. 2020, 72, 27–46. [Google Scholar] [CrossRef] [PubMed]
- Tiezzi, F.; Parker-Gaddis, K.L.; Cole, J.B.; Clay, J.S.; Maltecca, C. Pathways Identified by the Database for Annotation, Visualization and Integrated Discovery (DAVID Version 6.7) in the Kyoto Encyclopedia of Genes and Genomes (KEGG). 2015. Available online: https://datasetcatalog.nlm.nih.gov/dataset?q=0001923133 (accessed on 1 September 2025).
- Blanco, P.; Pitard, V.; Viallard, J.; Taupin, J.; Pellegrin, J.; Moreau, J. Increase in activated CD8+ T lymphocytes expressing perforin and granzyme B correlates with disease activity in patients with systemic lupus erythematosus. Arthritis Rheum. 2005, 52, 201–211. [Google Scholar] [CrossRef]
- Crispín, J.C.; Oukka, M.; Bayliss, G.; Cohen, R.A.; Van Beek, C.A.; Stillman, I.E.; Kyttaris, V.C.; Juang, Y.-T.; Tsokos, G.C. Expanded double negative T cells in patients with systemic lupus erythematosus produce IL-17 and infiltrate the kidneys. J. Immunol. 2008, 181, 8761–8766. [Google Scholar] [CrossRef] [PubMed]
- Kono, H.; Rock, K.L. How dying cells alert the immune system to danger. Nat. Rev. Immunol. 2008, 8, 279–289. [Google Scholar] [CrossRef]
- Betts, M.R.; Koup, R. A Detection of T-cell degranulation: CD107a and b. Methods Cell Biol. 2004, 75, 497–512. [Google Scholar] [CrossRef]
- Buang, N.; Tapeng, L.; Gray, V.; Sardini, A.; Whilding, C.; Lightstone, L.; Cairns, T.D.; Pickering, M.C.; Behmoaras, J.; Ling, G.S.; et al. Type I interferons affect the metabolic fitness of CD8+ T cells from patients with systemic lupus erythematosus. Nat. Commun. 2021, 12, 1980. [Google Scholar] [CrossRef]
- Wherry, E.J. T cell exhaustion. Nat. Immunol. 2011, 12, 492–499. [Google Scholar] [CrossRef]
- Betts, M.R.; Brenchley, J.M.; Price, D.A.; De Rosa, S.C.; Douek, D.C.; Roederer, M.; Koup, R.A. Sensitive and viable identification of antigen-specific CD8+ T cells by a flow cytometric assay for degranulation. J. Immunol. Methods 2003, 281, 65–78. [Google Scholar] [CrossRef]
- Chen, P.-M.; Tsokos, G.C. The role of CD8+ T-cell systemic lupus erythematosus pathogenesis: An update. Curr. Opin. Rheumatol. 2021, 33, 586–591. [Google Scholar] [CrossRef]
- Kaech, S.M.; Wherry, E.J. Heterogeneity and cell-fate decisions in effector and memory CD8+ T cell differentiation during viral infection. Immunity 2007, 27, 393–405. [Google Scholar] [CrossRef] [PubMed]
- Moulton, V.R.; Suarez-Fueyo, A.; Meidan, E.; Li, H.; Mizui, M.; Tsokos, G.C. Pathogenesis of Human Systemic Lupus Erythematosus: A Cellular Perspective. Trends Mol. Med. 2017, 23, 615–635. [Google Scholar] [CrossRef]
- Sobhy, N.; Niazy, M.H.; Kamal, A. Lymphopenia in systemic lupus erythematosus patients: Is it more than a laboratory finding? Egypt. Rheumatol. 2020, 42, 23–26. [Google Scholar] [CrossRef]
- Bennett, L.; Palucka, A.K.; Arce, E.; Cantrell, V.; Borvak, J.; Banchereau, J.; Pascual, V. Interferon and granulopoiesis signatures in systemic lupus erythematosus blood. J. Exp. Med. 2003, 197, 711–723. [Google Scholar] [CrossRef]
- Kirou, K.A.; Kalliolias, G.D. A new tool for detection of type I interferon activation in systemic lupus erythematosus. Arthritis Res. Ther. 2010, 12, 138. [Google Scholar] [CrossRef] [PubMed][Green Version]
- Kaul, A.; Gordon, C.; Crow, M.K.; Touma, Z.; Urowitz, M.B.; van Vollenhoven, R.; Ruiz-Irastorza, G.; Hughes, G. Systemic lupus erythematosus. Nat. Rev. Dis. Primers 2016, 2, 16039. [Google Scholar] [CrossRef] [PubMed]
- Kaul, A.; Gordon, C.; Crow, M.K.; Touma, Z.; Urowitz, M.B.; van Vollenhoven, R.; Ruiz-Irastorza, G.; Hughes, G. T-cell subsets in lesions of systemic and discoid lupus erythematosus. J. Cutan. Pathol. 1985, 12, 493–499. [Google Scholar] [CrossRef]
- Shi, Z.; Qin, H.; Wu, H. Single-Cell Transcriptome Reveals the Heterogeneity of T Cells in Mice with Systemic Lupus Erythematosus and Neuronal Inflammation. J. Inflamm. Res. 2024, 17, 11375–11402. [Google Scholar] [CrossRef] [PubMed]
- Nehar-Belaid, D.; Hong, S.; Marches, R.; Chen, G.; Bolisetty, M.; Baisch, J.; Walters, L.; Punaro, M.; Rossi, R.J.; Chung, C.-H.; et al. Mapping systemic lupus erythematosus heterogeneity at the single-cell level. Nat. Immunol. 2020, 21, 1094–1106. [Google Scholar] [CrossRef]
- Oaks, Z.; Winans, T.; Caza, T.; Fernandez, D.; Liu, Y.; Landas, S.K.; Banki, K.; Perl, A. Mitochondrial Dysfunction in the Liver and Antiphospholipid Antibody Production Precede Disease Onset and Respond to Rapamycin in Lupus-Prone Mice. Arthritis Rheumatol. 2016, 68, 2728–2739. [Google Scholar] [CrossRef]
- Yuan, S.; Zeng, Y.; Li, J.; Wang, C.; Li, W.; He, Z.; Ye, J.; Li, F.; Chen, Y.; Lin, X.; et al. Phenotypical changes and clinical significance of CD4+/CD8+ T cells in SLE. Lupus Sci. Med. 2022, 9, e000660. [Google Scholar] [CrossRef]
- McKinney, E.F.; Lee, J.C.; Jayne, D.R.W.; Lyons, P.A.; Smith, K.G. T-cell exhaustion, co-stimulation and clinical outcome in autoimmunity and infection. Nature 2015, 523, 612–616. [Google Scholar] [CrossRef] [PubMed]
Disclaimer/Publisher’s Note: The statements, opinions and data contained in all publications are solely those of the individual author(s) and contributor(s) and not of MDPI and/or the editor(s). MDPI and/or the editor(s) disclaim responsibility for any injury to people or property resulting from any ideas, methods, instructions or products referred to in the content. |
© 2025 by the authors. Licensee MDPI, Basel, Switzerland. This article is an open access article distributed under the terms and conditions of the Creative Commons Attribution (CC BY) license (https://creativecommons.org/licenses/by/4.0/).