Abstract
Background: MicroRNAs (miRNAs) such as miR-155-5p and miR-221-3p are key regulators of gene expression in cancer. Although both have been implicated in colorectal cancer (CRC) and papillary thyroid carcinoma (PTC), data on their regional expression profiles and clinical associations remain scarce, particularly in the Middle East. This study assessed the expression patterns and clinical relevance of miR-155-5p and miR-221-3p in CRC and PTC patients from Sulaymaniyah Province, Iraq. Methods: Formalin-fixed, paraffin-embedded (FFPE) tumor and adjacent normal tissue samples were collected from 60 CRC patients and 50 PTC patients. miRNA expression levels were quantified using real-time quantitative PCR (RT-qPCR) and analyzed by the ΔΔCt method, adjusted for tumor cellularity. Statistical analyses were conducted to evaluate associations between miRNA expression and clinicopathological parameters. Results: miR-155-5p and miR-221-3p were frequently overexpressed in both CRC (65%) and PTC (72% and 68%, respectively). In CRC, miR-155-5p expression correlated significantly with histological grade, tumor location, and TNM stage (p < 0.05), while miR-221-3p did not show significant associations with clinicopathological features. In PTC, miR-155-5p exhibited a trend toward association with TNM stage (p = 0.02). No significant differences in expression levels of these miRNAs were observed between CRC and PTC samples. Conclusions: Overall, miR-155-5p and miR-221-3p are consistently overexpressed in CRC and PTC, indicating their potential as diagnostic biomarkers. miR-155-5p, in particular, shows promise as a marker of disease progression in CRC. These findings underscore the importance of region-specific studies in advancing our understanding of the molecular landscape of cancer.
1. Introduction
MicroRNAs (miRNAs) are small, non-coding RNA molecules that regulate gene expression post-transcriptionally by targeting messenger RNAs (mRNAs) for degradation or translational repression [1]. They play essential roles in fundamental biological processes, including cell proliferation, differentiation, apoptosis, and immune response [2,3]. Dysregulation of miRNAs is strongly associated with cancer development, where they can act as either oncogenes or tumor suppressors depending on their cellular targets [4,5]. Among the most studied oncogenic miRNAs, miR-155-5p and miR-221-3p have emerged as key players in several malignancies, particularly colorectal cancer (CRC) and thyroid cancer [6].
Colorectal cancer remains a leading cause of cancer-related mortality worldwide [7]. miR-221-3p is frequently overexpressed in CRC and promotes tumor growth, inhibits apoptosis, and enhances epithelial-to-mesenchymal transition (EMT) [8]. Elevated expression of miR-221-3p correlates with advanced tumor stage, metastasis, and poor clinical outcomes [9]. Similarly, miR-155-5p is implicated in CRC pathogenesis by modulating inflammation-driven tumor progression and DNA mismatch repair mechanisms [10], Its overexpression has been associated with reduced survival rates and increased metastatic potential [11].
Thyroid cancer, the most prevalent endocrine malignancy, primarily comprises papillary thyroid carcinoma (PTC) and follicular thyroid carcinoma (FTC) [12]. miR-221-3p is among the most significantly upregulated miRNAs in thyroid cancer, where it downregulates key tumor suppressors such as p27 and PTEN, leading to enhanced proliferation and invasion [13,14]. Overexpression of miR-155 in thyroid cancer is also linked to increased tumor aggressiveness and poor prognosis [15].
Beyond their roles in cancer progression, miR-155-5p and miR-221-3p are emerging as promising biomarkers for cancer diagnosis and prognosis. Circulating miRNAs, in particular, have attracted attention as minimally invasive biomarkers, with miR-155-5p and miR-221-3p showing potential diagnostic and prognostic utility [6]. Serum and plasma levels of miR-221-3p have been proposed as markers to distinguish cancer patients from healthy individuals [16]. Similarly, miR-155-5p has been associated with chemoresistance and tumor progression, underscoring its value as a potential predictor of therapeutic response [17].
Despite extensive research on miRNAs, regional variations in their expression remain poorly understood. Genetic, environmental, and lifestyle factors can influence miRNA expression patterns [18], highlighting the need for population-specific studies. In this study, we focused on miR-155-5p and miR-221-3p based on substantial evidence supporting their oncogenic roles in CRC and thyroid cancers. Both miR-155-5p and miR-221-3p act as oncogenic microRNAs in colorectal and papillary thyroid carcinoma. miR-155-5p is linked to inflammation-driven tumorigenesis, chemoresistance, and poor prognosis, promoting growth and invasion in CRC and enhancing aggressiveness in PTC through Wnt/β-catenin signaling [19,20,21]. Similarly, miR-221-3p promotes proliferation, invasion, and EMT by targeting tumor suppressors such as PTEN, TIMP3, and p27, with overexpression correlating with advanced stage, lymph node metastasis, and recurrence in PTC, as well as poor outcomes in CRC [22,23,24].” However, there is a paucity of research on the expression patterns of these miRNAs in Middle Eastern populations, particularly in Sulaymaniyah Province. Given the potential influence of genetic, environmental, dietary, and lifestyle factors on miRNA expression, studying these miRNAs in this specific regional context is essential to understanding their potential as diagnostic and prognostic biomarkers tailored to the local population. This study aims to address this gap and contribute valuable data to advance precision oncology in the Sulaymaniyah population.
Therefore, the objective of this study was to evaluate the prevalence and clinical significance of miR-155-5p and miR-221-3p in colorectal and thyroid cancer patients from Sulaymaniyah Province. By analyzing their expression levels in tumor and matched normal tissues, this research seeks to elucidate their potential roles as diagnostic and prognostic biomarkers in this population.
2. Methods
2.1. Sample Collection
Formalin-fixed paraffin-embedded (FFPE) tissue samples were obtained from two cohorts of cancer patients treated at hospitals in Sulaymaniyah. The first cohort consisted of 60 colorectal cancer (CRC) samples, while the second cohort comprised 50 thyroid cancer samples. All patients were diagnosed and underwent surgical treatment between 2020 and 2024. Adjacent normal tissues were also collected for comparison. FFPE blocks were sectioned using a microtome (Leica RM2235, Leica Biosystems, Nussloch, Germany). To ensure sample specificity, patients with a history of other cancers were excluded, and only primary tumor tissues were included in the study.
The sample size was determined by including all available, well-preserved tissue samples from hospitals biobank collected between 2020 and 2024. This approach is consistent with similar studies exploring miRNA expression in cancer tissues and was intended to ensure comprehensive representation of the Sulaymaniyah population. This study was conducted on archived FFPE tissue samples, and no direct patient contact occurred; therefore, written informed consent was not required. This study was approved by the Ethics Committee of [Komar University of Science and Technology] under protocol number KUST-SP25-05-03-DEN. The use of archived, de-identified tissue samples complied with institutional and national guidelines, and the requirement for written informed consent was waived.
Samples were selected to contain at least 70% tumor cellularity based on histopathological evaluation, ensuring minimal contamination from surrounding stromal or inflammatory cells. Although no mathematical correction was applied to ΔΔCt values, this approach ensured consistent sample quality and reliable miRNA quantification. Archived FFPE tissue samples were accessed for research purposes between March 2025 and June 2025 from the pathology archives of Sulaymaniyah hospitals. All samples were provided in a fully de-identified format by the pathology departments, and I did not have access to any identifiable patient information at any stage during or after data collection.
2.2. Microdissection
To minimize potential contamination from stromal cells, tumor specimens underwent macrodissection following histopathological evaluation to ensure a minimum tumor content of 50%, as recommended [25]. Two 20 μm thick serial sections were obtained from each formalin-fixed paraffin-embedded (FFPE) block. Tumor regions were identified on unstained sections using corresponding H&E-stained slides, guiding the macrodissection process. RNA, including miRNA, was subsequently extracted using the miRNeasy FFPE Kit (Qiagen, Hilden, Germany), following the manufacturer’s protocol. Deparaffinization was performed using xylene (Sigma-Aldrich, St. Louis, MO, USA) and ethanol solutions (70–100%, Merck, Darmstadt, Germany). RNA concentration and purity were measured using the NanoDrop 2000 spectrophotometer (Thermo Fisher Scientific, Waltham, MA, USA).
2.3. Reverse Transcription-Quantitative Polymerase Chain Reaction (RT-qPCR)
cDNA synthesis was performed using the miScript II RT Kit for miRNA and the QuantiTect Reverse Transcription Kit (Qiagen, Hilden, Germany) for mRNA. Gene expression quantification was conducted using the miScript SYBR Green PCR Kit (Qiagen) on a 7500 Fast Real-Time PCR System Veriti™ 96-Well Thermal Cycler (Applied Biosystems, Foster City, CA, USA). The ΔΔCt method was applied for relative quantification, comparing miRNA expression between tumor and adjacent normal tissues. RNU6B was used as reference genes for miRNA normalization [25,26].
2.4. MiRNA Quantification by Real-Time Quantitative RT-PCR
Following cDNA synthesis using the miScript II RT Kit (Qiagen, Hilden, Germany), the selected miRNAs were quantified using the miScript SYBR Green PCR Kit (Qiagen) on a 7500 Fast Real-Time PCR System (Applied Biosystems, Foster City, CA, USA, RNU6B was used as the endogenous reference control for normalization. Relative quantification was performed using the comparative 2−ΔΔCt method as described by Livak and Schmittgen [26,27,28]. Briefly, the Ct value of each target miRNA (miR-155-5p and miR-221-3p) was first normalized to RNU6B to obtain ΔCt (ΔCt = Ct_target − Ct_RNU6B). For each patient, the ΔCt of the tumor tissue was then compared with the ΔCt of the matched adjacent normal tissue to obtain ΔΔCt (ΔΔCt = ΔCt_tumor − ΔCt_normal). Relative expression (fold change) was calculated as 2−ΔΔCt. In line with previous miRNA studies, a fold change ≥ 2.0 was classified as high/overexpression, 0.5–2.0 as normal expression, and ≤0.5 as low expression.
To account for differences in tumor cellularity, the ΔΔCt values were subsequently examined together with the recorded tumor-cell percentage (see Supplementary Materials: Data_miRNA). This procedure was used to minimize the effect of stromal or inflammatory cell contamination and to obtain a more accurate representation of tumor miRNA expression. A two-fold change threshold was retained to define differentially expressed miRNAs. This tumor cellularity-based adjustment was applied as an exploratory normalization step and is not a standard or widely validated method; therefore, the results should be interpreted with this limitation in mind.
2.5. MicroRNA Expression
Tumor cellularity-normalized microRNA expression levels in tumor and matched normal samples were classified into high, normal, and low expression based on relative expression ratios (RRs). A relative ratio (RR) of ≥2 indicated high expression, values between 0.5 and 2 were considered to indicate normal expression, and an RR ≤ 0.5 was classified as an indicator of low expression. This categorization approach was chosen to align with prior studies using similar thresholds to identify meaningful miRNA dysregulation in tumor tissues [3,4], facilitating clinical interpretation of expression levels.
miRNA expression levels were normalized to RNU6B small nuclear RNA, a commonly used endogenous control in miRNA quantification. RNU6B was selected due to its consistent and stable expression across both tumor and normal tissues, ensuring reliable normalization of miRNA expression data in formalin-fixed, paraffin-embedded (FFPE) samples [28]
To determine expression cut-offs for miR-155-5p and miR-221-3p, we analyzed relative expression ratios (RRs) in matched normal adjacent tissues. Drawing from previous studies and standard approaches [11,28], we examined the range of RR values in these normal tissues and defined thresholds for categorizing miRNA expression: RR ≥ 2 as high expression, RR between 0.5 and 2 as normal expression, and RR ≤ 0.5 as low expression. This approach aligns with established conventions in miRNA expression studies and enables clinically relevant classification of miRNA expression patterns.
In addition to categorization, we performed non-parametric statistical testing to compare the continuous RR distributions between colorectal cancer (CRC) and papillary thyroid carcinoma (PTC) samples. Specifically, the Mann–Whitney U test (equivalent to the Wilcoxon rank sum test) was applied to compare the distributions of miR-155-5p and miR-221-3p relative expression ratios between these two groups. This approach does not assume a normal distribution and is appropriate for analyzing differences between independent groups. Statistical significance was defined as p < 0.05. The primer sequences used in this study for the analysis of miRNAs are provided in Table 1.

Table 1.
List of miRNA genes, sequences of forward primers.
The miRNeasy FFPE Kit from Qiagen, designed for the purification of microRNA and total RNA from formalin-fixed, paraffin-embedded tissue sections, is available under Catalog Number 217504.
2.6. Statistical Analysis
All statistical analyses were performed using SPSS version 22.0 (IBM Corp., Armonk, NY, USA) and GraphPad Prism version 9.0 (GraphPad Software, San Diego, CA, USA). Descriptive statistics were used to summarize demographic and clinicopathological data. The Chi-square (χ2) test was applied to evaluate associations between miRNA expression levels and clinicopathological parameters. For contingency tables with small expected counts (n < 5), Fisher’s exact test was additionally applied to verify the significance of associations between miRNA expression and clinicopathological variables. Continuous variables were compared using the Mann–Whitney U test, and a p-value < 0.05 was considered statistically significant.
3. Results
3.1. Patient Characteristics
The demographic and clinicopathological characteristics of the study cohorts are summarized in Table 2. The colorectal cancer (CRC) group included 60 patients (41–71 years; 37 males and 23 females), while the papillary thyroid carcinoma (PTC) group comprised 50 patients (32–59 years; 27 males and 23 females). Among CRC cases, 73.3% were proximal (right-sided) and 26.7% distal (left-sided) tumors, with most classified as grade II and stage II. Adenocarcinoma was the predominant histological type, followed by mucinous adenocarcinoma. In contrast, PTC cases mainly consisted of early-stage tumors, with the classical and follicular-variant subtypes being the most frequent.
Table 2.
Demographic and clinicopathological characteristics of the study cohorts.
3.2. Expression Analysis of miR-155-5p and miR-221-3p in Colorectal Cancer (CRC)
The expression levels of miR-155-5p and miR-221-3p in colorectal cancer (CRC) tumor samples were analyzed to determine their potential oncogenic role. The ΔΔCt method was used to quantify expression levels, where a value ≥ 2.0 indicated high expression, while a value ≤ 0.5 was classified as low expression. The findings revealed that 65.0% of CRC samples exhibited high expression of both miRNAs, suggesting significant overexpression in colorectal tumors.
To assess the statistical significance of this overexpression, a one-sample proportion z-test was conducted, comparing the proportion of high-expressing samples to a hypothetical 50% distribution. The results indicated that both miR-155-5p (p = 0.0074) and miR-221-3p (p = 0.0074) were significantly overexpressed in CRC samples. These findings support the role of these miRNAs in CRC progression, potentially contributing to tumor proliferation, invasion, and metastasis.
Further analysis was performed to examine the relationship between miR-155-5p and miR-221-3p expression levels in CRC using a Pearson correlation test. The correlation coefficient was found to be 0.237, suggesting a weak positive correlation between the two miRNAs. However, this relationship was not statistically significant (p = 0.0686), indicating that while both miRNAs tend to be co-expressed, their regulatory mechanisms might be independent. These results emphasize the oncogenic potential of miR-155-5p and miR-221-3p in CRC, suggesting further investigation into their biological roles and potential as therapeutic targets.
3.3. Expression Analysis of miR-155-5p and miR-221-3p in Papillary Thyroid Cancer (PTC)
The expression levels of miR-155-5p and miR-221-3p were analyzed in papillary thyroid cancer (PTC) tumor samples using the ΔΔCt method, where values ≥ 2.0 were classified as high expression and ≤0.5 as low expression. The results showed that 72.0% of PTC samples exhibited high expression of miR-155-5p, while 68.0% showed high expression of miR-221-3p, indicating significant overexpression of both miRNAs in PTC tumors. To determine whether this overexpression was statistically significant, a one-sample proportion z-test was performed, comparing the proportion of high-expressing samples (≥2.0 ΔΔCt) with a hypothetical 50% baseline distribution. The results confirmed that miR-155-5p (p = 0.000265) and miR-221-3p (p = 0.003181) were significantly overexpressed in PTC cases, suggesting that both miRNAs may play a role in PTC oncogenesis and could potentially serve as biomarkers for tumor progression. Furthermore, a Pearson correlation analysis was conducted to assess the relationship between miR-155-5p and miR-221-3p expression levels in PTC. The correlation coefficient (r = −0.134) indicated a weak negative correlation between the two miRNAs. However, this relationship was not statistically significant (p = 0.354), suggesting that their expression patterns are largely independent in PTC tumors. These findings indicate that while both miR-155-5p and miR-221-3p are significantly overexpressed in PTC, their regulation may differ, and they do not appear to be strongly co-expressed. Further studies are needed to explore their individual roles in PTC progression and clinical outcomes. Figure 1 shows the distribution of miR-155-5p expression categories (high, normal, and low) across CRC and PTC samples, illustrating the proportion of samples in each category and highlighting expression differences between tumor types. Figure 1 focuses on miR-155-5p because this miRNA showed the clearest and statistically significant clinicopathological associations in CRC in this cohort, while miR-221-3p did not demonstrate similar patterns. Therefore, miR-155-5p was used as a representative example of the expression categorization. To define these categories, a pooled sample from adjacent normal tissues was first prepared and used to obtain a stable reference value for each miRNA. When individual normal tissues were compared with this pooled normal, their expression values fell approximately within the 0.5–2.0 range. Based on this observation, 0.5–2.0 was defined as the normal expression range, values ≥ 2.0 as overexpression, and values ≤ 0.5 as low expression. Tumor samples were then classified according to these cut-offs.
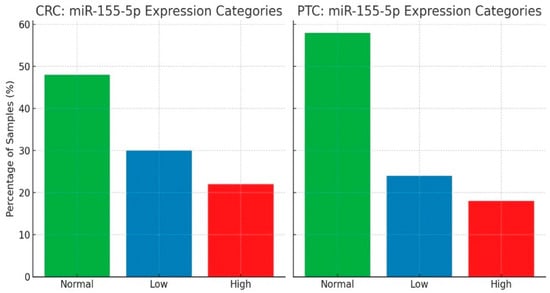
Figure 1.
Distribution of miR-155-5p expression categories in colorectal cancer (CRC, n = 60) and papillary thyroid carcinoma (PTC, n = 50) samples. Expression levels were calculated using the 2−ΔΔCt method. A pooled sample generated from adjacent normal tissues was used to establish the reference level; individual normal tissues fell within approximately 0.5–2.0 of this value. On this basis, fold change ≥ 2.0 was classified as high/overexpression, 0.5–2.0 as normal expression, and ≤0.5 as low expression. miR-155-5p is shown here because it demonstrated the clearest and statistically meaningful clinicopathological associations in CRC in this cohort.
3.4. Comparison of miR-155-5p and miR-221-3p Expression Between CRC and PTC
To compare the expression patterns of miR-155-5p and miR-221-3p between colorectal cancer (CRC) and papillary thyroid carcinoma (PTC), we generated box plots showing the distributions of relative expression ratios (RR) of both miRNAs (Figure 2). A Mann–Whitney U test was performed to statistically evaluate the differences in RR distributions between the two cancer types. The results showed no significant differences in the expression levels of miR-155-5p (p = 0.972) or miR-221-3p (p = 0.944) between CRC and PTC. These findings suggest that both miRNAs are consistently expressed across the two tumor types in our cohort. To further illustrate the relationship between miR-155-5p expression levels and TNM stage in colorectal cancer, a scatter plot was generated (Figure 3). This figure shows that miR-155-5p levels tend to be higher in CRC cases with more advanced TNM stage, but there is wide overlap in expression values between stages. This inter-patient variability means that, although a statistical difference was detected, miR-155-5p alone cannot be used to distinguish TNM stages in this cohort, and the result should be interpreted with caution.
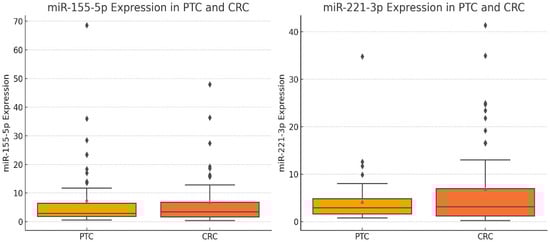
Figure 2.
Box plots showing relative expression ratios (2−ΔΔCt) of miR-155-5p and miR-221-3p in colorectal cancer (CRC, n = 60) and papillary thyroid carcinoma (PTC, n = 50). The central line represents the median, boxes indicate the interquartile range (IQR), and whiskers show the minimum and maximum values. Mann–Whitney U tests were used to compare expression between CRC and PTC, and no significant differences were observed for either miRNA (miR-155-5p: p = 0.972; miR-221-3p: p = 0.944). This figure complements the categorical analysis by illustrating inter-sample variability in both tumor types.
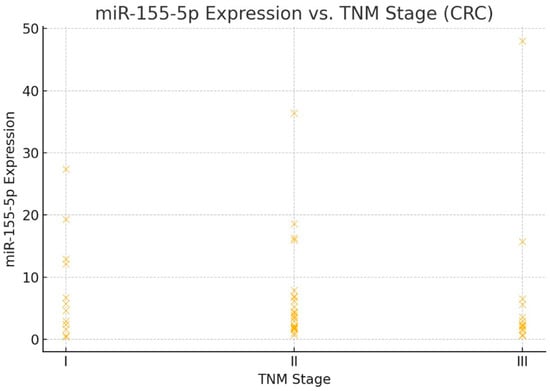
Figure 3.
miR-155-5p expression across TNM stages in colorectal cancer (CRC, n = 60). Each point represents an individual tumor; horizontal bars indicate median expression per stage. A trend toward higher miR-155-5p levels was observed in more advanced stages; however, there was substantial overlap between stages, indicating marked inter-patient variability. Accordingly, this figure should be interpreted as showing an association rather than a stage-discriminating marker, particularly given the limited sample size.
Additionally, we noted that while some associations reached statistical significance (e.g., p = 0.02), the observed correlations should be interpreted with caution given the limited sample size and potential biological variability. Further studies are warranted to validate these findings in larger, independent cohorts. To visualize individual sample heterogeneity in miRNA expression, we generated a heatmap (Figure 4) showing relative expression levels of miR-155-5p and miR-221-3p across all CRC and PTC samples.
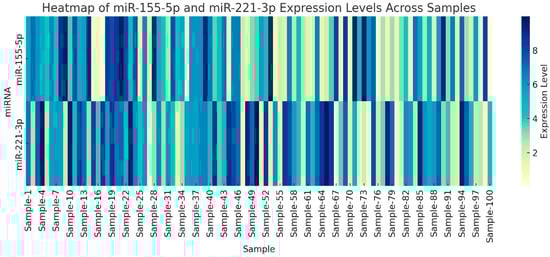
Figure 4.
Heatmap of miR-155-5p and miR-221-3p expression levels across all tumor samples included in the study: colorectal cancer (CRC, n = 60) and papillary thyroid carcinoma (PTC, n = 50). Each column represents a single tumor sample, and each row corresponds to one miRNA. Expression values are shown as fold change (2−ΔΔCt) relative to the corresponding adjacent normal tissue used as the calibrator. Color intensity reflects the magnitude of upregulation or downregulation, highlighting the heterogeneity of miRNA expression across individual cases. This figure complements the bar-chart and box-plot analyses by providing an overview of expression variability at the individual-sample level.
3.5. Association of miRNA Expression with Clinicopathological Features in CRC Samples
The association between miRNA 155-5p and miRNA 221-3p expression levels and various clinicopathological characteristics of colorectal cancer (CRC) samples was analyzed using the Chi-square (X2) test. The results revealed a significant association between miRNA 155-5p expression and histological grading (X2 = 28.9, p < 0.001), tumor location (X2 = 9.8, p = 0.001), and TNM stage (X2 = 12.1, p = 0.002). However, no significant association was observed with tumor type (X2 = 0.07, p = 0.79) or lymph node involvement (X2 = 0.0, p = 1).
For miRNA 221-3p, none of the clinicopathological parameters showed a statistically significant association. The highest X2 value was observed in lymph node involvement (X2 = 3.1, p = 0.07), but this did not reach statistical significance. Tumor type (X2 = 2.9, p = 0.08), histological grading (X2 = 1.9, p = 0.3), tumor location (X2 = 0.02, p = 0.8), and TNM stage (X2 = 0.9, p = 0.6) all showed non-significant associations In this analysis, colorectal cancers were further classified by anatomical site into proximal (right-sided) and distal (left-sided) tumors. As summarized in Table 3, miR-155-5p expression was significantly higher in distal tumors compared to proximal ones (p = 0.001), whereas miR-221-3p showed no significant difference between the two locations (p = 0.8).
Table 3.
Association between miRNA 155-5p and miRNA 221-3p expression levels and clinicopathological characteristics in colorectal cancer (CRC) samples. The table presents the mean ± standard deviation (SD) for miRNA expression in different clinicopathological categories, along with the Chi-square (X2) values and corresponding p-values for statistical associations. A p-value < 0.05 indicates statistical significance. miRNA 155-5p expression showed significant associations with histological grading (X2 = 28.9, p < 0.001), tumor location (X2 = 9.8, p = 0.001), and TNM stage (X2 = 12.1, p = 0.002), while miRNA 221-3p did not exhibit significant associations with the analyzed clinicopathological features.
These findings suggest that miRNA 155-5p expression is significantly linked to key pathological features of CRC, while miRNA 221-3p does not exhibit a strong correlation with the assessed clinicopathological characteristics.
3.6. Association of miRNA Expression with Clinicopathological Features in PTC Samples
The relationship between miRNA 155-5p and miRNA 221-3p expression levels and various clinicopathological characteristics in papillary thyroid carcinoma (PTC) samples was analyzed using the Chi-square (X2) test.
For miRNA 155-5p, no clinicopathological characteristics showed a statistically significant association. The highest X2 value was observed in TNM stage (X2 = 7.6, p = 0.02), indicating a potential correlation between miRNA 155-5p expression and tumor staging. However, other factors such as histological variant (X2 = 5.1, p = 0.1), tumor location (X2 = 4.1, p = 0.1), and lymph node involvement (X2 = 0.6, p = 0.4) did not reach statistical significance.
Similarly, for miRNA 221-3p, no significant association was found with any of the clinicopathological characteristics analyzed. The highest X2 value was observed for histological variant (X2 = 2.8, p = 0.4), but this did not reach statistical significance. Other parameters, including tumor location (X2 = 3.6, p = 0.1), TNM stage (X2 = 2.3, p = 0.3), and lymph node involvement (X2 = 1.5, p = 0.2), also failed to show meaningful associations (see Table 4).
Table 4.
Association between miRNA 155-5p and miRNA 221-3p expression levels and clinicopathological characteristics in papillary thyroid carcinoma (PTC) samples. The table presents the mean ± standard deviation (SD) for miRNA expression in different clinicopathological categories, along with the Chi-square (X2) values and corresponding p-values for statistical associations. A p-value < 0.05 indicates statistical significance. No significant associations were observed for either miRNA, although miRNA 155-5p showed a potential trend with TNM stage (X2 = 7.6, p = 0.02).
These findings suggest that miRNA 155-5p and miRNA 221-3p expression may not have a strong correlation with the assessed clinicopathological characteristics in PTC samples, with only a potential trend observed for miRNA 155-5p in relation to TNM staging.
3.7. Validation of miR-155-5p and miR-221-3p Expression Using TCGA Data
To further validate our experimental results, expression profiles for miR-155-5p and miR-221-3p were examined in TCGA datasets (COAD for colorectal cancer and THCA for thyroid carcinoma) using the GEPIA and UALCAN portals. As shown in Figure 5, miR-221-3p was markedly upregulated in both tumor types compared with normal tissues, consistent with our qRT-PCR results. In contrast, miR-155-5p displayed a more variable pattern: it was modestly increased in TCGA-COAD samples but decreased in TCGA-THCA tumors relative to normal thyroid tissue. This partial discordance may stem from methodological and biological differences, including the use of FFPE qRT-PCR versus RNA-seq, distinct normalization procedures, tumor-cellularity variation, and potential population- or subtype-specific regulation of miR-155. Importantly, the TCGA THCA dataset represents bulk thyroid tumors of mixed histological variants, whereas our series included only papillary thyroid carcinoma (PTC) cases, which could further explain the divergent results. Together, the TCGA analyses provide partial but valuable external support for the observed upregulation of miR-221-3p and highlight the context-dependent behavior of miR-155-5p across tumor types.
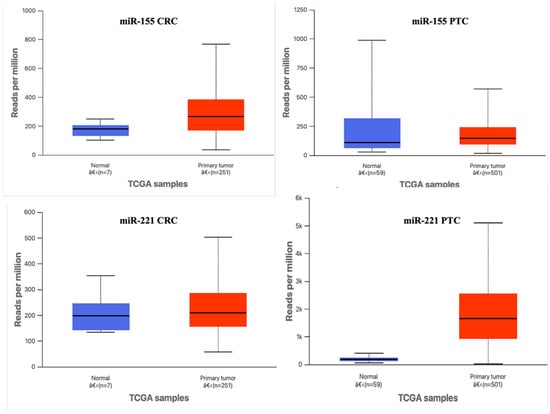
Figure 5.
Comparison of TCGA (GEPIA/UALCAN) and local qRT-PCR expression of miR-155-5p and miR-221-3p in colorectal cancer (CRC/TCGA-COAD) and papillary thyroid carcinoma (PTC/TCGA-THCA). Boxplots show normalized expression relative to the median of normal tissue (median normal = 1). TCGA values derive from RNA-seq (reads per million), and local values from 2−ΔΔCt measurements. Sample numbers (TCGA: COAD tumor = 251, normal = 7; THCA tumor = 501, normal = 59; Local CRC tumor = 60, PTC tumor = 50) are indicated above boxes. Statistical comparisons used the Mann–Whitney U test. miR-221 is consistently upregulated across datasets, whereas miR-155 shows dataset- and tumor-specific variation—moderately increased in CRC but decreased in thyroid carcinoma—illustrating context-dependent expression and cross-platform variability.
4. Discussion
This study found pronounced overexpression of miR-155-5p and miR-221-3p in both colorectal cancer (CRC) and papillary thyroid carcinoma (PTC), consistent with their established oncogenic roles across diverse tumor types. Analyses of public TCGA data via GEPIA and UALCAN broadly support increased miR-221 abundance in tumors and align with the direction of our local qRT-PCR results, reinforcing the relevance of miR-221 as a tumor-associated miRNA in these cancers.
However, TCGA data reveal a more complex picture for miR-155-5p: while miR-155 is modestly elevated in CRC samples, THCA (thyroid) RNA-seq profiles indicate lower miR-155-5p levels in tumor versus normal tissue. This partial discordance may reflect platform- and sample-related differences (FFPE qRT-PCR versus RNA-seq), divergent normalization methods, variation in tumor cellularity, or population- and subtype-specific regulation of miR-155-5p. Notably, TCGA THCA profiles derive from bulk thyroid tumor specimens encompassing multiple histological variants, whereas our data are restricted to papillary thyroid carcinoma (PTC) samples; differences in tumor composition or variant representation could therefore contribute to the opposing patterns. Acknowledging these differences emphasizes the need for multi-platform and subtype-specific validation and careful interpretation when comparing local cohorts with large public datasets.
This study focused on miR-155-5p and miR-221-3p due to their well-documented oncogenic roles in CRC and thyroid cancers. miR-155-5p has been linked to inflammation-driven tumorigenesis, chemoresistance, and poor prognosis, especially in CRC [13,14,15]. miR-221-3p also promotes proliferation, invasion, and EMT by targeting tumor suppressors CDKN1B (p27) and PTEN, with significant evidence in both CRC and PTC [29,30]. However, there is limited research exploring these miRNAs in Middle Eastern populations, particularly in Sulaymaniyah Province. Given the influence of genetic, environmental, and lifestyle factors on miRNA expression [31], it is essential to analyze miRNA expression in a regional context to understand their diagnostic and prognostic utility. In this regard, our data provide region-specific evidence from an underrepresented Middle Eastern/Kurdish population, in which dietary practices, environmental exposures, and population genetics may differ from the Western cohorts that dominate the literature. Such factors may modulate baseline miRNA expression and could partly explain quantitative differences in expression levels observed across studies. By documenting miR-155-5p and miR-221-3p overexpression in this local cohort, the present work adds geographic diversity to existing miRNA datasets and supports the need to include regional populations in biomarker validation studies.
Our findings revealed that miR-155-5p expression was significantly associated with histological grade, tumor location, and TNM stage in CRC, consistent with previous studies linking miR-155 to tumor aggressiveness and poor prognosis [32]. Additionally, miR-155 enhances chemoresistance in CRC by targeting FOXO3a and PI3K/AKT signaling pathways [33,34]. In contrast, miR-221-3p showed no significant clinicopathological associations in CRC, suggesting a broader oncogenic role that is less dependent on tumor stage. In PTC, both miRNAs were frequently overexpressed, but only miR-155-5p showed a trend towards association with TNM stage, aligning with reports linking miR-155 to PTC progression [35]. Although some associations, such as the trend between miR-155-5p expression and TNM stage in PTC (p = 0.02), reached nominal statistical significance, these findings should be interpreted cautiously. The small sample size and lack of correction for multiple comparisons limit the strength of statistical inference. Moreover, statistical significance does not necessarily imply clinical relevance; therefore, these correlations should be viewed as exploratory observations that warrant validation in larger, prospectively designed cohorts.
Despite the high expression levels in both cancers, no significant differences in miRNA expression were observed between CRC and PTC, indicating that these miRNAs may act as general oncogenic drivers across multiple tumor types rather than being exclusive to one. Their regulatory roles may involve shared oncogenic pathways, such as TGF-β signaling and NF-κB activation [36,37,38]. Interestingly, the lack of significant correlation between miR-155-5p and miR-221-3p expression in CRC and PTC suggests independent regulation despite overlapping downstream effects
Circulating miRNAs, including miR-155-5p and miR-221-3p, have shown promise as non-invasive biomarkers, given their stability in serum and plasma and their potential to distinguish cancer patients from healthy individuals [16,23]. This study is particularly significant given the limited data on miRNA expression from Middle Eastern populations. Genetic, dietary, and environmental factors can modulate miRNA expression, highlighting the importance of population-specific investigations for biomarker validation and therapeutic development.
We categorized miRNA expression levels into high, normal, and low groups to facilitate clinical interpretation, consistent with cancer biomarker studies [39]. Recognizing the need for rigorous statistical testing, we applied the non-parametric Mann–Whitney U test to compare relative expression ratios (RRs) of miR-155-5p and miR-221-3p between CRC and PTC samples. The test revealed no significant differences (p = 0.972 for miR-155-5p; p = 0.944 for miR-221-3p), reinforcing the consistency of these miRNAs across both cancer types. Box plots illustrating these distributions are provided to enhance data transparency.
In summary, this study provides important insights into miR-155-5p and miR-221-3p expression in CRC and PTC within a Middle Eastern cohort. Our findings emphasize the importance of regional research to identify population-specific biomarkers and improve personalized treatment strategies
However, certain limitations should be acknowledged. The retrospective design and limited sample size restrict the generalizability of the findings. In addition, KRAS and NRAS mutational data were not available for this cohort, which limited our ability to explore potential interactions between common oncogenic drivers and miRNA dysregulation in CRC. The lack of functional assays also prevents confirmation of the mechanistic roles of these miRNAs in cancer progression. Future studies should include in vitro and in vivo functional assays (e.g., knockdown or overexpression models), incorporate mutational profiling (KRAS/NRAS/BRAF) or NGS panels, and add longitudinal clinical follow-up data to better establish prognostic significance. Another limitation of this study is the absence of survival data, which prevented Kaplan–Meier analysis of prognostic outcomes. Future prospective studies incorporating patient follow-up will help determine whether miR-155-5p and miR-221-3p expression levels are associated with overall or disease-free survival. Additionally, the tumor cellularity correction applied in this study represents a pilot normalization approach rather than a validated method, and future studies should test its reproducibility across larger cohorts.
5. Conclusions
Our results confirm the frequent overexpression of miR-155-5p and miR-221-3p in both CRC and PTC. miR-155-5p, in particular, shows promise as a marker of aggressive disease in CRC. These findings warrant further investigation to explore their potential as diagnostic, prognostic, and therapeutic targets in cancer management.
Supplementary Materials
The following supporting information can be downloaded at https://www.mdpi.com/article/10.3390/jmp6040033/s1, Table S1: Raw expression dataset showing individual ΔCt values (relative expression ratios) of miR-155-5p and miR-221-3p for all papillary thyroid carcinoma (PTC, n = 50) and colorectal cancer (CRC, n = 60) samples. The table includes sample IDs and corresponding expression values extracted from RT-qPCR analysis.
Funding
This research received no specific grant from any funding agency in the public, commercial, or not-for-profit sectors.
Institutional Review Board Statement
This study was reviewed and approved by the Ethical Committee of Komar University of Science and Technology, Sulaymaniyah, Iraq (Code: KUST-SP25-05-03-DEN, Date: 3 May 2025).
Informed Consent Statement
Not applicable. The study used archived formalin-fixed paraffin-embedded (FFPE) tissue samples with no direct patient involvement. This study does not include any individual person’s data in any form (including images, videos, or case details).
Data Availability Statement
The original contributions presented in this study are included in the article/supplementary material. Further inquiries can be directed to the corresponding author(s).
Acknowledgments
The author would like to thank Narmeen Ahmad for her valuable support during this study.
Conflicts of Interest
The author declares no conflicts of interest related to this study.
References
- Bartel, D.P. MicroRNAs: Target recognition and regulatory functions. Cell 2009, 136, 215–233. [Google Scholar] [CrossRef]
- He, L.; Hannon, G.J. MicroRNAs: Small RNAs with a big role in gene regulation. Nat. Rev. Genet. 2004, 5, 522–531. [Google Scholar] [CrossRef]
- Di Leva, G.; Garofalo, M.; Croce, C.M. MicroRNAs in cancer. Annu. Rev. Pathol. Mech. Dis. 2014, 9, 287–314. [Google Scholar] [CrossRef] [PubMed]
- Calin, G.A.; Croce, C.M. MicroRNA signatures in human cancers. Nat. Rev. Cancer 2006, 6, 857–866. [Google Scholar] [CrossRef]
- Otmani, K.; Lewalle, P. Tumor suppressor miRNA in cancer cells and the tumor microenvironment: Mechanism of deregulation and clinical implications. Front. Oncol. 2021, 11, 708765. [Google Scholar] [CrossRef] [PubMed]
- Orosz, E.; Kiss, I.; Gyöngyi, Z.; Varjas, T. Expression of circulating miR-155, miR-21, miR-221, miR-30a, miR-34a and miR-29a: Comparison of colonic and rectal cancer. In Vivo 2018, 32, 1333–1337. [Google Scholar] [CrossRef]
- Darmadi, D.; Mohammadian-Hafshejani, A.; Kheiri, S. Global disparities in colorectal cancer: Unveiling the present landscape of incidence and mortality rates, analyzing geographical variances, and assessing the human development index. J. Prev. Med. Hyg. 2025, 65, E499–E514. [Google Scholar] [CrossRef] [PubMed]
- Song, Q.; An, Q.; Niu, B.; Lu, X.; Zhang, N.; Cao, X. Role of miR-221/222 in tumor development and the underlying mechanism. J. Oncol. 2019, 2019, 7252013. [Google Scholar] [CrossRef]
- Tao, K.; Yang, J.; Guo, Z.; Hu, Y.; Sheng, H.; Gao, H.; Yu, H. Prognostic value of miR-221-3p, miR-342-3p and miR-491-5p expression in colon cancer. Am. J. Transl. Res. 2014, 6, 391–401. [Google Scholar]
- Czochor, J.R.; Sulkowski, P.; Glazer, P.M. miR-155 overexpression promotes genomic instability by reducing high-fidelity polymerase delta expression and activating error-prone DSB repair. Mol. Cancer Res. 2016, 14, 363–373. [Google Scholar] [CrossRef]
- Moutabian, H.; Radi, U.K.; Saleman, A.Y.; Adil, M.; Zabibah, R.S.; Chaitanya, M.V.N.L.; Saadh, M.J.; Jawad, M.J.; Hazrati, E.; Bagheri, H.; et al. MicroRNA-155 and cancer metastasis: Regulation of invasion, migration, and epithelial-to-mesenchymal transition. Pathol. Res. Pract. 2023, 250, 154789. [Google Scholar] [CrossRef]
- Cabanillas, M.E.; McFadden, D.G.; Durante, C. Thyroid cancer. Lancet 2016, 388, 2783–2795. [Google Scholar] [CrossRef]
- Pallante, P.; Visone, R.; Ferracin, M.; Ferraro, A.; Berlingieri, M.T.; Troncone, G.; Chiappetta, G.; Liu, C.G.; Santoro, M.; Negrini, M.; et al. MicroRNA deregulation in human thyroid papillary carcinomas. Endocr. Relat. Cancer 2006, 13, 497–508. [Google Scholar] [CrossRef]
- Papaioannou, M.; Chorti, A.G.; Chatzikyriakidou, A.; Giannoulis, K.; Bakkar, S.; Papavramidis, T.S. MicroRNAs in papillary thyroid cancer: What is new in diagnosis and treatment. Front. Oncol. 2022, 11, 755097. [Google Scholar] [CrossRef]
- Braun, J.; Hoang-Vu, C.; Dralle, H.; Hüttelmaier, S. Downregulation of microRNAs directs the EMT and invasive potential of anaplastic thyroid carcinomas. Oncogene 2010, 29, 4237–4244. [Google Scholar] [CrossRef]
- Verrienti, A.; Pecce, V.; Grani, G.; Del Gatto, V.; Barp, S.; Maranghi, M.; Giacomelli, L.; Di Gioia, C.; Biffoni, M.; Filetti, S.; et al. Serum microRNA-146a-5p and microRNA-221-3p as potential clinical biomarkers for papillary thyroid carcinoma. J. Endocrinol. Investig. 2025, 48, 619–631. [Google Scholar] [CrossRef]
- Dogra, P.; Shinglot, V.; Ruiz-Ramírez, J.; Cave, J.; Butner, J.D.; Schiavone, C.; Duda, D.G.; Kaseb, A.O.; Chung, C.; Koay, E.J.; et al. Translational modeling-based evidence for enhanced efficacy of standard-of-care drugs in combination with anti-microRNA-155 in non-small-cell lung cancer. Mol. Cancer 2024, 23, 156. [Google Scholar] [CrossRef]
- De Martino, E.; Brunetti, D.; Canzonieri, V.; Conforti, C.; Eisendle, K.; Mazzoleni, G.; Nobile, C.; Rao, F.; Zschocke, J.; Jukic, E.; et al. The Association of Residential Altitude on the Molecular Profile and Survival of Melanoma: Results of an Interreg Study. Cancers 2020, 12, 2796. [Google Scholar] [CrossRef] [PubMed]
- Boufraqech, M.; Klubo-Gwiezdzinska, J.; Kebebew, E. MicroRNAs in the thyroid. Best. Pract. Res. Clin. Endocrinol. Metab. 2016, 30, 603–619. [Google Scholar] [CrossRef] [PubMed]
- Shirzad, S.; Eterafi, M.; Karimi, Z.; Barazesh, M. MicroRNAs involved in colorectal cancer: A rapid mini-systematic review. BMC Cancer 2025, 25, 934. [Google Scholar] [CrossRef] [PubMed]
- Zhang, X.; Li, M.; Zuo, K.; Li, D.; Ye, M.; Ding, L.; Cai, H.; Fu, D.; Fan, Y.; Lv, Z. Upregulated miR-155 in papillary thyroid carcinoma promotes tumor growth by targeting APC and activating Wnt/β-catenin signaling. J. Clin. Endocrinol. Metab. 2013, 98, E1305–E1313. [Google Scholar] [CrossRef]
- Qin, J.; Luo, M. MicroRNA-221 promotes colorectal cancer cell invasion and metastasis by targeting RECK. FEBS Lett. 2014, 588, 99–104. [Google Scholar] [CrossRef]
- Wei, Z.L.; Gao, A.B.; Wang, Q.; Lou, X.E.; Zhao, J.; Lu, Q.J. MicroRNA-221 promotes papillary thyroid carcinoma cell migration and invasion via targeting RECK and regulating epithelial–mesenchymal transition. OncoTargets Ther. 2019, 12, 2323–2333. [Google Scholar] [CrossRef]
- Dai, L.; Wang, Y.; Chen, L.; Zheng, J.; Li, J.; Wu, X. MiR-221, a potential prognostic biomarker for recurrence in papillary thyroid cancer. World J. Surg. Oncol. 2017, 15, 11. [Google Scholar] [CrossRef]
- Chretien, A.S.; Harlé, A.; Meyer-Lefebvre, M.; Rouyer, M.; Husson, M.; Ramacci, C.; Harter, V.; Genin, P.; Leroux, A.; Merlin, J.L. Optimization of routine KRAS mutation PCR-based testing procedure for rational individualized first-line targeted therapy selection in metastatic colorectal cancer. Cancer Med. 2013, 2, 11–20. [Google Scholar] [CrossRef]
- Ng, E.K.; Chong, W.W.; Jin, H.; Lam, E.K.; Shin, V.Y.; Yu, J.; Poon, T.C.; Ng, S.S.; Sung, J.J. Differential expression of microRNAs in plasma of patients with colorectal cancer: A potential marker for colorectal cancer screening. Gut 2009, 58, 1375–1381. [Google Scholar] [CrossRef] [PubMed]
- Díaz, R.; Silva, J.; García, J.M.; Lorenzo, Y.; García, V.; Peña, C.; Rodríguez, R.; Muñoz, C.; García, F.; Bonilla, F.; et al. Deregulated expression of miR-106a predicts survival in human colon cancer patients. Genes Chromosomes Cancer 2008, 47, 794–802. [Google Scholar] [CrossRef] [PubMed]
- Livak, K.J.; Schmittgen, T.D. Analysis of relative gene expression data using real-time quantitative PCR and the 2−ΔΔCT method. Methods 2001, 25, 402–408. [Google Scholar] [CrossRef] [PubMed]
- Xue, Q.; Sun, K.; Deng, H.J.; Lei, S.T.; Dong, J.Q.; Li, G.X. Anti-miRNA-221 sensitizes human colorectal carcinoma cells to radiation by upregulating PTEN. World J. Gastroenterol. 2013, 19, 9307–9317. [Google Scholar] [CrossRef]
- Leonardi, G.C.; Candido, S.; Carbone, M.; Colaianni, V.; Garozzo, S.F.; Cinà, D.; Libra, M. microRNAs and thyroid cancer: Biological and clinical significance (Review). Int. J. Mol. Med. 2012, 30, 991–999. [Google Scholar] [CrossRef]
- Panico, A.; Tumolo, M.R.; Leo, C.G.; Donno, A.; Grassi, T.; Bagordo, F.; Serio, F.; Idolo, A.; Masi, R.; Mincarone, P.; et al. The influence of lifestyle factors on miRNA expression and signal pathways: A review. Epigenomics 2021, 13, 145–164. [Google Scholar] [CrossRef] [PubMed]
- Qu, Y.L.; Wang, H.F.; Sun, Z.Q.; Tang, Y.; Han, X.N.; Yu, X.B.; Liu, K. Up-regulated miR-155-5p promotes cell proliferation, invasion and metastasis in colorectal carcinoma. Int. J. Clin. Exp. Pathol. 2015, 8, 6988–6994. [Google Scholar]
- Sun, L.; Liu, J.; Bao, D.; Hu, C.; Zhao, Y.; Chen, S. Progress in the study of FOXO3a interacting with microRNA to regulate tumourigenesis development. Front. Oncol. 2023, 13, 1293968. [Google Scholar] [CrossRef]
- Huang, X.; Shen, Y.; Liu, M.; Bi, C.; Jiang, C.; Iqbal, J.; McKeithan, T.W.; Chan, W.C.; Ding, S.J.; Fu, K. Quantitative proteomics reveals that miR-155 regulates the PI3K-AKT pathway in diffuse large B-cell lymphoma. Am. J. Pathol. 2012, 181, 26–33. [Google Scholar] [CrossRef]
- Mobini, G.R.; Yousefi, H.; Shojaeian, A.; Mirhoseini, M.; Mahmoudian-Sani, M.R. Association of serum miR-375, miR-155 and miR-146b levels with distinguish of papillary thyroid cancer from benign thyroid masses among Iranian patients. Egypt. J. Med. Hum. Genet. 2023, 24, 48. [Google Scholar] [CrossRef]
- Alivernini, S.; Gremese, E.; McSharry, C.; Tolusso, B.; Ferraccioli, G.; McInnes, I.B.; Kurowska-Stolarska, M. MicroRNA-155—At the critical interface of innate and adaptive immunity in arthritis. Front. Immunol. 2018, 8, 1932. [Google Scholar] [CrossRef]
- Pu, J.; Bai, D.; Yang, X.; Lu, X.; Xu, L.; Lu, J. Adrenaline promotes cell proliferation and increases chemoresistance in colon cancer HT29 cells through induction of miR-155. Biochem. Biophys. Res. Commun. 2012, 428, 210–215. [Google Scholar] [CrossRef]
- Tong, L.; Yuan, Y.; Wu, S. Therapeutic microRNAs targeting the NF-κB signaling circuits of cancers. Adv. Drug Deliv. Rev. 2015, 81, 1–15. [Google Scholar] [CrossRef] [PubMed]
- Larrabeiti-Etxebarria, A.; Bilbao-Aldaiturriaga, N.; Arzuaga-Mendez, J.; Martin-Arruti, M.; Cozzuto, L.; Gaafar, A.; Ruiz-Diaz, I.; Guerra, I.; Martin-Guerrero, I.; Lopez-Lopez, E.; et al. microRNA sequencing for biomarker detection in the diagnosis, classification and prognosis of diffuse large B cell lymphoma. Sci. Rep. 2023, 13, 12159. [Google Scholar] [CrossRef] [PubMed]


Disclaimer/Publisher’s Note: The statements, opinions and data contained in all publications are solely those of the individual author(s) and contributor(s) and not of MDPI and/or the editor(s). MDPI and/or the editor(s) disclaim responsibility for any injury to people or property resulting from any ideas, methods, instructions or products referred to in the content. |
© 2025 by the author. Licensee MDPI, Basel, Switzerland. This article is an open access article distributed under the terms and conditions of the Creative Commons Attribution (CC BY) license (https://creativecommons.org/licenses/by/4.0/).